
Accuracy of Hidden Markov Models in Identifying Alterations in Movement Patterns during Biceps-Curl Weight-Lifting Exercise
 ,
,  ,
,  , , ,
, , ,  and
and 
Abstract
:1. Introduction
2. Methods
2.1. Participants
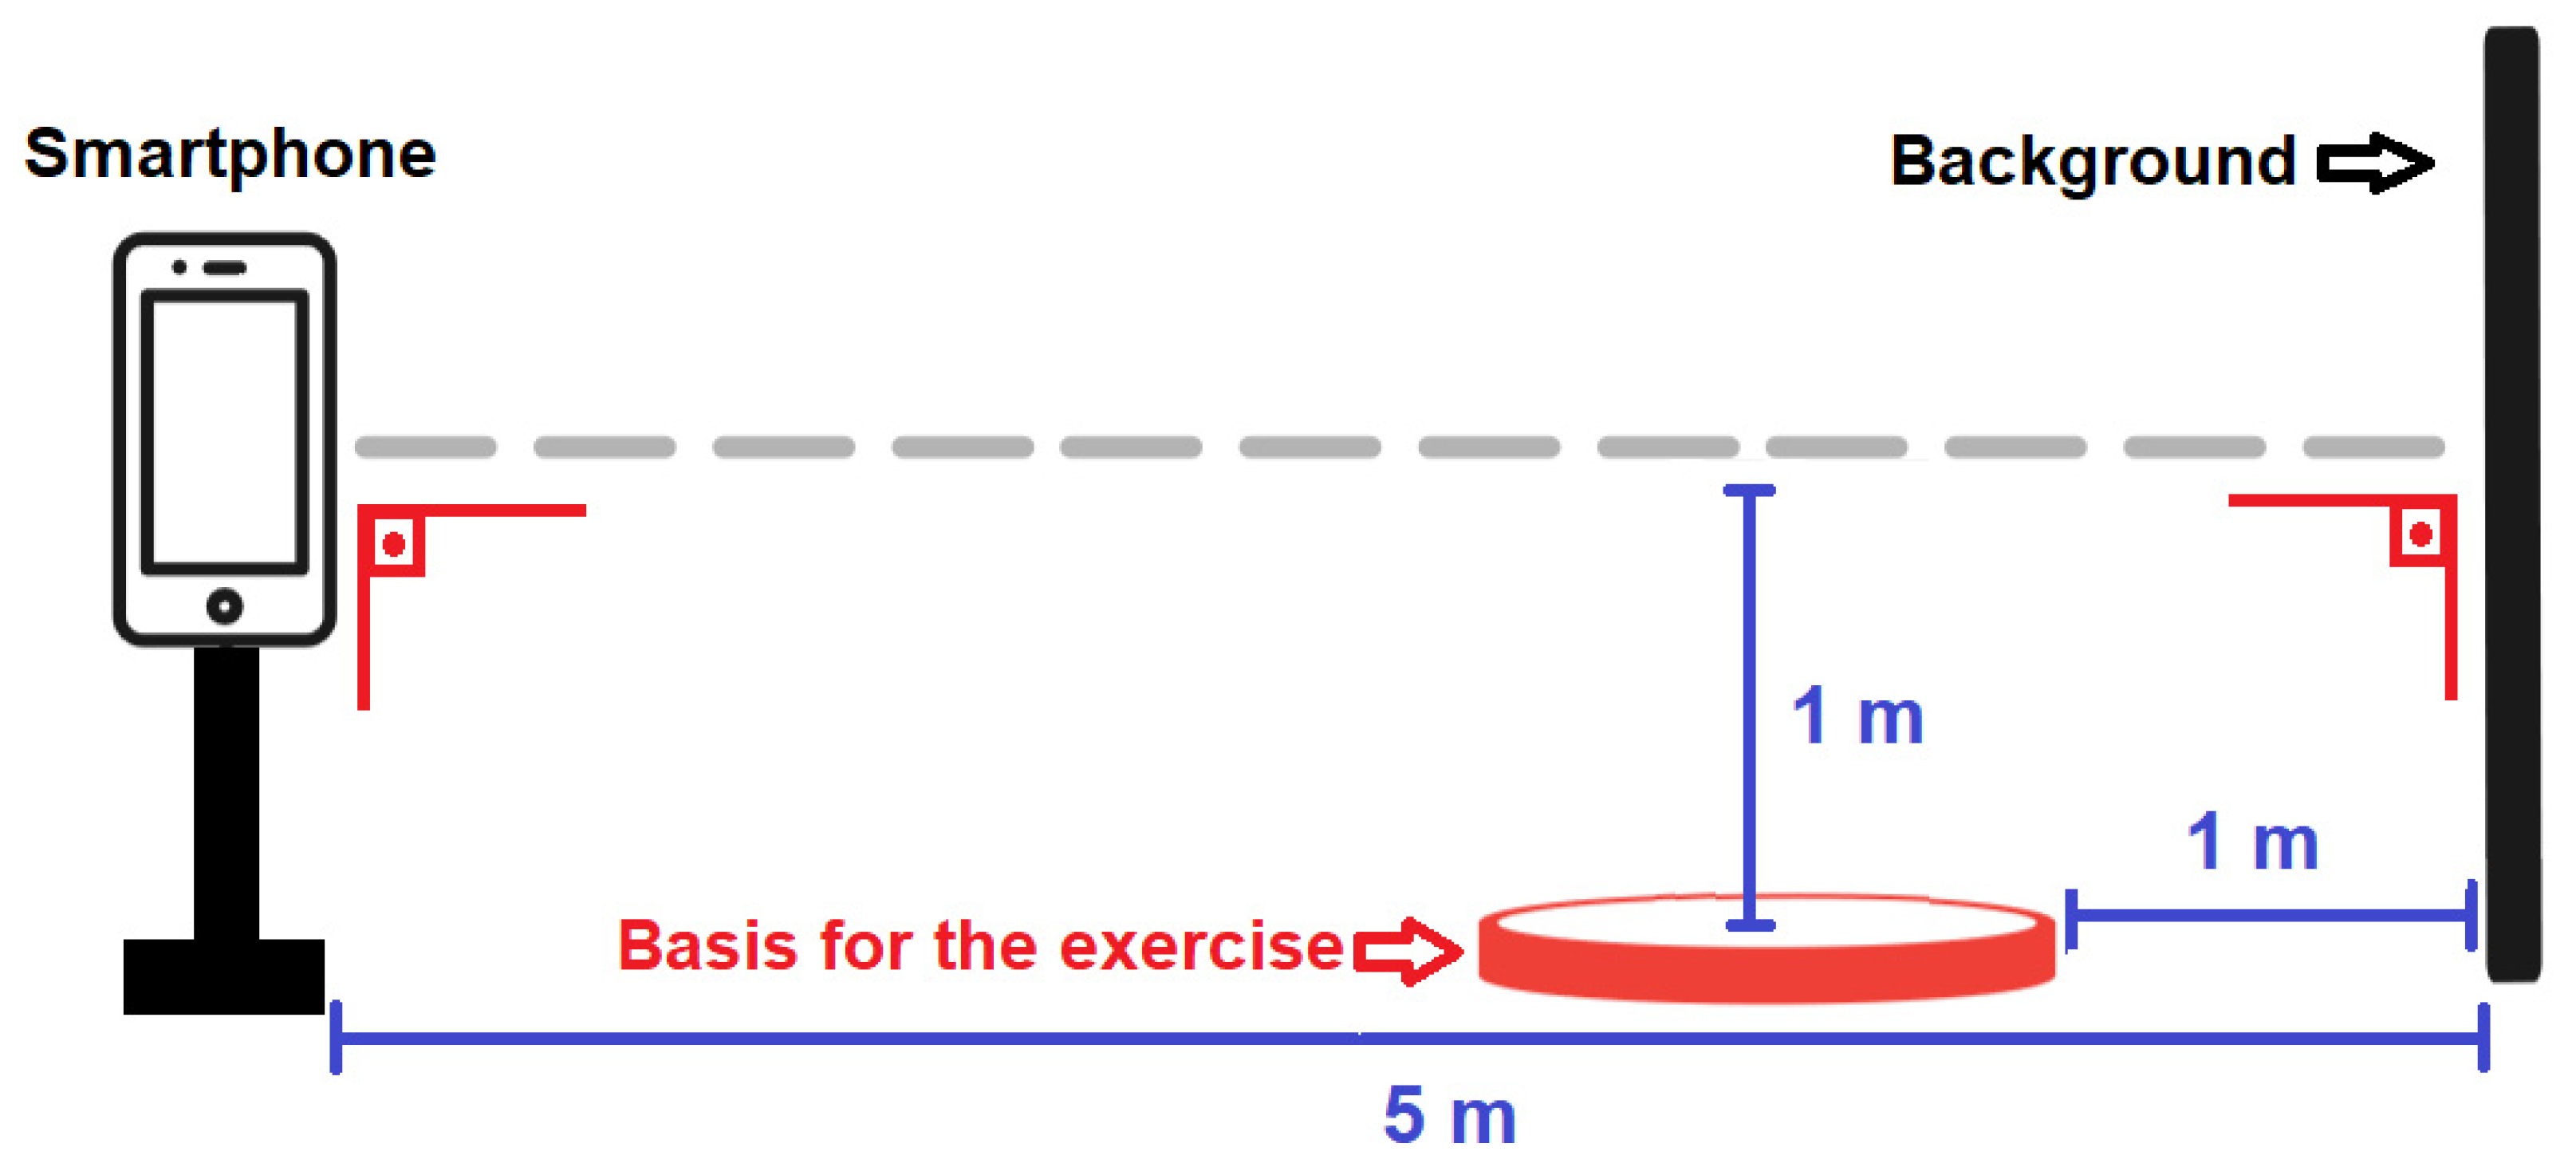
2.2. Procedures
2.3. Displacement and Vertical Distance Measurements
2.4. Statistical Analysis
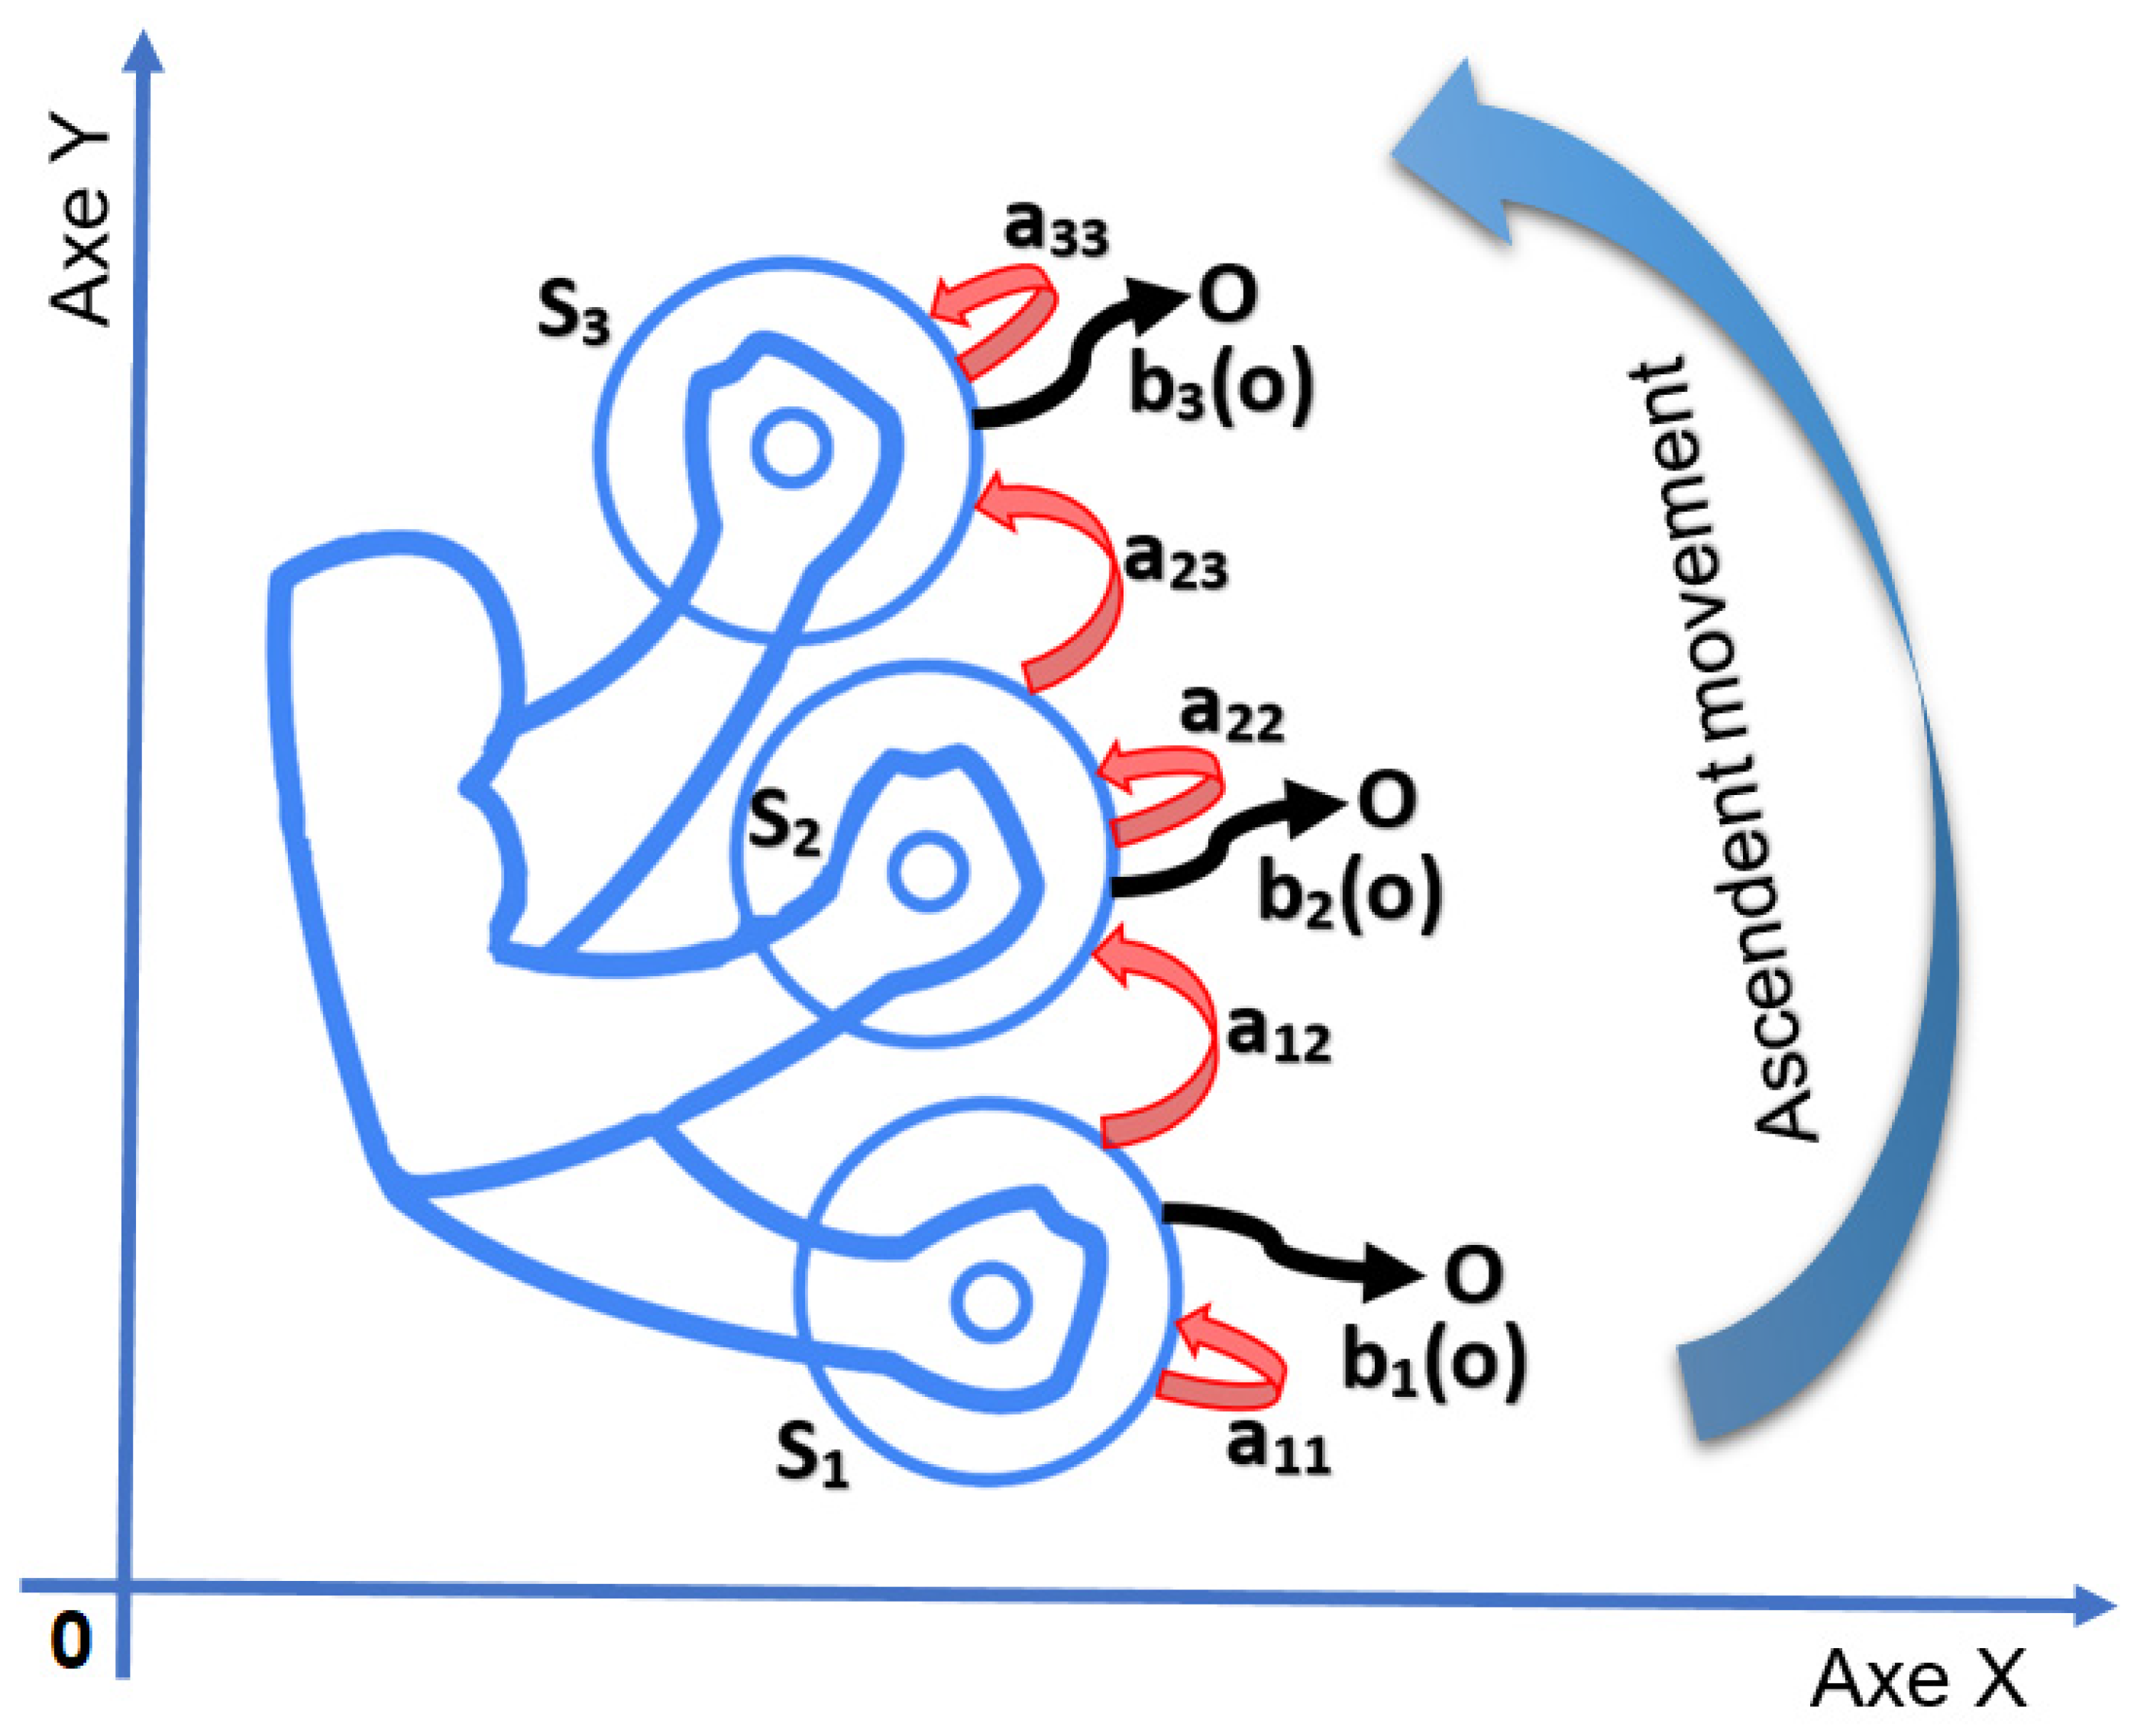
2.5. HMM Modeling
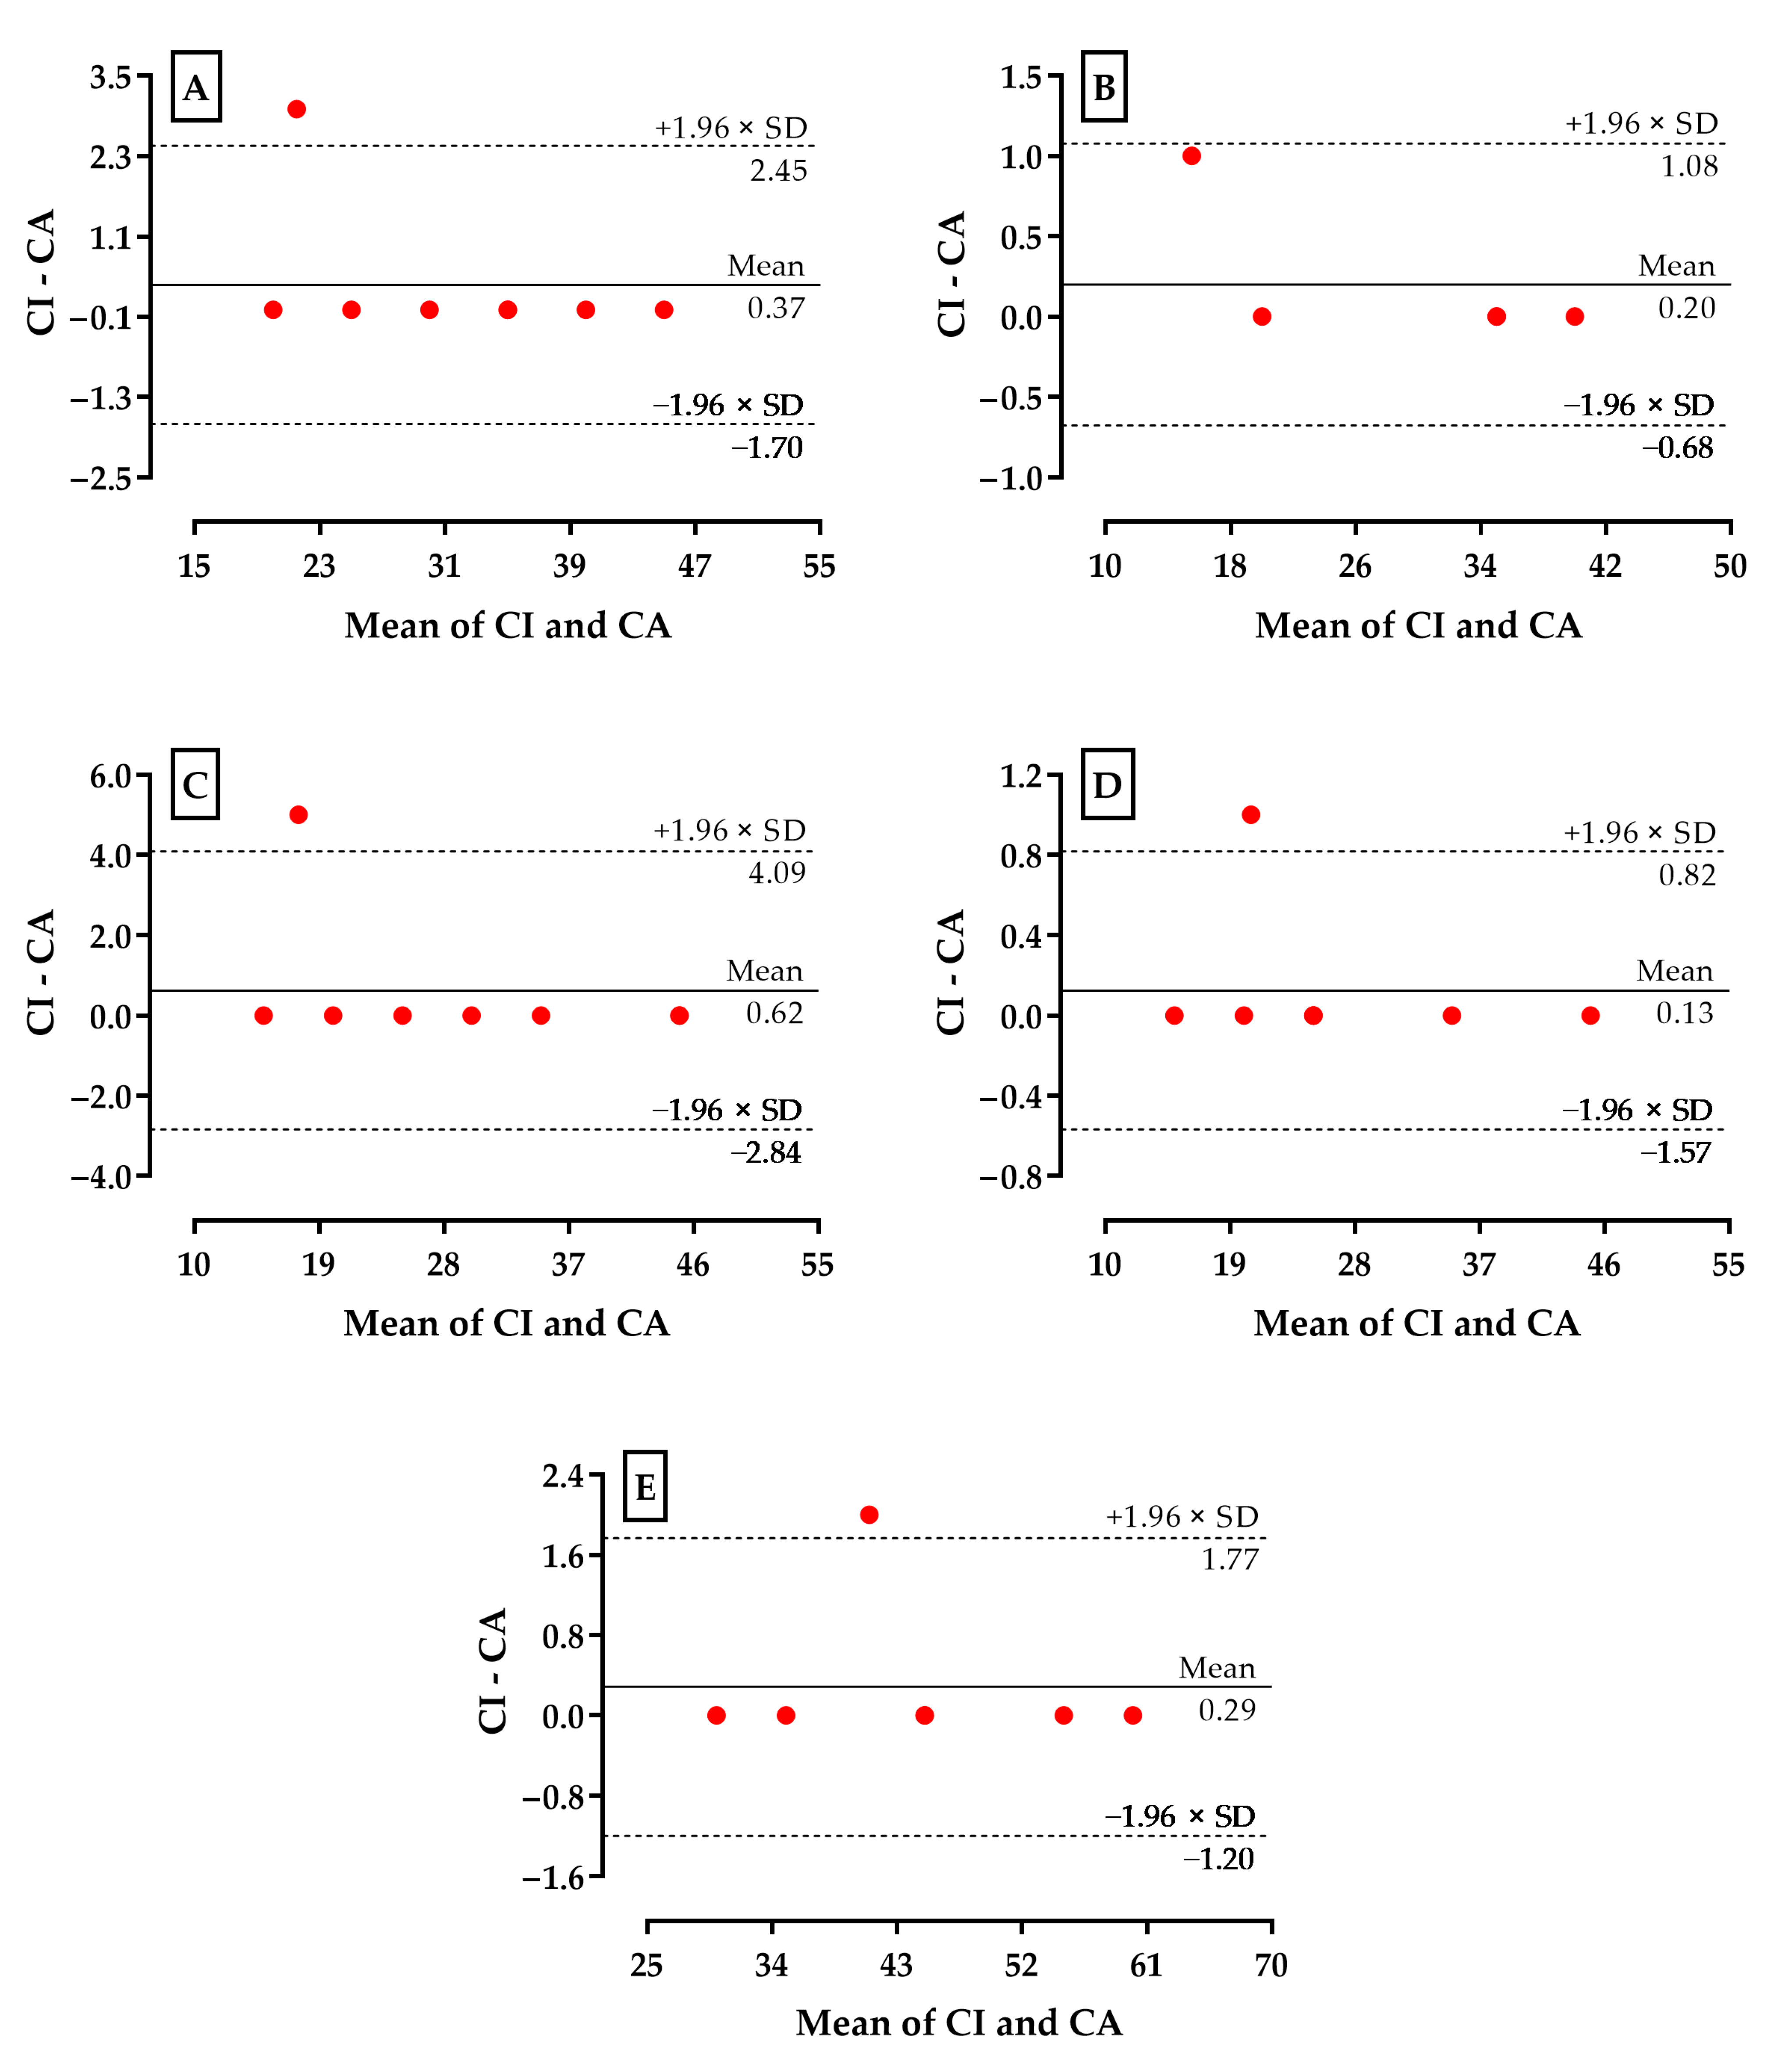
3. Results
4. Discussion
5. Conclusions
Author Contributions
Funding
Institutional Review Board Statement
Informed Consent Statement
Data Availability Statement
Acknowledgments
Conflicts of Interest
References
- Faigenbaum, A.D.; Myer, G.D. Resistance Training Among Young Athletes: Safety, Efficacy and Injury Prevention Effects. Br. J. Sports Med. 2010, 44, 56–63. [Google Scholar] [CrossRef] [PubMed] [Green Version]
- Gentil, P.; Bottaro, M. Influence of Supervision Ratio on Muscle Adaptations to Resistance Training in Nontrained Subjects. J. Strength Cond. Res. 2010, 24, 639–643. [Google Scholar] [CrossRef] [PubMed] [Green Version]
- Kemler, E.; Noteboom, L.; van Beijsterveldt, A.M. Characteristics of Fitness-Related Injuries in The Netherlands: A Descriptive Epidemiological Study. Sports 2022, 10, 187. [Google Scholar] [CrossRef] [PubMed]
- Bonilla, D.A.; Cardozo, L.A.; Vélez-Gutiérrez, J.M.; Arévalo-Rodríguez, A.; Vargas-Molina, S.; Stout, J.R.; Kreider, R.B.; Petro, J.L. Exercise Selection and Common Injuries in Fitness Centers: A Systematic Integrative Review and Practical Recommendations. Int. J. Environ. Res. Public Health 2022, 19, 12710. [Google Scholar] [CrossRef] [PubMed]
- Knudson, D.V.; Morrison, G.S. Qualitative Analysis of Human Movement; Human Kinetics: Champaign, IL, USA, 2002. [Google Scholar]
- McKean, M.R.; Dunn, P.K.; Burkett, B.J. Quantifying the Movement and the Influence of Load in the Back Squat Exercise. J. Strength Cond. Res. 2010, 24, 1671–1679. [Google Scholar] [CrossRef] [PubMed]
- Sugiura, K.; Iwahashi, N.; Kashioka, H. Motion Generation by Reference-point-dependent Trajectory HMMs. In Proceedings of the IEEE/RSJ International Conference on Intelligent Robots and Systems, San Francisco, CA, USA, 25–30 September 2011. [Google Scholar] [CrossRef]
- Psarrou, A.; Gong, S.; Walter, M. Recognition of Human Gestures and Behaviour Based on Motion Trajectories. Image Vis. Comput. 2002, 20, 349–358. [Google Scholar] [CrossRef]
- Nagaya, S.; Seki, S.; Oka, R. A Theoretical Consideration of Pattern Space Trajectory for Gesture Spotting Recognition. In Proceedings of the Second International Conference on Automatic Face and Gesture Recognition, Killington, VT, USA, 14–16 October 1996. [Google Scholar] [CrossRef]
- Winter, D.A. Foot Trajectory in Human Gait: A Precise and Multifactorial Motor Control Task. Phys. Ther. 1992, 72, 45–53; discussion 54–56. [Google Scholar] [CrossRef]
- Yang, M.H.; Ahuja, N.; Tabb, M. Extraction of 2D Motion Trajectories and its Application to Hand Gesture Recognition. IEEE Trans. Pattern Anal. Mach. Intell. 2002, 24, 1061–1074. [Google Scholar] [CrossRef]
- Suzuki, N.; Hirasawa, K.; Tanaka, K.; Kobayashi, Y.; Sato, Y.; Fujino, Y. Learning Motion Patterns and Anomaly Detection by Human Trajectory Analysis. In Proceedings of the IEEE International Conference on Systems, Man and Cybernetics, Montreal, QC, Canada, 7–10 October 2007. [Google Scholar] [CrossRef]
- Ghosh, S.; Ghosh, S.K. THUMP: Semantic Analysis on Trajectory Traces to Explore Human Movement Pattern. In Proceedings of the 25th International Conference Companion on World Wide Web, Montreal, QC, Canada, 11–15 April 2016. [Google Scholar] [CrossRef]
- Calin, A.D.; Pop, H.F.; Boian, R.F. Improving Movement Analysis in Physical Therapy Systems Based on Kinect Interaction. In Proceedings of the 31st International BCS Human Computer Interaction Conference, Sunderland, UK, 3–6 July 2017. [Google Scholar] [CrossRef]
- Balsalobre-Fernández, C.; Glaister, M.; Lockey, R.A. The Validity and Reliability of an iPhone app for Measuring Vertical Jump Performance. J. Sports Sci. 2015, 33, 1574–1579. [Google Scholar] [CrossRef]
- Crema, C.; Depari, A.; Flammini, A.; Sisinni, E.; Haslwanter, T.; Salzmann, S. Characterization of a Wearable System for Automatic Supervision of Fitness Exercises. Measurement 2019, 147, 106810. [Google Scholar] [CrossRef]
- Juang, B.H.; Rabiner, L.R. Hidden Markov Models for Speech Recognition. Technometrics 1991, 33, 251–272. [Google Scholar] [CrossRef]
- Rabiner, L.R. A Tutorial on Hidden Markov Models and Selected Applications in Speech Recognition. Proc. IEEE 1989, 77, 257–286. [Google Scholar] [CrossRef] [Green Version]
- Hong, K.; Lin, G. State Classification of Transformers using Nonlinear Dynamic Analysis and Hidden Markov models. Measurement 2019, 147, 106851. [Google Scholar] [CrossRef]
- Baechle, T.R.; Earle, R.W. Essentials of Strength Training and Conditioning, 3rd ed.; Human Kinetics: Champaign, IL, USA, 2008. [Google Scholar]
- Vanderburgh, P.M.; Mahar, M.T.; Chou, C.H. Allometric Scaling of Grip Strength by Body Mass in College-age Men and Women. Res. Q. Exerc. Sport 1995, 66, 80–84. [Google Scholar] [CrossRef] [PubMed]
- Mota, Y.L.; Mochizuki, L.; Carvalho, G.A. Influência da Resolução e da Distância da Câmera nas Medidas Feitas pelo Software de Avaliação Postural (sapo). Rev. Bras. Med. Esporte 2011, 17, 334–338. [Google Scholar] [CrossRef]
- Ahmad, M.; Lee, S.W. Human Action Recognition using Multiview Image Sequences. In Proceedings of the International Conference on Pattern Recognition, Las Vegas, NV, USA, 26–29 June 2006. [Google Scholar] [CrossRef]
- Chen, H.-S.; Tsai, W.-J. A Framework for Video Event Classification by Modeling Temporal Context of Multimodal Features using HMM. J. Vis. Commun. 2014, 25, 285–295. [Google Scholar] [CrossRef]
- Raheja, J.L.; Minhas, M.; Prashanth, D.; Shah, T.; Chaudhry, A. Robust Gesture Recognition using Kinect: A Comparison between DTW and HMM. Opt. – Int. J. Light Electron. Opt. 2015, 126, 1098–1104. [Google Scholar] [CrossRef]
- Shin, J.; Lee, J.; Kim, D. Real-time Lip Reading System for Isolated Korean Word Recognition. Pattern Recognit. 2011, 44, 559–571. [Google Scholar] [CrossRef]
- Tran, C.; Doshi, A.; Trivedi, M.M. Modeling and Prediction of Driver Behavior by Foot Gesture Analysis. Comput. Vis. Image Underst. 2012, 116, 435–445. [Google Scholar] [CrossRef]
- Yamato, J.; Ohya, J.; Ishii, K. Recognizing Human Action in Time-sequential Images using Hidden Markov model. In Proceedings of the IEEE Computer Society Conference on Computer Vision and Pattern Recognition, Champaign, IL, USA, 15–18 June 1992; pp. 379–385. [Google Scholar] [CrossRef]
- Yang, T.H.; Wu, C.H.; Huang, K.Y. Coupled HMM-based Multimodal Fusion for Mood Disorder Detection Through Elicited Audio-visual Signals. J. Ambient. Intell. Hum. Comput. 2017, 8, 895–906. [Google Scholar] [CrossRef]
- Zimmermann, M.; Ghazi, M.M.; Ekenel, H.K.; Thiran, J.-P. Visual Speech Recognition Using PCA Networks and LSTMs in a Tandem GMM-HMM System. In Lecture Notes in Computer Science; Including Subseries Lecture Notes in Artificial Intelligence and Lecture Notes in Bioinformatics; Springer: Cham, Switzerland, 2017; pp. 264–276. [Google Scholar] [CrossRef] [Green Version]
- Wondershare Filmora. Available online: https://filmora.wondershare.com/pt-br/ (accessed on 15 March 2022).
- Van Den Bergh, F.; Lalioti, V. Software chroma keying in an immersive virtual environment: Research article. S. Afr. Comput. J. 1999, 24, 155–162. [Google Scholar]
- Matlani, P.; Shrivastava, M. Hybrid Deep VGG-net Convolutional Classifier for Video Smoke Detection. Comput. Model. Eng. Sci. 2019, 119, 427–458. [Google Scholar] [CrossRef] [Green Version]
- Kinovea. Available online: https://www.kinovea.org/ (accessed on 20 May 2022).
- Volkwyn, T.S.; Gregorcic, B.; Airey, J.; Linder, C. Learning to use Cartesian coordinate systems to solve physics problems: The case of ‘movability’. Eur. J. Phys. 2020, 41, 045701. [Google Scholar] [CrossRef]
- Oliveira, L.F.; Matta, T.T.; Alves, D.S.; Garcia, M.A.; Vieira, T.M. Effect of the shoulder position on the biceps brachii EMG in different dumbbell curls. J. Sports Sci. Med. 2009, 8, 24. [Google Scholar] [PubMed]
- Signorile, J.F.; Rendos, N.K.; Vargas, H.H.H.; Alipio, T.C.; Regis, R.C.; Eltoukhy, M.M.; Nargund, R.; Romero, M.A. Differences in muscle activation and kinematics between cable-based and selectorized weight training. J. Strength Cond. Res. 2017, 31, 313–322. [Google Scholar] [CrossRef] [PubMed]
- Faul, F.; Erdfelder, E.; Lang, A.-G.; Buchner, A. G*Power 3: A flexible statistical power analysis program for the social, behavioral, and biomedical sciences. Behav. Res. Methods 2007, 39, 175–191. [Google Scholar] [CrossRef] [PubMed]
- Fritz, C.O.; Morris, P.E.; Richler, J.J. Effect size estimates: Current use, calculations, and interpretation. J. Exp. Psychol. Genet. 2012, 141, 2–18. [Google Scholar] [CrossRef] [Green Version]
- Wang, S.; Chen, J.; Wang, H.; Zhang, D. Degradation Evaluation of Slewing Bearing using HMM and Improved GRU. Measurement 2019, 146, 385–396. [Google Scholar] [CrossRef]
- Chen, C.-N.; Liu, T.-K.; Chen, Y.J. Human-Machine Interaction: Adapted Safety Assistance in Mentality Using Hidden Markov Chain and Petri Net. Appl. Sci. 2019, 9, 5066. [Google Scholar] [CrossRef] [Green Version]
- Ghahramani, Z. Zoubin Ghahramani Software. 2019. Available online: http://mlg.eng.cam.ac.uk/zoubin/software.html (accessed on 20 May 2022).
- González, M.R. Advanced Techniques for Human Activity Classification; Universidad de Oviedo: Oviedo, Spain, 2012; Available online: http://digibuo.uniovi.es/dspace/handle/10651/5399 (accessed on 12 May 2022).
- Herta, C. K-Mean Cluster Algorithm. Available online: http://www.christianherta.de/kmeans.php (accessed on 15 May 2022).
- Mathworks. Hidden Markov Models (HMM)—MATLAB & Simulink. 2022. Available online: https://www.mathworks.com/help/stats/hidden-markov-models-hmm.html (accessed on 24 May 2022).
- Gnu Octave. 2022. Available online: https://www.gnu.org/software/octave/ (accessed on 27 May 2022).
- Fujii, K.; Gras, G.; Salerno, A.; Yang, G.Z. Gaze Gesture Based Human Robot Interaction for Laparoscopic Surgery. Med. Image Anal. 2018, 44, 196–214. [Google Scholar] [CrossRef]
- Kim, I.-C.; Chien, S.I. Analysis of 3D Hand Trajectory Gestures Using Stroke-based Composite Hidden Markov Models. Appl. Intell. 2001, 15, 131–143. [Google Scholar] [CrossRef]
- Urgo, M.; Tarabini, M.; Tolio, T. A Human Modelling and Monitoring Approach to Support the Execution of Manufacturing Operations. CIRP Ann. 2019, 68, 5–8. [Google Scholar] [CrossRef]
- Yamada, K.; Matsuura, K.; Hamagami, K.; Inui, H. Motor Skill Development using Motion Recognition Based on an HMM. Procedia Comput. Sci. 2013, 22, 1112–1120. [Google Scholar] [CrossRef]
- Fink, G.A. Markov Models for Pattern Recognition; Springer: Berlin/Heidelberg, Germany, 2008. [Google Scholar] [CrossRef]
- Andersson, M.; Gustafsson, F.; St-Laurent, L.; Prevost, D. Recognition of Anomalous Motion Patterns in Urban Surveillance. IEEE J. Sel. Top. Signal Process. 2013, 7, 102–110. [Google Scholar] [CrossRef] [Green Version]
- Attal, F.; Mohammed, S.; Dedabrishvili, M.; Chamroukhi, F.; Oukhellou, L.; Amirat, Y. Physical Human Activity Recognition Using Wearable Sensors. Sensors 2015, 15, 31314–31338. [Google Scholar] [CrossRef] [PubMed] [Green Version]
- Cointault, F.; Gouton, P. Texture or Color Analysis in Agronomic Images for Wheat Ear Counting. In Proceedings of the Third International IEEE Conference on Signal-Image Technologies and Internet-Based System, Shanghai, China, 16–18 December 2007; pp. 696–701. [Google Scholar] [CrossRef]
- Gusmão, G.; Machado, S.C.; Rodrigues, M.A. A New Algorithm for Segmenting and Counting Aedes Aegypti Eggs in Ovitraps. In Proceedings of the Annual International Conference of the IEEE Engineering in Medicine and Biology Society, Minneapolis, MN, USA, 3–6 September 2009; pp. 6714–6717. [Google Scholar] [CrossRef]
- Kothari, S.; Chaudry, Q.; Wang, M.D. Automated Cell Counting and Cluster Segmentation using Concavity Detection and Ellipse Fitting Techniques. In Proceedings of the IEEE International Symposium on Biomedical Imaging: From Nano to Macro, Boston, MA, USA, 8 June–1 July 2009; pp. 795–798. [Google Scholar] [CrossRef] [Green Version]
- Ong, W.H.; Koseki, T.; Palafox, L. An Unsupervised Approach for Human Activity Detection and Recognition. Int. J. Simul. Syst. Sci. Technol. 2013, 14, 42–49. [Google Scholar] [CrossRef]
- Lin, J.F.-S.; Kulic, D. Automatic Human Motion Segmentation and Identification using Feature Guided HMM for Physical Rehabilitation Exercises. In Proceedings of the Workshop on Robotics for Neurology and Rehabilitation, IEEE International Conference on Intelligent Robots and Systems, San Francisco, CA, USA, 25–30 September 2011. [Google Scholar]
- Bland, J.M.; Altman, D.G. Measuring Agreement in Method Comparison Studies. Stat. Methods Med. Res. 1999, 8, 135–160. [Google Scholar] [CrossRef]
- Giavarina, D. Understanding Bland Altman Analysis. Biochem. Med. (Zagreb) 2015, 25, 141–151. [Google Scholar] [CrossRef] [Green Version]
- Singla, A.; Roy, P.P.; Dogra, D.P. Visual Rendering of Shapes on 2D Display Devices Duided by Hand Gestures. Displays 2019, 57, 18–33. [Google Scholar] [CrossRef]
- Riccardi, G.; Hakkani-Tur, D. Active and Unsupervised Learning for Automatic Speech Recognition. In Proceedings of the 8th European Conference on Speech Communication and Technology, EUROSPEECH, Geneva, Switzerland, 1–4 September 2003; pp. 1–4. [Google Scholar] [CrossRef]
- Wang, Y.; Chen, M.; Wang, X.; Chan, R.H.M.; Li, W.J. IoT for Next-Generation Racket Sports Training. IEEE Internet Things J. 2018, 5, 4558–4566. [Google Scholar] [CrossRef]
- Mekruksavanich, S.; Jitpattanakul, A. Smartwatch-based Human Activity Recognition Using Hybrid LSTM Network. In Proceedings of the IEEE Sensors, Rotterdam, The Netherlands, 25–28 October 2020; pp. 1–4. [Google Scholar] [CrossRef]
- Ghorbani Faal, S.; Shirzad, E.; Sharifnezhad, A.; Ashrostaghi, M.; Naemi, R. A Novel Method for Field Measurement of Ankle Joint Stiffness in Hopping. Appl. Sci. 2021, 11, 12140. [Google Scholar] [CrossRef]
- Cui, C. Using Wireless Sensor Network to Correct Posture in Sports Training Based on Hidden Markov Matching Algorithm. J. Sens. 2021, 5, 1–11. [Google Scholar] [CrossRef]
- Nolte, K.; Krüger, P.E.; Els, P.S. Three dimensional musculoskeletal modelling of the seated biceps curl resistance training exercise. Sports Biomech. 2011, 10, 146–160. [Google Scholar] [CrossRef] [PubMed]
- Lv, F.; Nevatia, R. Recognition and Segmentation of 3-D Human Action Using HMM and Multi-class AdaBoost. In Proceedings of the Computer Vision—ECCV, 9th European Conference on Computer Vision, Graz, Austria, 7–13 May 2006. [Google Scholar] [CrossRef]


| Load | Shoulder | Elbow | Barbell |
|---|---|---|---|
| 0% | 1.7 ± 0.4 | 4.4 ± 1.7 | 56.8 ± 7.7 |
| 25% | 3.0 ± 1.3 | 6.4 ± 2.9 | 59.6 ± 8.5 |
| 50% | 7.9 ± 3.8 | 10.4 ± 4.0 | 64.0 ± 9.0 |
| Markers | Loads | Subjects | |||||||||||||||||||
|---|---|---|---|---|---|---|---|---|---|---|---|---|---|---|---|---|---|---|---|---|---|
| 01 | 02 | 03 | 04 | 05 | 06 | 07 | 08 | 09 | 10 | ||||||||||||
| Metric | Non-metric | Metric | Non-metric | Metric | Non-metric | Metric | Non-metric | Metric | Non-metric | Metric | Non-metric | Metric | Non-metric | Metric | Non-metric | Metric | Non-metric | Metric | Non-metric | ||
| Elbow | 0%–50% | 20 | 20 | … | … | 35 | 35 | 30 | 30 | 45 | 45 | 20 * | 23 * | … | … | 40 | 40 | 25 | 25 | 35 | 35 |
| 25%–50% | … | … | … | … | 35 | 35 | 15 * | 16 * | … | … | 20 | 20 | … | … | 35 | 35 | … | … | 40 | 40 | |
| Shoulder | 0%–50% | … | … | 15 | 15 | 15 * | 20 * | 45 | 45 | … | … | 35 | 35 | 25 | 25 | 45 | 45 | 20 | 20 | 30 | 30 |
| 25%–50% | … | … | 25 | 25 | 20 | 20 | 25 | 25 | … | … | 15 | 15 | 45 | 45 | 25 | 25 | 35 | 35 | 20 * | 21 * | |
| Barbell | 0%–50% | 30 | 30 | 45 | 45 | … | … | 60 | 60 | … | … | 35 | 35 | 45 | 45 | … | … | 55 | 55 | 40 * | 42 * |
Disclaimer/Publisher’s Note: The statements, opinions and data contained in all publications are solely those of the individual author(s) and contributor(s) and not of MDPI and/or the editor(s). MDPI and/or the editor(s) disclaim responsibility for any injury to people or property resulting from any ideas, methods, instructions or products referred to in the content. |
© 2022 by the authors. Licensee MDPI, Basel, Switzerland. This article is an open access article distributed under the terms and conditions of the Creative Commons Attribution (CC BY) license (https://creativecommons.org/licenses/by/4.0/).
Share and Cite
Peres, A.B.; Espada, M.C.; Santos, F.J.; Robalo, R.A.M.; Dias, A.A.P.; Muñoz-Jiménez, J.; Sancassani, A.; Massini, D.A.; Pessôa Filho, D.M. Accuracy of Hidden Markov Models in Identifying Alterations in Movement Patterns during Biceps-Curl Weight-Lifting Exercise. Appl. Sci. 2023, 13, 573. https://doi.org/10.3390/app13010573
Peres AB, Espada MC, Santos FJ, Robalo RAM, Dias AAP, Muñoz-Jiménez J, Sancassani A, Massini DA, Pessôa Filho DM. Accuracy of Hidden Markov Models in Identifying Alterations in Movement Patterns during Biceps-Curl Weight-Lifting Exercise. Applied Sciences. 2023; 13(1):573. https://doi.org/10.3390/app13010573
Chicago/Turabian StylePeres, André B., Mário C. Espada, Fernando J. Santos, Ricardo A. M. Robalo, Amândio A. P. Dias, Jesús Muñoz-Jiménez, Andrei Sancassani, Danilo A. Massini, and Dalton M. Pessôa Filho. 2023. "Accuracy of Hidden Markov Models in Identifying Alterations in Movement Patterns during Biceps-Curl Weight-Lifting Exercise" Applied Sciences 13, no. 1: 573. https://doi.org/10.3390/app13010573