1. Introduction
Nowadays, e-commerce is a regular and necessary element of everyday life. It enables instant payment for services and commodities. Nonetheless, for the vast majority of people, the process of transmitting money by air is a “black box.” This condition invites scammers who seek to benefit unlawfully [
1,
2]. Since fraudulent strategies evolve at a quick pace, it is vital to create an adaptive detection system to retain its effectiveness [
3,
4].
Ref. [
5] proposed a paradigm for integrating supervised and unsupervised algorithms for detecting credit card fraud. The model enables the discovery of new fraudulent activities and provides a comprehensive picture of the relationships between various variables. The model’s goal was to increase deduction accuracy. This paradigm, however, falls short in terms of local and global approaches. The integration of supervised and unsupervised data does not give the fine-grained resolution required to reap the benefits of unsupervised data. Ref. [
6] compares the performance of four data mining-based fraud detection algorithms (support vector machine, K-nearest neighbors, decision trees, and naive bayes). The models made use of a real-world anonymized data collection of transactions. The performance evaluation was based on four criteria: The true positive rate (TPR), the false positive rate (FPR), the balanced classification rate (BCR), and the Matthews Correlation Coefficient (MCC). The authors found that no data mining approach is universally superior to others, and that progress can only be accomplished by combining several techniques.
Ref. [
7] demonstrates a novel (APATE) approach for identifying fraudulent credit card transactions in internet stores. It has intrinsic features derived from spending history and incoming transactions using RFM (Recency-Frequency-Monetary) fundamentals, as well as network-based features derived from merchants’ and credit card holders’ networks, and then deriving a time-dependent suspiciousness score for each network object. According to the findings, intrinsic and network-based features are two sides of the same coin. Combining these two types of features results in models with AUC scores better than 0.98. Ref. [
8] demonstrates a CNN-based fraud detection algorithm for identifying the intrinsic patterns of fraud activity gleaned from labeled data. Common approaches to identify fraud features include neglecting different scenarios and having an unbalanced imbalance of positive and negative samples when using rule-based expert systems. Real-world large commercial bank transactions were employed. As a result, when compared to other recent techniques, the performance was outstanding [
9]. Facial expression recognition is proposed to track the applicant’s expressions throughout the interview [
10]. Virtual interviews could significantly reduce the amount of effort required of human resource employees.
Ref. [
11] analyses the detection accuracy and detection time of a neural network trained on examples of fraud due to lost cards, stolen cards, application fraud, counterfeit fraud, mail-order fraud, and NRI (non-received issue) fraud. When data normalization in artificial neural networks is employed, it has been demonstrated how the initial inquiry assists to minimize neural inputs by grouping attributes [
12]. It describes a strategy for decreasing false positives in bank anti-fraud systems that uses rule induction in distributed tree-based models to explicitly differentiate abnormalities rather than profiling usual areas [
13]. It makes extensive use of sub-sampling, resulting in an algorithm with linear time complexity, a low constant, and low memory demand. Ref. [
14] shows how artificial immune systems (AIS) may be used to detect credit card fraud. It was pitted against neural networks (NN), Bayesian networks (BN), Naive Bayes (NB), and decision trees (DT). It has been determined that AIS performs best with GA-optimized settings. Moreover, several algorithms have been introduced to fight against credit card fraud detection, but this challenge remains.
Figure 1 depicts the credit card fraud transaction process.
The following questions are addressed in this work: (1) Is a new incoming transaction consistent with normal customer behavior, i.e., does it correspond to that customer’s regular spending patterns in terms of (a) frequency or the average number of transactions over a given time, (b) recency or the average time between the current and previous transaction, and (c) monetary value or the amount spent on that transaction?
1.1. Research Contribution
The main contributions are summarized as follows:
- ▪
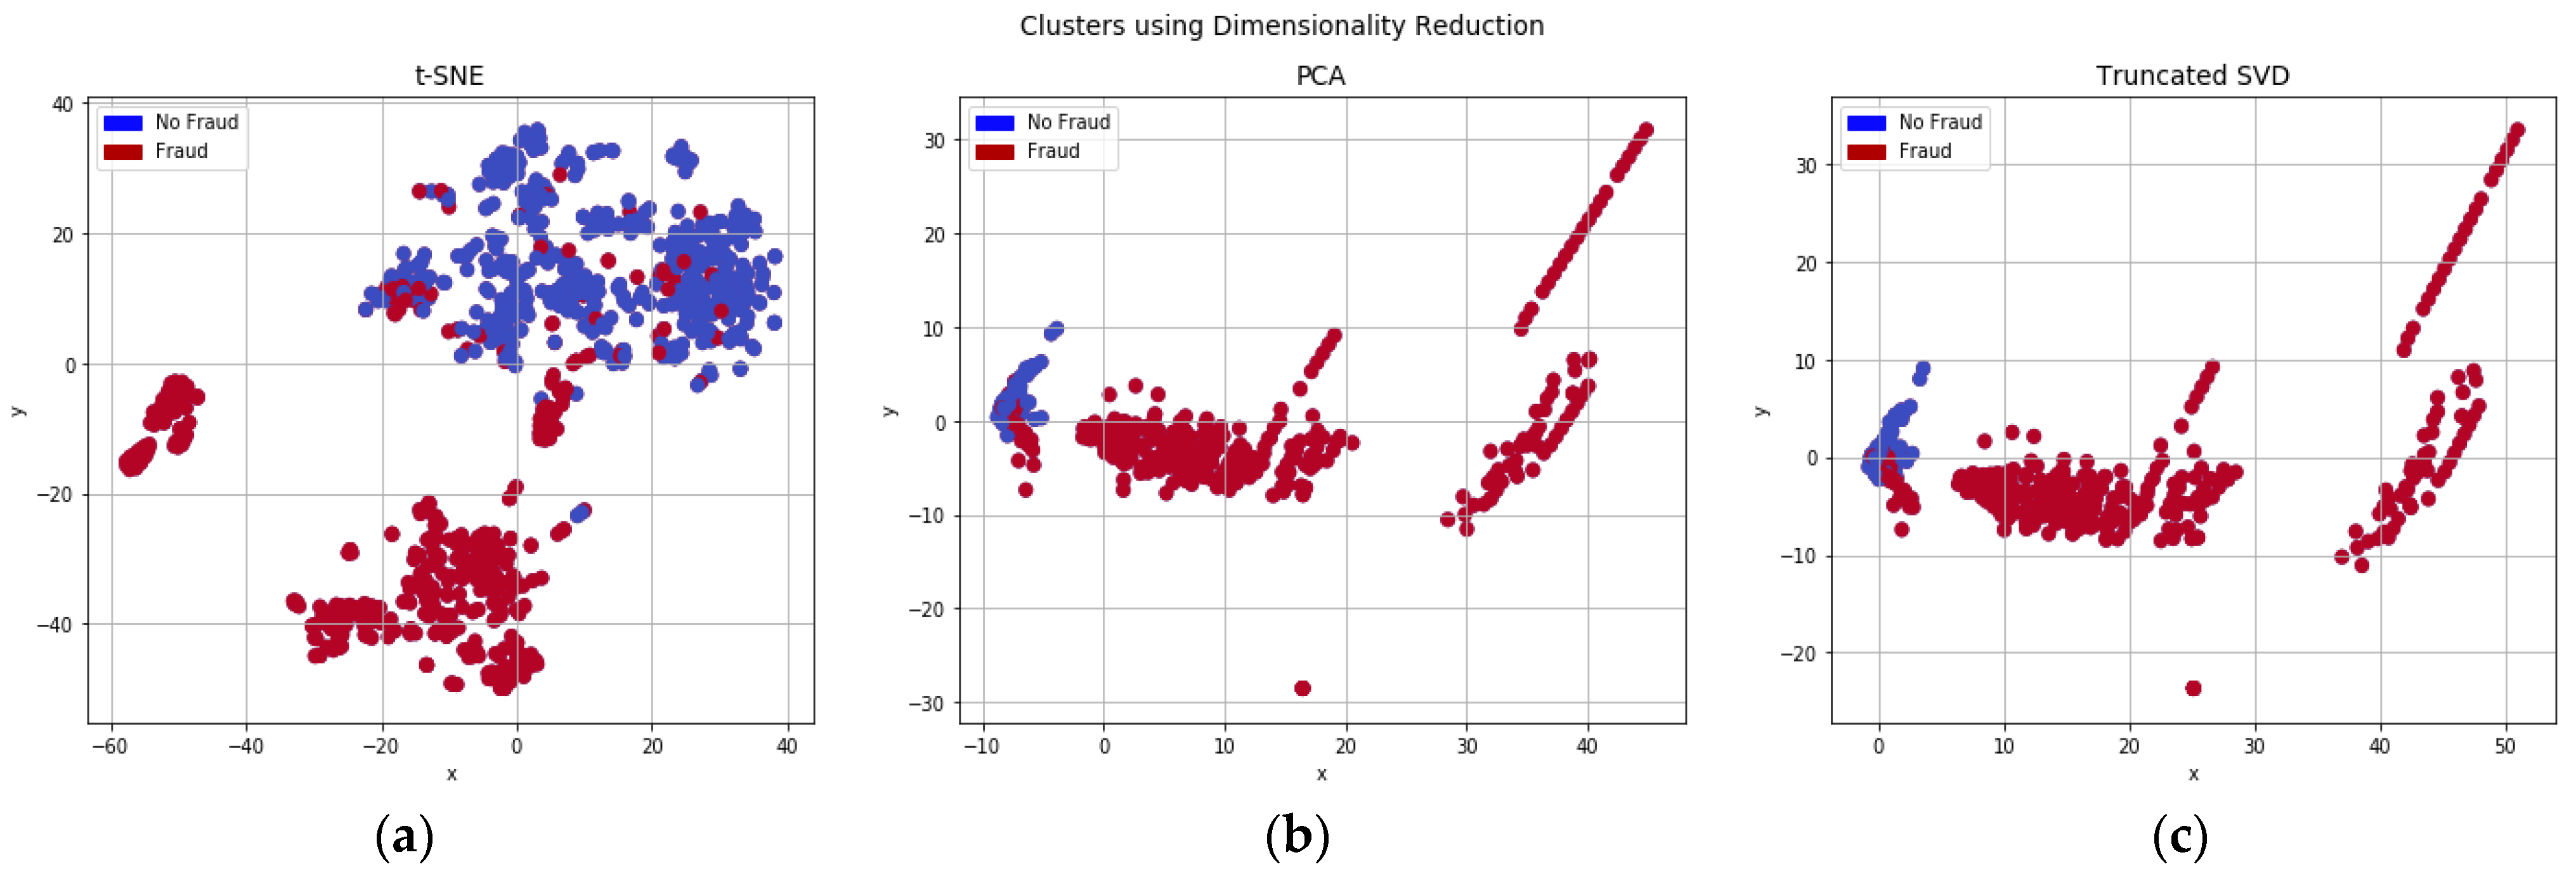
The state-of-the-art techniques (RU, t-SNE, PCA, and SVD) are combined to address the persistent problem of card-not-present fraud. These techniques perform a quicker data training process and increase accuracy, which helps them detect fraud successfully.
- ▪
The exploratory data analysis and predictive modeling are carried out to reduce dimensionality by projecting each data point onto only the first few major components to obtain lower-dimensional data while retaining as much variation in the data as feasible.
- ▪
t-SNE reduces dimensionality by keeping similar and dissimilar instances separately to further increase the accuracy.
- ▪
LRL is used to evaluate the success and failure probability of CNP fraud. The interaction of predictor factors is simulated to predict the link between distinct lawful and illegitimate transactions.
1.2. Paper Organization
Section 2 presents the salient features of existing approaches.
Section 3 presents the proposed plan.
Section 4 shows the implementation and experimental results.
Section 5 discusses the significance of the result and limitations including suggestions for improvement.
Section 6 concludes the entire paper.
1.3. Problem Identification
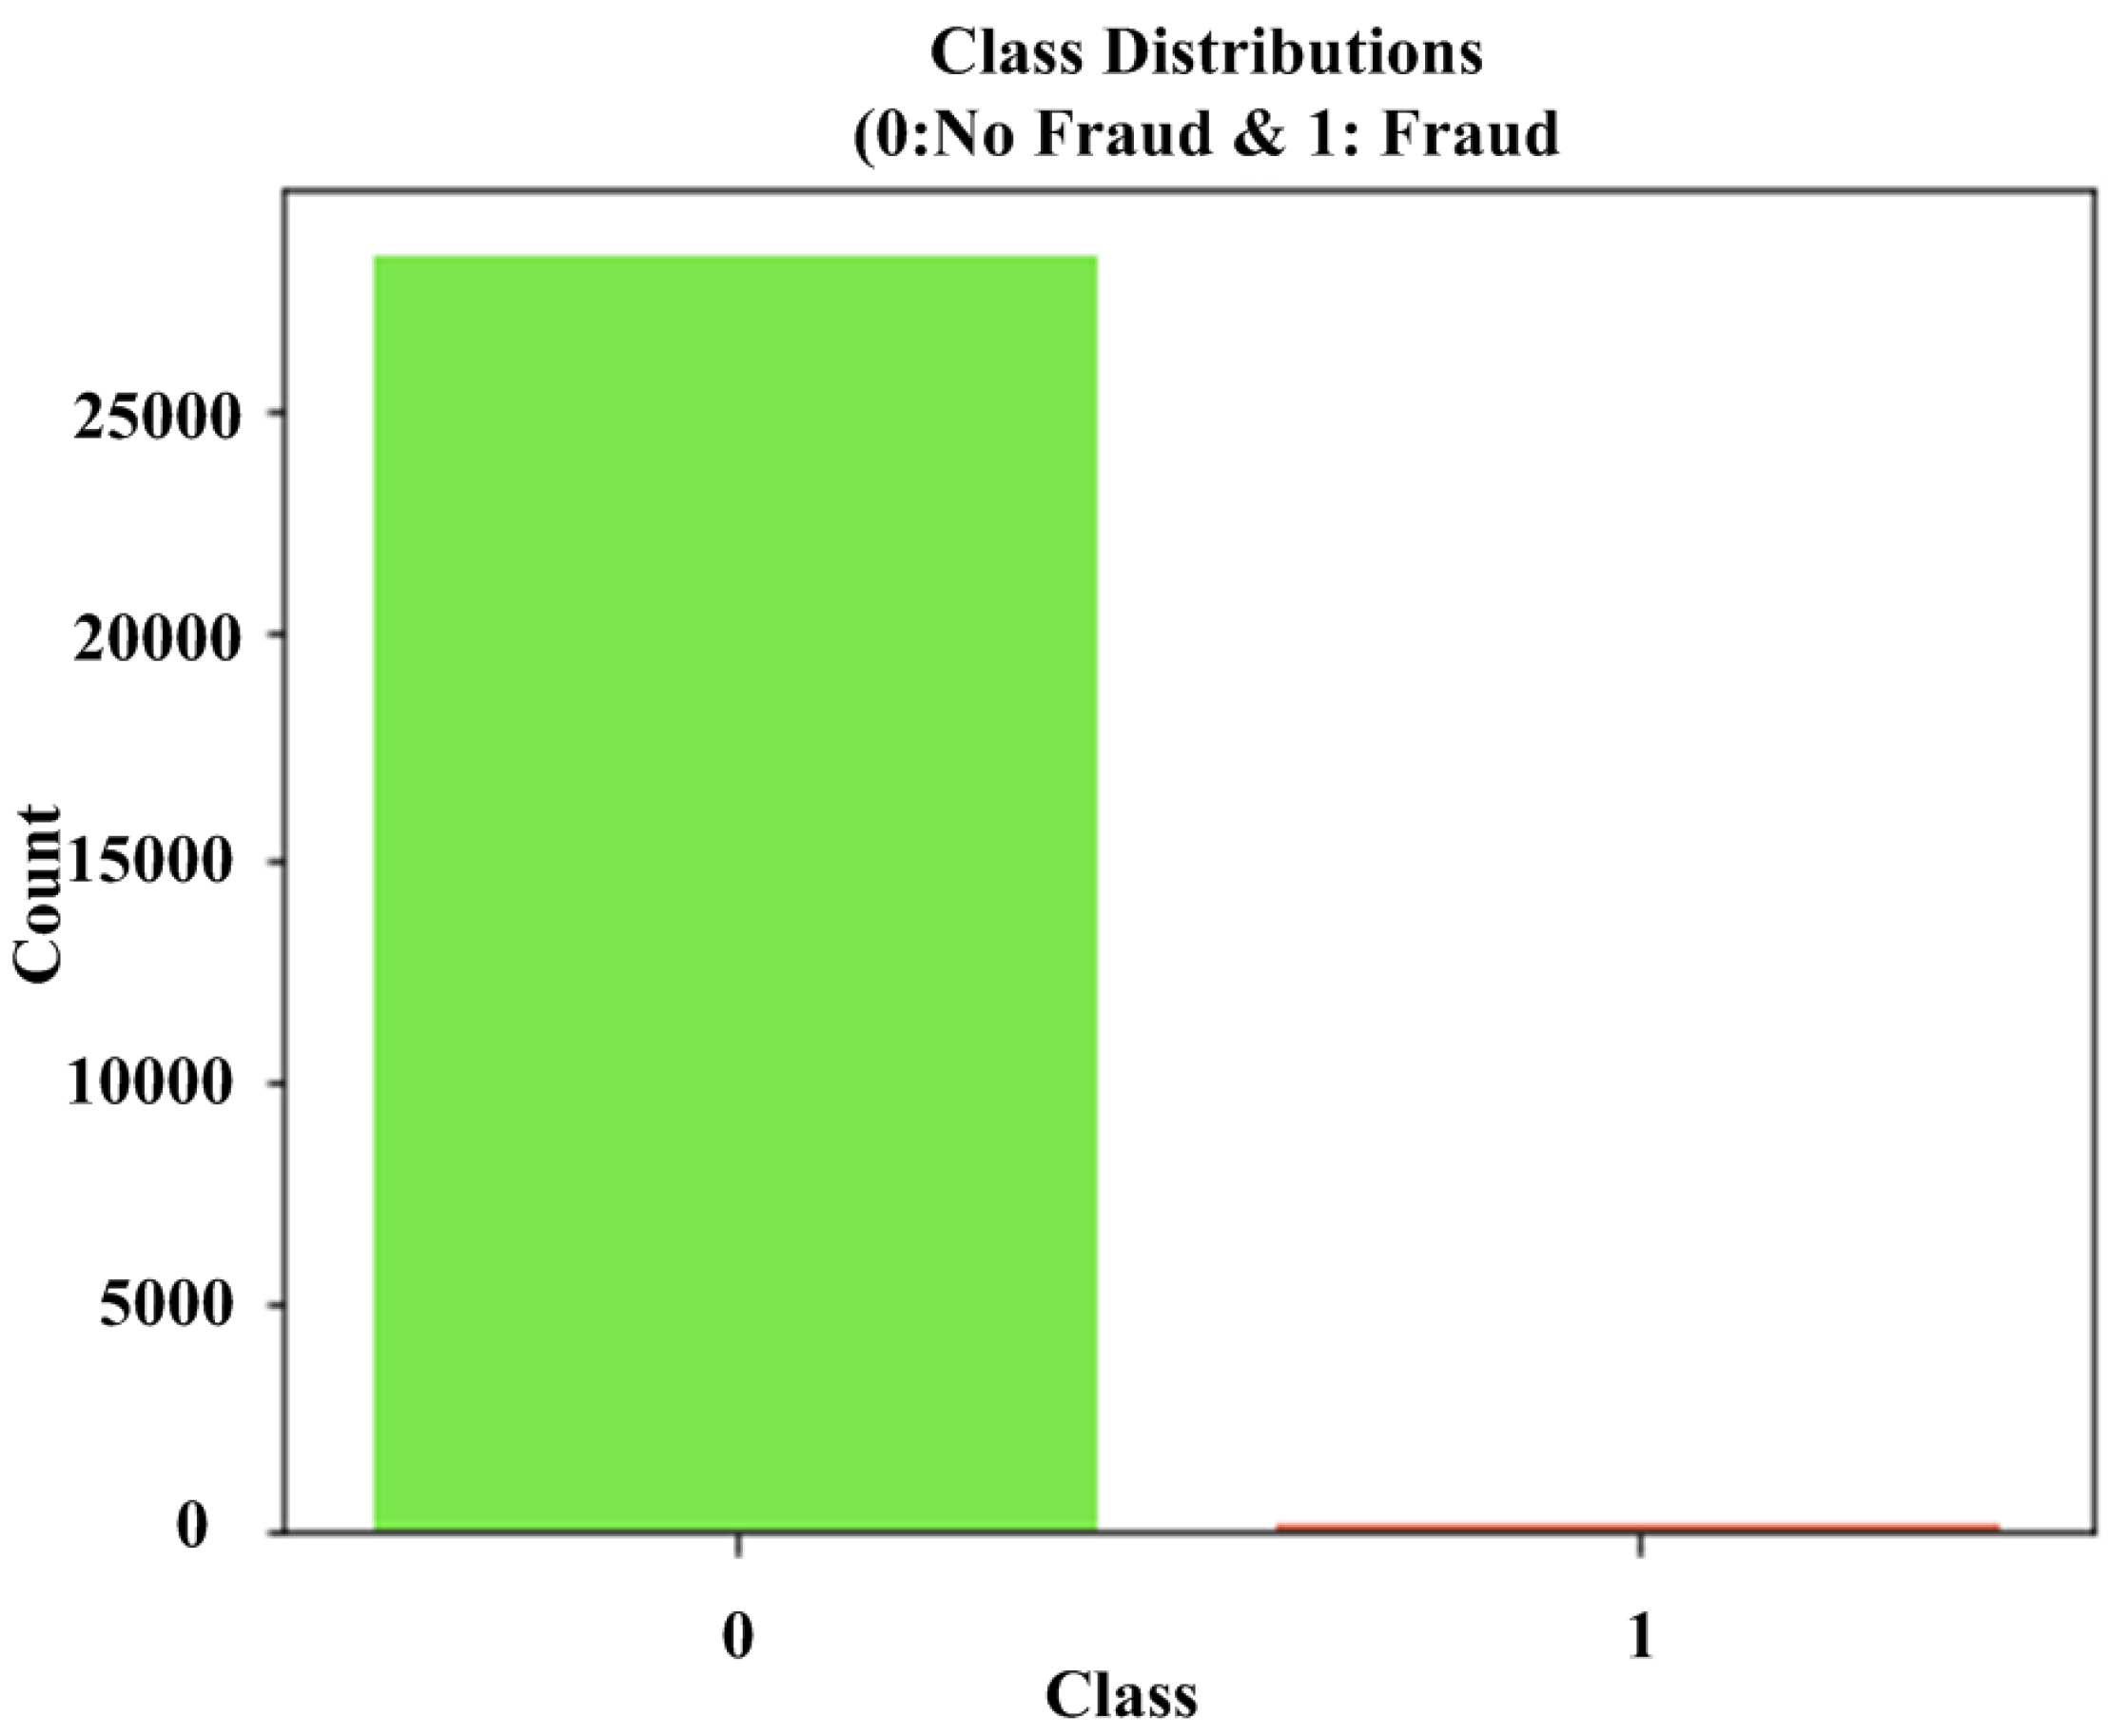
The fundamental issue that arises when attempting to create a fraud detection and prevention algorithm is that the number of fraudulent transactions is insignificant in comparison to the number of valid transactions. According to various statistics, credit card fraud accounts for around 0.1% of all card transactions [
15]. This means that all detecting machine learning algorithms will believe that 99.9% of transactions are generally valid. This will have a significant impact on the accuracy of any system against credit card fraud, particularly for supervised algorithms, since future outcomes will be difficult to anticipate. In addition, if the system’s accuracy is low, defining fraud will be tough. Furthermore, if the system is unable to identify fraudulent behavior, consumers and institutions may suffer significant financial losses. It would be ideal if there was an efficient algorithm for fraud detection and prevention based on the unsupervised machine learning technique, which would aid in the prevention of fraudulent activities.
2. Related Work
In order to address the issue of credit card fraud, ref. [
16] introduced the unsupervised credit card detection (UCCD) method, which combines two well-known algorithms: Principal Component Analysis and SIMPLEKMEANS. The transaction and the client’s geographic locations are added to an existing dataset to improve model accuracy. By foreseeing outcomes and classifying probable frauds, the suggested model achieves good results on the built database test.
It scores transactions quickly and accurately, and it can detect new fraudulent activities. Principal Component Analysis gives a more thorough image of family members among exclusive traits while also being more adaptable. However, the risk remains of achieving a ‘local’ best rather than a recognized one. This risk might be reduced by repeating the “k means” technique several times with unique beginning clusters at the price of increasing execution time.
Ref. [
17] analyzed many approaches for detecting credit card fraud in this paper: BLAST-SSAHA hybridization, hidden markov model, fuzzy darwinian detection, neural networks, SVM, K-nearest Neighbor, and Bayes, naive. Following that, these algorithms were applied to datasets and compared based on essential criteria. The findings of comparison using credit card transactions demonstrate that these strategies are more effective in combating financial fraud than other techniques in the same industry. INave Bayes characterization is completed by using the Bayes standard to calculate the likelihood of the proper class indicating excellent execution.
Ref. [
18] suggested a paradigm for fraud detection based on convolutional neural networks (CNN). It learns from labeled data and acquires innate fraud behavior features. Furthermore, trade entropy is proposed to improve transaction categorization accuracy. In addition, ref. [
19] coupled the trade entropy with feature matrices and applied it to a convolutional neural system. The suggested CNN-based structure of mining inactive distortion designs in Mastercard exchanges converted trade data into a component network for each record, allowing natural relationships and collaborations in temporal arrangement to be discovered for the CNN.
The incredibly imbalanced example sets are reduced by consolidating the cost-based inspecting technique in trademark space, yielding a dominant performance of extortion identification, a story exchanging highlight called exchanging entropy is proposed to recognize progressively complex extortion designs. A characteristic matrix is used to represent many transaction records, on which a convolutional neural network is trained to recognize a set of latent patterns for each sample. Trial findings from a commercial bank’s actual trading data show that the suggested approach outperforms other conditions of craftsmanship strategies.
The issue of a false sense of security is addressed in [
20]. When people see HTTPS on the command line, they instinctively believe. Though this was true in the past, it is no longer valid in a world where hackers may use the same technologies to their advantage. The authors decided to use a deep-learning system in the hopes of improving accuracy. The long short-term memory (LSTM) technique enables a deep learning approach based on web certificates. This algorithm may identify new patterns on its own, without the assistance of project developers, implying that it can probe beyond what humans can deduct from certificate text. The algorithm detects rogue certificates with a high degree of accuracy, eliminating the need to rely on sluggish browser detection mechanisms. This method decreased the amount of time required to detect new assaults from dangerous websites.
The authors of [
21] reported the first analysis of a case study involving credit card fraud detection, in which Cluster Analysis was used to normalize data. The findings of using Artificial Neural Networks and Cluster Analysis on fraud detection have demonstrated that clustering qualities can minimize neural inputs. The paper provided a case study in which Multilayer Perceptron Artificial Neural Networks and Cluster Analysis were used to detect credit card theft. Cluster Analysis was used to successfully perform qualitative data standardization.
Ref. [
22] suggested a fundamentally new model-based strategy that separates anomalies rather than profiling typical spots. Due to the isolation, iForest employs sub-sampling, which is not possible in previous approaches, resulting in an algorithm with a linear time complication and a low constant and memory use. It is also appropriate for high-dimensional issues with a significant number of irrelevant qualities, as well as when the training set contains no anomalies. There are two phases to detecting anomalies using iForest. The first phase is training, which involves creating isolation trees from subsamples of the training set. The second phase is testing, which involves running the test instances through isolation trees to acquire an anomaly score for each one.
In [
23], a method of authenticating a credit card is presented that involves the stages of issuing a credit card to a holder, the card bearing an account number. A personal identification number (PIN) is assigned to the holder. A validation transaction must be performed before a credit card transaction may be authorized, in which the customer slips a credit card into an electronic terminal and then enters the PIN. The PIN code and account number are compared to information recorded in a database, and only if the PIN code matches the account number accurately is credit card usage approved.
This research [
24] provided a complete examination of monetary fraud detection procedures utilizing such data processing methodologies, with a specific focus on computational intelligence-based solutions. Key elements such as detection rule employed, fraud kind explored, and the success rate is covered in the classification of procedures. Problems associated with current techniques, as well as prospective future directions of investigation, have also been identified. The current methods in monetary fraud detection using intelligent techniques, each applicable math, and process, were studied in this investigation [
10]. Their effectiveness varied, but each approach was found to be somewhat capable of police work involving various types of monetary fraud. The ability of CI tactics such as neural networks and support vector machines to be informed and adapt to new things is helpful in fighting fraudsters’ developing methods. There are still various facets of intelligent fraud detection that have not yet been investigated. Various types of fraud, as well as some data processing tactics, are briefly examined but require further investigation to be fully understood. There is also the possibility to examine the performance of current strategies through customization or standardization, as well as the possibility to assess price profit analysis of method fraud detection. A new matrix profile (NMP) for the anomaly detection is used to tackle the all-pairs similarity search issue for time series data [
25]. The proposed paradigm is based on two cutting-edge algorithms: Scalable time-series Ordered-search Matrix Profile (STOP) and scalable time series anytime matrix profile (STAMP). The proposed NMP may be applied to huge multivariate data sets and delivers high-quality approximation solutions in a reasonable amount of time. The findings show that the suggested NMP outperforms the other algorithms in terms of accuracy.
Comparative research on data mining strategies for credit card fraud detection is undertaken in this work [
26]. The following algorithms were investigated: random forest and SVM were used in conjunction with Logistic Regression. A novel network-based model called CATCHM is introduced for credit card fraud detection [
27]. The proposed model is based on representation learning. An inventive network design employs an effective inductive pooling operator and careful configuration of the downstream classifier. The long short-term memory-recurrent neural network (LSTM-RNN) is introduced for perceiving the credit card fraud [
28]. This method reduces the occurrences of fraud. The framework is suggested to combine the potentials of cost-sensitive learning and meta-learning ensemble (CSLMLE) techniques for fraud detection [
29].
Integration of multiple algorithms attempt to overcome the fraud detection of the card is proposed [
30]. However, the proposed algorithm increases the complexity and produced a lower accuracy. The credit card fraud detection with integration of multiple (CCFDM) algorithms is carried out. Additionally, to distinguish between transactions that are fraudulent and those that are not, supervised machine learning and deep learning techniques are used. In order to overcome the problem of card-not-present fraud detection and prevention, the CCFDP is proposed which combines modern techniques (RU, t-SNE, PCA, and SVD). These techniques perform a quicker data training process and increase accuracy, which helps them detect fraud successfully. In order to obtain lower-dimensional data while retaining as much variation in the data as is practical, exploratory data analysis and predictive modeling are performed to reduce dimensionality by projecting each data point onto only the first few major components. In order to further improve accuracy, t-SNE is used to reduce dimensionality by keeping similar and dissimilar instances apart. LRL is also used to assess the success and failure probability of CNP fraud. In order to predict the relationship between various legitimate and illegitimate transactions, the interaction of predictor factors is simulated. The current contributions for addressing credit card fraud detection was summarized in
Table 1.
3. Credit Card-Not-Present Fraud Detection and Prevention Method
In this section, we provide a description of our CCFDP mechanism. Our algorithm mainly focuses on solving the CNP committed fraud through online credit card transactions. The CCFDP provides automatic detection of the anomalies in the set of incoming transactions depicted in
Figure 2. The detection involves two processes:
- ▪
Fraud Detection Process
- ▪
Fraud prevention Process
3.1. Fraud Detection Process
In order to detect the fraudulent activity of the credit card fraud, we will apply different types of rules. We will use the Logistic Regression algorithm to detect fraudulent activity. First of all, we apply the Random Undersampling (RU) method to balance our dataset. Next, we will train our model by using the dataset and log files of the user. Furthermore, when the model will be trained well enough, we start to apply it on new transactions. It compares the features of a new transaction with a history of user transactions, and if it finds anomalies it calls prevention process.
3.1.1. Dimensionality Feature Reduction
It describes methods for minimizing the number of variables in training data. It may be helpful to reduce dimensionality when working with high-dimensional data by projecting the data to a lower-dimensional subspace that captures the core of the data. The term high-dimensionality refers to input variables that have hundreds, thousands, or even millions of possible values. Fewer input dimensions may suggest fewer parameters or a simpler structure in the machine learning model, known as degrees of freedom. A model with many degrees of autonomy is prone to overfitting the training dataset and so performing badly on new data. Simple models that generalize well are preferable, as are input data with few input variables. This is especially true for linear models, which commonly relate the number of inputs and degrees of freedom.
It is difficult to reduce dimensionality because different components have different occurrence probabilities. A common issue is determining how to describe and reduce these variables. Thus, dimensionality reduction should be modeled. Let us assume there is training dataset
, for each input variables
. There is a unique output for the reduced variables
. The probability of each result
is
. Next, we can acquire the corresponding reduced data as follows:
The result
is rounded up to specify how many variables are reduced to represent the information, and the data entropy of the corresponding reduced data is the anticipation of information entropy that can be determined by:
The complexity of the features is composed of number of the variables in training data. The training data of a single variable are
. The self-information amount and information entropy of its individual variables can be defined as:
The information entropy of the variables can be reduced linearly if they are independent of each other, but this is not the case. Multiple variables’ training data are frequently related to one another. As a result, there is a need to use conditional self-information to reduce multiple variables at the same time, as given by:
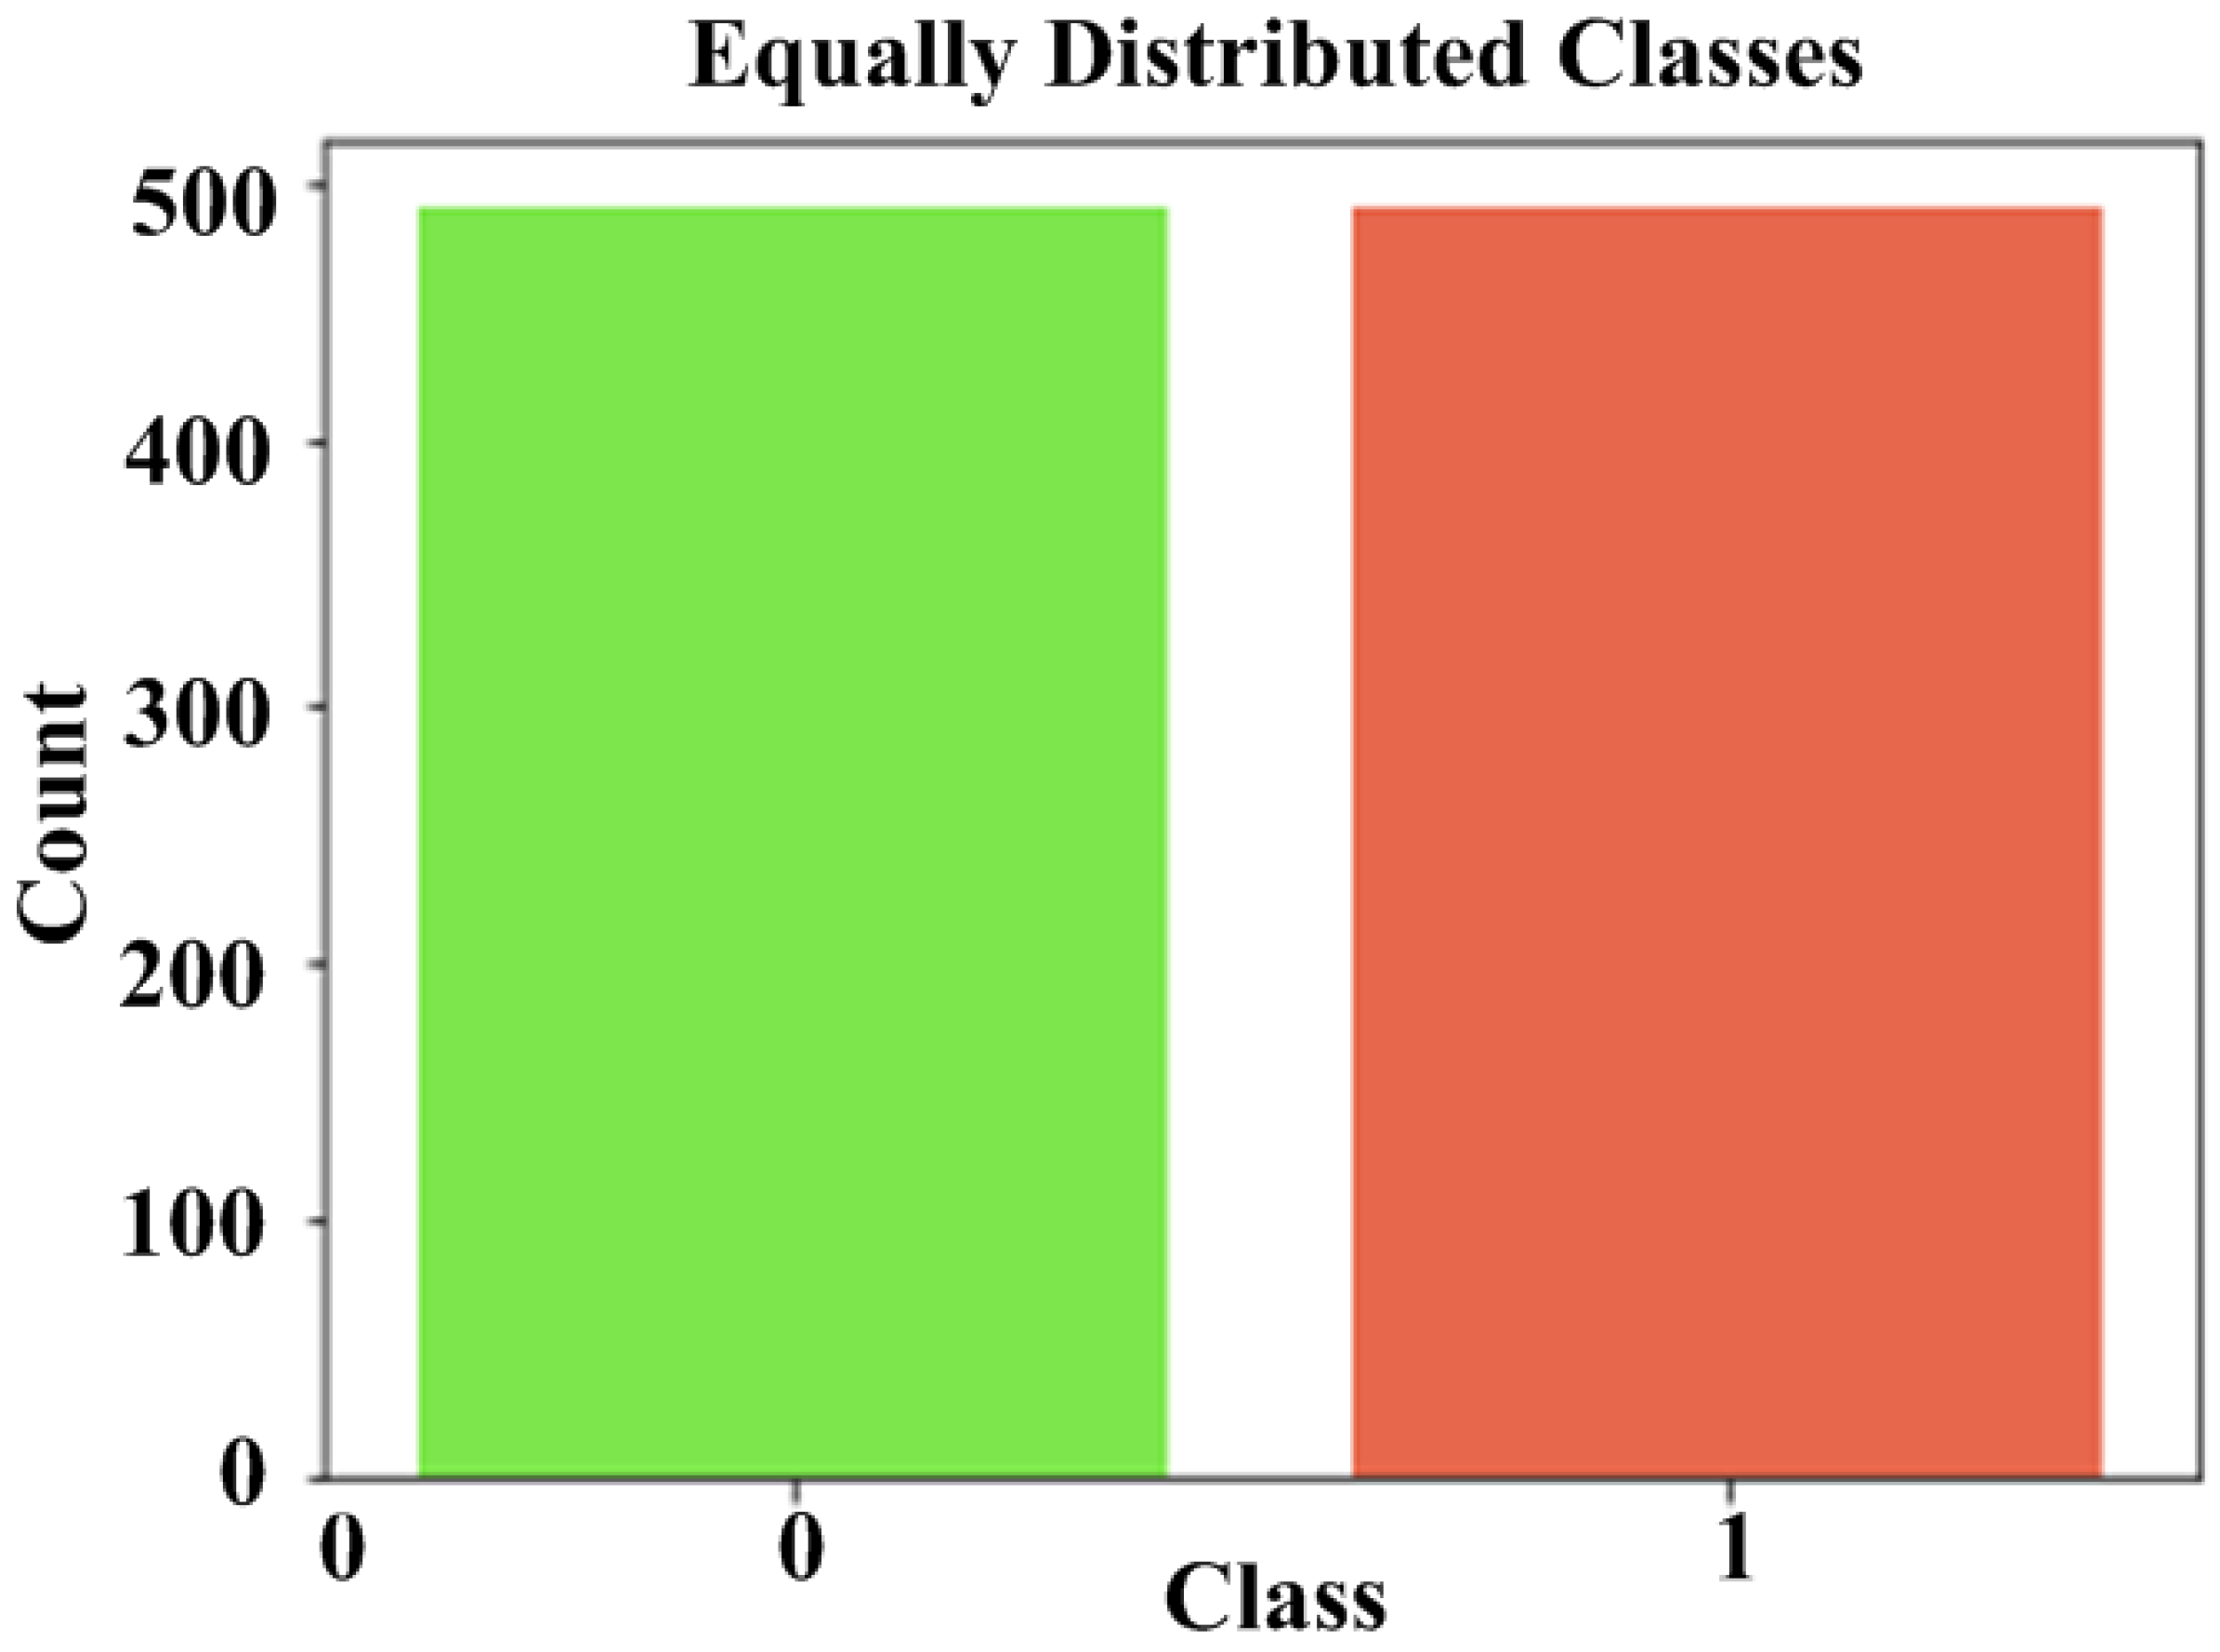
Random Undersampling
It entails arbitrarily selecting examples from the majority class to be removed from the training dataset. This process is repeated until the desired class distribution is obtained. For example, an equal number of examples for each class is maintained. The RU is appropriate for dimensionality reduction features in datasets because the minority class has an uneven and adequate number of examples.
Let us take a hypothesis
:
that relates to every example
. Thus, the probability for obtaining the accurate label
or unfitting label
can be obtained as:
and
then
has accurately predicted that the label of
is
, not l. Similarly, if
and
,
has inaccurately predicated that the label of the
is L. The fraud detection process is explicitly defined in Algorithm 1.
| Algorithm 1: Credit card fraud detection process for transactions |
- 1.
Initialization: {Ds: Dataset, U: User account, A: Alert, : Abnormal transaction, L: Data in log, Db: Database,: balance dataset, random undersampling, Tr: Transaction, Md: Fraud detection model, : t-distributed Stochastic Neighbor Embedding, : Principal component analysis, : Singular value decomposition, ϓ: Feature duplication} - 2.
Input: {Ds} - 3.
Output: {A, } - 4.
Initiate - 5.
Do - 6.
Process - 7.
Remove - 8.
Apply - 9.
Operate - 10.
While () - 11.
Endwhile - 12.
Decompose Md - 13.
Train Md on - 14.
U ୮ Db - 15.
If U ∉ Db then return A - 16.
Apply - 17.
Endif - 18.
If ∈ Md then return A - 19.
Store Tr ⊂ Ds - 20.
Endif - 21.
Write L - 22.
Make Tr
|
In Algorithm 1, the Step-1 shows the initialization of utilized variables. Steps-2-3 demonstrate the input and output procedures, respectively. Steps-4-11 initiate the random undersampling process to balance the dataset. Furthermore, it has been ensured that the high-dimensional dataset is reduced into a low-dimensional graph to retain the majority of the original data. Finally, feature duplication is also removed from the dataset. Step-12 starts both exploratory data analysis and predictive modelling. Step-13 uses the dataset and the logistic regression technique to train our model. Step-14 looks up the card owner in the database. Step-15 demonstrates that if the query result is not successful, then an alarm is given to Algorithm 2, otherwise the transaction is requested from the database. Steps-16-17 demonstrate the process of applying the proposed model on the given transaction to determine the nature of transaction (malicious or non-malicious). Step-18 determines if the model exhibits anomalous behavior, then it sends an alarm to Algorithm 2. Otherwise, Steps-19-20 record transactions in the dataset and end the process. Step-21 depicts the log writing procedure. Step-22 depicts the transactional process.
Undersampling removes irrelevant information. Since the precise probability cannot be determined. As a result, when using undersampling to drop information, it is best to first collect statistical data on the datasets used in the experiment. The difference between two datasets must be quantified. The degree of difference must be described. As a result, the Levenshtein distance can be used to quantify the degree of separation between two character strings (such as English characters). The Levenshtein distance is computed as follows:
Another time-based difference characterization is disagreement decay. Disagreement decay is defined as the probability that changes the value of an attribute
s within time
t. The symbol
d represents this probability (s,t). The mathematical statistics can be used to characterize the probability distribution function of this probability given by:
The absolute value denotes the number of samples needed to generate an agreement decay. The agreement decay is the probability that an entity retains the same value of an attribute s over time t.
3.1.2. t-Distributed Stochastic Neighbor Embedding
It reduces a high-dimensional dataset to a low-dimensional graph that retains the majority of the original data. It does this by placing each data point on a two- or three-dimensional map. This method finds data clusters, guaranteeing that an embedding keeps its meaning in the data. In this case, t-SNE reduces dimensionality by seeking to keep similar and dissimilar instances close together.
Here, t-SNE computes probabilities of the similar high-dimensional datasets , which are proportional to the similarity of datasets and given by:
Therefore, and .
The conditional probability
describes the similarity of datapoint
to datapoint
. Thus,
can select
as its neighbor. If the neighbors are selected with amount to their probability density under Gaussian centered at
. Thus, it can be defined as:
Therefore, .
Hence and .
Where is a high-dimensional dataset, and is the bandwidth of a Gaussian function.
3.1.3. Principal Component Analysis
It is the process of computing the primary components and then utilizing them to adjust the foundation of the data, frequently using only the top few primary components and dismissing the rest. PCA is used for both exploratory data analysis and predictive modelling. It is extensively used to reduce dimensionality by projecting each data point onto only the first few major components to obtain lower-dimensional data while retaining as much variation in the data as feasible. The direction that minimizes the variance of the anticipated data is defined as the first principal component. The major components are in charge of increasing the variation of the projected data. The standardization is especially important before PCA because the latter is very sensitive to the variances of the initial variables. That is, if the ranges of initial variables differ significantly, those with larger ranges will become dominate over those with small ranges (for example, a variable ranging from 0 to 100 will become dominate over a variable ranging from 0 to 1), resulting in biased results. As a result, converting the data to comparable scales can aid in avoiding this problem.
For each value of the variable, perform this mathematical operation by subtracting the mean and dividing by the standard deviation.
Let us assume
is the matrix that defines dataset. As a result, each column
n be a feature and each row m be an example. Therefore, matrix
is the combination of matrix
. Thus, the data foundation
for the dataset can be defined as:
where
is a mean, and
is a standard deviation.
The matrix can be used to express the PCA is given by:
where
is the transformation matrix,
is the vector of the original data, and
is the vector of the main components. The eigenvectors that diagonalize the covariance matrix of the original bands are the coefficients of the transformation matrix
.
The accuracy of the principal component
depends on the number of coefficients available
in each data point
.
where
is the properties of data point, and
is total number of the coefficients.
Therefore,
Figure 3a,b demonstrate the accuracy of PCA with 2 and 3 components. The result demonstrates that the accuracy with 2 components is achieved 97.76% and 99.49% with 2 components.
3.1.4. Singular Value Decomposition
It is a method of matrix factorization that extends the eigenmode composition of a square matrix (n × n) to any matrix (n × m) (source). Thus, SVD can be obtained as:
where,
is the original matrix to be decomposed.
The left singular matrix is (columns are left singular vectors). The SVD lowers the number of features in a dataset by changing the space dimension from N to K. It is organized as a matrix, with each row representing a user and each column representing an object. SVD handles the entire process of diagonalizing a matrix into specific matrices that are easier to manipulate and analyze. It laid the groundwork for untangling data into distinct components.
3.2. Fraud Prevention Process
Implementing a strategy to prevent fraudulent transactions boosts the customer’s confidence. In prevention process, the user sends a secret code to the user telephone, and if the code entered by the user is not the same as sent code, the transaction will be blocked, and the secret question will be sent. In addition, if the answer to the question is wrong, then the system will block the user. The Algorithm 2 describes the fraud prevention process.
| Algorithm 2: Credit card fraud prevention process for transactions |
- 1.
Initialization: {Ds: Dataset, U: User account, A: Alert, B: Block, M: Message, L: Data in log, Db: Database, Tr: Transaction, C: Secret code, T: Telephone, V: Verification, Q: Secret question} - 2.
Input: {A} - 3.
Output: {Ds} - 4.
Send C to T - 5.
If V=C then - 6.
Continue - 7.
Endif - 8.
Else block Tr - 9.
Send Q to T - 10.
If V=Q then - 11.
Continue - 12.
Endif - 13.
Else block U - 14.
Endelse - 15.
Endelse - 16.
Store Tr ⊂ Ds - 17.
Write L
|
In Algorithm 2, Step 1 shows the initialization of variables. Steps-2- 3 define input and output processes. Step 4 sends the secret code to the telephone. In Steps 5-8, the code verification process is described to ensure that code is reached the legitimate user. If the user is legitimate, then it can respond with the correct code to enter into the system. If the user is not legitimate, then the transaction will be blocked. Step-9 initiates the second process of determining the identity of the user by sending the secret question. Steps 10-12 ensure if the secret question is answered correctly, then the user continues the transaction process. Step-13 explains that if the secret question is not answered properly, then the transaction is blocked permanently. Steps-16-17 show that all of the information of transactions is securely stored in the database to improve the fraud detection model. All procedure is written to log.
The FPP involves the logic regression learning (LLP) that tries to quantify the relationship between a categorical dependent variable and one or more independent variables by plotting the probability scores of the dependent variables.
Logistic Regression Learning Modeling for FPP
The FPP applies the LRL model to prevent the fraud transaction. The LRL simulates the interaction of predictor factors and a categorical response variable. We might, for example, utilize logistic regression to predict the link between distinct lawful and illegitimate transactions. Given a collection of variables, logistic regression estimates the likelihood of falling into a specific level of categorical response. It is necessary to calculate the log-odds that are given by:
where
and
are predictors and coefficients
are the parameters of the model. To calculate corresponding odds, we use the following equation:
where b is the base of the logarithm and exponent. From this, fraud prevention can be obtained as:
Thus, the logistic function can be defined as this, when there is a single explanatory variable x:
Based on the previous equation for probability of fraud prevention function, we can define the inverse of the logistic function, g, the logit:
which then is exponentiated and transformed to the following form:
The odds of the dependent variable equaling a case, which serves as a link function between the probability and the linear regression expression is defined by:
When there is a continuous independent variable, the odds ratio can be calculated as:
In addition, for multiple explanatory variables, the perdition can be defined as:
where m is explanators of multiple regression, from which we acquire as:
After considering the Logistic Regression function itself, it is important to know how the model for machine learning algorithm is constructed. Here is the generalized linear model function with parameter θ:
where X is independent variable, Y is random variable, which may be 1 or 0, it is exponential and from which we can acquire the conditional probability of input and output variables given the parameter θ:
We acquire the likelihood function assuming that all the observations in the sample are independently Bernoulli distributed:
The log likelihood is typically maximized with a normalizing factor N
−1,
which is maximized using gradient descent, one of the optimization techniques.
Assuming the (x, y) pairs are drawn uniformly from the underlying distribution, then in the limit of large
N,
denotes the conditional probability, and DkL denotes the Kullback-Leibler divergence. This leads to the conclusion that by maximizing a model’s log-likelihood, you are reducing its KL divergence from the maximal entropy distribution. Searching intuitively for the model with the fewest assumptions in its parameters. The transaction request is initiated when the user purchases things or pays for services. The Logistic Regression approach is then used to develop our prediction model. In order to train the model, we use the creditcard.csv dataset and user information from the database. When our new transactions are included into the algorithm, the model predicts if the requested transaction is valid or exhibits anomalous behavior. If the model predicts a genuine transaction, the transaction will be completed and the money will be retained. However, if the transaction is irregular, the system will send a verification code to the user’s cell phone. Furthermore, if the user inputs the correct code, the transaction will be completed and saved in the dataset. However, if the user inputs the incorrect code, the system stalls and aborts the transaction, as well as publishing to the dataset.
Theorem 1. Fraudulent transaction initiating rate , as well as fraud attempt capability should not be more than , the probability of fraud detection using our proposed CCFDP method can be specified as:
Proof. Suppose the fraud attempting capability is smaller than , several features of the proposed OCCFP is larger than . A suitable detection process is obtained using acquired from the number of legitimate transactions. Thus, the detection process is specified through . Thus, the cumulative number of possible detection processes is , it ensures that the likelihood of accurate fraud detection can be measured as:
5. Discussion of Results
The proposed LRL is integrated with the proposed CCFDP which considerably enhances detection accuracy. In order to solve the unbalanced dataset problem, the Random Undersampling approach is employed to build a new balanced data frame. It has been observed that Random Undersampling can employ more authentic data and help to solve the unbalanced situation. During implementation, fraud proportions of 1%, 2%, and 5% are taken and randomly selected the same size as legitimate transactions. The CCFDP method’s performance is better than that of other current models from the accuracy perspective depicted in
Table 4. All of the approaches considered are trained using the same training data and fraud rates. The result demonstrates that the proposed CCFDP detects fraud cases more accurately regardless of the proportion of available fraud rate in the dataset. The CCFDP outperforms all others on diverse sample sets. On the other hand, the proposed CCFDP has the capability to prevent fraud, whereas the contending methods do not have the capability to prevent fraud because they are designed for only fraud detection. The results shown in
Table 5 validate the fraud prevention capability of the proposed method. The performance of the proposed CCFDP is also better than competing methods (CATCHM, LSTM-RNN, CSLMLE, CCFDM, ESDL, ITCCFD, and BTG from the perspective of the statistical performance metrics (MDA, MBE, RRMSE, RMSE).
The main reason for acquiring better accuracy is the use of integration of different modern techniques (RU, t-SNE, PCA, LRL, and SVD). These techniques perform a quicker data training process for increasing accuracy. Furthermore, these integrated techniques help to detect fraud successfully. PCA is employed to obtain lower-dimensional data while retaining as much variation in the data. The exploratory data analysis and predictive modeling are performed to reduce dimensionality by projecting each data point onto only the first few major components. In order to further improve accuracy, t-SNE is used to reduce dimensionality by keeping similar and dissimilar instances apart. LRL is also used to assess the success and failure probability of CNP fraud. In order to predict the relationship between various legitimate and illegitimate transactions, the interaction of predictor factors is simulated. However, the integration of modern techniques can increase the complexity. Thus, this issue has been resolved by using the dimensionality reduction feature process. This process helps to describe the procedure for reducing the number of variables in training data. When working with high-dimensional data, it may be useful to reduce dimensionality by projecting the data to a lower-dimensional subspace that captures the core of the data. The challenge encountered is the process of integration of different techniques.
6. Conclusions
The rise in fraudulent activity is massively increased due to e-banking transactions that put a burden on fraud control systems. In this research, we present a CCFDP method for detecting credit card fraud detection and prevention. The proposed method involves FDP and FPP. The FDP consists of four cutting-edge methods used in the FDP module: RU, t-SNE, PCA, and SVD processes. The FPP uses logistic regression learning. Furthermore, the Random Under Sampling approach has been employed to increase detection accuracy by balancing the number of fake samples with authentic ones. Different tests have been conducted on 1%, 2%, and 5% fraud proportions to demonstrate the efficiency of the proposed CCFDP. The results confirm that our proposed method has greater fraud detection accuracy. Furthermore, the accuracy of the proposed CCFDP is compared with the state-of-the-art (CATCHM, LSTM-RNN, CSLMLE, CCFDM, ESDL, ITCCFD, and BTG). Based on the comparison result, the proposed CCFDP outperforms current state-of-the-art methods. Moreover, the proposed CCFDP has the capability to prevent fraud as compared to counterpart methods. The result of fraud prevention accuracy also confirms the suitability of the proposed method.
In the future, we will assess the proposed CCFDP’s time and space complexity, as well as other quality-of-service factors.

 ,
, 


