1. Introduction
For rock masses containing structural surfaces, shear slip or misalignment often occurs along the structural surface, resulting in a reduction in the stability and integrity of the structural surface rock mass. Anchor support, as an important support method, can limit the interlayer misalignment or slip of rock containing a structural surface, thus improving the stability of the rock mass. However, the mechanism of the anchor bolt reinforcement of jointed rock mass is very complex, especially for a full-length bonded bolt. When the structural surface is dislocated, the bolt near the structural surface has significant local characteristics. It is this local characteristic of the anchor bolt that improves the shear strength of the structural surface. Therefore, domestic and foreign scholars have carried out a lot of research and exploration.
Since Bjurstrom [
1] studied the shear strength of rock with anchored granite structural surfaces in 1974, many experts and scholars have carried out in-depth research on the shear failure law and anchoring mechanism of the structural surface, achieving fruitful results in theory and experimental simulations. Ge [
2] proposed an estimation formula for the effect of a bolt on the shear strength of a structural surface, and the view has been generally recognized. However, it is necessary to know the axial stress and the shear stress of the bolt to calculate the shear strength of the structural surface. For this reason, Zhang [
3], Ma [
4], Li [
5], Liu [
6], Liu [
7], Chen [
8], Ma [
9], Zheng [
10] have studied the geometric dimensions, anchoring methods, and failure forms of bolts. In addition, Srivastava [
11] conducted tests on large-size specimens to analyze the effects of the bolt contact area and installation density on the shear strength of the structural surface; Wu [
12,
13] conducted direct shear tests under cyclic loading conditions, and Jiang [
14,
15] and Wang [
16,
17] investigated the shear characteristics of rock at the anchored structural surface using the boundary conditions of constant normal stiffness. In terms of simulation, Song [
18], Zhang [
19], and He [
20] have used the FISH language to modify the mechanical behavior of the PILE structural element based on FLAC
3D software to realize the simulation and application of bolt shear breakage in the anchorage structural surface. Li [
21] used the PILE element, and the shear effects under different anchorage methods of structural surface rock were simulated. Liu [
22], Li [
23], and Li [
24] have used solid elements in FLAC
3D software to simulate a bolt and have studied the stress characteristics of a bolt under the shear displacement of a structural surface. Furthermore, the stress state of the surrounding rock is different under different burial depths [
25], so the selection of a suitable anchor support method is key to controlling the stability of the surrounding rock [
26]. To address the issue of the local deformation range of an anchor bolt, one study [
1] considered that the length range of the shear deformation section of an anchor bolt is about 3–4 times its diameter. Another study [
11] considered that the length range of the shear deformation section of the anchor bolt is about 2–4 times its diameter. The authors of [
27] considered that the length range of the shear deformation section of an anchor bolt is about 3–5 times its diameter. However, the extent of the local deformation of an anchor bolt increases with the increase in the shear displacement of the structural surface. Most of the previous studies on the shear strength of an anchored structural surface have been conducted from the perspective of the local deformation of an anchor bolt after the misalignment of the structural surface, and few studies have been conducted on the local deformation of an anchor bolt during the misalignment of the structural surface.
In view of this, this study adopted the method of theoretical calculation and numerical simulation, and we used FLAC3D software to simulate granite, sandstone, and coal specimens with anchorage angles of 90° to analyze the damage of the anchoring agent and the changes in the local axial and shear forces of an anchor bolt with the misalignment of a structural surface. It was found that the length of the local deformation area of the bolt was approximately equal to the length of the damaged area of the anchoring agent, and the stress on the anchor bolt was in a coupled tensile–shear stress state when the bolt reached the yield state. By studying the effect of the local deformation of the anchor bolt on the shear strength of the structural surface, the “passive tensile–shear reinforcement mechanism” of the full-length bonded anchor bolt in the structural surface rock is proposed, further revealing the mechanism of a full-length bonded anchor bolt to enhance the shear strength of a structural surface during its misalignment.
2. Numerical Simulation of Anchored Structural Surface
2.1. Numerical Simulation Modeling
There are three methods to simulate a bolt in FLAC3D, which are the CABLE structural element, the PILE structural element, and the solid element. If only considering the bolt in tension, the CABLE structural element is suitable, but for the simulation of the bolt in shear, the PILE structural element or solid element should be used. The PILE structural element has the advantages of simple modeling and fast calculation, which is suitable for a simulation at an engineering scale, but the PILE structural element is a one-dimensional structural element, which does not occupy the dimension of space in the simulation, so it is impossible to simulate changes in the damage to the anchoring agent with structural surface dislocation in the three-dimensional model. Although solid element modeling is complex and computationally intensive, it is suitable for analyzing the damage of the anchoring agent and the change in the internal force of the bolt under the dislocation of the structural surface.
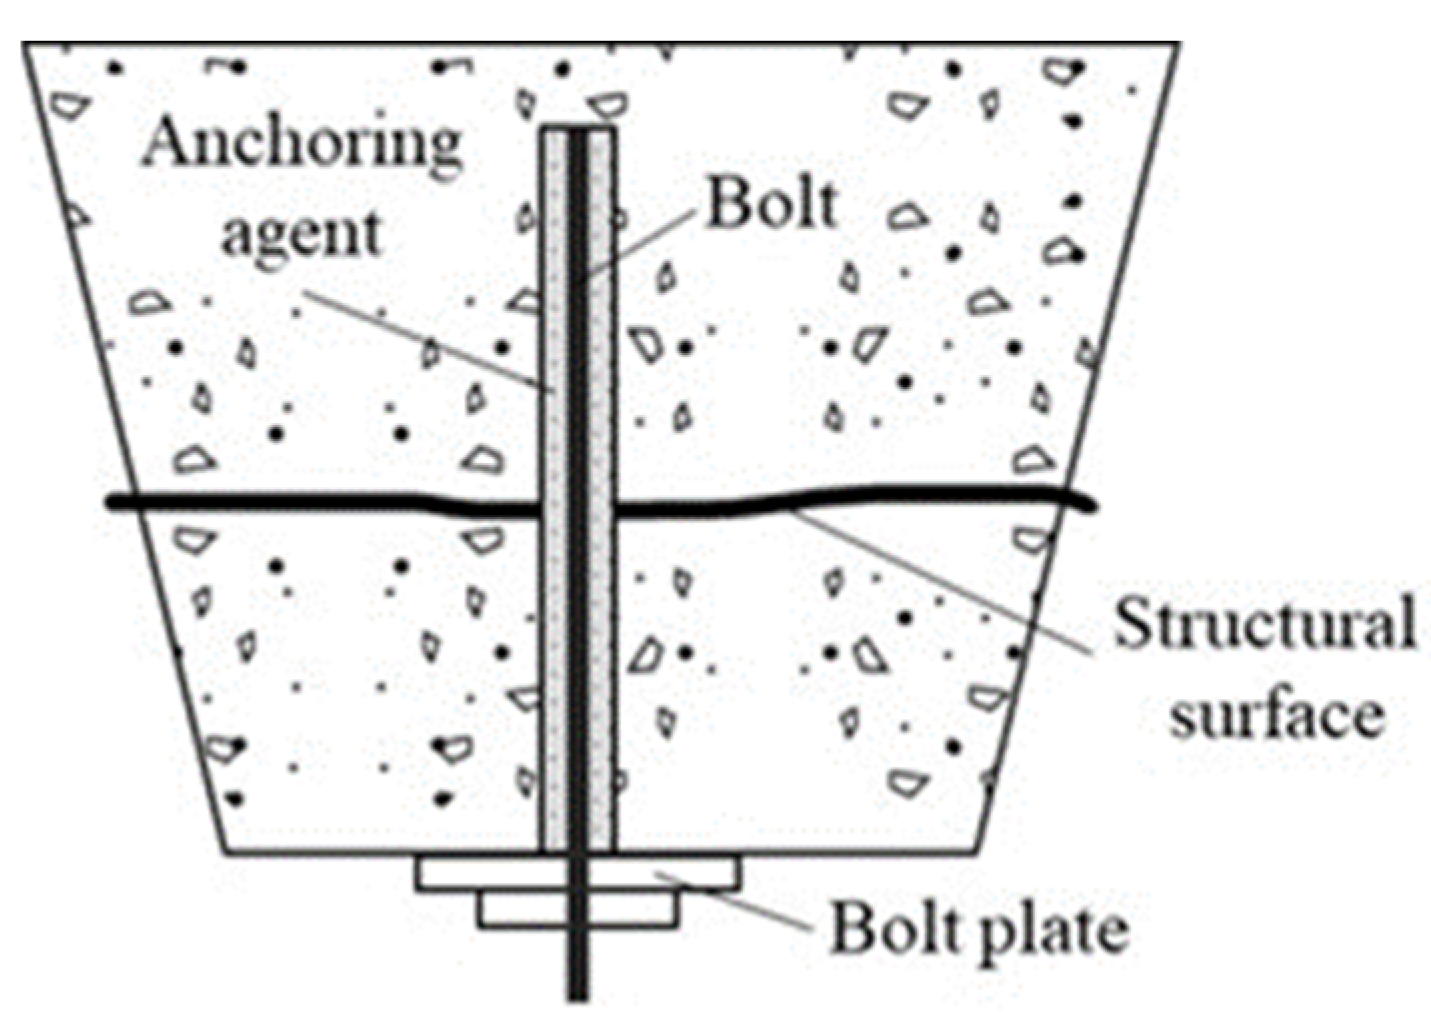
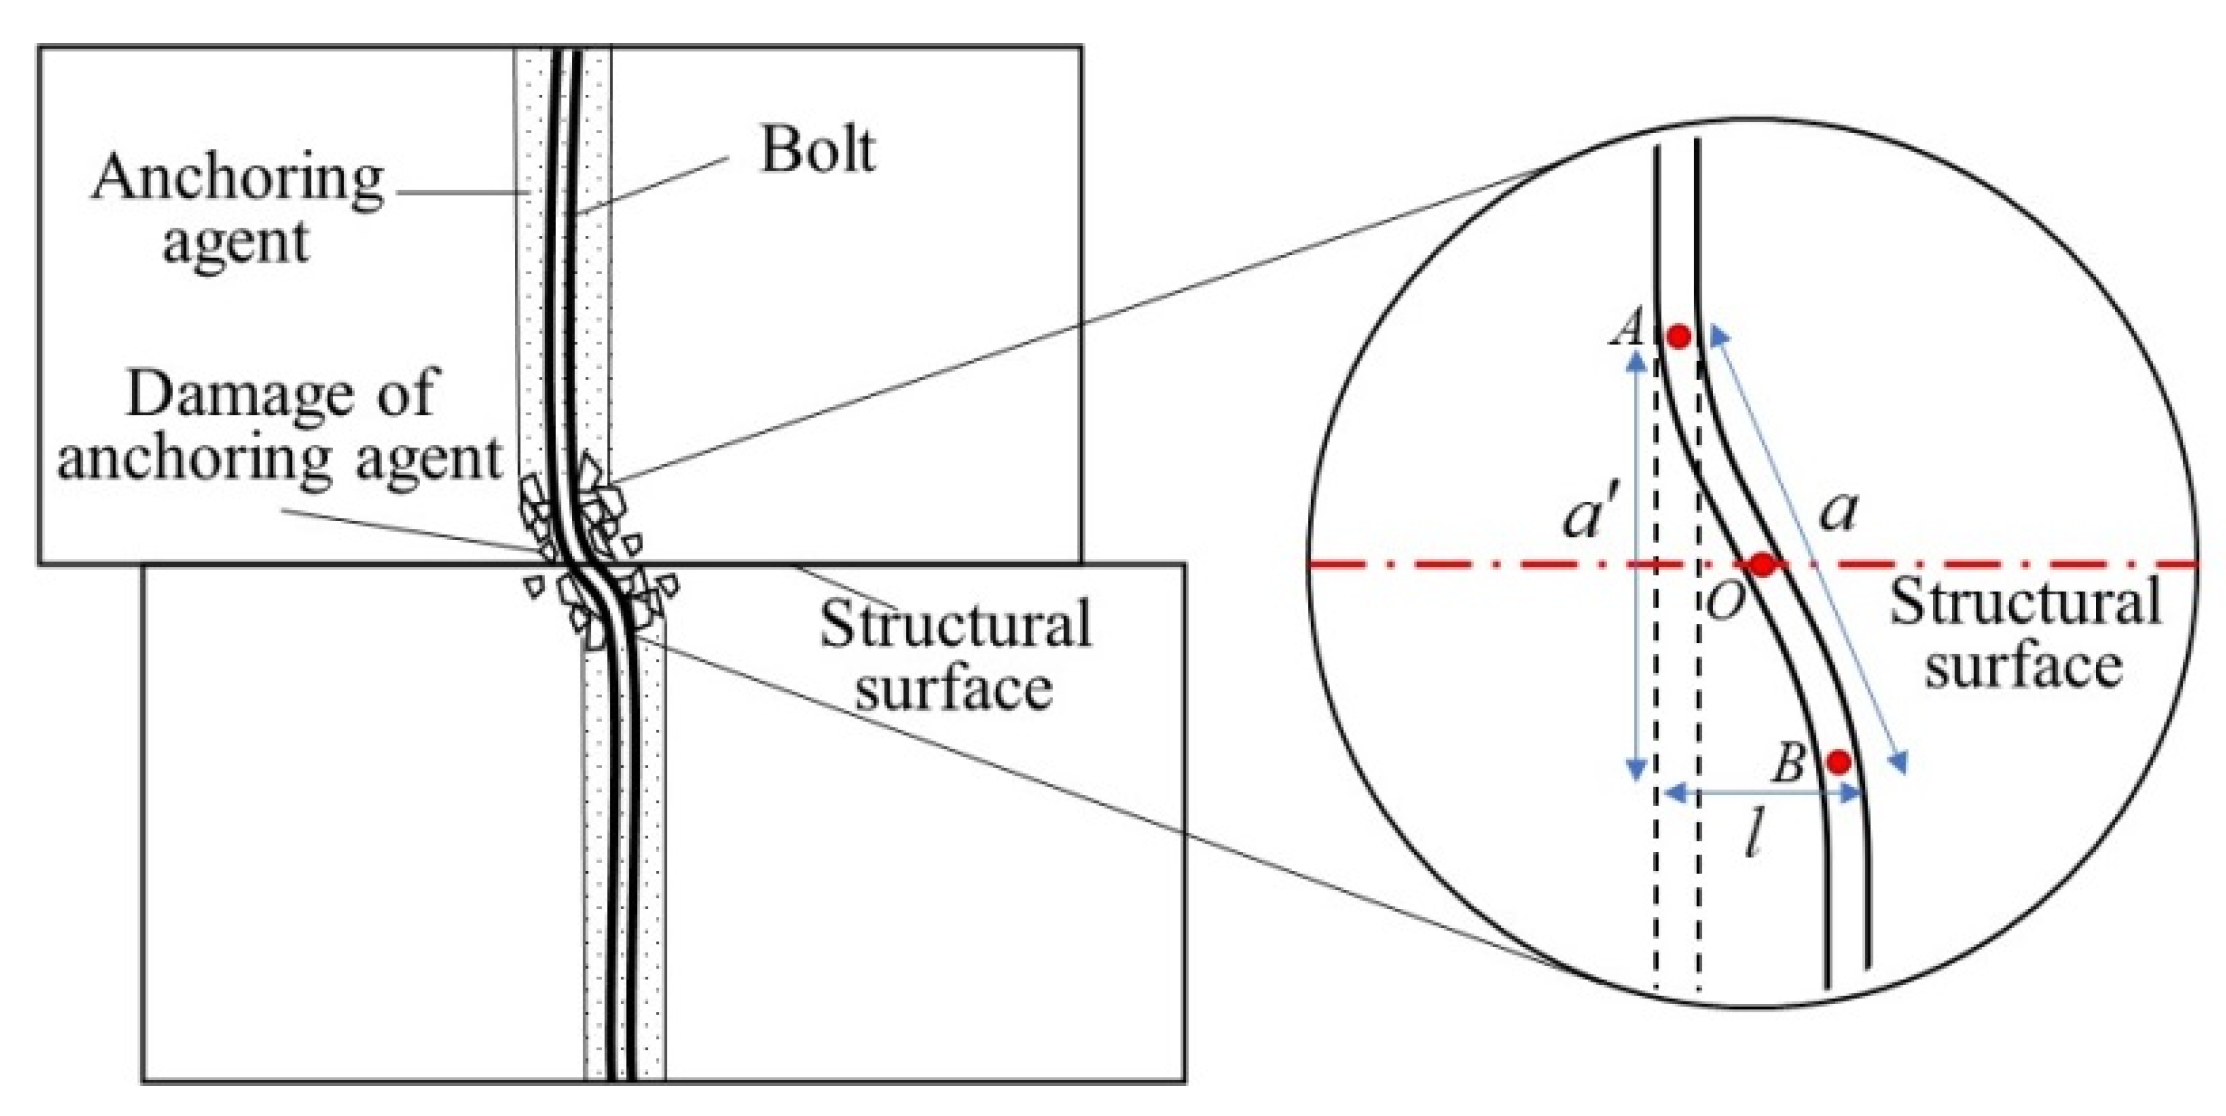
A schematic diagram of the fully grouted bolt on an anchored structural surface is shown in
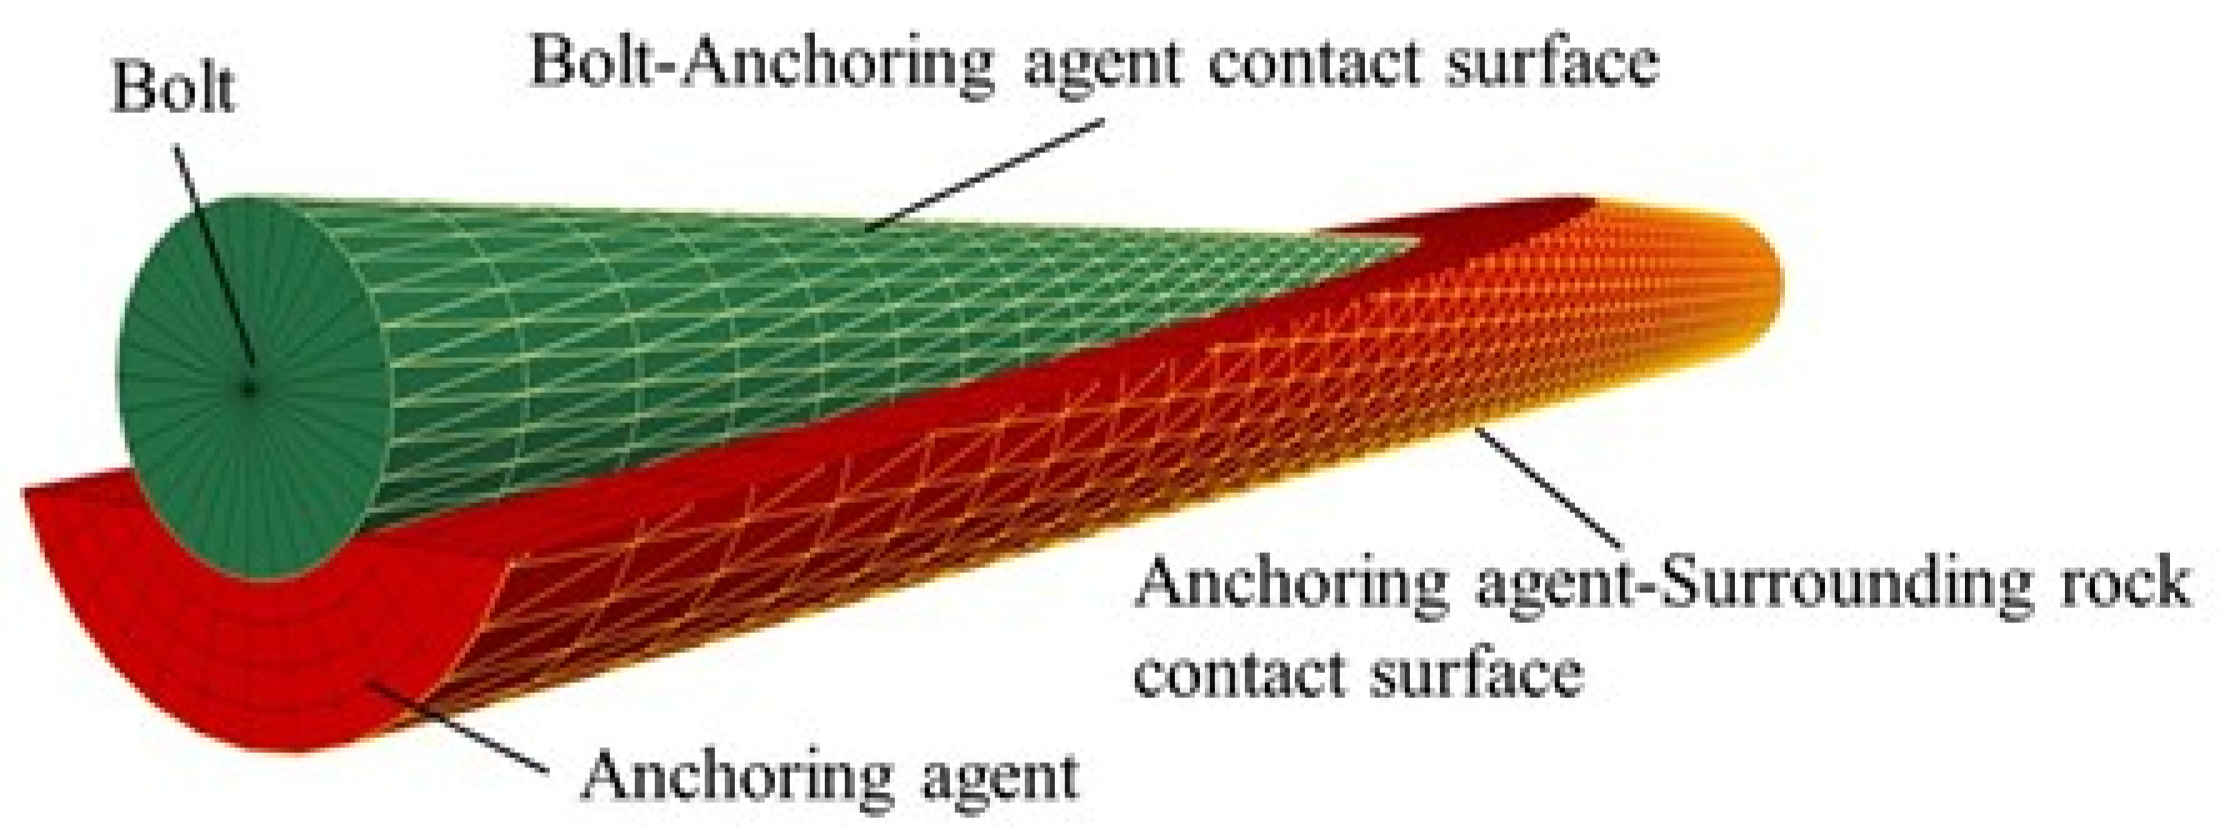
Figure 1. A cube of 500 mm × 500 mm × 500 mm (length × width × height) was taken as the surrounding rock near the structural surface, divided into two parts of the same size, and the structural surface was set up between the upper and lower parts using the interface element. The bolt was arranged at the center of the model with a length of 500 mm and diameter of 22 mm, and the diameter of the borehole was 42 mm, which was filled with an anchoring agent. The contact surfaces between the bolt and anchoring agent and the anchoring agent and surrounding rock were set using the interface element, and a schematic diagram of the contact surfaces of the bolt system is shown in
Figure 2.
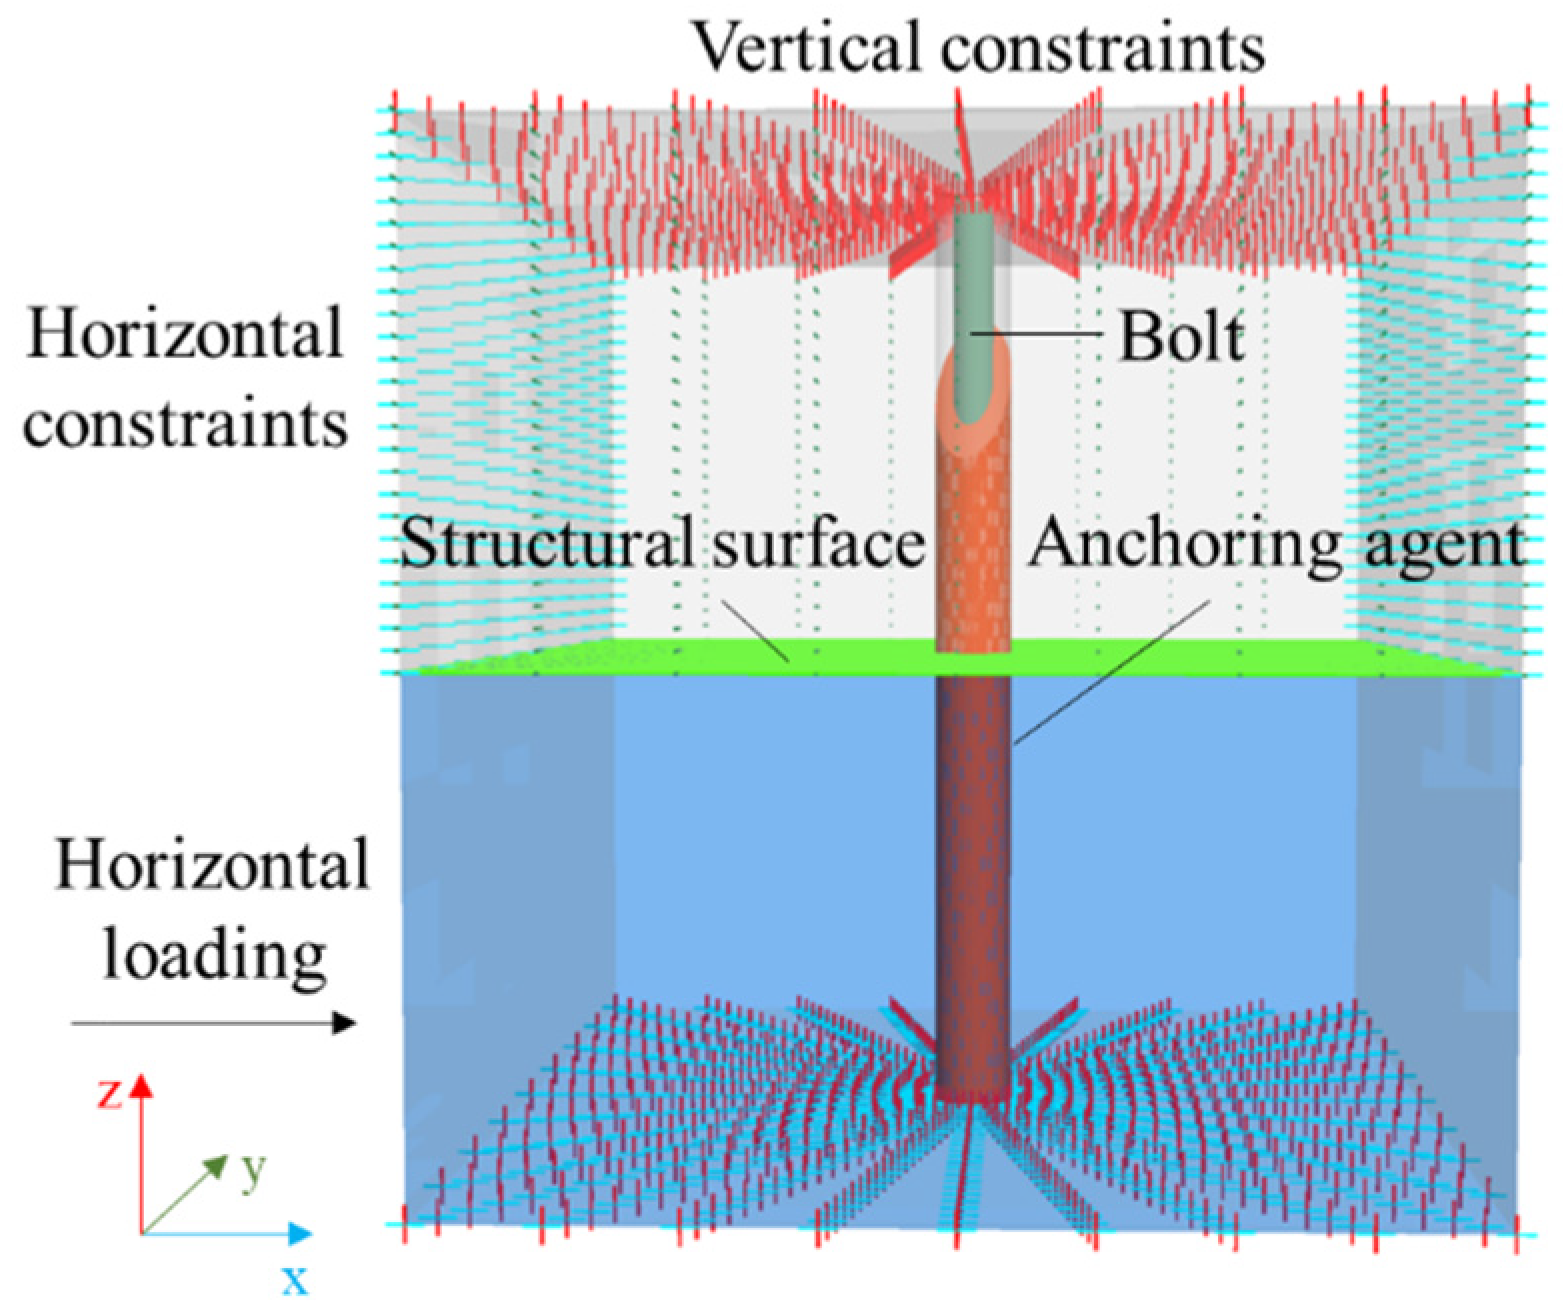
Constraints in the z-direction were applied to the upper and lower sides of the model. Constraints in the x-direction were applied to the left and right sides of the upper rock mass. Constraints in the y-direction were applied to the front and rear sides, and the lower rock mass was loaded along the x-direction with a loading rate of 1 × 10
−7 m/step. The boundary conditions and loading mode of the model are shown in
Figure 3. The parameters related to the extent of the anchoring agent damage and bolt deformation were monitored during the dislocation of the structural surface.
2.2. Numerical Simulation Parameters
In the model, the Mohr–Coulomb elastic–plastic constitutive model was used for the rock mass and anchoring agent, and an elastic constitutive model was used for the bolt. The mechanical parameters of the anchoring agent–surrounding rock mass, bolt–anchoring agent, and upper surrounding rock mass–lower surrounding rock mass contact surface mechanical parameters were the same as those in reference [
28]. The specific parameters of the simulation are shown in
Table 1,
Table 2 and
Table 3.
2.3. Assessment of Bolt Yield
With the increase in the shear displacement of the structural surface, for the bolt in the area near the structural surface, the axial force increased due to its tensile action. In addition, the shear force of the bolt increased due to the shear action of the surrounding rock on the bolt. For this kind of bolt in the tension–shear coupled state, the Von Mises criterion can be used to judge whether the bolt will yield. The expression of the Von Mises criterion is:
For the bolt in the rock mass of the structural surface, it is mainly affected by the axial stress
and shear stress
, so the Von Mises criterion can be simplified to:
where
is the axial stress of the bolt,
is the shear stress of the bolt, and
is the yield strength of the bolt.
When the structural surface is dislocated, the bolt near the structural surface is deformed, and if the internal stress at a point in the bolt satisfies Equation (2), the point yields and begins to enter the plastic state. According to Equation (2), how much the axial stress and shear stress each account for when the bolt yields can be calculated, and thus, the degree of contribution of the axial stress and shear stress to the yielding of the bolt can be determined.
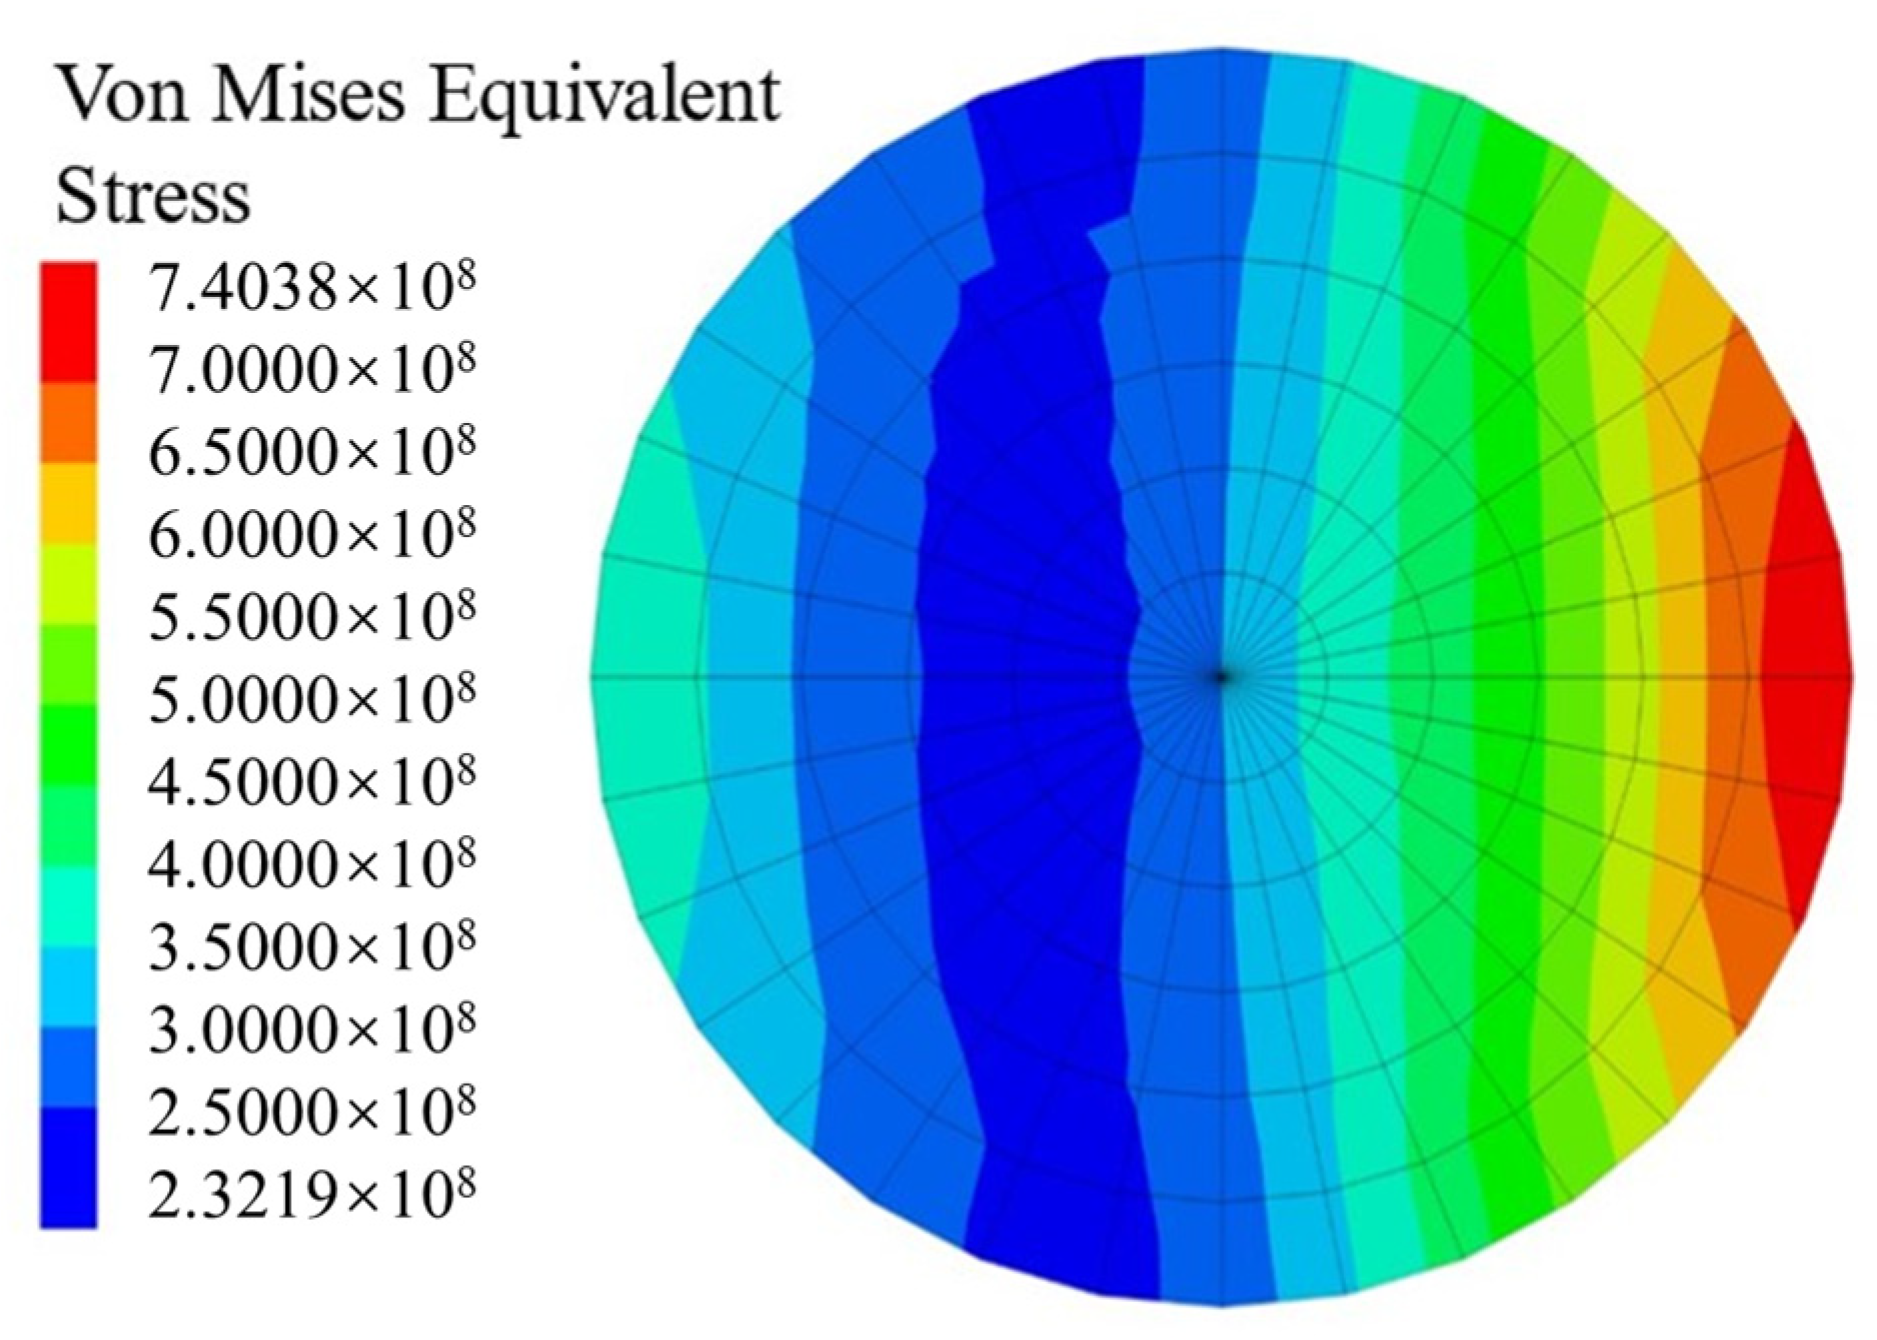
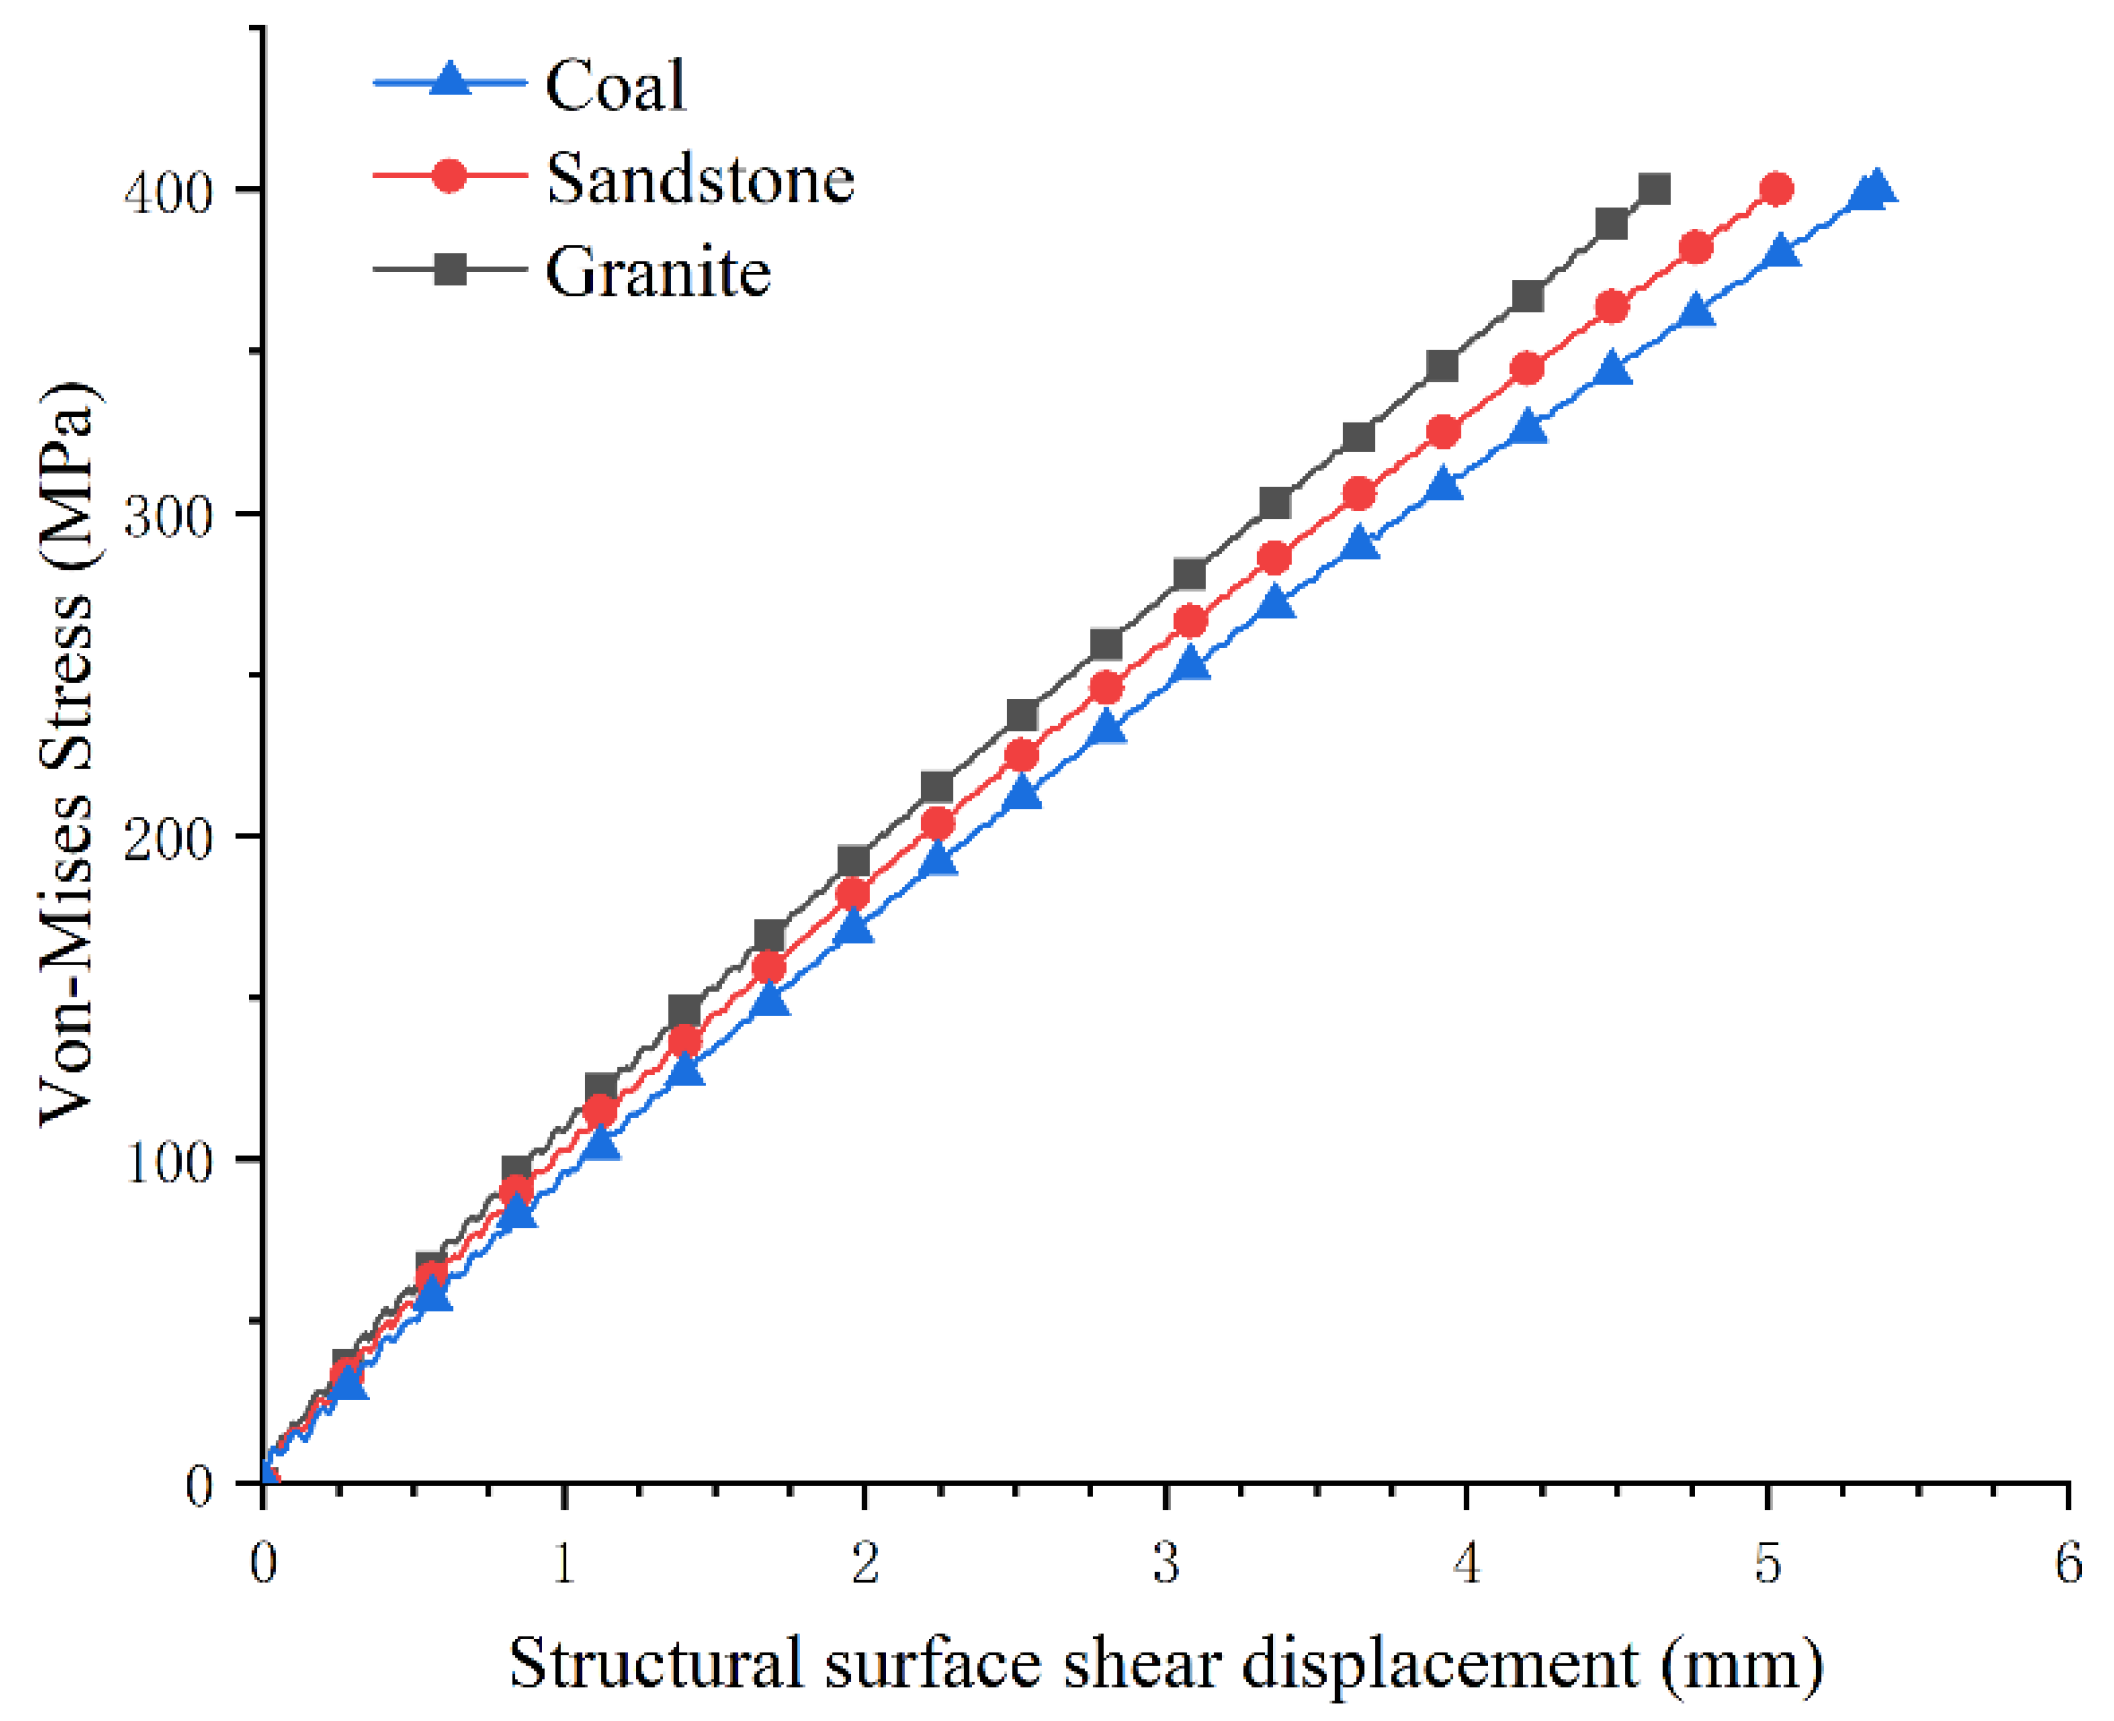
With the increase in the shear displacement of the structural surface, the stress on the bolt is the greatest near the structural surface. Taking the structural surface of sandstone as an example, the Von Mises stress of the cross-section at the location of the structural surface on the bolt when it yielded is shown in
Figure 4, which shows that the stress distribution on the cross-section was not uniform. The Von Mises stress at each node on the cross-section was determined and averaged. When the average Von Mises stress reached 400 MPa, the bolt was considered to have yielded.
Figure 5 shows the average Von Mises stress of the bolt versus the shear displacement at the bolt–structural surface intersection. When the bolt yielded in the anchored structural surface, the shear displacements of the structural surfaces of the coal, sandstone, and granite were 5.363 mm, 5.030 mm, and 4.624 mm, respectively. With the structural surface dislocation, it can be seen that the trends of the Von Mises stress of the bolt in the different lithologies of structural surfaces were roughly the same. The stronger the structural surface lithology, the larger the increase in the Von Mises stress per unit of shear displacement.
2.4. Analysis of Local Damage to Anchoring Agent
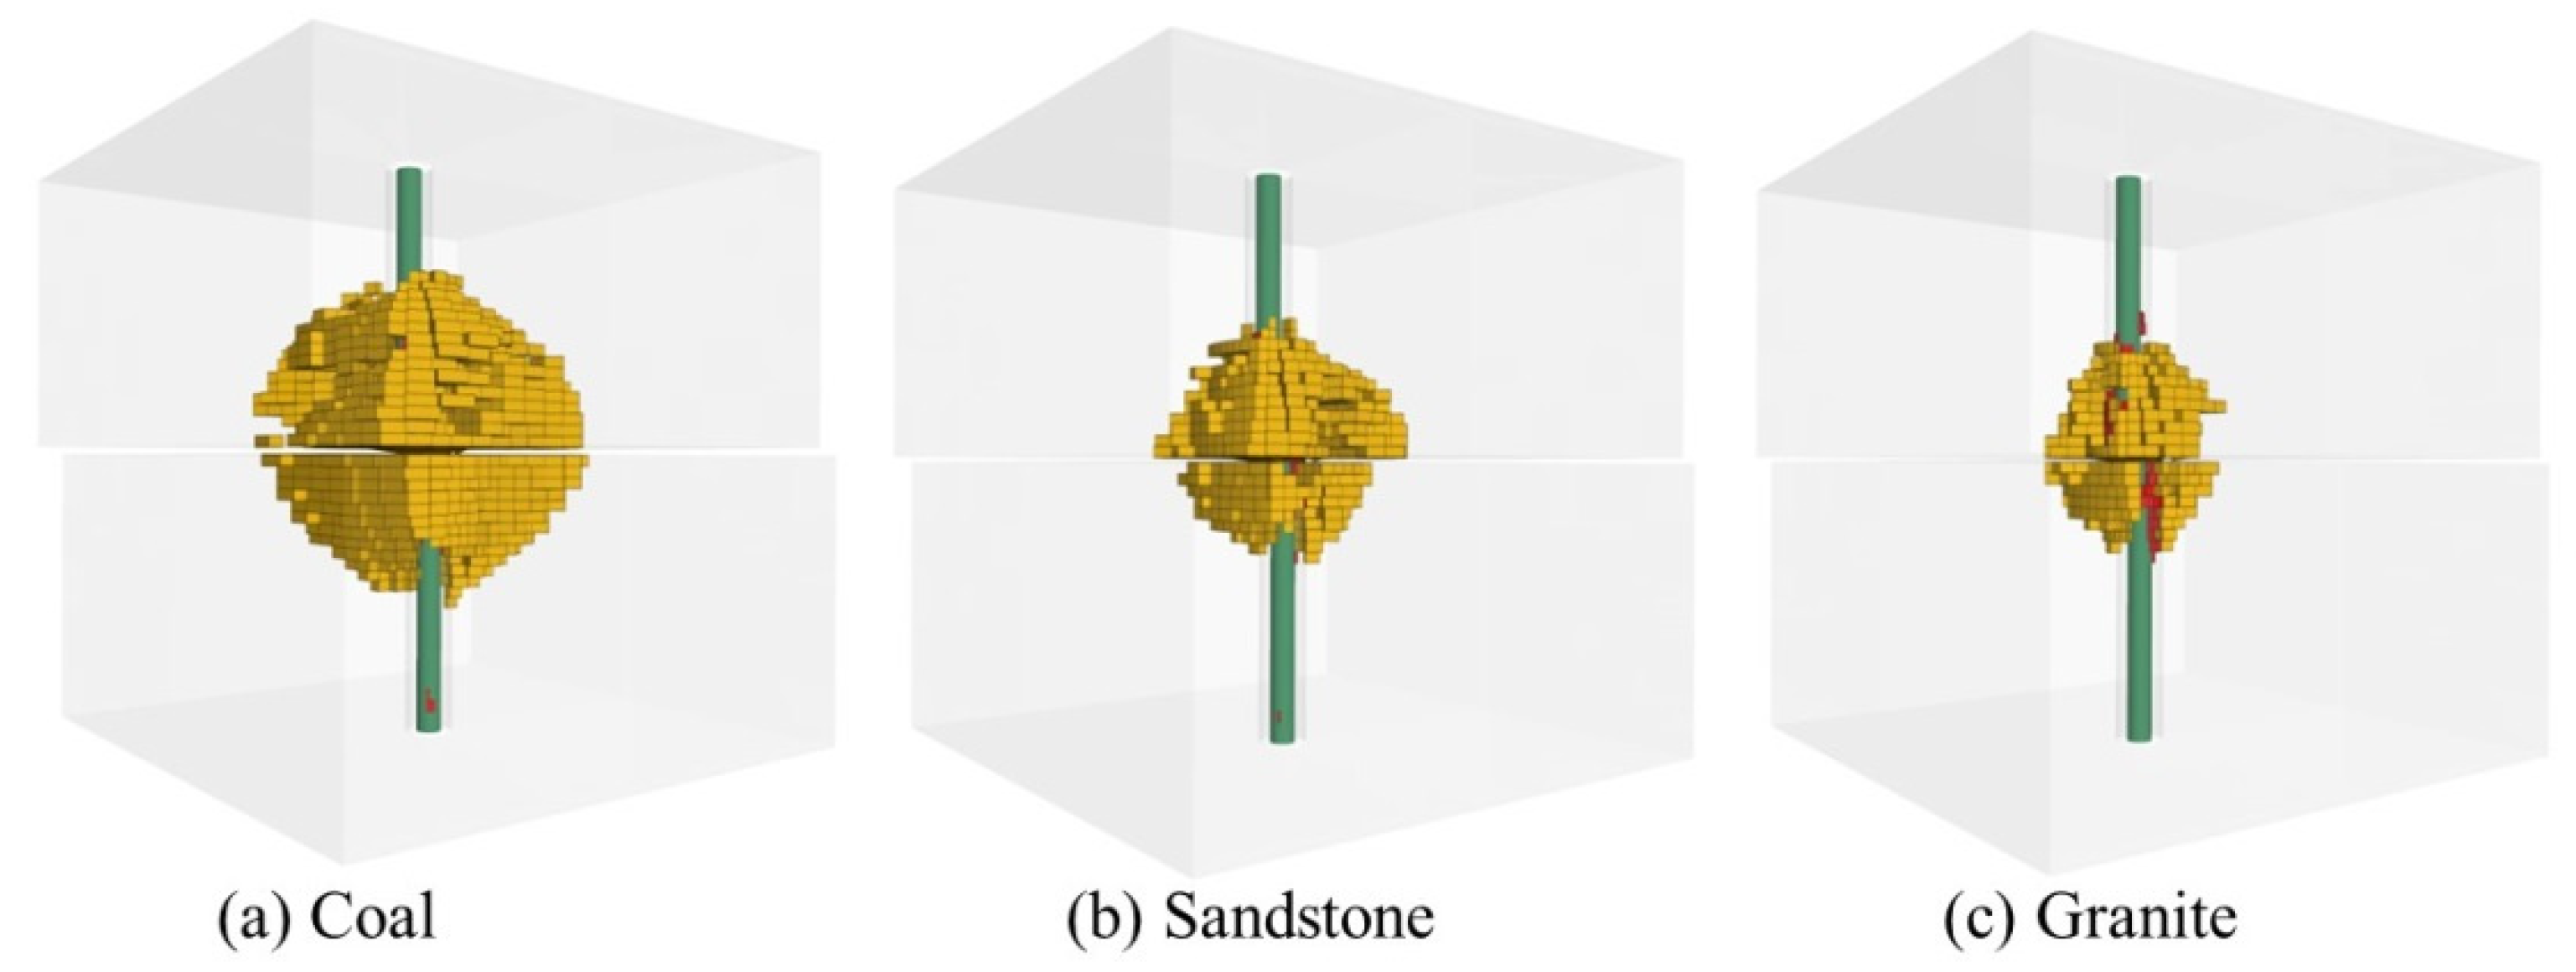
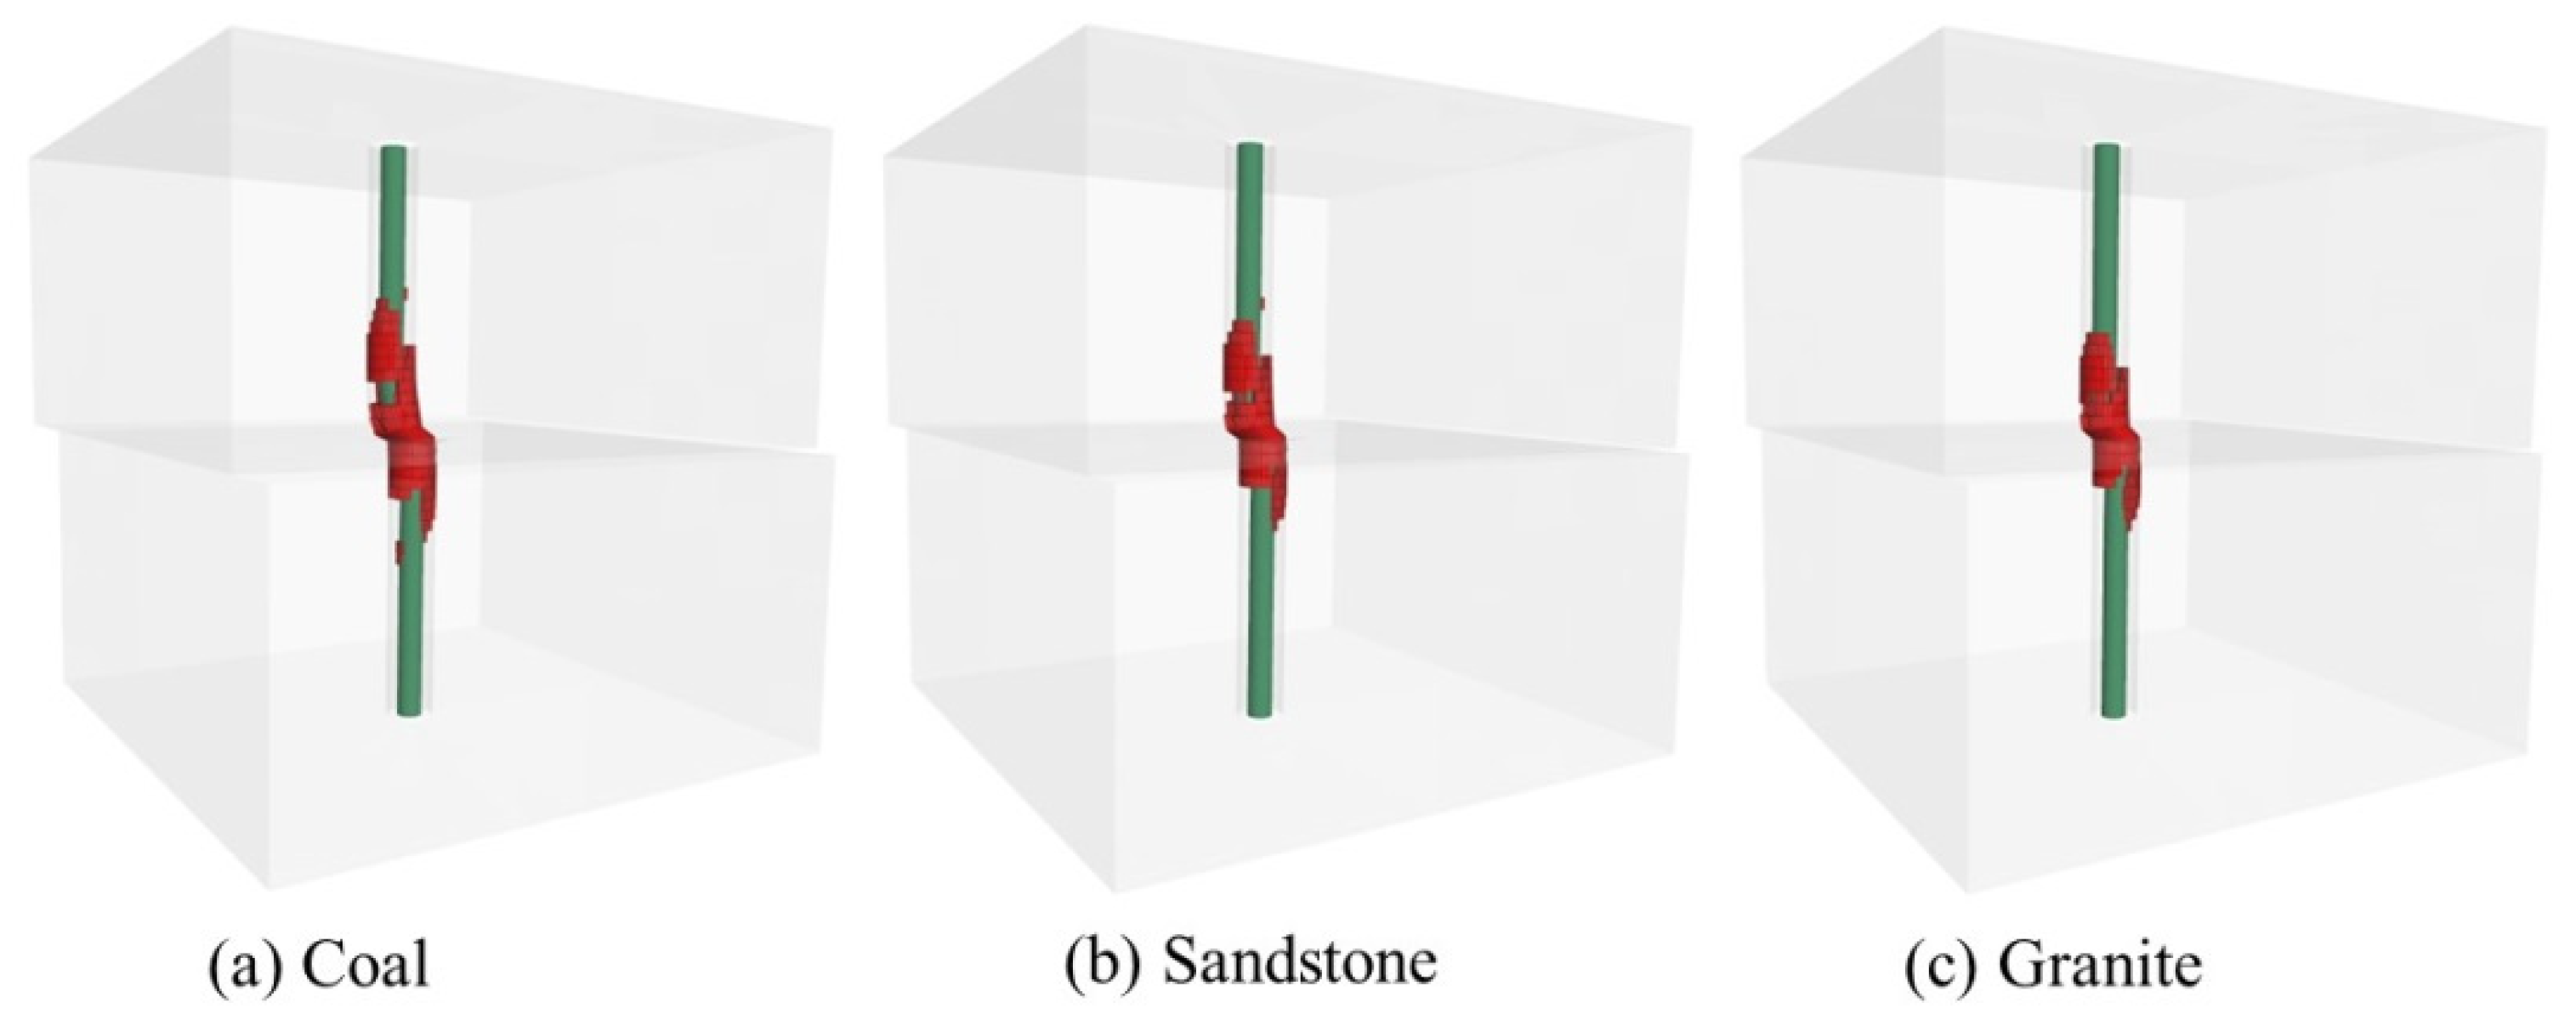
When the structural surface of a rock mass is dislocated, the surrounding rock mass and anchoring agent near the structural surface will be damaged. When the bolt in the anchored structural surface yielded, FLAC
3D was used to show the plastic zones on the surrounding rock and the anchoring agent, as shown in
Figure 6 and
Figure 7, respectively. The yellow part is the plastic zone generated by the rock mass, and the red part is the plastic zone generated by the anchoring agent. It can be seen that the plastic zone was mainly distributed near the intersection of the bolt and the structural surface. The distribution range of the plastic zone was related to the lithology of the structural surface. When the bolt yielded, the lithology of the structural surface was weaker, and the range of the plastic zone on the surrounding rock and anchoring agent was larger.
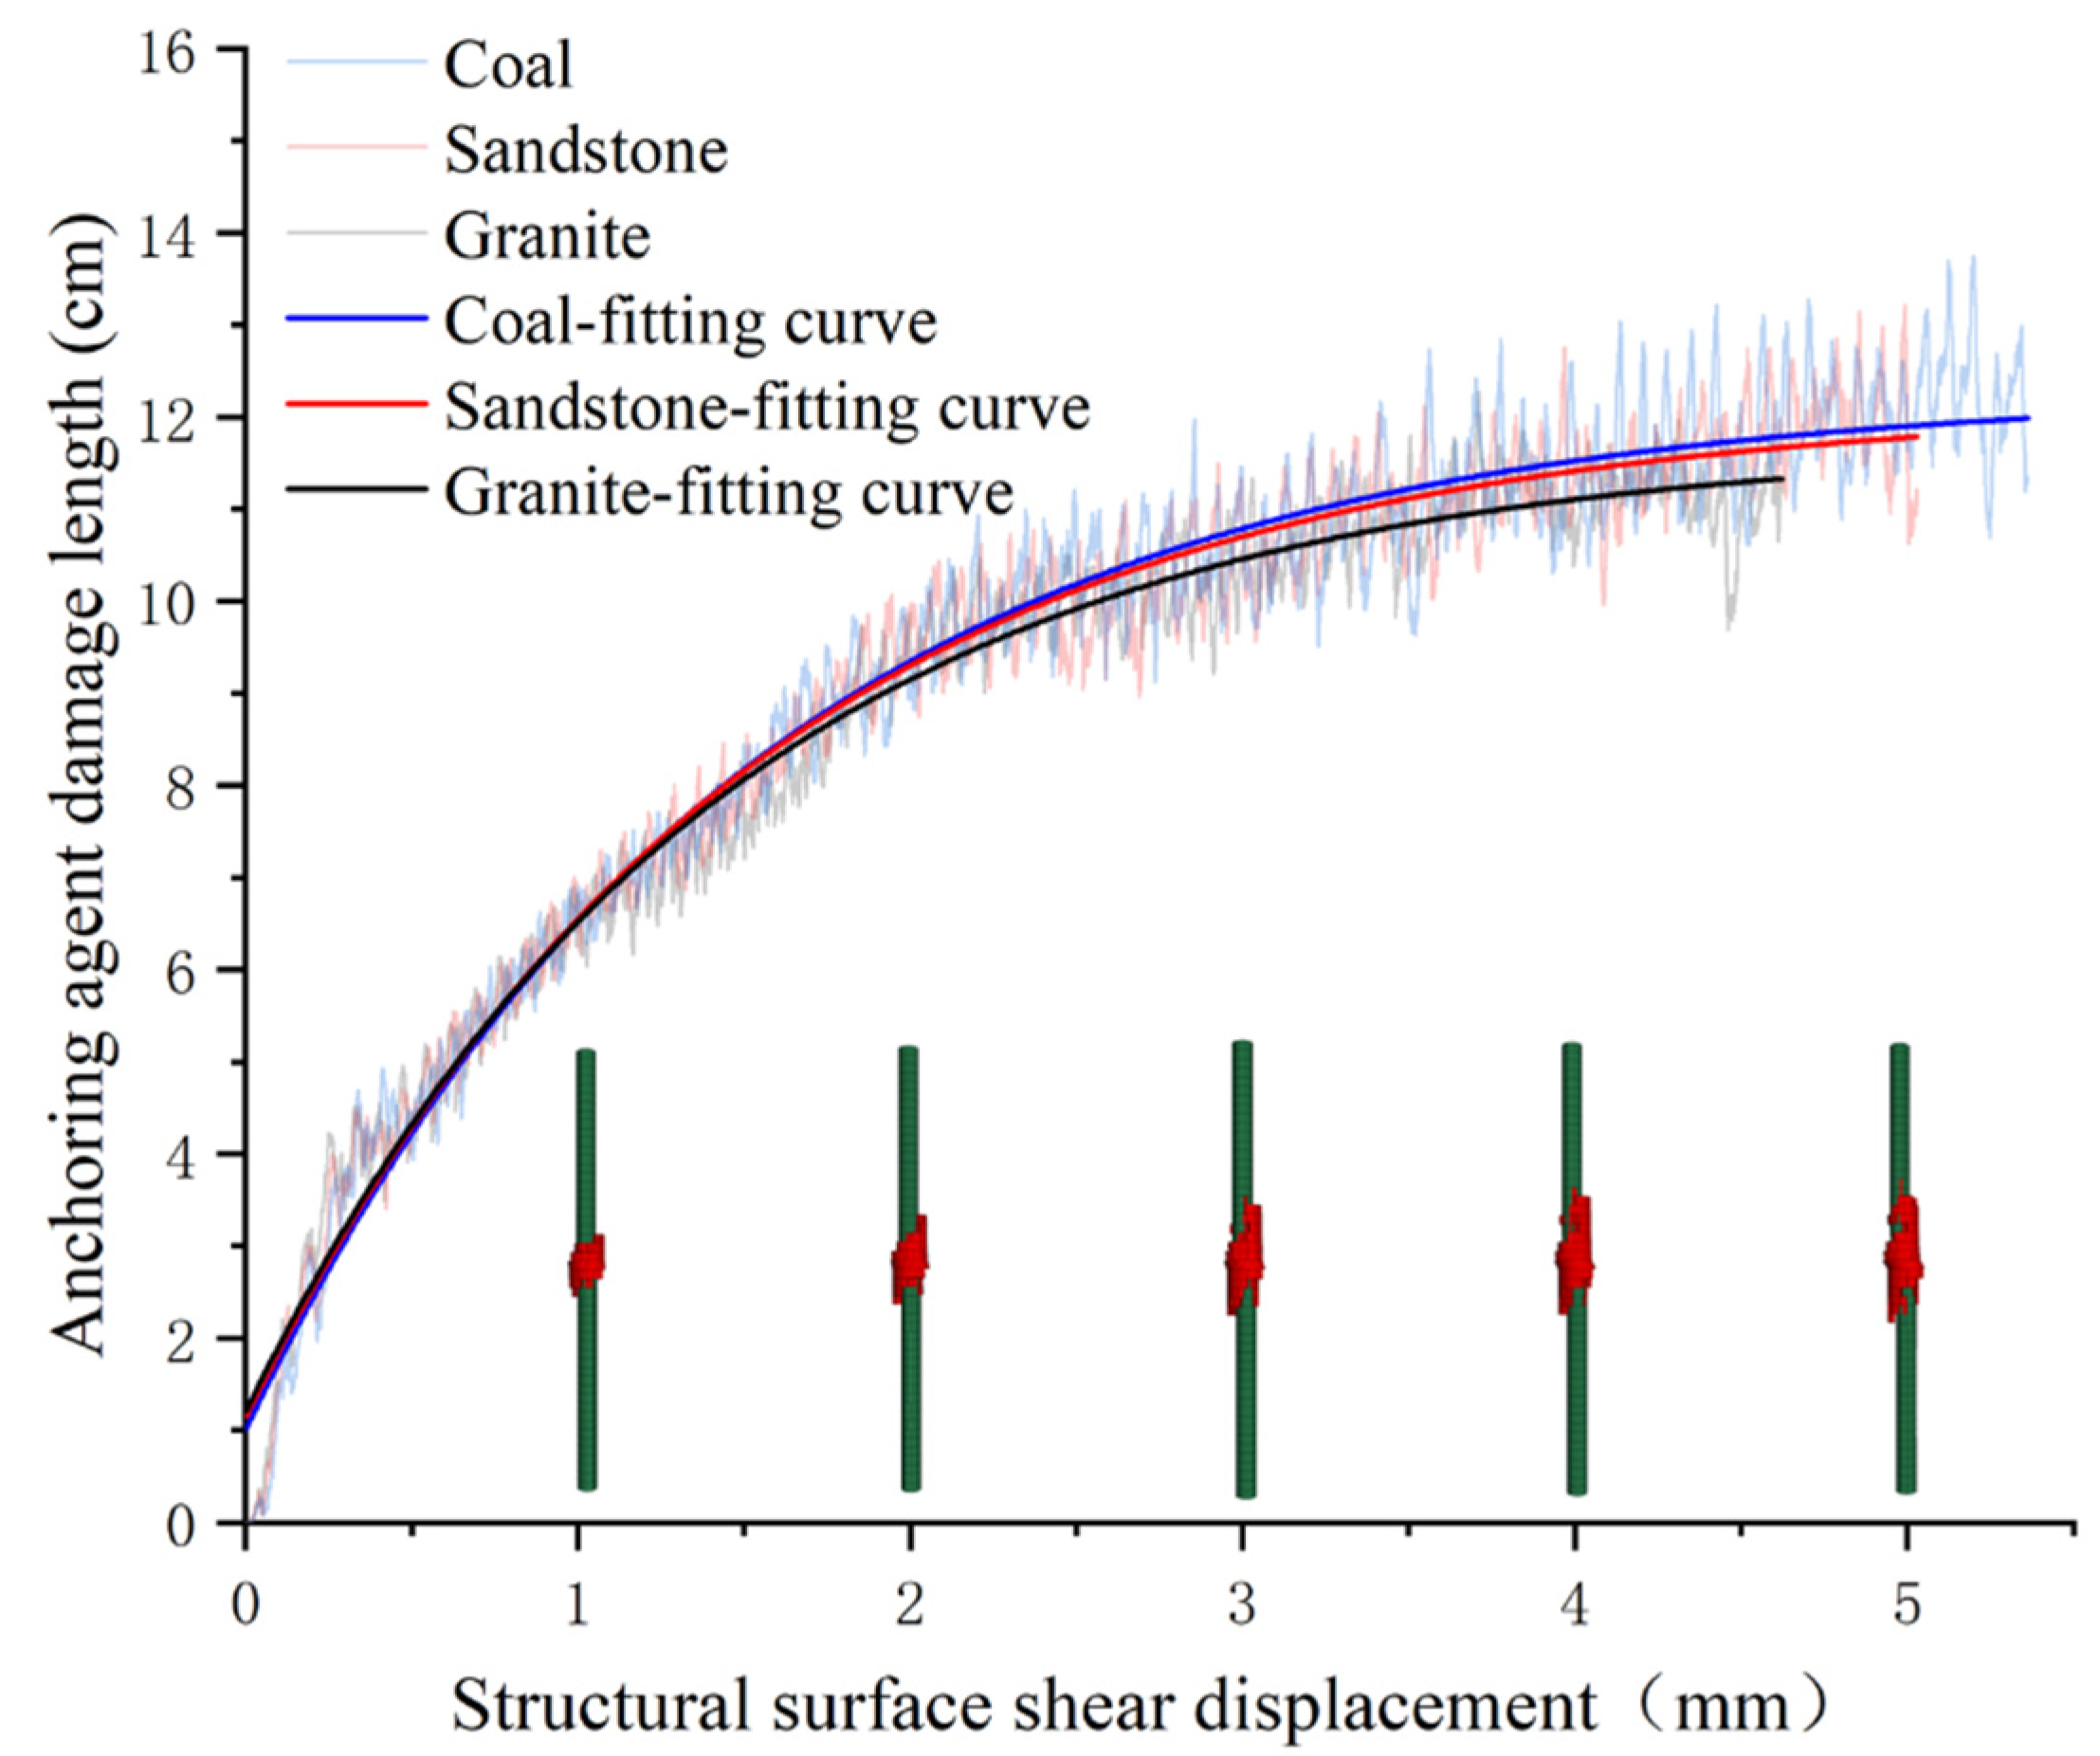
With the dislocation of the structural surface, local damage and destruction of the anchoring agent on the bolt near the structural surface occurred, so the bolt in this range was no longer restrained by the anchoring agent and was approximately free. At the same time, a large local deformation was generated. In order to obtain the damage range of the anchoring agent, FISH language was used to calculate the volume of the plastic element generated by the anchoring agent with the structural surface dislocation. The area of the cross-section of the anchoring agent was 1.0048 × 10
−3 m
2. Since the plastic zone of the anchoring agent was concentrated near the structural surface, the damage range of the anchoring agent could be obtained by dividing the volume of the plastic zone by the cross-sectional area of the anchoring agent, and the curve is shown in
Figure 8.
An exponential fit to the structural surface shear displacement–anchoring agent damage length curve was performed with the following fitting functions:
Coal:
Sandstone:
Granite:
where a is the length of the anchoring agent damage range in cm and l is the shear displacement of the structural surface in mm.
The shear displacements of the structural surface when the bolt yielded in the coal, sandstone, and granite structural surfaces were 5.363 mm, 5.030 mm, and 4.624 mm, respectively, and the corresponding damage ranges of the anchoring agent were 12.2132 cm, 11.9077 cm, and 11.3664 cm. It can be seen that the variation laws of the damage range curves of the anchoring agents of different rock mass structural surfaces were roughly the same. With the dislocation of the structural surface, the damage range of the anchoring agent first increased rapidly and then tended to level off. Under the same shear displacements of the structural surfaces, the lithologies of the structural surface rocks were stronger, and the extent of the anchoring agent damage was smaller.
2.5. Deformation and Stress Characteristics of the Bolt
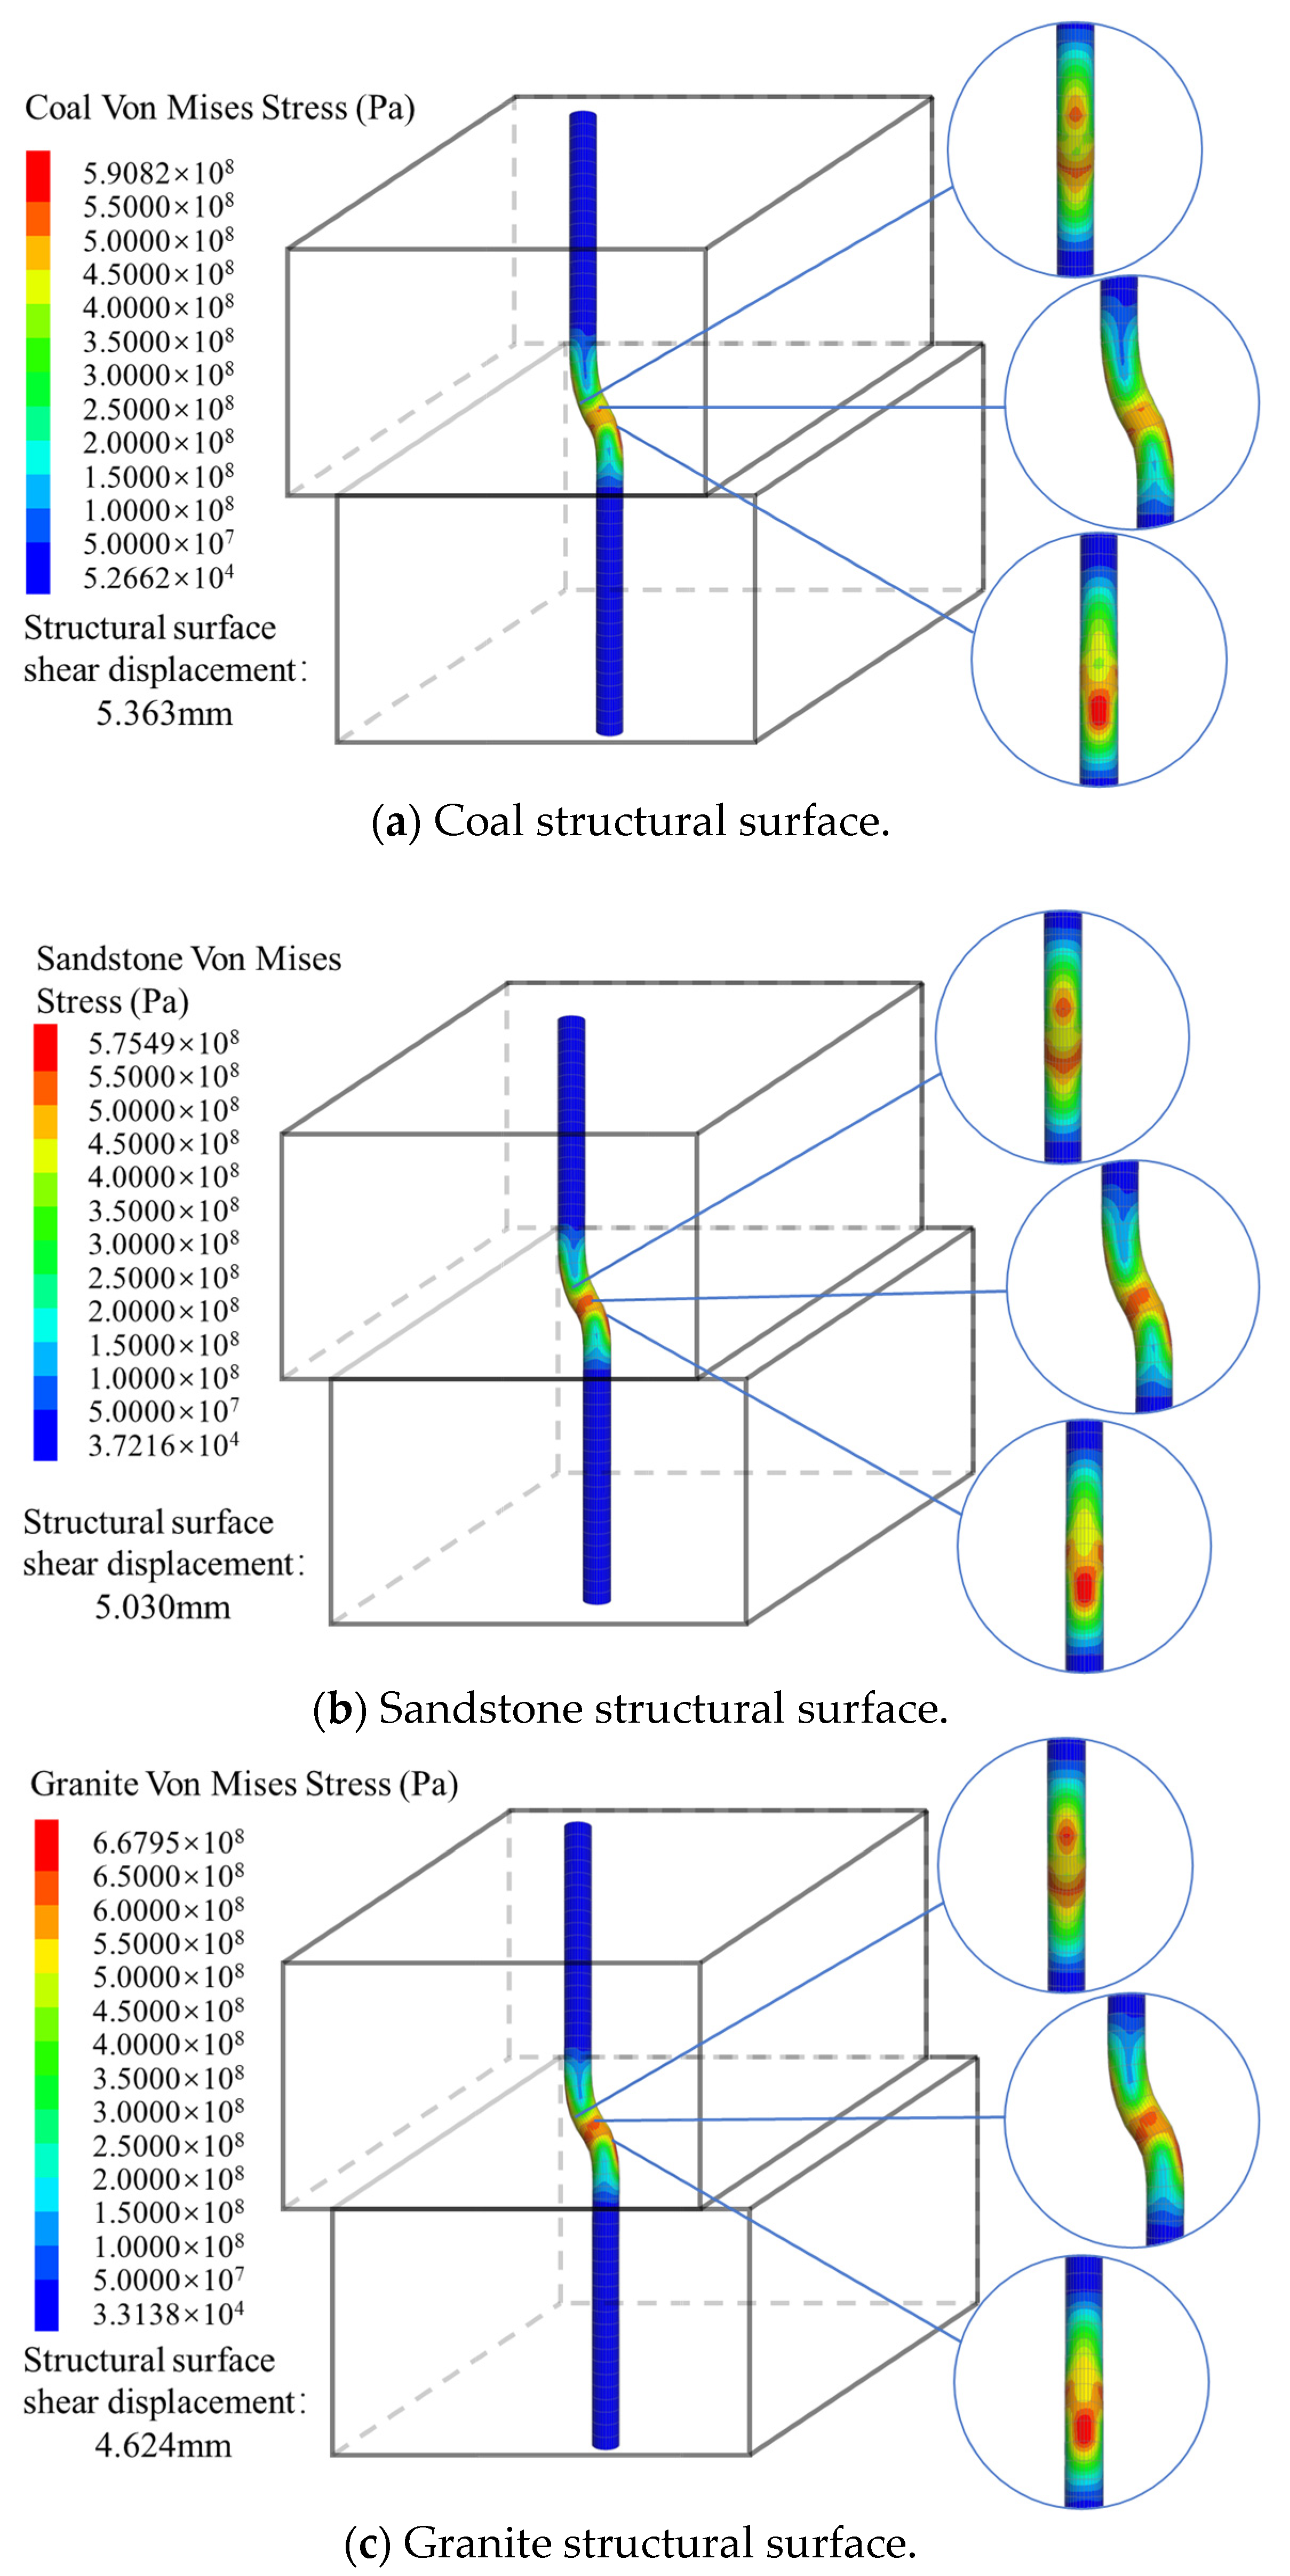
The Von Mises stress intensity of the bolt when it yielded in the coal, sandstone, and granite structural surfaces is shown in
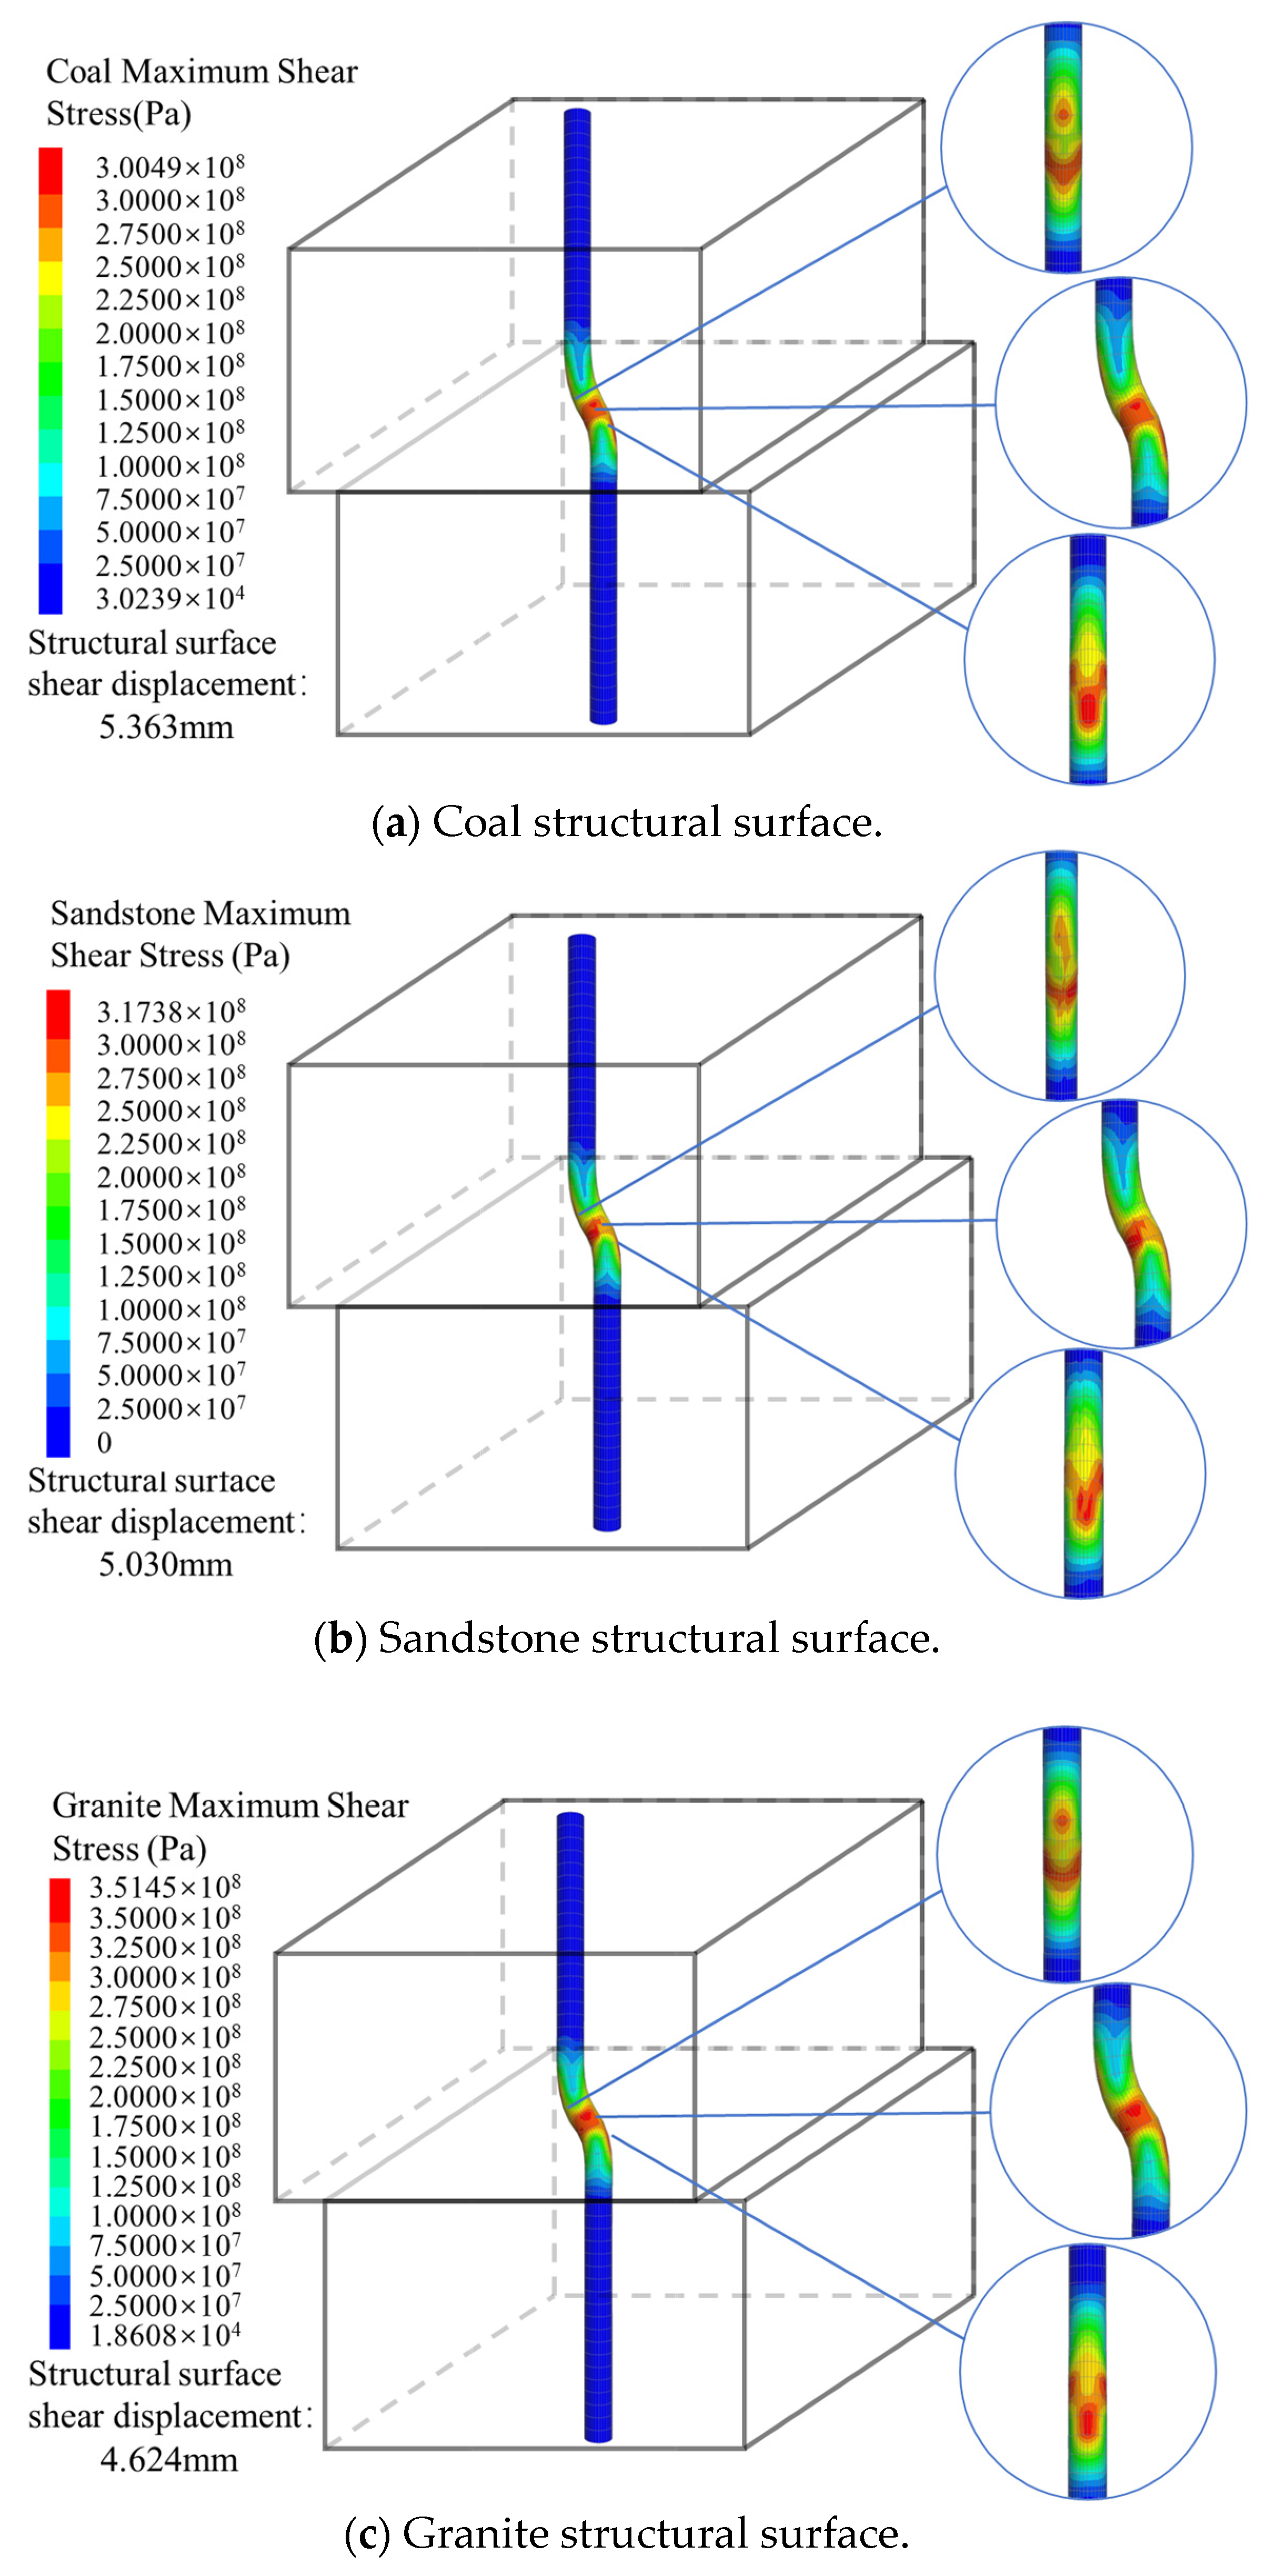
Figure 9. The maximum shear stress is shown in
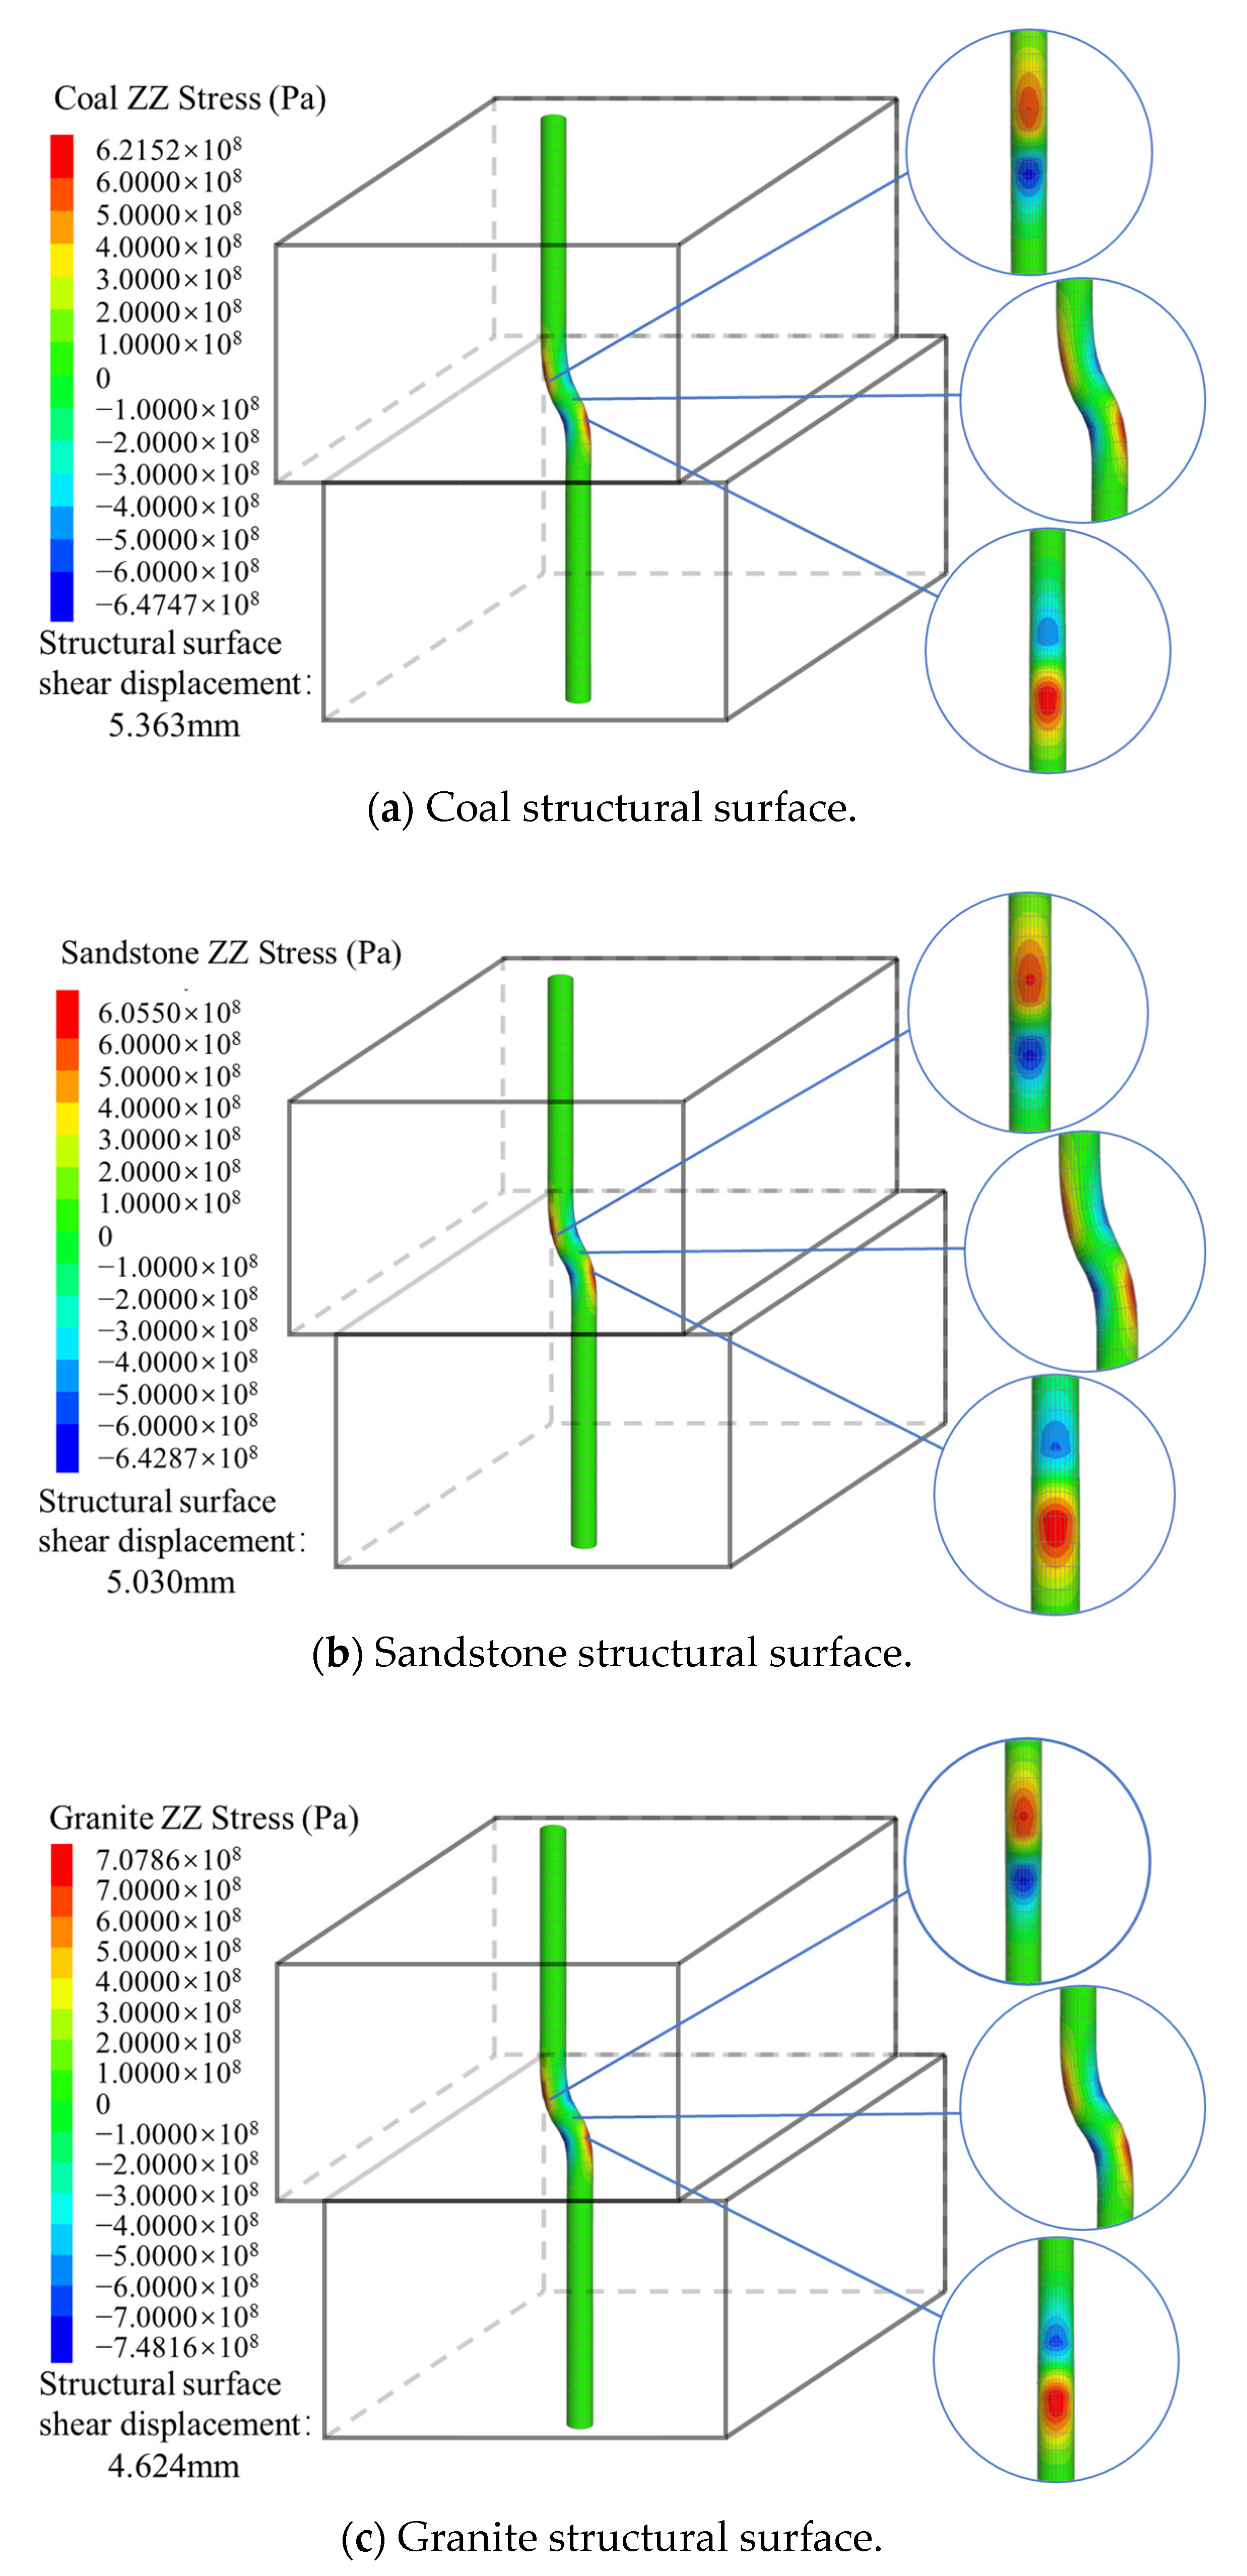
Figure 10, and the axial stress is shown in
Figure 11. It can be seen that the areas where the bolt deformation occurred were mainly distributed near the structural surfaces. From the simulation results, when the bolt yielded, the lengths of the bolt deformation areas in the structural surfaces of the coal, sandstone, and granite were 12.3193 cm, 11.9166 cm, and 11.4171 cm, respectively, which are approximately the same as the damage ranges of the anchoring agents. The deformation areas of the bolt were mainly concentrated near the structural surfaces, and the areas of the bolt far away from the structural surfaces were almost not deformed. The local deformation of the bolt was roughly “S” shaped.
The stress state of each part of the bolt was monitored, and the stress distribution diagrams of the bolt are shown in
Figure 10 and
Figure 11. It can be seen that the shear stress on the bolt was mainly concentrated near the structural surface and the angle between the maximum shear stress and the structural surface is approximately 45°. The axial stress of the bolt shows an approximately origin-symmetric stress distribution on both sides of the structural surface, where the tensile stress is positive, and the compressive stress is negative. With the shear displacement of the structural surface, the bolt deformation appears as a tensile stress zone and a compressive stress zone. The simulation results show that when the bolt yielded, the average axial stresses on the bolt near the structural surfaces of the coal, sandstone, and granite were 221.36 MPa, 201.78 MPa, and 188.69 MPa, respectively, and the average shear stresses were 114.01 MPa, 194.56 MPa, and 230.63 MPa. It was found that the weaker the lithology of the structural surface rock was, the larger the deformation area of the bolt, the larger the tensile stress of the bolt, and the smaller the corresponding shear stress.
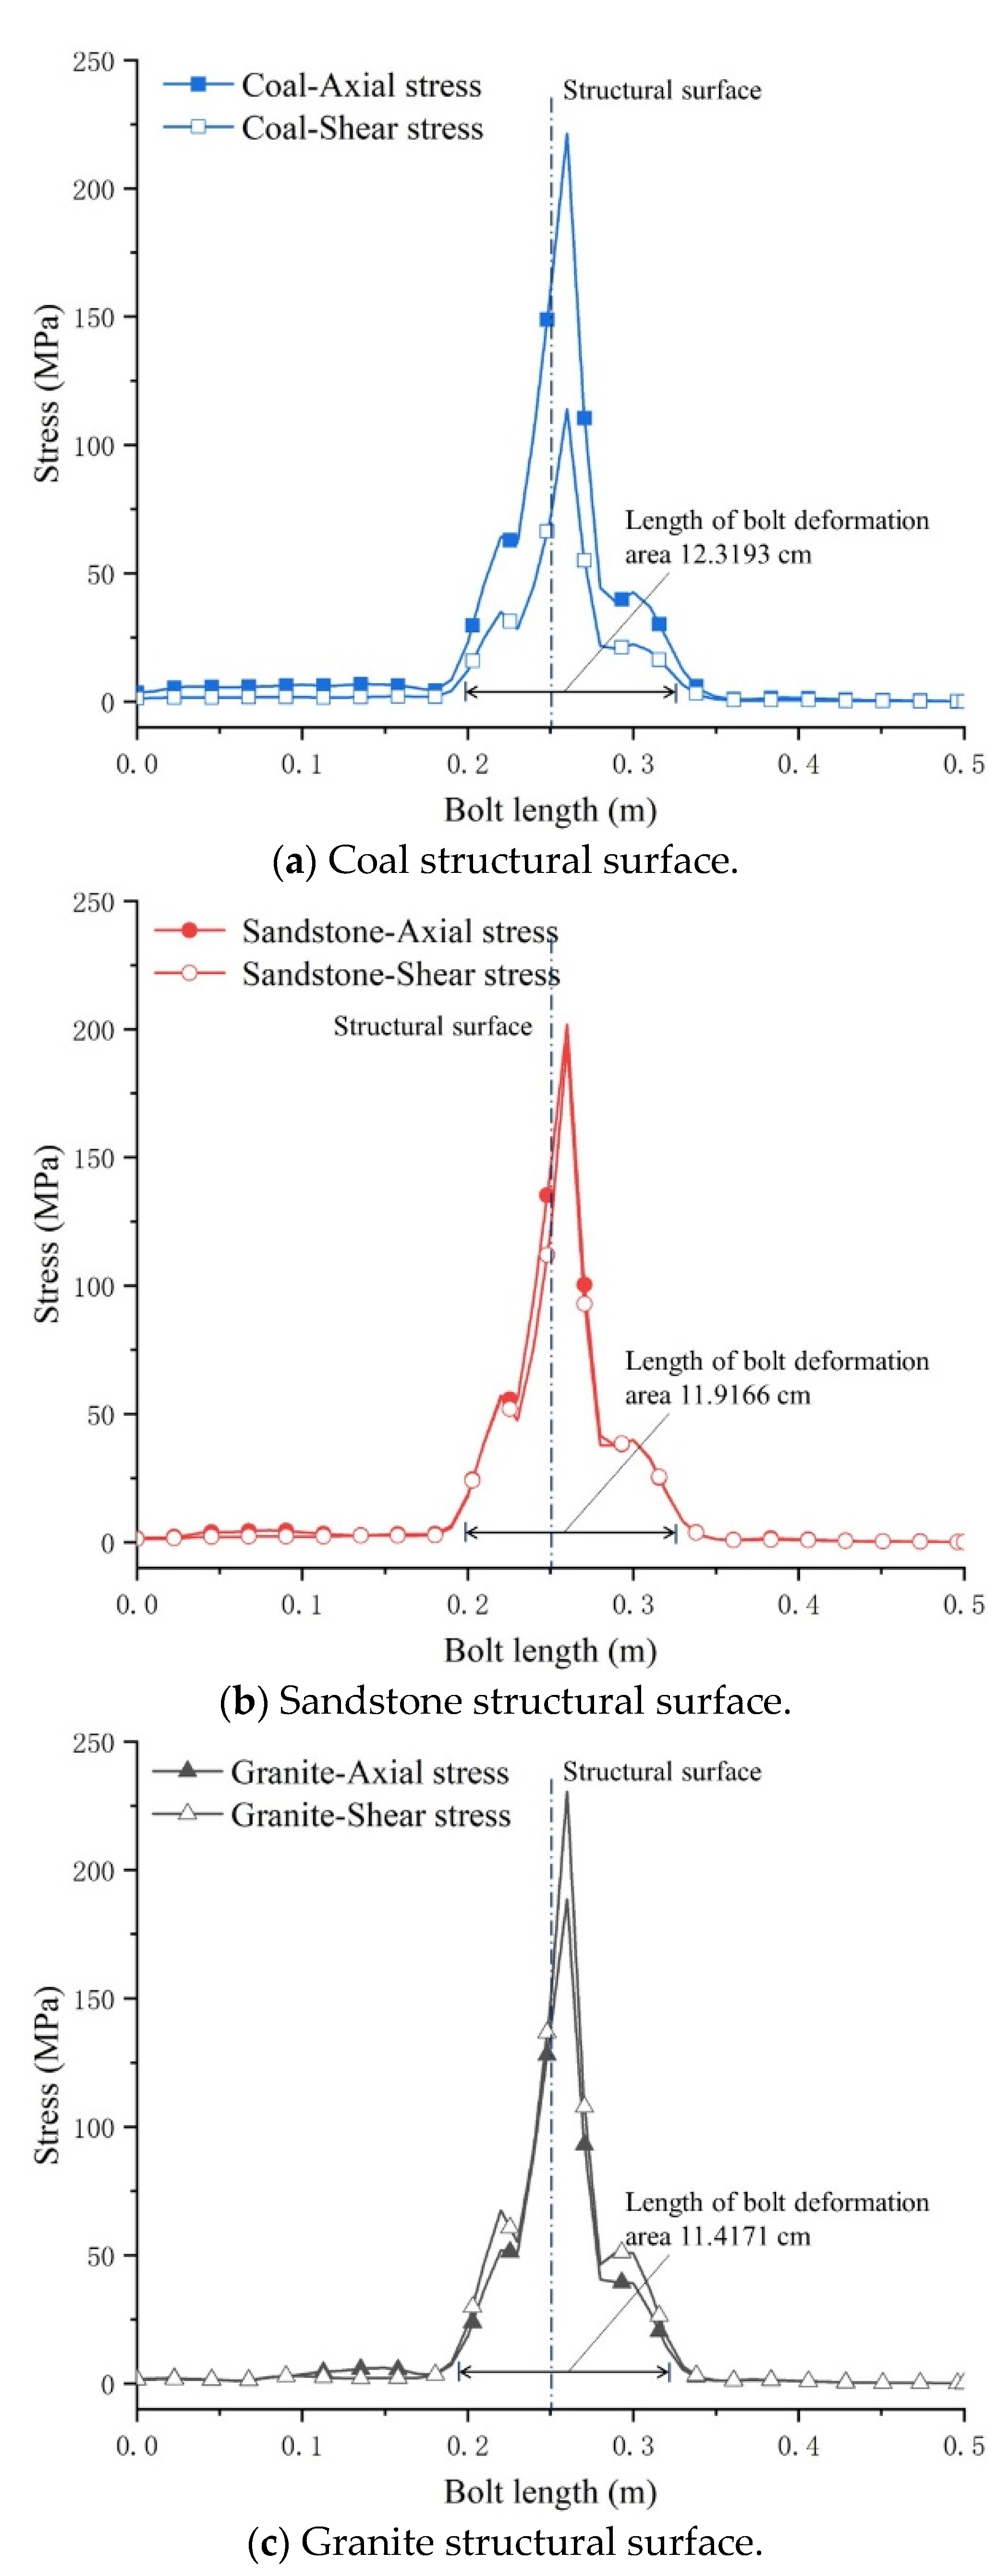
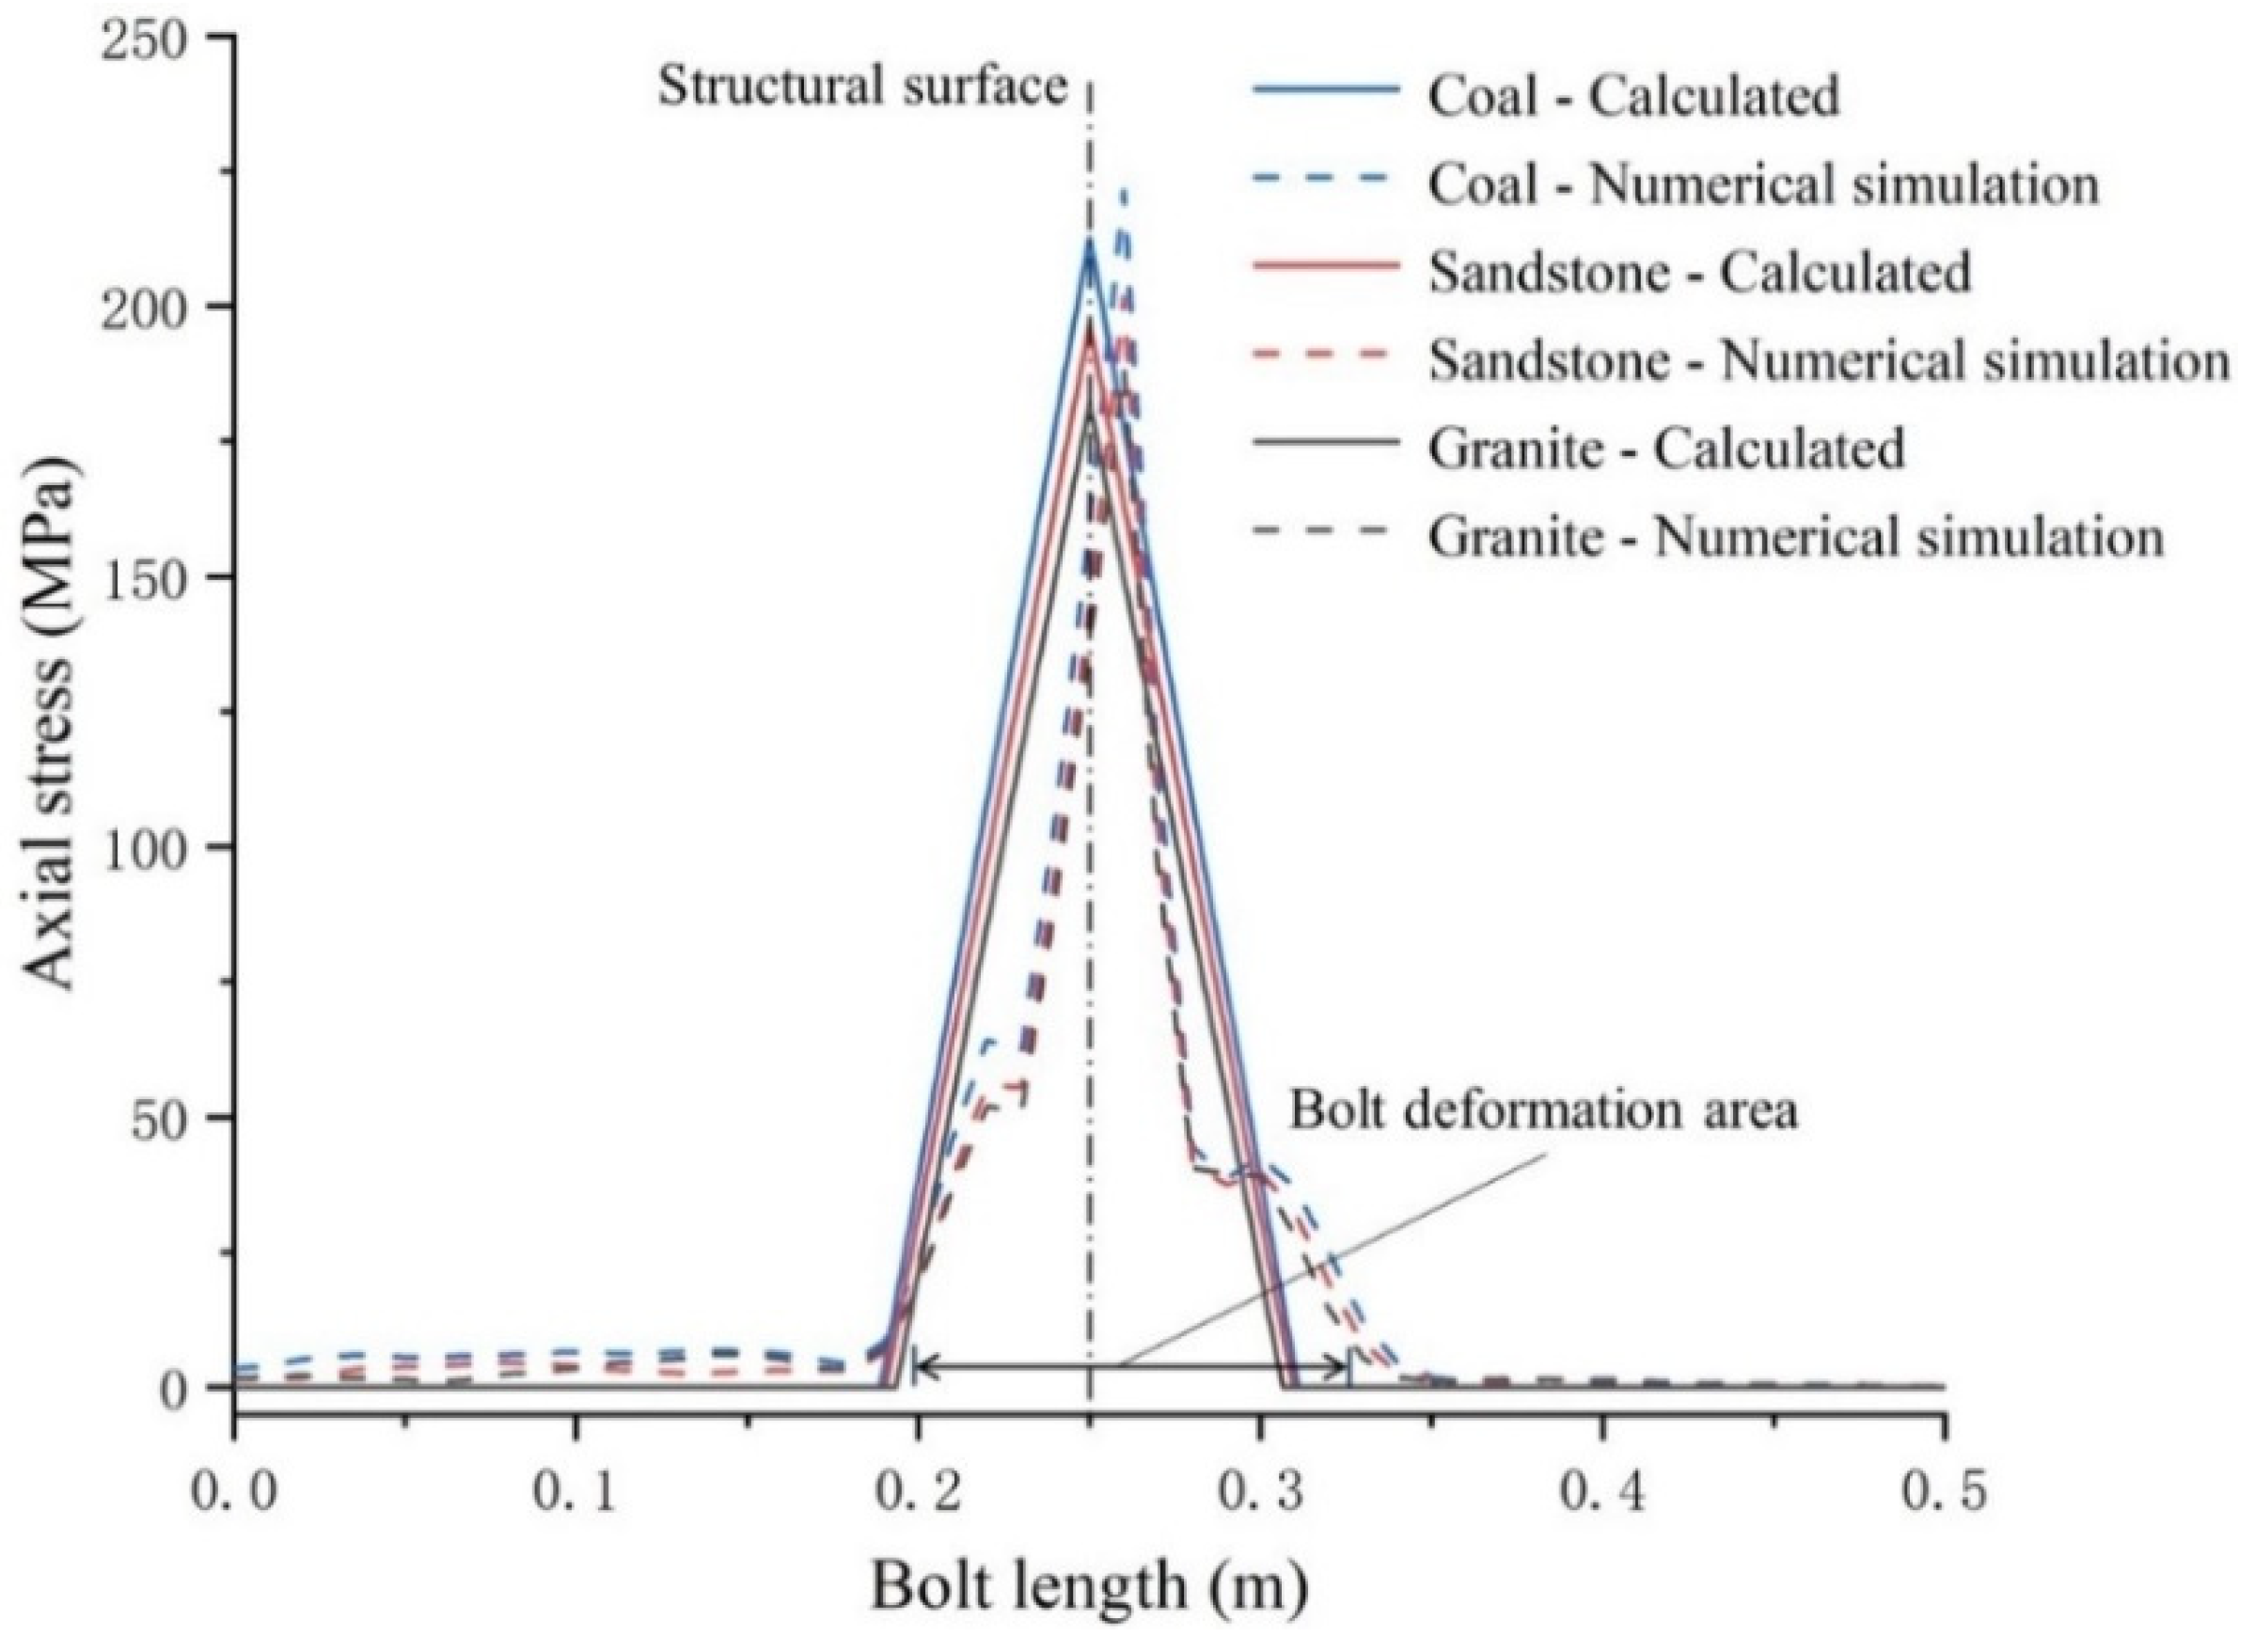
The distributions of the average axial stress and average shear stress along the length of the bolt when it yielded in the structural surfaces of coal, sandstone, and granite rock are shown in
Figure 12. It can be seen that the areas where deformation occurred on the bolt were mainly concentrated near the structural surface, and the maximum value of stress was at the position to the right of the structural surface. This mild asymmetry was due to the fact that the loading was applied to the rock below the structural surface, which made the deformation of the bolt at the slightly lower position near the structural surface somewhat larger. When the bolt yielded, the contribution of the axial stress and shear stress to the yielding varied among the different lithologies. According to Equation (2), the contribution of the axial stress was 30.63% when the bolt yielded in the coal structural surface, 25.25% when the bolt yielded in the sandstone structural surface, and 22.25% when the bolt yielded in the granite structural surface. At this time, the ratios of axial stress to shear stress at the structural surface of the bolt were 1.94, 1.04, and 0.82, respectively, which shows that the weaker the lithology of the structural face was, the higher the axial stress generated by tensile deformation, and the lower the shear stress generated by the shear action of the surrounding rock.
3. Local Deformation Characteristics of the Bolt
From the analysis of the numerical simulation in the previous chapter, it was determined that the local deformation area of the bolt was approximately the same as the damaged area of the anchoring agent. With the dislocation of the structural surface, the anchoring agent near the structural surface was damaged, which provided space for the deformation of the bolt, so in this range, it was no longer constrained by the anchoring agent and was in a free state. A schematic diagram of the bolt deformation at the bolt–structural face intersection is shown in
Figure 13.
is the length of the anchoring agent damaged area after the dislocation of the structural surface,
is the original length of the anchoring agent damage area, and
is the shear displacement of the structural surface dislocation, which is known by the geometric relationship:
It was determined that the strain
of the local deformation area of the bolt is:
The strain
in the area where the local deformation of the anchoring agent occurred was not uniformly distributed, as shown in
Figure 13. Taking the
OA section for analysis, the strain at the location of point
O at the structural surface was the largest, and the strain at the location of point
A at the distal end was the smallest. Assuming that the strain in the range was linearly distributed, the strain distribution in the local deformation area of the bolt is:
The axial stress distribution in this local deformation region is:
At the same time, with the dislocation of the structural surface, the bolt originally anchored at an angle of 90° was deformed near the structural surface, making the anchoring angle less than 90°. So, the axial force can be decomposed into normal force
and tangential force
, and, from the geometric relationship, it can be obtained as follows:
Therefore, the normal force and tangential force of the bolt at the structural surface could be determined by knowing the anchor bolt cross-sectional area (
), the damage length of the anchoring agent (
), and the shear displacement of the structural surface (
). According to the fitting formula of the shear displacement of the structural surface–damage length of the anchoring agent in the previous chapter, the relevant mechanical parameters of the bolts in the different rock structural surfaces were obtained as shown in
Table 4.
The calculated axial stresses of the bolt at the structural faces of the coal, sandstone, and granite rock when the bolt yielded were 212.76 MPa, 196.54 Mpa, and 182.09 Mpa, respectively, and the axial stresses obtained from numerical simulations were 221.36 MPa, 201.78 MPa, and 188.69 MPa, respectively. The axial stress distribution along the length of the bolt is shown in
Figure 14, which shows that the calculated results of the axial stress of the bolt are in general agreement with the numerical simulation results. The bolt deformation areas in the simulation results are slightly larger than the bolt deformation area in the numerical calculation. This is because when counting the unit volume of the anchoring agent plastic zone, some parts of the anchoring agent are not fully damaged along the bolt circumference, while when calculating the anchoring agent damage range, the anchoring agent is considered to be fully damaged along the bolt circumference, thus making the calculated anchoring agent damage range slightly smaller than the anchoring agent damage range obtained from the numerical simulation. Nevertheless, the calculated distribution of the axial stresses of the bolt describes, with some accuracy, the distribution of the axial stresses at the local locations of the bolt during the shear displacement of the structural surface.
4. Reinforcement Mechanism of Structural Surface Shear Strength
With the dislocation of the structural surface, the axial stress generated by the local tensile action of the bolt could be decomposed into normal stress and tangential stress, which were applied to the structural surface and improved the shear strength of the structural surface. The stresses under the local action of the bolt at the structural surface are shown in
Table 5.
According to the equation of the shear strength of the anchorage structural surface proposed by Ge [
4],
where
is the shear strength of the structural surface itself;
is the shear strength of the structural surface lifted by the shear stress generated by the shear action of the surrounding rock;
is the converted shear strength of the structural surface caused by the normal component of the axial force of the bolt;
is the converted shear strength of the structural surface caused by the tangential component of the axial force of the bolt.
It is known that the increase in the shear strength of the structural surface due to the bolt (
) is:
It is known that the increase in the shear strength of the structural surface due to the tensile action of the bolt (
) is:
where
,
,
.
is the axial stress of the bolt (positive in tensile stress);
is the average shear stress of the bolt;
is the friction angle of the structural surface;
is the installation angle of the bolt, which is the angle between the direction of shear displacement of the structural surface and the bolt on the same side.
is the ratio of the cross-section of the bolt to the area of the structural surface crossed by a single bolt. In the model, the cross-sectional area of the bolt was 1.3847 × 10
−3 m
2, and the structural surface area was 0.25 m
2. The calculated
is 1.3847 × 10
−3.
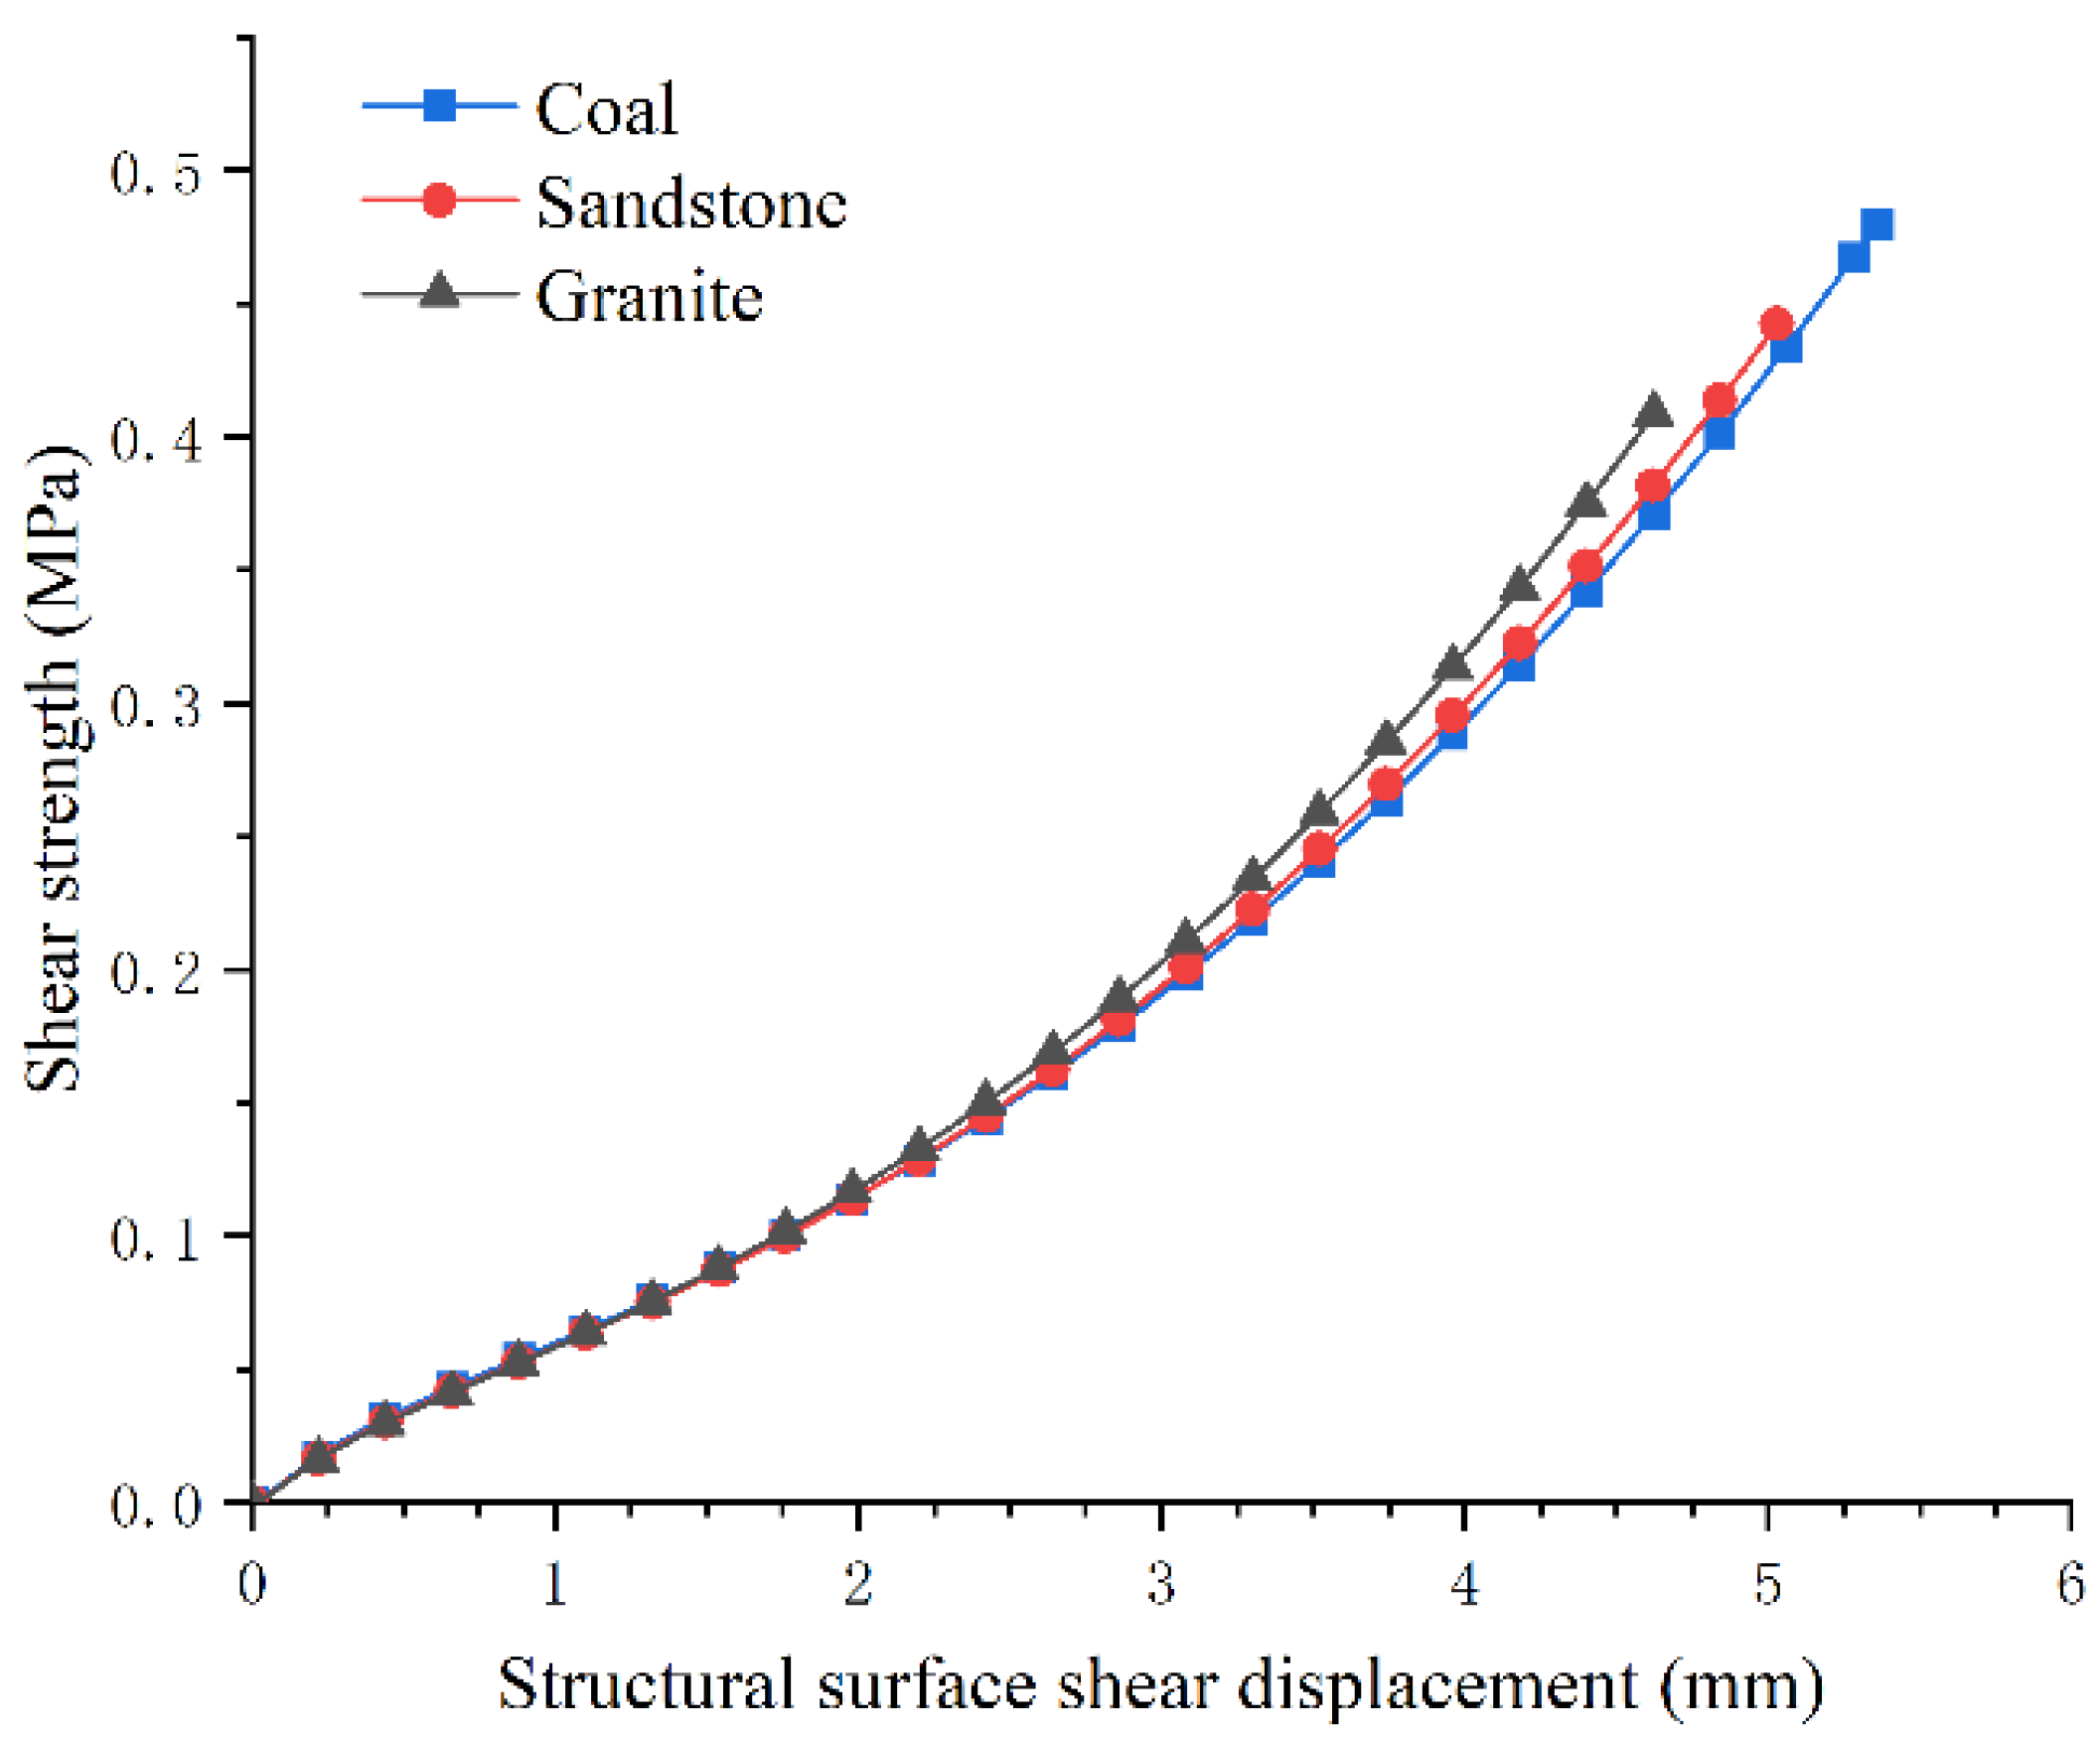
With the dislocation of the structural surface, the curve diagram of the tensile action of the bolt to reinforce the shear strength of the structural surface is shown in
Figure 15. With the increase in the shear displacement of the structural surface, the curve of the shear strength of the structural surface lifted by the bolt tensile action at the structural surface had the characteristics of slowly lifting at first and then quickly lifting. When the bolt yielded, the shear strengths of the structural surfaces lifted by the bolt’s local tensile action of coal, sandstone, and granite were 0.48 MPa, 0.44 MPa, and 0.40 MPa, respectively. Compared to the granite structural surface, the ratios of the shear strength of the coal and sandstone structural surfaces were 20% and 10%, respectively, when the bolt yielded. It can be seen that the better the nature of the structural surface rock under the unit shear displacement of the structural surface, the better the ability to reinforce the shear strength of the structural surface. However, the bolt yielded under the small shear displacement of the structural surface, so the final shear strength of the enhanced structural surface was less than that of the weak lithology.
A polynomial fitting of the structural surface shear displacement–reinforcing shear strength curve was carried out. The fitting functions are as follows:
Coal:
Sandstone:
Granite:
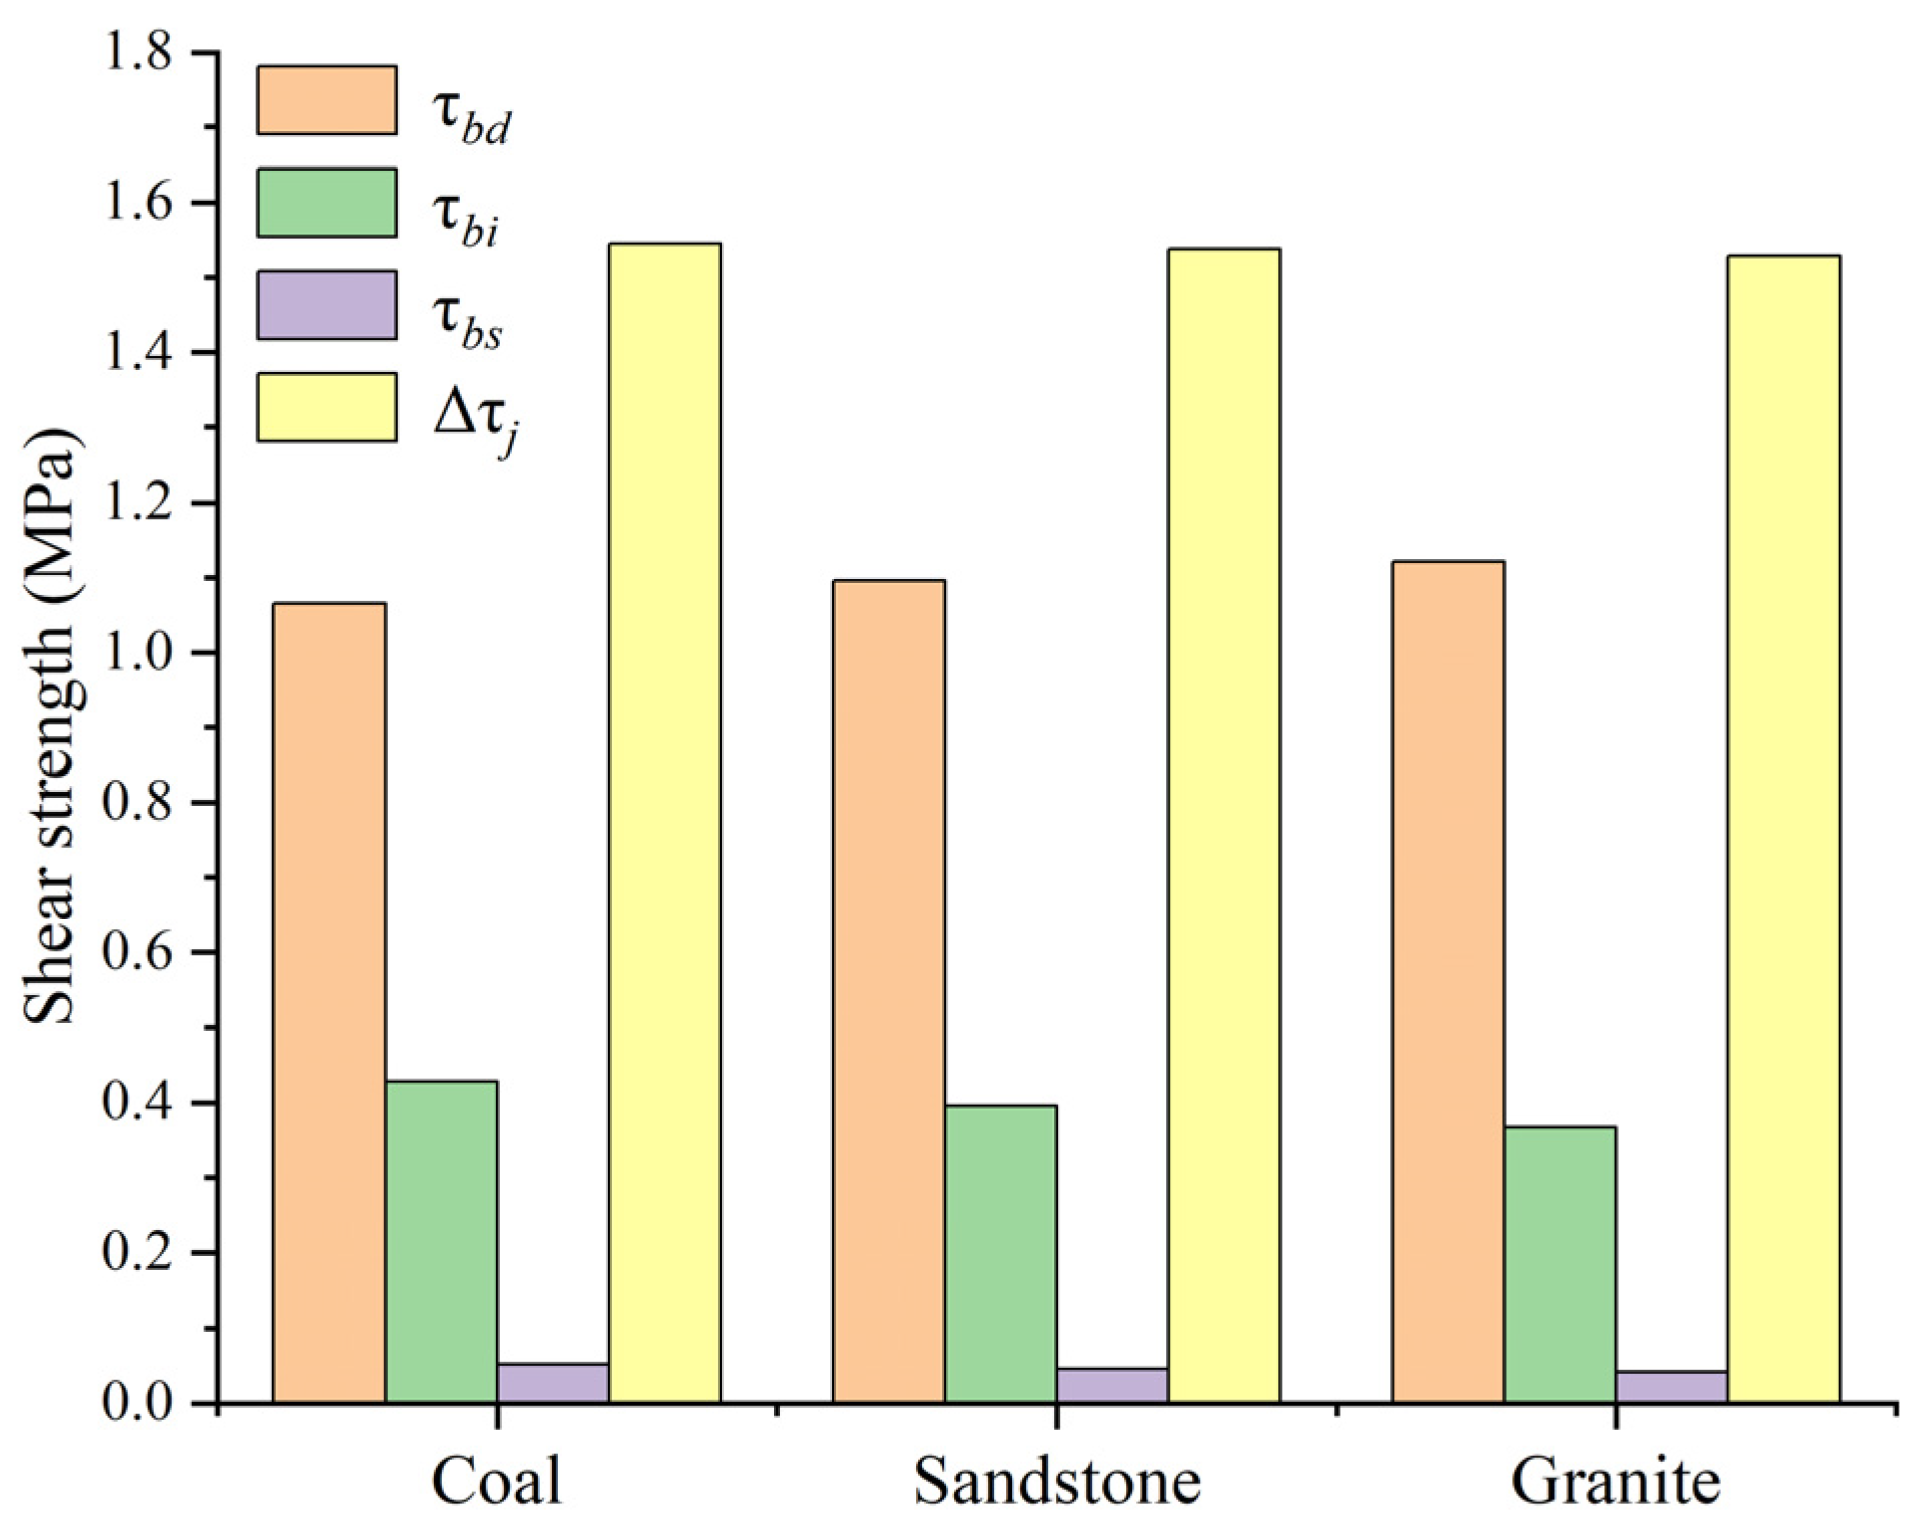
In addition to the bolt tensile action that can improve the shear strength of the structural surface in the case of dislocation, there is also the pinning action of the bolt that hinders the shear movement of the surrounding rock, which can also enhance the shear strength of the structural surface. When the bolt yielded with the dislocation of the structural surface, the tensile effect of the bolt and the pinning effect increased the shear strength of the structural surface, as listed in
Table 6, and the corresponding bar graph is shown in
Figure 16. The shear strengths of the enhanced structural surfaces were 1.5451 MPa, 1.5377 MPa, and 1.5289 MPa when the bolt yielded in the coal, sandstone, and granite structural surfaces, respectively. It can be seen that the magnitudes of the total structural face shear strength enhanced when the bolts yielded in different structural surfaces of the rock mass were approximately equal. In the coal, sandstone, and granite structural surfaces, the shear strength of the enhanced structural surfaces by the bolt pin action accounted for 68.91%, 71.27%, and 73.33% of the total enhanced shear strength, respectively, and the shear strength of the enhanced structural surfaces by the anchor tensile action accounted for 31.09%, 28.73%, and 26.67% of the total enhanced shear strength, respectively. Therefore, in the case of the dislocation of the structural surface, both the pinning and tensile action of the bolt can improve the shear strength of the structural surface, and the pinning action of the bolt plays the main role. With the weakening of the lithology of the surrounding rock containing the structural surface, the contribution of the pinning action to the shear strength of the enhanced structural surface decreased, and the contribution of the tensile action to the shear strength of the enhanced structural surface increased.
When the bolt yielded with the dislocation of the structural surface, the tensile effect of the bolt and the pinning effect under the unit shear displacement increased the shear strength of the structural surface, as listed in
Table 7, and the corresponding bar graph is shown in
Figure 17. The shear strengths of the enhanced structural surfaces at the unit shear displacement were 0.2881 MPa, 0.3057 MPa, and 0.3307 MPa when the bold yielded in the coal, sandstone, and granite structural surfaces, respectively. It can be seen that the better the lithology of the structural surface rock, the greater the shear strength of the structural surface enhanced by the bolt at the unit shear displacement. In the coal, sandstone, and granite structural surfaces, the shear strengths of the enhanced structural surfaces by the bolt pin action under unit shear displacement accounted for 68.90%, 71.87%, and 73.33% of the total enhanced shear strength, respectively, and the shear strengths of the enhanced structural surfaces by the bolt tensile action accounted for 31.10%, 28.13%, and 26.67% of the total enhanced shear strength, respectively. Therefore, the bolt pin action still plays a dominant role in enhancing the shear strength of the structural surface at unit shear displacement.
The shear strength of the structural surface itself could be calculated from Equation (12):
where
is the cohesive force on the structural surface, 0.1 MPa;
is the internal friction angle on the structural surface, 20°;
is the normal stress on the structural surface when no bolt is applied, 3 MPa. The shear strength of the structural surface itself was calculated to be 1.19 MPa. With the dislocation of the structural surface, the ratios of the shear strengths of the structural surfaces enhanced by the bolt in the coal, sandstone, and granite structural surfaces to the shear strength of the structural surface itself at the unit shear displacement were 24.21%, 25.69%, and 27.79%, respectively. When the bolt yielded, the ratios of the total shear strengths of the structural surfaces enhanced by the bolt in the coal, sandstone, and granite structural faces to the shear strength of the structural surface itself were 129.84%, 129.21%, and 128.48%, respectively. It can be seen that the shear strength enhancement of the anchored structural surface caused by the structural surface dislocation played a considerable role in hindering the structural surface dislocation.
For the fully grouted bolt, it was generally impossible to apply a preload, but when the bolt passed through multiple structural surfaces (
Figure 18), with the deformation of the surrounding rock, each structural surface underwent different degrees of dislocation, resulting in local damage and destruction of the anchoring agent near the structural surface. Thus, the bolt in this range was no longer restrained by the anchoring agent and approximately entered the free state, at which time the bolt was passively in tensile–shear stress due to the dislocation of the structural surface. The reaction of the passive tensile–shear stress of the bolt enhanced the shear strengths of the structural surfaces, thus preventing the structural surfaces from continuing to dislocate and bringing the anchored rock to a stable state. This is a passive reinforcement mechanism of the shear strength of the structural surface under the dislocation of the anchored structural surface.
5. Discussion
In this study, firstly, the damage of the anchoring agent with the shear displacement of the structural surface was determined by numerical simulation, and the damage range of the anchoring agent along the bolt length direction was further determined. Secondly, through analysis, it was found that the bolt underwent local deformation when the structural surface dislocated, and it was concentrated near the structural surface, which was almost the same as the damage range of the anchoring agent. Finally, by theoretical calculation, the change in the axial stress of the bolt with the dislocation of the structural surface and the curve graph of the shear strength enhancement of the structural surface were obtained, and it was found that with the dislocation of the structural face, the local deformation of the bolt near the structural surface occurred. At this time, the pin action and tensile action of the bolt would enhance the shear strength of the structural surface and prevent the structural face from continuing dislocation. If the preload force applied to the bolt is considered “active support”, then the shear strength of the structure surface caused by the shear displacement of the structure surface can be called “passive support”. Based on the research of this paper, the allowable displacement of the structural surface can be obtained when the anchor bolt yields under the misalignment of the anchored structural surface, and for the anchored structural surface in the engineering, the structural surface can be considered to be in a stable state when the shear displacement is less than the allowable displacement, as shown in
Figure 19.
The analysis of the shear strength improvement of the bolt only considered the shear dislocation of the structural surface, but not the dilatancy deformation with the dislocation of the structural surface, or the problem of separation between the structural surfaces, so there are some limitations. If the dilatancy deformation or separation problem with the structural surface dislocation is considered, the bolt near the structural surface will experience significant tensile deformation, and the tensile action of the bolt will play a major role in enhancing the shear strength of the structural surface at this time. This will be the direction of the authors’ future work.

 ,
, 


