1. Introduction
Composite materials represent a combination of two or more materials into a multiphase material with no formations of new phases, so each of the constituents keeps its separate characteristics [
1]. By absorbing electromagnetic energy and converting it to heat energy, electromagnetic interference shielding materials are frequently utilized in electric devices to prevent electromagnetic radiation pollution. Meanwhile, the high amounts of heat energy generated by the electronic components have the potential to overheat, which always causes the electronic equipment to age quickly or even fail [
2]. Utilization of polymers for thermal management purposes is very attractive due to their affordability, lightweight nature, and easy processing. On the other hand, because of the intrinsic phonon scattering between polymer chain ends and impurities, most polymers are electrical insulators and exhibit very low thermal conductivity (0.2–0.5 W/m · K), making it challenging to quickly transfer heat.
Filled polymers are a highly nonhomogeneous material because of solid particles’ presence inside the polymer matrix [
3,
4]. A variety of good features, including good conductive properties, high specific strength and modulus, temperature stability, high corrosion resistance, fatigue resistance are present in conductive polymer composites [
5,
6,
7]. These materials can be utilized as both functional materials and structural materials to support loads.
Due to its many usable forms, such as carbon fibers (CF), graphite (Gr), carbon black (CB), graphene-based nanoparticles (nGr), and carbon nanotubes (CNT), which are utilized to build polymer matrix composites for a variety of applications, carbon is frequently used as a filler in polymer composites. Traditionally, micron-sized carbon fillers have been employed to enhance a polymer matrix’s thermal, electrical, and mechanical properties [
8,
9]. However, compared to micro-fillers, nano-size carbon fillers have significantly higher aspect ratios and surface areas, which provide a more significant increase in polymer properties.
Polymers and polymer-based materials have largely replaced traditional structural materials including reinforced concrete, metal, and wood. The variety of polymers and fillers, as well as the unlimited variability of the compositions of composites based on them and the modalities of their modification, give polymeric materials an incredibly broad range of applications [
10].
Such materials, on the other hand, require a unique approach and the introduction of novel solutions in the development and implementation of nondestructive testing methods and instruments. This is owing to the large range of materials available, the unique characteristics of their structures and manufacturing methods, the wide range of physical, mechanical, and strength properties, the various types of flaws that can develop during their creation and operation, and so on [
11].
Enhancing conductive polymer composites (CPCs), including materials with electrical-mechanical performance, is necessary for many technical applications. Thermal conductivity, thermal stability, corrosion resistance, and the lightweight nature of composites are likewise important characteristics of CPCs [
12].
Fuel cells seem to be a potential alternative to traditional energy converters such as heat engines because they are more inexpensive and environmentally friendly. Recently, interest in fuel cells has increased, and many research initiatives are working to enhance them [
13]. Metals are the most often employed materials in the manufacture of fuel cells due to their better processability compared to polymer materials and strong electrical and thermal conductivity. However, metals are susceptible to corrosion, which can result in problems with fuel cell performance. They also have a significantly higher density than polymers, which results in heavy fuel cell stacks. Polymer composites can replace metals as fuel cell materials by ensuring adequate electrical and thermal conductivity, good processability of bipolar plates, and light weight [
14,
15]. Conductive fillers such as Gr, CB, CNT, nGr and CF can improve the electrical characteristics of CPCs [
16].
Bipolar plates can be made from a wide range of materials. Pure graphite was initially selected because it has a good combination of thermal and electrical properties, is available in a wide range of shapes and sizes, and is simple to obtain using conventional processes. However, it is not economically feasible to produce in large quantities due to its inherent brittleness and costly machining methods [
17]. Commercially available composite bipolar plates can be based on various polymer matrices, such as polypropylene (PP) [
18], polyphenylene sulfide (PPS) [
19], polyvinylidene fluoride (PVDF) and phenolic resin [
20]. The employment of big graphite particles as the matrix’s major filling component, or vice versa, was also investigated by many researchers. They found that mixing a larger primary conductive filler together with a smaller secondary conductive filler could improve the composite electrical conductivity while also improving its mechanical qualities. Chunhui et al. [
21] investigated the effect of conductive filler size combinations on the electrical conductivity of materials for bipolar plate applications in fuel cells. In their investigation, Hui et al. employed various graphite particle sizes and discovered that electrical conductivity increased as the graphite particle size increased [
22]. Dhakate et al. studied the electrical characteristics of composites containing expanded graphite (EG) of various sizes (30, 50, 150 and 300 µm) and phenolic resin as a matrix and discovered that the EG/phenolic composites with the largest EG size of 300 µm had the highest electrical conductivity [
23].
Particle size and density are important factors that influence the rheology of composite materials. Smaller particles often have higher viscosities and viscoelastic elastic modulus than bigger particles because of their larger surface area and tendency to agglomerate [
24]. Particle size effects and powder loading are strongly related. Soto Mayor et al. investigated the effects of the 316L feedstocks’ solid loading content and powder particle size distribution on rheological properties. This only applied to powder loadings above 65 vol.%; for lower powder loadings, viscosity changes were less pronounced. They also observed that an increase in composite viscosity is caused by a decrease in particle size [
25].
It is possible to create nanocomposites with superior qualities using carbon nanofibers (CNFs), which are considerably larger than carbon nanotubes (CNTs) but considerably smaller than regular carbon fibers. This might lead to the development of numerous new applications. They come in sizes between 70 and 200 nm, and their length is thought to be between 50 and 100 μm. It has already been shown that CNFs can be used as reinforcements to enhance the qualities of a number of polymer matrix systems, including polycarbonate, epoxy, polyethylene, polypropylene, polymethyl methacrylate, polyether ether ketone, and polystyrene [
26]. The results show enhancement in mechanical [
27], thermal [
28], and dielectric/electrical [
29] properties.
Because of their exceptional mechanical properties and heat stability, high-performance polymers, such as polysulfone (PSU), are particularly notable among thermoplastics. PSU is widely used in modern technology because of its excellent characteristics, including its thermal, mechanical, chemical, strength, and toughness properties as well as its ability to construct polymeric membranes with a range of functions [
30,
31]. In our earlier research [
32], we investigated polysulfone-based composite materials that were prepared using the solution method and then filled with three different forms of graphite: natural graphite (NG), artificial graphite (AG), and expanded graphite (EG), to increase the composite’s mechanical characteristics and thermal conductivity. Because NG has a perfect crystalline graphite structure, whereas AG and EG both have a faulty crystalline structure that impacts their characteristics, our analysis of the fillers’ morphology revealed that NG is the best filler for enhancing the thermal conductivity of the composite [
32]. We found that using 70 wt.% of NG gave thermal conductivity with the maximum magnitude of 4.26 W/m·K. The reason for this was because NG’s sheets had a flawless crystalline structure and a high aspect ratio, which created a large conducting surface with the matrix and made heat transfer easier than with AG and EG. The poor heat conductivity of the material is a result of structural faults in the composite, such as porosity and agglomeration formation, which we identified by SEM research.
In the current investigation, we used a steel mold with holes rather than a [
32] steel frame in order to increase sample quality. We were able to achieve a more flawless structure, reduce material porosity, and increase material density, which allowed us to boost the thermal conductivity of composites. The goal of our work was to develop densely filled composites with adequate high density and low porosity in order to attain high conductive characteristics of composites. We want to emphasize the impact of filler particle size and aspect ratio on the conductivity and mechanical performance of the composites by using different types of graphite as a filler.
2. Materials and Methods
2.1. Materials
Polysulfone (PSU) Ultrason S 2010 (BASF, Ludwigshafen, Germany), which offers exceptionally high resistance to heat, was chosen as the matrix material in the current study. Broad range of advantageous traits enables polysulfone to be shaped into high-quality engineering components and high-load mass-produced goods. The properties of the used polysulfone are listed in
Table 1. To create a thermally and electrically conductive composite, big sheets of natural graphite (NG (with rough surfaces and particle sizes of about 200 μm NG (GL-1 GOST 5279-74—Taiginsky GOK, Kyshtym, Russia) were used. Synthetic graphite (AG) powder grand GMZ with an average particle size about 50 μm was bought from the Moscow Electrode Plant in Russia. Thermoexpanded graphite was obtained by heat treatment following a chemical reaction between the natural graphite sheets and sulfuric acid with a particle size about 300 μm.
Expandable graphite (EG) is a type of intercalation compound that inserts foreign materials with various characteristics into graphite sheets using physical or chemical techniques. Rapid expansion at high temperatures can result in expanded graphite. It can be utilized extensively in electrode materials, the petrochemical sector, fire retardants, oil-absorbing materials, and other applications as a new form of carbon functional material with numerous unique features. Generally, EG is produced via microwave or high-temperature treatment of chemically manufactured graphite intercalation compounds (GICs). During the chemical procedures, gaps are created between graphite layers, allowing intercalation agents to enter the interlayers to create GICs [
8].
The expanded graphite was synthesized using the same technique as in our earlier research [
32]. By treating NG in accordance with Hummer’s method, expanded graphite was created. Graphite intercalation compounds (GIC) were created by the interaction of graphite with sulfuric acid and hydrogen peroxide, and the resultant mixture was then adjusted by additional washing with water. The GIC was dried in the drier at 160 °C for five hours. When the GIC reached its final stage, it was exposed to a high-temperature thermal shock at a temperature of about 800 °C. This caused the GIC to evaporate, which resulted in an expansion in volume in the c-direction compared to natural graphite flakes. The EG was acquired at the conclusion of the heat treatment. Expanded graphite was also ground using a mill before the addition of the polymer solution, which improved the dispersion of the intercalated graphite flakes and decreased the amount and size of agglomerates.
Thus, three types of graphite—NG, AG and EG were used as fillers in our study. For detailed characterization of these three types of graphite, see
Section 3.1 in the paper [
32].
2.2. Synthesize and Composite Preparation
In this study, the conditions for mixing the polymer with the fillers, the pressing pressure, the pre-drying of the fillers, and their grinding were changed in order to improve the sample quality. This allowed for a decrease in the size and quantity of aggregates.
The composite material was prepared using the solution casting technique, which has gained popularity over the years due to its ease of use and use of non-specialized tools. Solution casting is often a manufacturing method that starts with mixing a solubilized polymer matrix and filler with mechanical stirring while maintaining continuous agitation, casting, and solvent evaporation or drying processes.
Moisture was removed from the fillers before mixing them with the polymer by drying for two hours at 115 °C. By adding a filler to a 40 wt.% solution of polysulfone in n-methylpyrrolidone (CAS: 872-50-4, Molar mass: 99.13 g/mol, Empirical Formula C5H9NO) and mixing the mixture with an overhead stirrer IKA Eurostar 20 digital, (Germany/Deutschland), composite materials were created. Homogenization of the mixture occurred in 30 min at 300 rpm.
The use of a 40 wt.% solution with a higher viscosity prevents the resulting compound from separating during its drying and removal of the solvent. The solvent was removed in a BINDER (Germany) drier for 6 to 8 h at a temperature of 115 °C. In this work, when the composite had dried, the samples were prepared using steel molds and holes. The exposure time was 20 min, the temperature was 160 °C, and the pressure was 80 MPa.
2.3. Characterization
Scanning electron microscopy (SEM, TESCAN VEGA, Brno, Czech Republic) was used to examine the fractured surface of the composite in order to evaluate the dispersion of the graphite particles.
According to ISO 1183-1:2019 (Plastics—Methods for determining the density of non-cellular plastics), sample density was measured by hydrostatic weighing in distilled water and ethanol using an AND GR 202 analytical balance (AND, Japan) supplied with a hydrostatic weighing attachment AD-1653. The sample was weighed in air with a 0.001 g precision to measure its density. At a temperature of 20 ± 2 °C, 150 mL of ethyl alcohol or distilled water was put into the cylinder and then after placing the sample in the liquid, it was weighed again. Sample density in g/cm
3 is calculated using the formula
where ρ, A, B and ρ
0 are density of the sample g/cm
3, sample’s weight in the air g, sample’s weight in the water g and density of distilled water g/cm
3, respectively.
The additivity rule was used to calculate the porosity based on the real density of the polymer (1.234 g/cm3) and the ideal density of a single graphite crystal (2.27 g/cm3). The resulting samples have defects inside the graphite particles as well as porosity along the polymer-filler interfaces, since the true density of the graphite particles is always lower than the density of a single crystal. As a result, a rise in overall porosity is connected with an increase in the amount of the material’s fillers, which have their own nanosized porosity at a level of 12–15%.
The LFA 447 Nanoflash diffusivity instrument (Netzsch-Gerätebau GmbH, Selb, Germany), which is based on a xenon flash lamp and complies with ASTM E1461, was used to measure the thermal conductivity of the additive-filled polymers. On one side, a test sample is consistently subjected to a single xenon flash tube pulse. Using an infrared detector, the temperature increase on the other side is monitored over time. On the basis of the geometry of the temperature rise curve, the thermal diffusivity may be calculated right away. For the purpose of measuring thermal diffusivity, the samples were heat-pressed at 160 °C, 194 kN, for 20 min into cylinders with a diameter of 12.7 mm and a thickness of 2 mm. The thermal conductivity was then determined using the formula shown below:
where λ, a, ρ and Cp are thermal conductivity W/(m · K), thermal diffusivity mm
2/s, material density g/cm
3 and heat capacity j/(g · K), respectively.
Experimental determination of the specific heat Cp of composite materials for the range from 25 to 250 °C was carried out using a differential scanning calorimeter NETZSCH DSC 204 Phoenix F1 (Germany), in accordance with ISO 11357-4:2014 (Plastics—Differential scanning calorimetry (DSC)—Part 4: Determination of specific heat capacity).
As a comparison standard for determining thermal conductivity, a standard sample, sapphire, was used in the work. The heat capacity was determined on samples 5 mm in diameter, weighing 24–25 mg, in a protective argon atmosphere.
Three-point tensile, bending, and compression tests at room temperature were carried out on a Zwick/Roell Z020 universal tensile testing machine (Ulm, Germany) using a high-precision MultiXtens strain measurement system. Flexural tests were carried out in accordance with ISO 178:2019 (Plastics—Determination of flexural properties), on 80 mm × 10 mm × 4 mm specimens. The sample was loaded until failure at an active grip travel speed of 2 mm/min.
Tensile tests were performed in accordance with ISO 527-2:2012 (Plastics—Determination of tensile properties—Part 2: Test conditions for molding and extrusion plastics). Samples of type 5A were used; the strain rate was 2 mm/min.
Compression tests of the samples were performed according to the method—ISO 604:2002 (Plastics—Determination of compressive properties).
The breaking force was determined on samples with dimensions of 10 mm × 10 mm × 4 mm, and samples with dimensions of 50 mm × 10 mm × 4 mm were used to determine the elastic modulus. The movement speed of the active grip was 2 mm/min. The application of load on the samples to determine the modulus of elasticity was carried out within the elastic section of the load-strain diagram.
Before testing, the samples were conditioned in accordance with ISO 291:2008 (Plastics—Standard atmospheres for conditioning and testing) at a standard atmosphere of 23/50 for 88 h. The total number of samples tested at one point during compression and three-point bending tests was at least 7.
The study of the electrical properties of the proposed materials was carried out on samples that were cube-shaped samples 10 mm × 2 mm × 2 mm; an installation for measuring electrical conductivity and thermoelectric power (ALKGT-1 (LLC “KRIOTEL”), Moscow, Russia) was used. Electrical conductivity was measured at temperatures between 300 and 1200 K. The samples were divided into pieces with a 20 mm × 6 mm surface area and a 2 mm or so thickness. In order to measure resistivity at direct current in the mode with current switching through the sample for this configuration, a four-contact approach was used.
3. Results and Discussion
3.1. Dispersion of Filler Particles in the PSU Matrix
The SEM micrographs can be used to better understand the thermo-electric conductivity and mechanical properties of the PSU/graphite composites.
Figure 1 shows that the PSU/Gr 30 wt.% graphite composite has more defined polymeric areas than the PSU/Gr 70 wt.% composite.
We can see how the filler is well mixed with the matrix by looking at the SEM micrographs. We can clearly detect the natural graphite plates placed in the polymeric matrix that give an excellent heat transmission compared to the dispersion of 30 and 70 wt.% AG and EG in the polysulfone matrix, as shown in
Section 3.4. Regarding AG and EG fillers, we see that the filler and polymer combined to form a large agglomeration; this tendency decreases as the filler content is increased. The sheets of natural graphite are seen, seeming to be planted in the polymeric matrix. When these sheets are stacked on top of one another, bridges form between them, which enhances the composite’s thermal properties.
Flakes of natural graphite are inserted into the material perpendicular to the pressing axis. The NG particles overlap with one another (
Figure 1a,d), creating substantial contact areas between the particles, which improves the transmission of heat and electricity in this direction. The overlap density rises and the thickness of the polysulfone interlayers decreases as the NG content of the material rises. The number of big pores in the material has greatly decreased as compared to earlier samples [
32], and the particle dispersion has improved. With an increase in the filler content, the number of overlaps of polymer interlayers between graphite particles decreases, which should lead to a decrease in the mechanical characteristics of the material. Additional EG particle grinding improved the uniformity of these particles’ distribution within the polymer matrix, decreased the number of aggregates, and brought the material’s structural makeup closer to that of materials based on NG. This allowed for a significant increase in thermal conductivity and an improvement in mechanical properties.
The creation of homogenous materials as the filler content is increased is made possible by the employment of spheroidal artificial graphite particles as the agglomeration starts to decrease (
Figure 1b,e). However, point interactions between the particles result in lower thermal conductivity values than natural graphite.
These results may be compared to the findings in previous work [
32] where big agglomerations were formed between the matrix and the filler, in addition to pores appearing between the two components, especially for the AG filler. We can see the enhancement in the bonding between the matrix and the filler, with fewer pores and agglomerations. Comparing with the results of the previous study, we can see that using a different type of press mold caused a better mixing between the matrix and the filler, as well as a reduction in the sample’s porosity, providing better thermal and mechanical properties.
In their study on the effects of carbon micro- and nano-fillers on the viscoelastic properties of polyethylene terephthalate (PET), Alshammari et al. [
33] used graphite to prepare composite polymer based on PET. SEM images of graphite/PET at loadings of 2 and 15 wt.% of graphite revealed that the failure of the composite was caused by the development of agglomerations and cracks as the graphite concentration in the matrix increased.
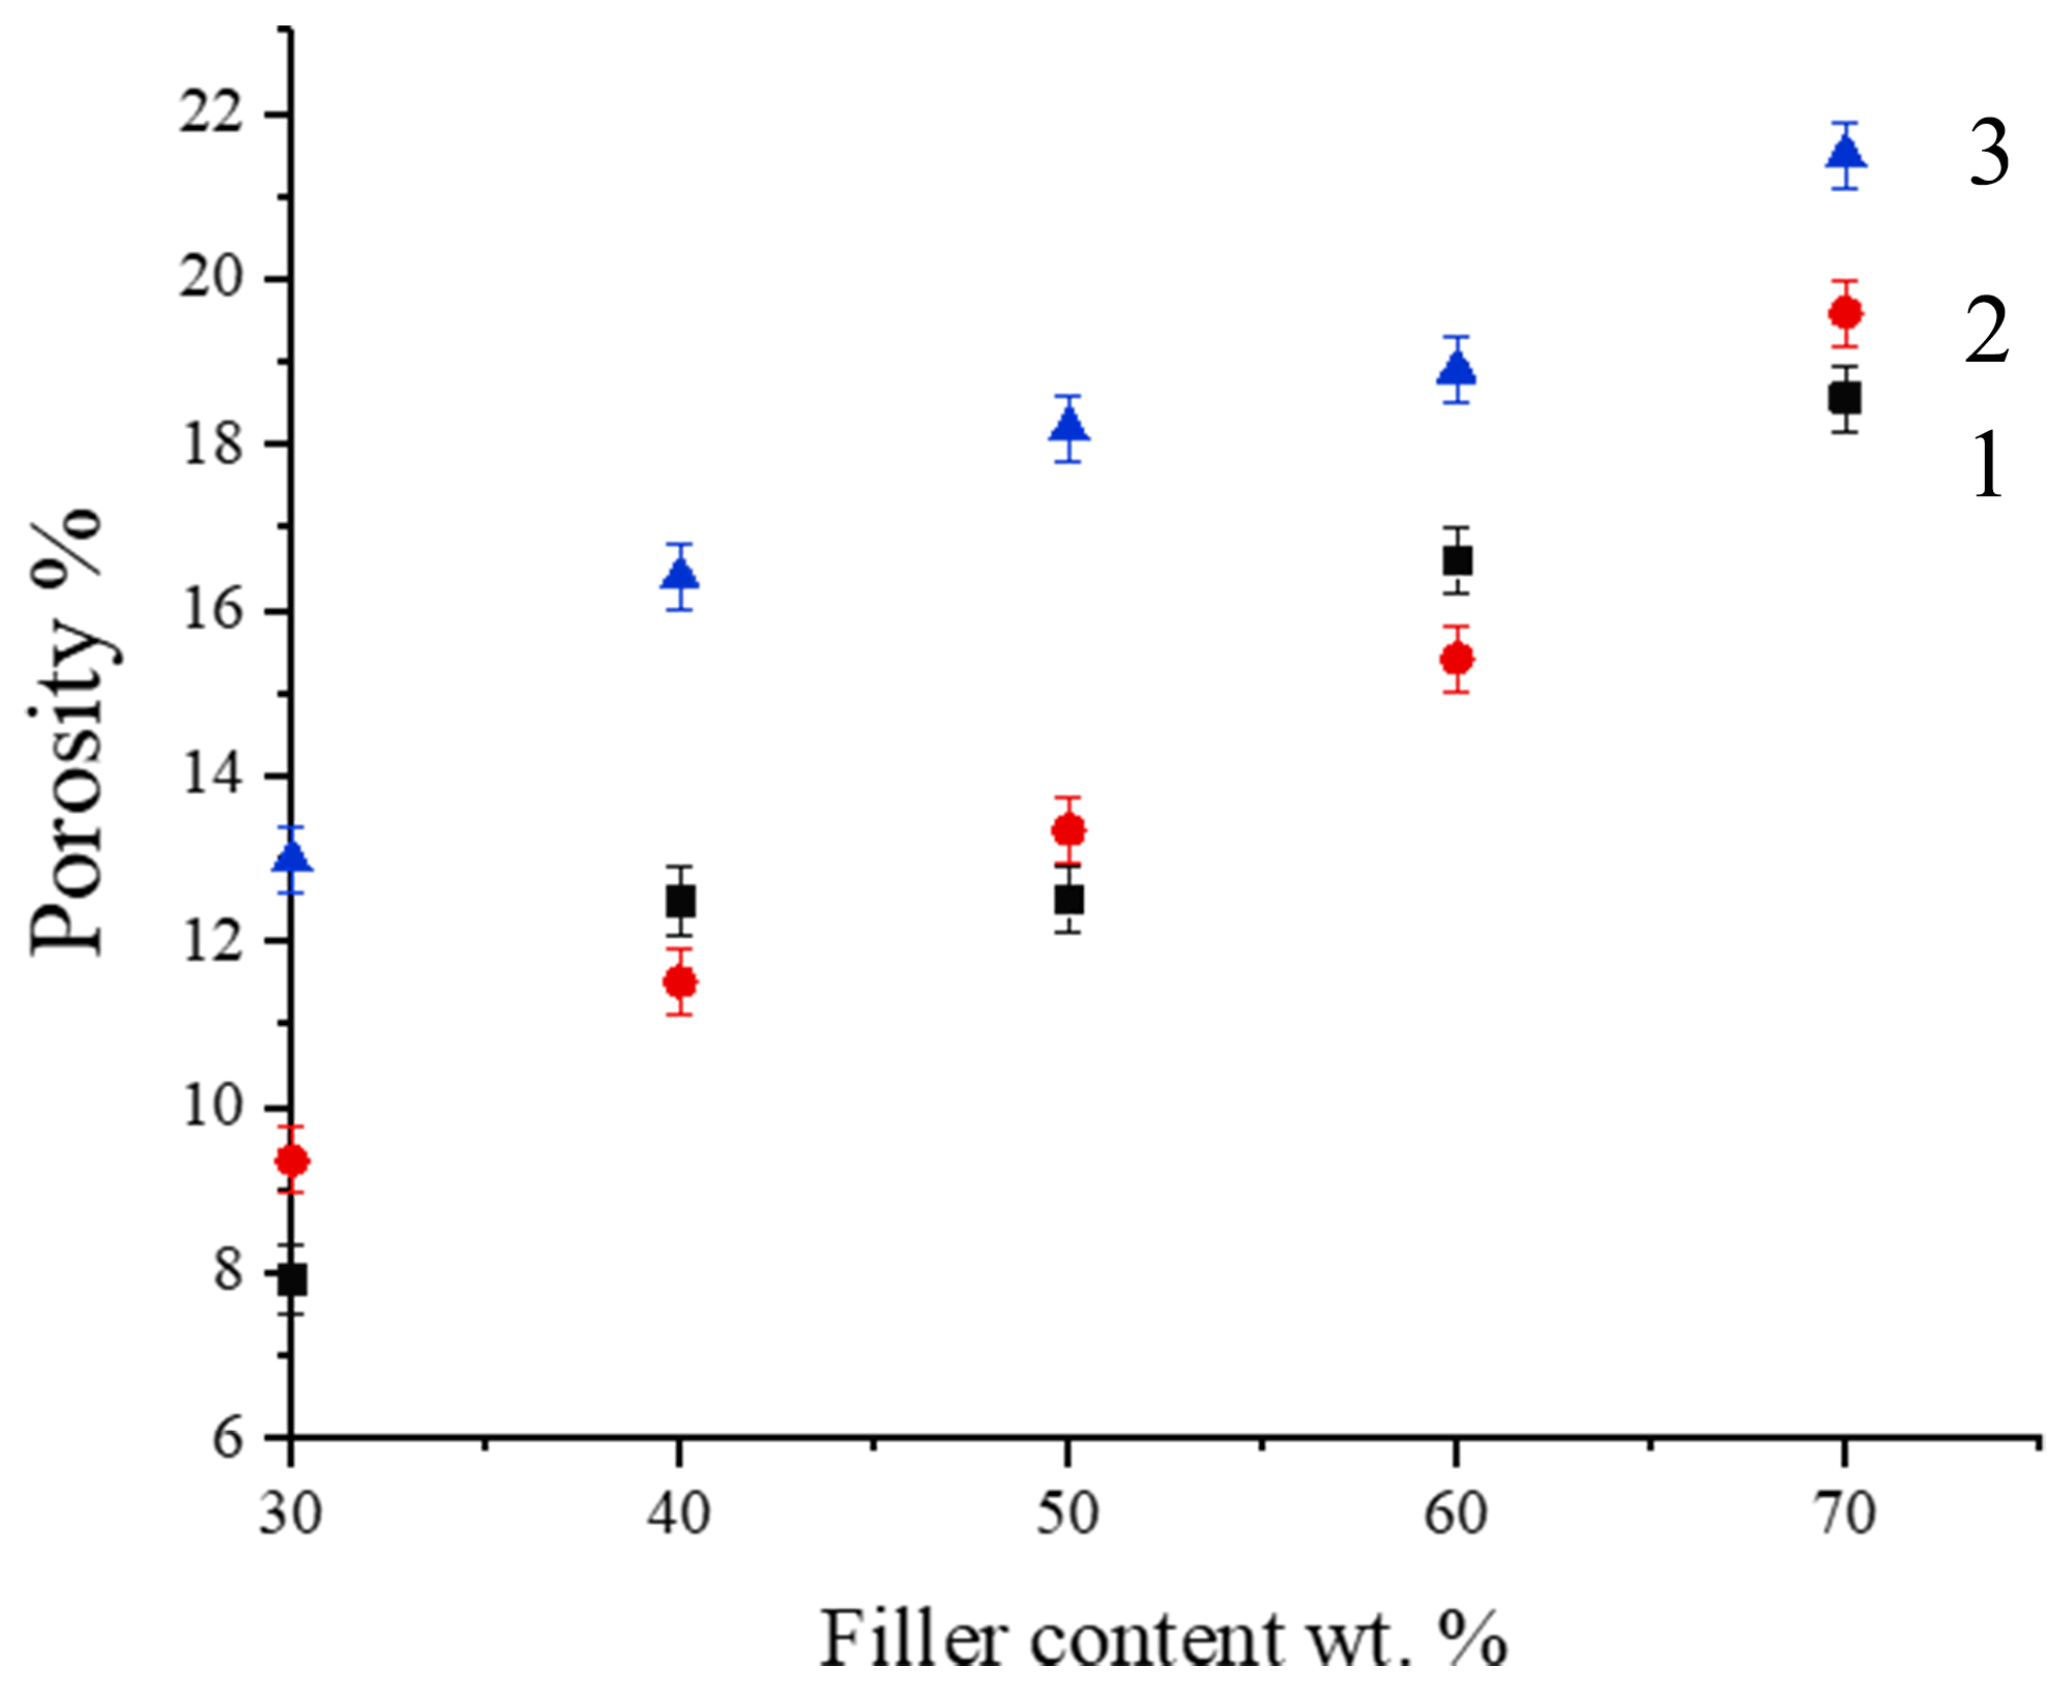
3.2. Composite Density and Porosity
To study the effect of increasing filler content on the composites’ density, we have measured the density of the composite by hydrostatic methods.
Table 2 shows the density of the measured samples in this work compared to the composite density we obtained in the previous work. Here we measured the density of samples obtained, as was mentioned above, by consolidation using a steel mold with holes (column 1) and using a steel frame (column 2), used for consolidation of samples as described in paper [
32]. We can see how the density increased as the filler content was getting higher for NG and AG. For EG we noticed that the density of the sample varied as the filler content increased due to the structural defects in the EG.
By comparing the current results to the earlier ones [
32], we can conclude that the change in sample preparation technology that increased density allowed for higher thermal conductivity values and higher electrical conductivity in the composites. Graphite particles, when introduced into the matrix, form agglomerates randomly distributed in it, which affects the observed properties. The mechanisms of structural change with an increase in the degree of filling are shown in
Figure 2.
With an increase in the filler content for NG particles having a lamellar shape, with an increase in the degree of filling, the degree of orientation of the particles in the material increases and the number of contact pads through which heat or charges are transferred increases.
With AG filler, point connections exist, and as the degree of filling grows and agglomerates are broken down, their density rises, increasing the network of filler particles’ conductivity as their concentration rises. However, this increase is significantly lower than in the case of natural graphite because of the point type of the connections between the particles of AG.
All of the graphite fillers we used have internal defects that have an impact on their thermal and electrical characteristics. The porosity of this filler is greater than that of NG or AG in the situation of EG, when incomplete separation of the resultant flakes occurs during intercalation. As a result, the density does not significantly rise with an increase in filling up to 50 wt.% (
Figure 3). In the process of mixing, particle agglomerates start to break down and the dispersion of existing particles into individual graphite flakes improves when the EG content rises above 50 wt.%, which causes a large increase in the viscosity of the polymer solution and an increase in shear stresses. The material’s porosity starts to decrease as its density reaches that of NG and AG. Due to this, the density and, consequently, the material’s thermal and electrical characteristics rise significantly. The obtained material starts to conduct better than on the basis of artificial graphite because of the wide contact surfaces.
Shammya Afroze et al. [
34] had similar findings when they studied the variations of bulk density of talc and graphite filler in polypropylene and its impact on the thermal properties of the composite. It was observed that when the amount of graphite in graphite-PP composites increases, so does their density. When the amount of graphite is increased from 0 to 10 wt.%, the bulk density increased from 0.923 gm/c
3 to o.968 gm/c
3, which resulted in a high thermal stability as the filler content increased.
The porosity along the polymer-filler interfaces for all varieties of composite materials is quite similar, according to the SEM results. This suggests that the greatest contribution to the formation of the conductive properties of materials is made by the defectiveness of the fillers used and the nature of the contact between the particles—point or linear. Porosity results are shown in
Figure 3.
3.3. Mechanical Properties
3.3.1. Flexural Test
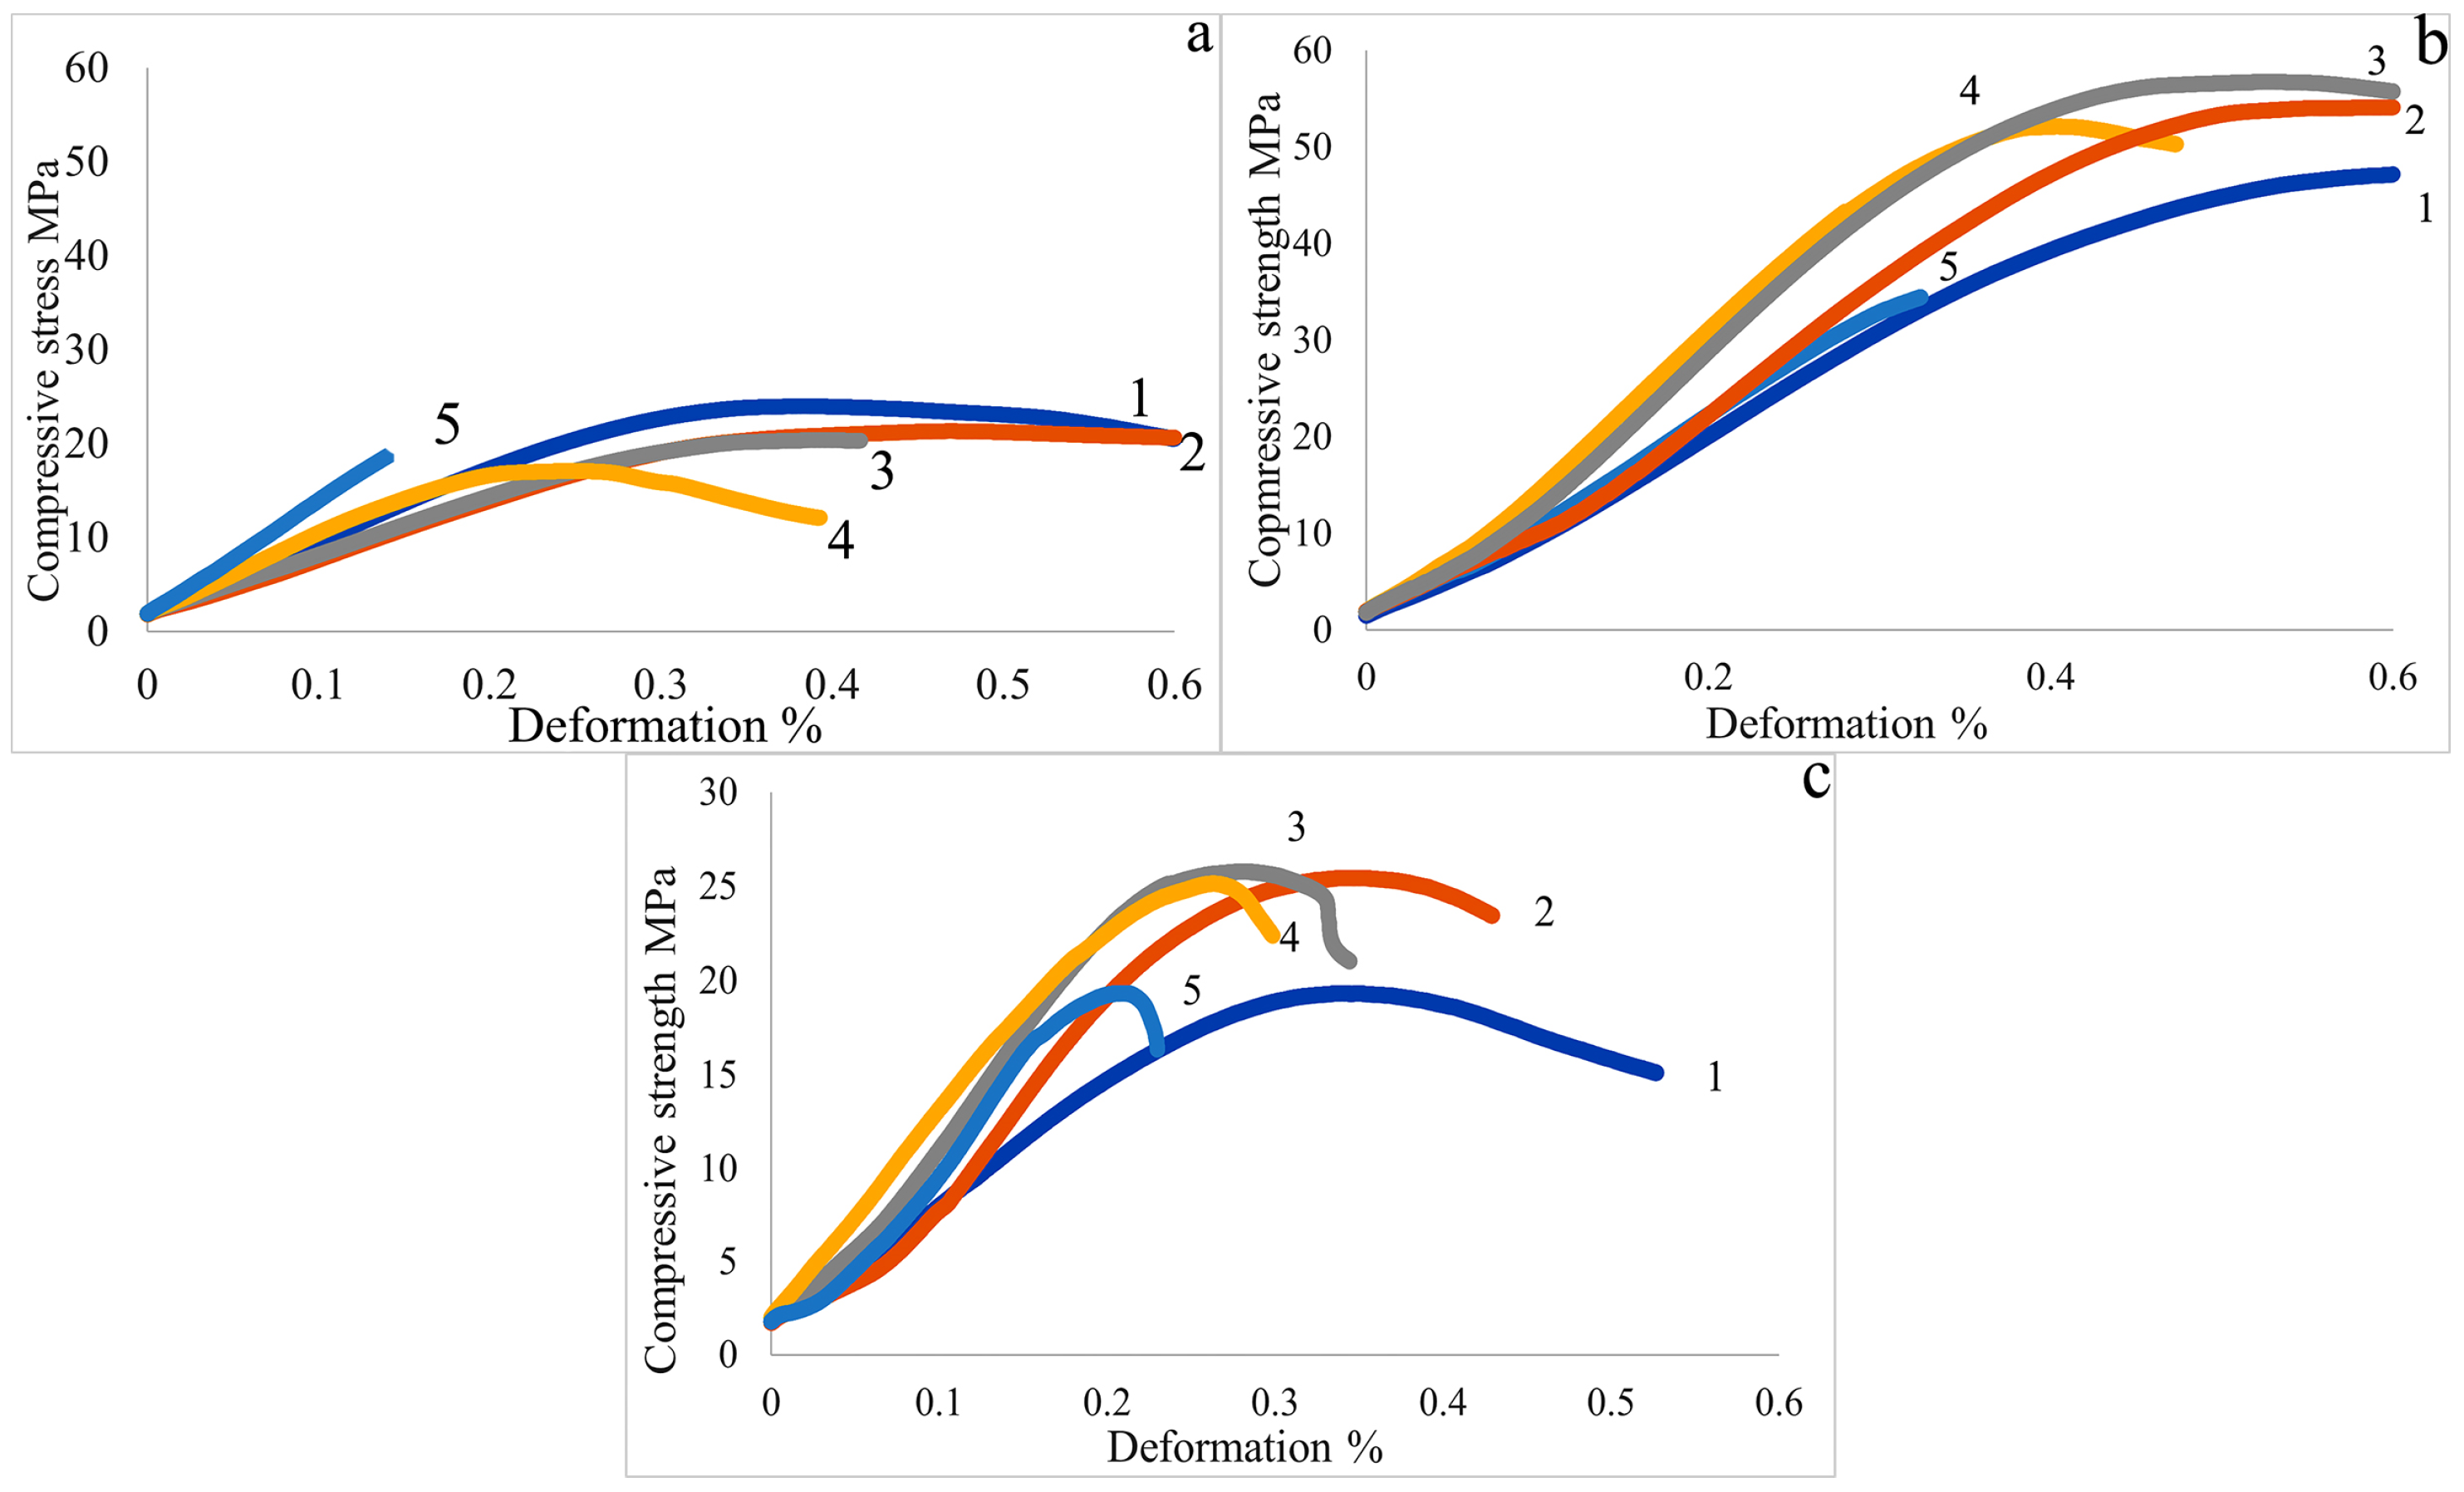
Figure 4 shows the variation of the flexural strength of the composite filled with different types of graphite filler.
When maximal stresses are attained, brittle material breakdown occurs, and the load-strain diagram corresponding to this corresponds to ISO 178 type “a”. For all materials, an increase in filling causes an increase in the elastic modulus, which results in a commensurate decline in deformability (
Table 2,
Figure 4). Depending on the filler’s morphology, different changes in a material’s strength characteristics occur.
The maximum flexural strength of the PSU-based composites filled with 30 wt.% NG, AG and EG reached 41.72 MPa, 38.43 MPa and 55.79 MPa, respectively.
For materials based on AG (
Figure 4b) that contain spheroidal-shaped filler particles, the strength gradually declines as the degree of filling rises up to 70 wt.% by weight. This decline in strength is caused by a reduction in the thickness of the matrix interlayers, which, at high fillings, is no longer sufficient to wet all of the filler’s available surfaces. So, using AG, we found that when filler concentration increased, the flexural strength began to decrease. Because of the formation of agglomeration as the filler amount increases, we can assume that there is an improvement in the interfacial adhesion between the filler and matrix, which decreases with increasing filler content.
From
Figure 4a, we can see that using NG as filler there is a variation in flexural strength values depending on the filler content; when 30 wt.% of the filler was used, we achieved the highest flexural strength. With filler content higher than 30 wt.% we noticed that there is no big difference in flexural strength when using 40 and 50 wt.% of NG and the flexural strength decreased compared to using 30 wt.% of NG. This can be explained by the fact that sheets of graphite are stacked on top of each other and overlapped into a composite. With the increase of the filler content, the number of interlayered polymer layers between the graphite particles decreases, which leads to weaker adhesion properties and a decrease in the mechanical properties of the composite. In addition to the structural pores of graphite sheets, there are pores between the composite and the matrix. The critical filling level is around 60 wt.%, after which the connections between the polymer matrix’s interlayers are insufficient to maintain the composite’s strength, which falls below 24.07 MPa.
It will be possible to characterize the changes in attributes for EG after rechecking; in theory, it can be similar to NG, but the rate of strength loss will be higher because a bigger volume will be occupied by the more defective filler. A big enhancement in flexural strength was found using EG (
Figure 4c) as a filler using 30 wt.% which was about 3 times bigger than for 40 wt.% EG, and then the flexural strength started decreasing. As a result, we can say that the increase in the filler content leads to a decrease in flexural strength, and that is because the graphite filler seems to change the polysulfone composite to show more brittle behavior.
3.3.2. Tensile Test
One of the fundamental mechanical tests, the tensile test, involves applying a controlled tensile force to a carefully prepared specimen in order to assess the strength of any material. The relationship between the load placed on the material and the deflection (or strain) that results in comparison to the load can be used to measure the tensile characteristics. The tensile test specimens were prepared according to the ISO standards and were shaped into rectangles using a hot press process. In a tensile test, the sample is stretched until it breaks. In this case, the strain rate must be low so that the result is not distorted. During the tensile test, the force and buckling of the specimen are measured.
Figure 5 shows the results of tensile tests of the PSU-based composites filled with NG, AG and EG. Results for AG (
Figure 5b) showed that increasing the filler content to 40 wt.% increased the tensile strength; it then started to decrease as the filler content increased above 50 wt.%. The maximum tensile strength of the PSU-based composite filled with 30 wt.% NG, 50 wt.% AG and 40 wt.% EG reached 16.22 MPa, 25.71 MPa and 16.48 MPa, respectively.
In comparison to composite materials filled with NG and EG, AG’s small particle size results in a material that is denser and has a higher tensile strength. Natural graphite sheets stacked on top of one another produce adhesion forces between the polymer and the graphite that are weaker than those between the polymer and industrial graphite.
The mechanical characteristics are significantly altered when different types of graphite filler are added in increasing amounts to the polymer matrix. Tensile and flexural strengths showed a similar pattern of behavior.
Graphite and polysulfone have highly different mechanical characteristics. Graphite is a fairly brittle substance, while PSU is a polymer with a high degree of plasticity. This is the main reason why combining the two materials results in less plasticity and more stiffness and brittleness than the pure polymer’s natural qualities. It seems that the mechanical properties of graphite are more likely to be adopted by composite materials than those of polysulfone.
3.3.3. Compression Test
This test was performed using ZWICK/ROELL Z020 (Group, Ulm, Germany), a compression testing machine designed specifically to test the strength and deformation characteristics of a material under compressive (pressing) force. The test specimens were prepared according to the ISO standards and were shaped into rectangles using a hot press process.
Figure 6 shows that using AG as a filler achieved the greatest outcomes for us. These results can also be explained by the SEM micrographs since it was clear that there was good dispersion between AG and the matrix, allowing the mechanical loads to be transferred in the composite easily. The results obtained using NG and EG are similar to each other. Using NG as a filler, there was poor dispersion of the graphite in the matrix and the compressive strength started to decrease as the filler content was raised above 30 wt.%. However, we could not get the same kind of outcomes with EG as we did with AG due to its porosity.
As a result, we may assume from the graphs for PSU/AG and PSU/EG that increasing the filler content up to 40 wt.% increased the composite’s compression strength before it began to decline. The mechanical properties were decreasing, which was previously explained by the differing properties of the filler and the matrix.
Table 3 and
Table 4 show the mechanical properties of the composite compared to each other and the Young’s Modulus of the composites. As we can see, using AG as a filler gave us the best mechanical properties overall compared to NG and EG.
3.3.4. Mechanical Properties’ Summary
Table 3 and
Table 4 demonstrate the mechanical properties and Young’s Modulus of the studied composites as a function of filler content.
The ability to withstand mechanical forces is better when using AG as a filler than when using NG and EG. This can be attributed to the fact that small-grained fillers make composite materials denser and more durable, which opens the door to the possibility of transferring the mechanical load between the filler and the polymer. When a filler with large granules is used, a compound with gaps between the filler and the polymer is created. The strength of a composite is also increased by the presence of smaller particles. Among other things, optimizing the quantity, size, distribution, and form of filler pellets can result in composite materials with higher mechanical properties. The variation in the mechanical properties can be explained because the adhesion between the polymer and the filler is not always optimal for transfer of the mechanical loads between the matrix and the filler. Compared to the flexural, tensile and compression strengths of the unfilled PSU (
Table 1), which are 120 MPa, 75 MPa and 89.6 MPa respectively [
35], we can assume as we had mentioned before that using a graphite type filler with polysulfone gives the matrix more brittleness and stiffness properties and reduces the elasticity of the polymer.
The Young’s Modulus increased as filler content increased, which led to more brittle material. In general, Young’s Modulus increases linearly with filler content, as we can see in
Table 4, demonstrating the higher stiffness of graphite-reinforced composites.
The flexural strength of NG/resin composites tends to gradually decrease with an increase in NG content from 30 to 60 wt.%, according to the similar findings of Gautam and Kar [
36]. Flexural strength and modulus fell from 42.67 MPa and 8.4 GPa to 23.43 MPa and 6.8 GPa, respectively, when the proportion of NG was increased from 30 to 60 wt.% by weight. Beyond 50 wt.% of NG content loading, both the flexural strength and modulus drop at dramatically greater rates. This indicates that when the NG concentration increases, weaker bonds form between the graphite flake and the phenolic resin.
Regarding the general trends, the outcomes here are more satisfactory than those in the work of Anadao et al. [
37], where there was a fluctuation in tensile strength as the filler content rose. The samples behave somewhat differently in relation to tensile strength. Even though graphite was present and contributed to the tensile strength decline, its presence did not significantly affect the tensile strength. The stress concentration in the polysulfone-carbon graphite particle interface, which causes the membranes to break at lower tensions, could be the cause of the composite membranes’ brittleness.
3.4. Thermal Conductivity
The thermal characteristics of solid materials, such as their melting and degradation temperatures, glass transition temperature, melt and crystallization enthalpy, specific and latent heats, polymorphism, and purity, can be studied qualitatively and quantitatively using DSC.
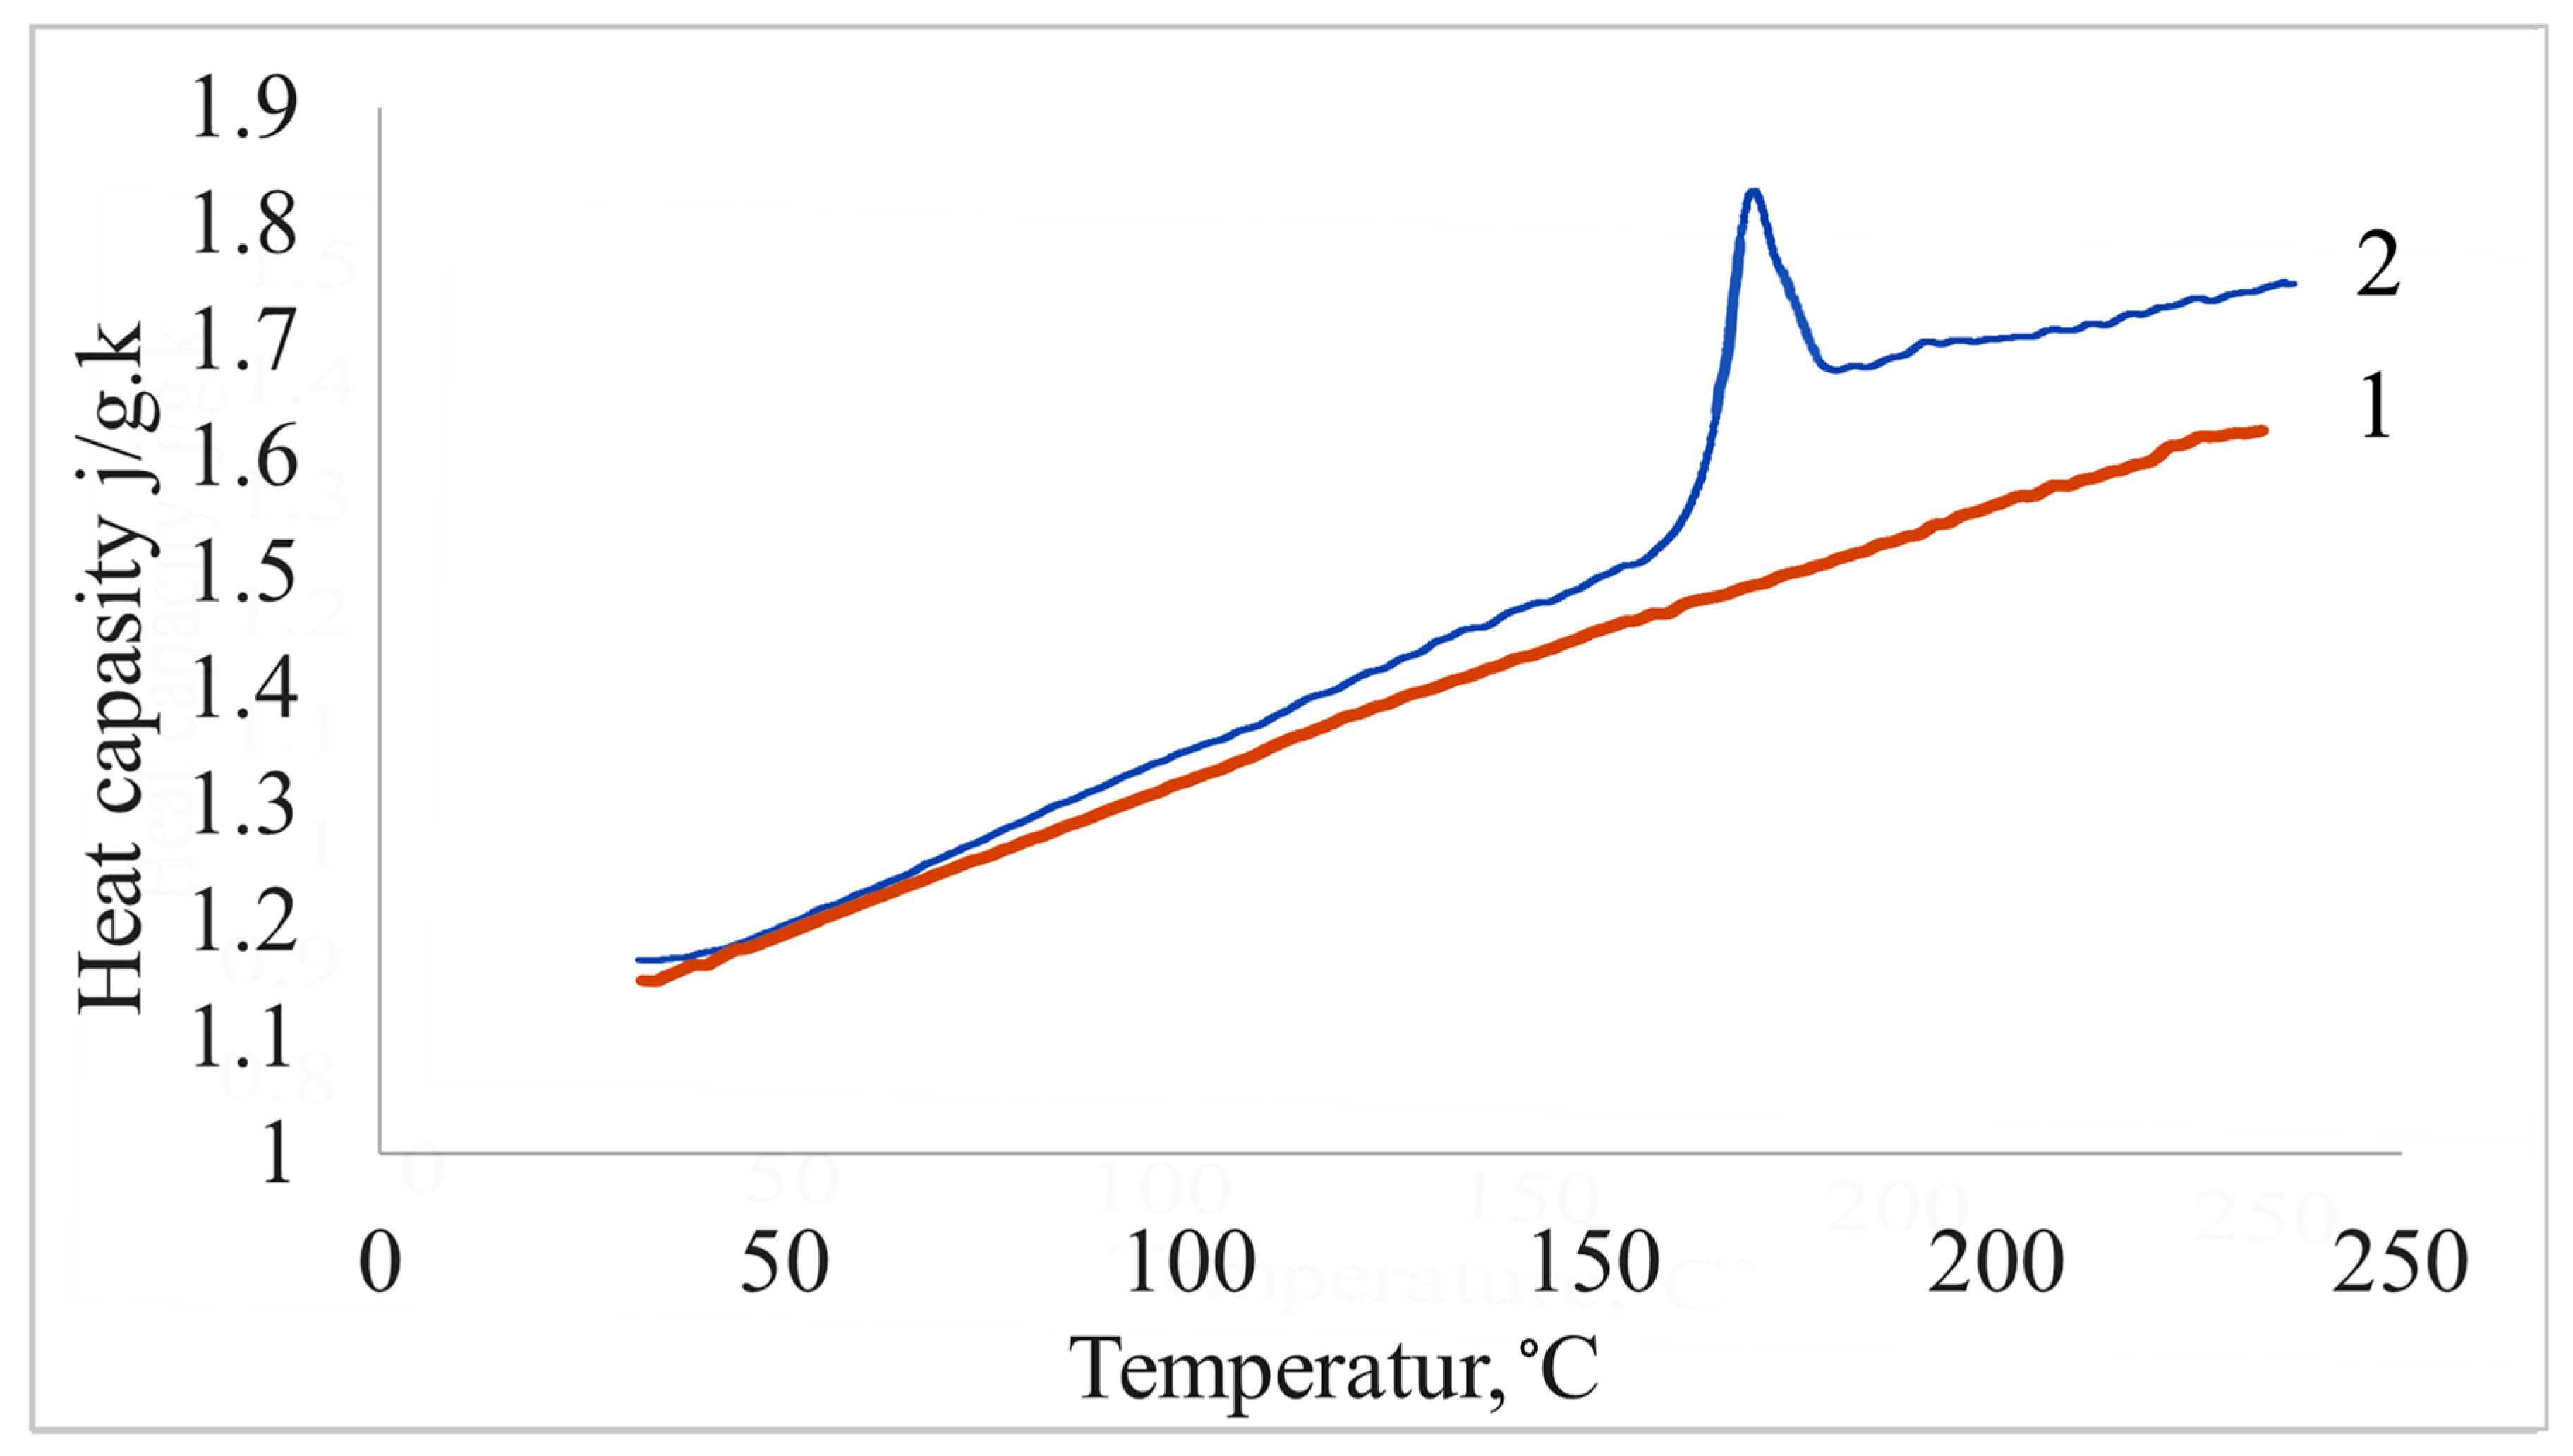
Because the heat capacity of the polysulfone brand Ultrason S 2010 does not appear to be temperature-dependent in the literature, we determined it, and the findings are displayed in
Figure 7. Heat capacity increases in the 180–190 °C temperature range as a result of the progress of the glass transition process. Additionally, the heat capacity of graphite fillers described in the literature varies depending on the brand of graphite material, so we conducted measurements for our graphite materials. The results showed that our artificial and natural graphite had practically the same dependencies, with a discrepancy of more than 0.02–0.04 J/g K.
Figure 8 illustrates the type of change in the heat capacity of the graphite we used.
Based on the obtained dependences, according to the rule of mixtures, we determined the values of heat capacities, which were subsequently used in calculating the thermal conductivity of materials.
Comparison of experimentally determined values of heat capacity for AG and NG determined experimentally and calculated theoretically showed their good convergence.
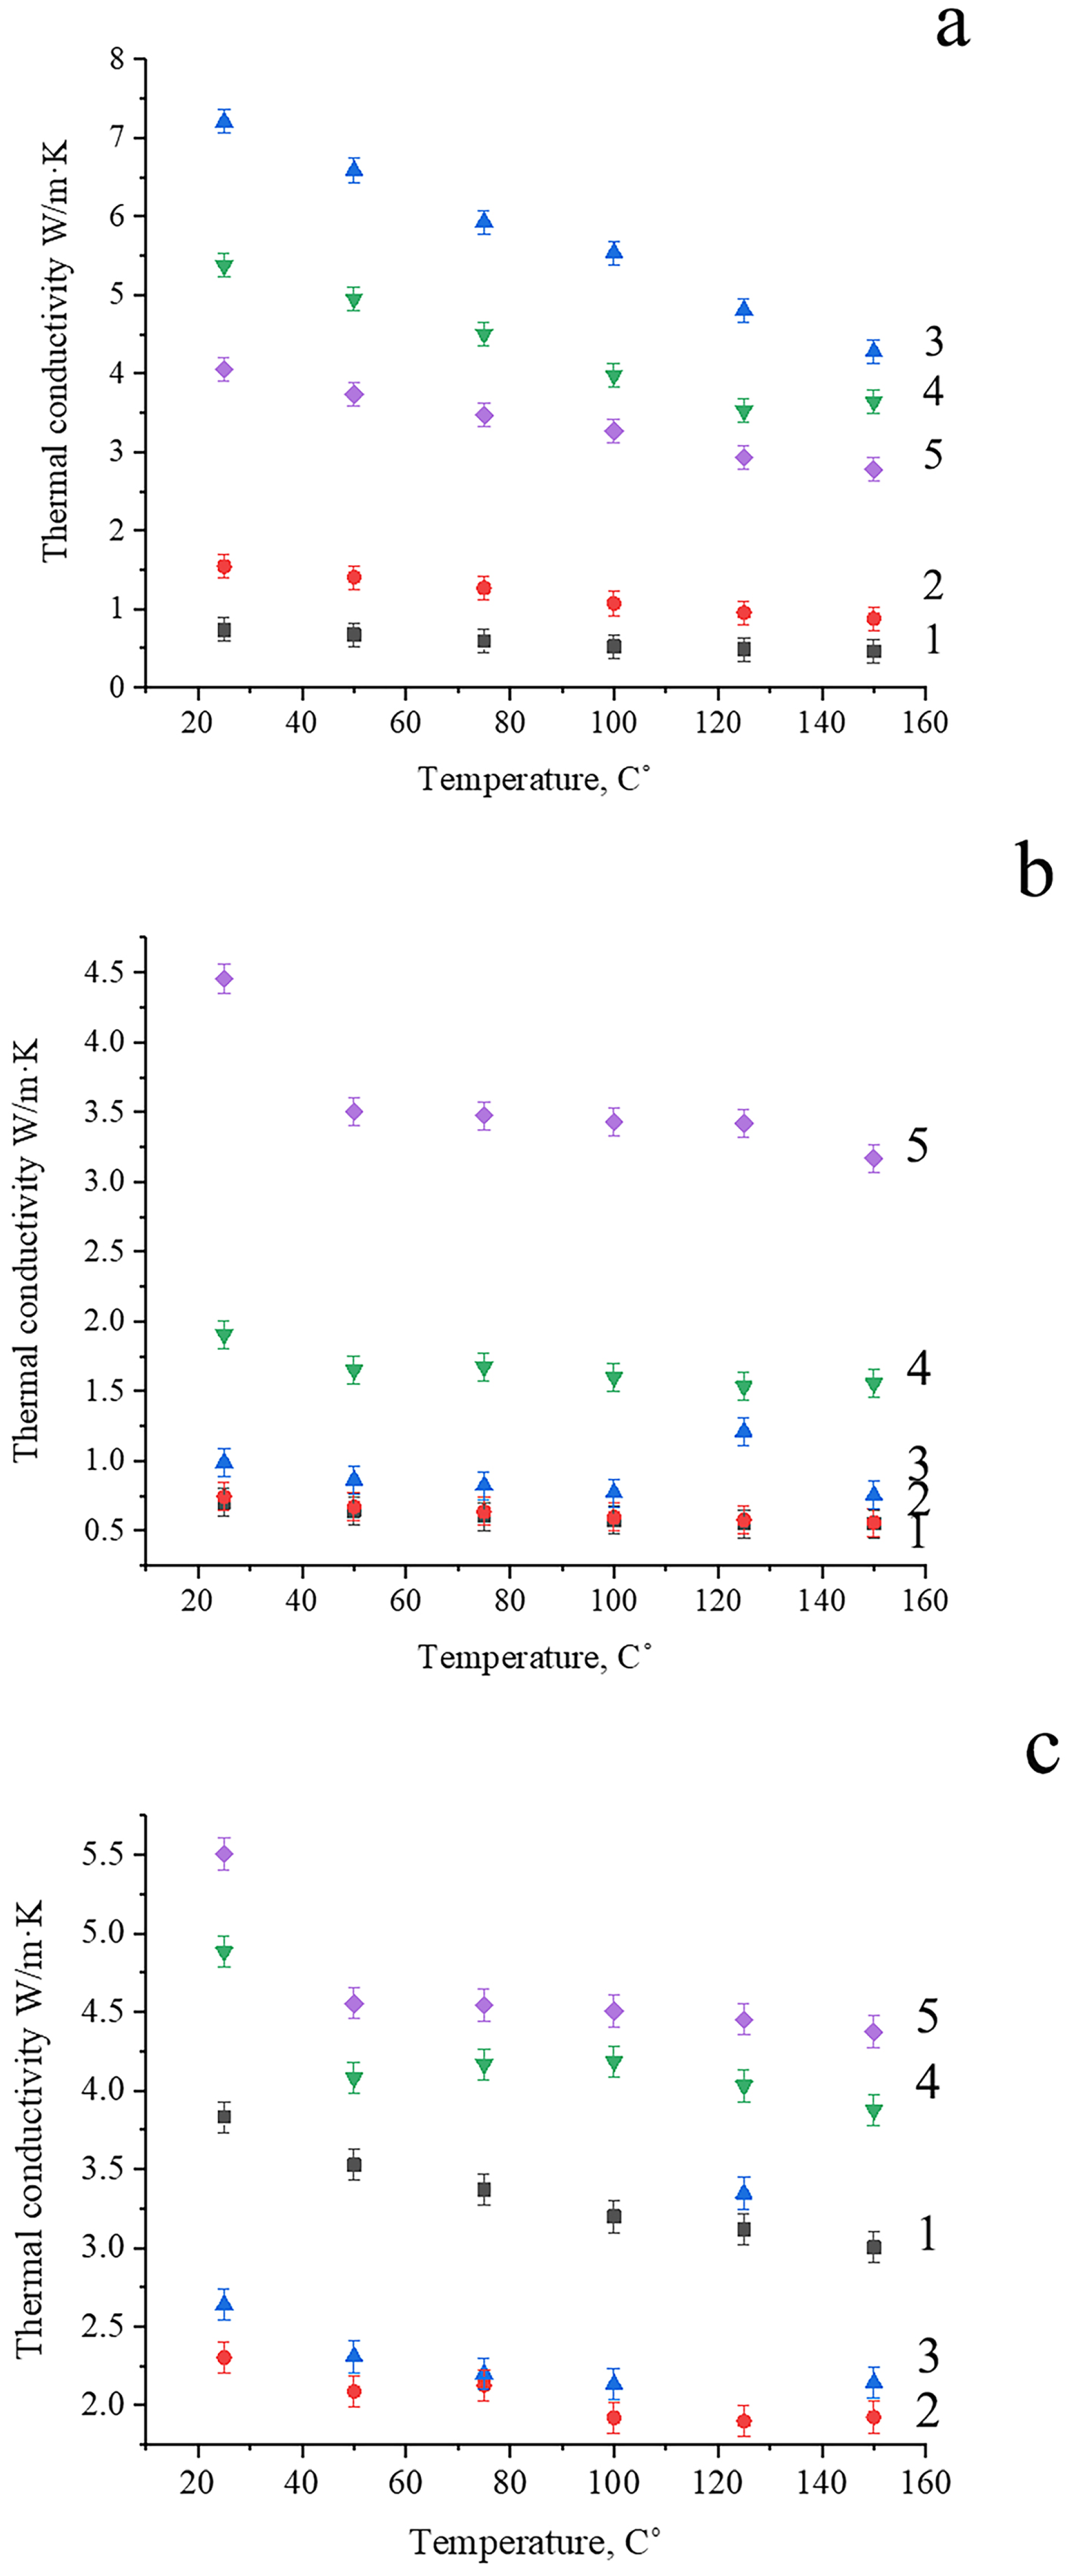
Figure 8 shows the thermal conductivity of the polysulfone filled with varying amounts of graphite filler as a function of temperature. As we can see, the thermal conductivity of the composite decreased with increase of temperature up to 150 °C. The decrease in the thermal conductivity values of these composites may be caused by the phonon-phonon scattering rate, which is predicted to increase with temperature. As the establishment of a thermal pathway in the polymeric matrix leads to thermal conductivity, it reduces phonon scattering mechanisms and improves phonon transport. This analysis agrees with previous research that suggested that the observed relationship between thermal conductivity and temperature was caused by the fact that with increasing temperature, the intensity of thermal vibrations of atoms and molecules in the material increases, which seriously affected the movement of electrons and phonons across the composite films, reducing the in-plane thermal conductivity values.
Although using graphite as a filler generally increases thermal conductivity, each type of graphite has unique properties and effects on the thermal conductivity of the composite. This can be explained by the fact that increasing the mass fraction of graphite in the composites caused the development of compact graphite networks, which offered pathways for thermal conductivity and, as a result, increased the rate of heat transfer. From
Figure 8b, we can see that using AG at low filler content, the filler particles separated by the PSU matrix started to form an effective thermal conduction path. However, after a filler proportion exceeded the thermal permeation threshold, the thermal conductivity of the composite increased more rapidly due to the increase in forming a thermal network among the fillers. Thus, using AG as a filler, the thermal conductivity seems to increase quickly at filler mass fraction 50 wt.%. and this is because a critical concentration arrives at this area, causing the filler molecules to be in close contact with one another. However, point interactions between the particles lead to lower thermal conductivity values than natural graphite.
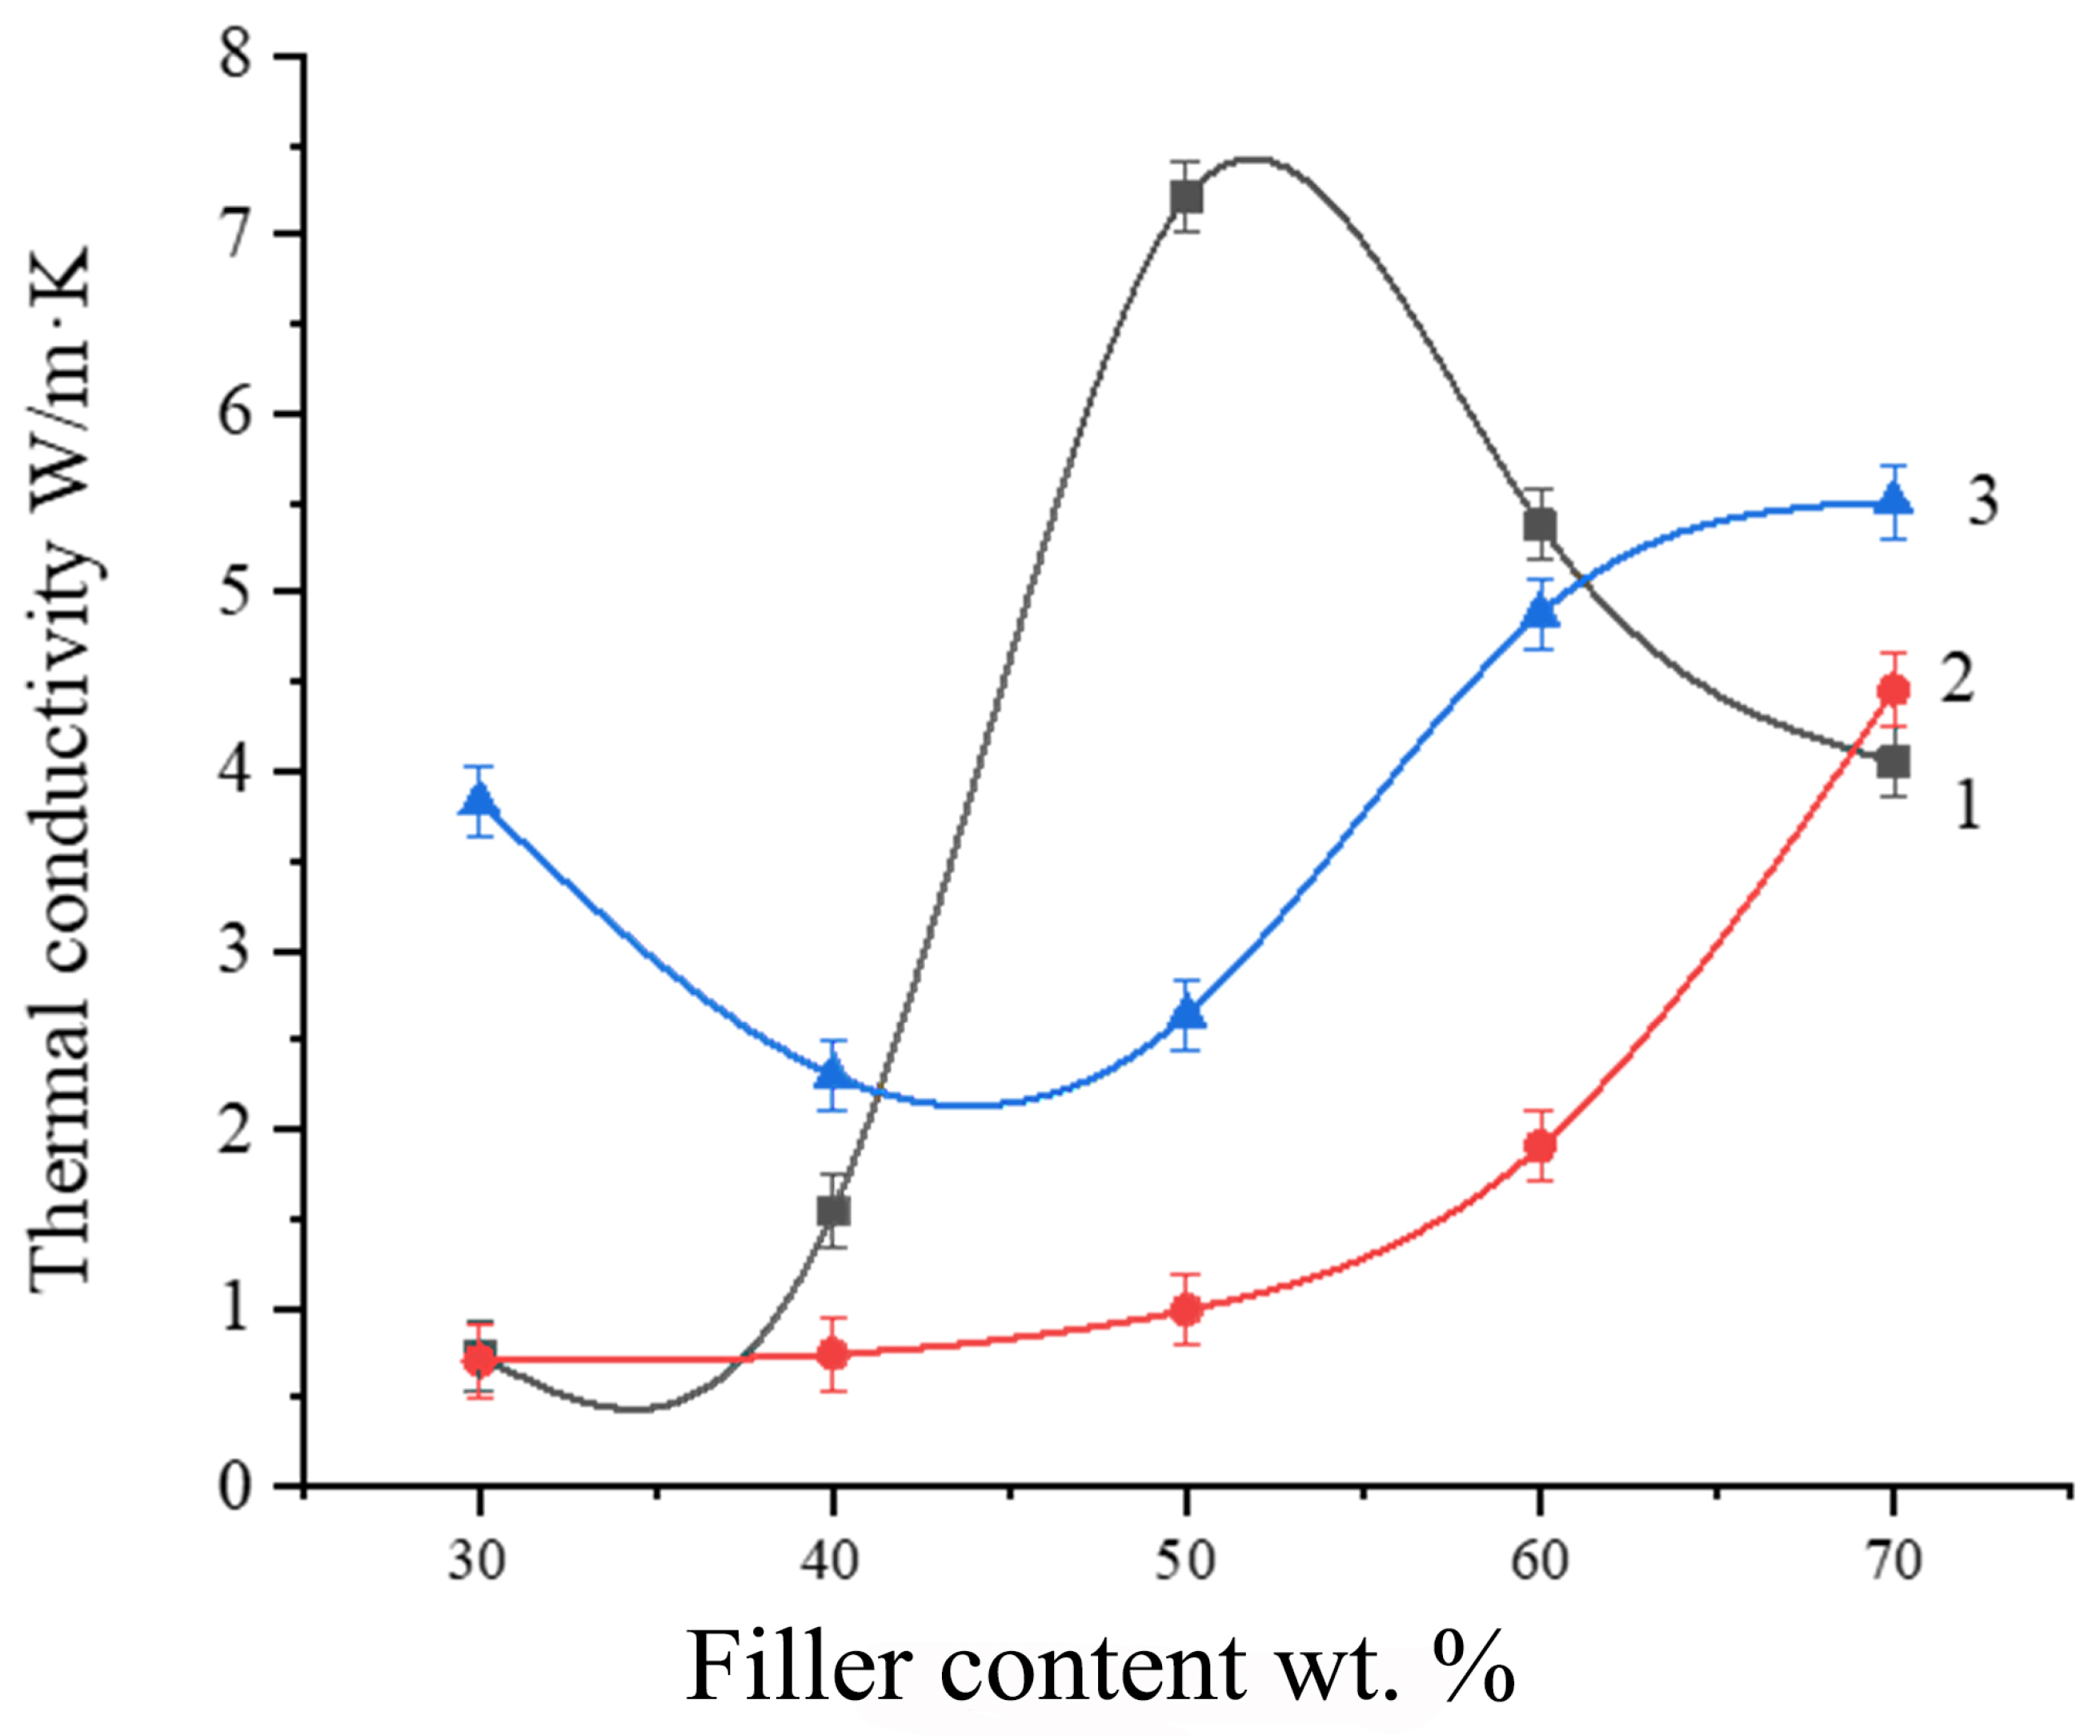
The maximum thermal conductivity of the PSU-based composite filled with 50 wt.% NG, 70 wt.% AG and 70 wt.% EG reached 7.35 W/m · K, 4.45 W/m · Kand 5.05 W/m · K, respectively, as shown in
Figure 9. We can notice the difference between 50 wt.% NG, AG and EG as filler—the high thermal conductivity of the composite based on natural graphite as a filler has the best thermal conductivity due to the high aspect ratio and large size of NG’s crystallites, in addition to its crystal structure being closer to an ideal single-crystal material than AG and EG. As the content of NG was raised above 50 wt.% the thermal conductivity started decreasing; this phenomenon could be explained by the aggregation of PSU/Gr in addition to the pore defects of the composite. As the filler content was raised, the density started decreasing and after using 50 wt.% of EG it started rising which was explained in
Section 3.2. This can be attributed to the variation in thermal conductivity when EG is used as a filler. We can see that the pores affect the thermal conductivity, but as the composite became denser the thermal conductivity increased. In addition, the agglomerations became bigger for EG and AG and the pores became more numerous.
We may assume from SEM images that the porosity of the composite, which increased as the filler amount increased, prevented the conduction routes from effectively transferring heat. Grundler et al. [
38] investigated the effect of increasing the graphite filler content on the thermal conductivity in polyamide 6/graphite composite and found that the thermal conductivity improves with increasing the filler concentration. The maximum thermal conductivity was 28 W/m · K when 75 wt.% graphite was used. The thermal conductivity was 9 W/m. K by using 50 wt.% of graphite, which is less than the value we were able to attain using 50 wt.% of natural graphite as filler. We can conclude from their results that they achieved superior filler dispersion in the polymeric matrix compared to our findings, since polysulfone and polyamide have distinct characteristics.
Deliang Sun et al. [
39] also employed PSU as a matrix to manufacture the composite, and applied injection molding while employing carbon fiber as a filler up to 26 vol.%. The best thermal conductivity they could achieve was 1 W/m · K. According to their SEM analysis, the majority of the skin layer’s fibers are randomly distributed along the X-Z axis and connect to one another to form a thermal conductivity pathway. In comparison to the core layers, the skin layer is crucial in enhancing the thermal conductivity of composite materials.
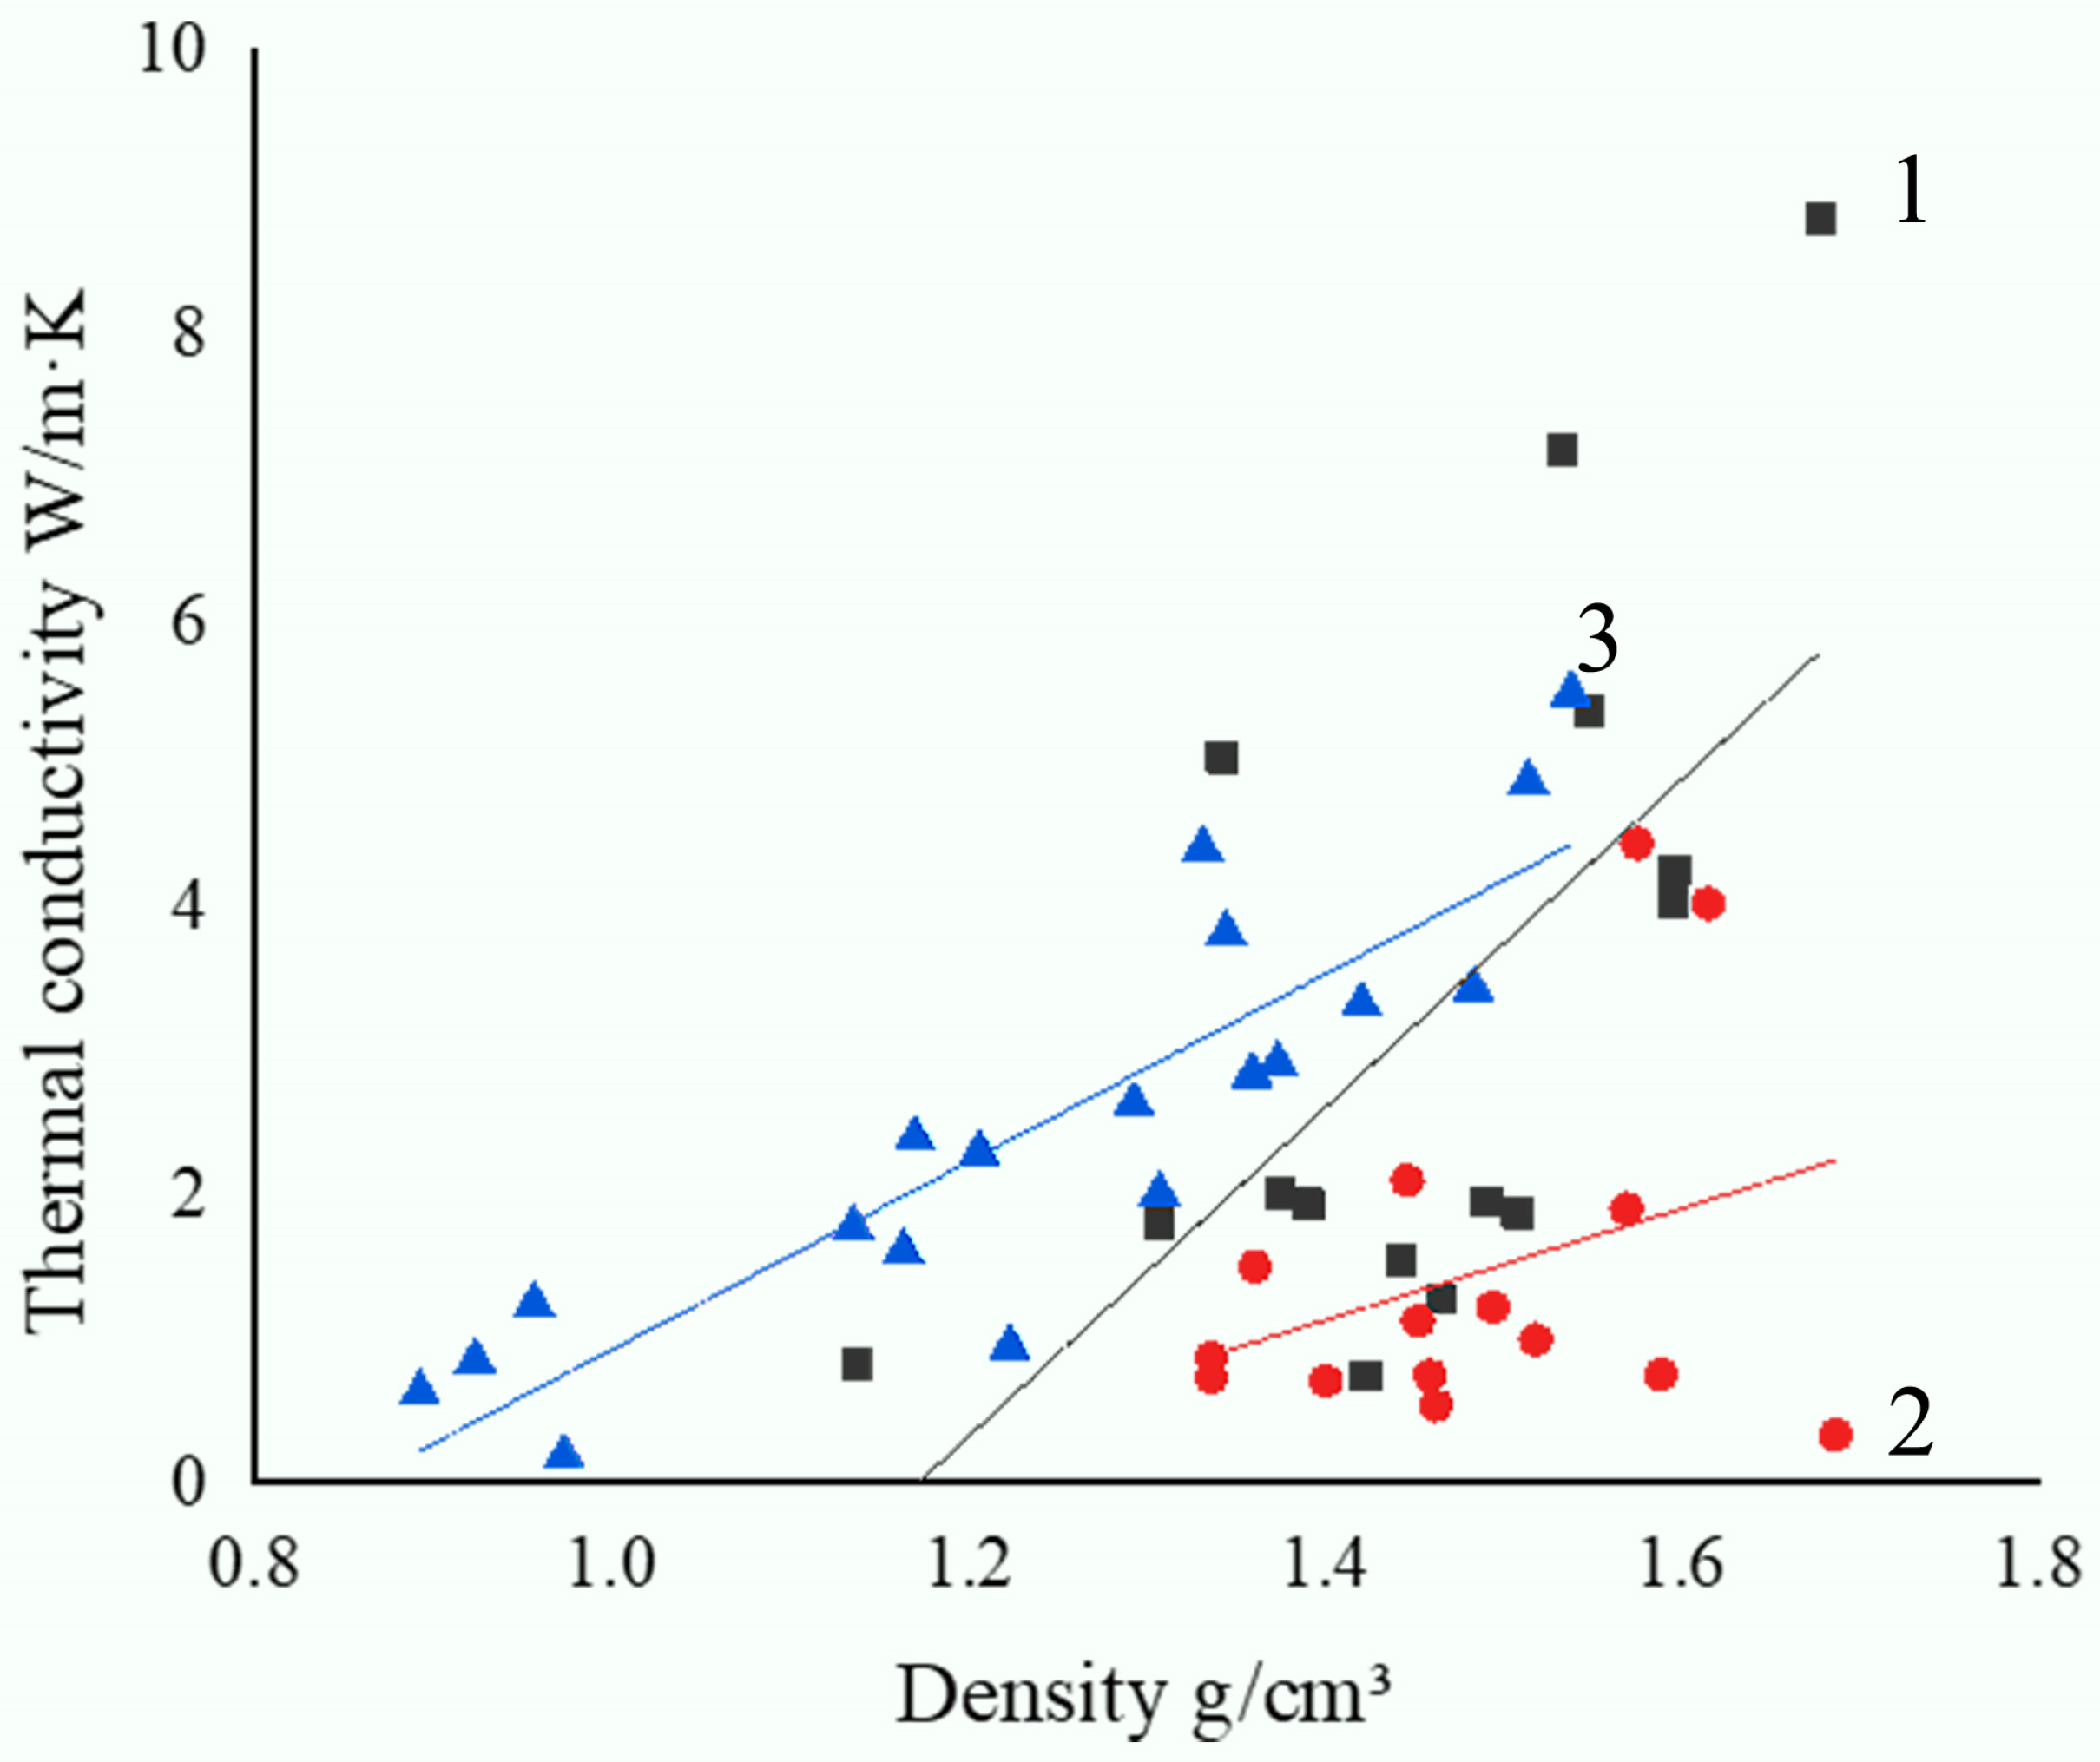
The thermal conductivity of the samples with different filler content and their densities were measured, in order to investigate the relationship between thermal conductivity and material density.
Measures were taken of the samples which were used in this work and in the previous work.
Figure 10 shows that when material density grows, thermal conductivity also rises as a result of the opportunity for conducting bridges forming between the polymer and the graphite. The thermal conductivity increased dramatically as the density rose above 1.5 g/cm
3. Thermal conductivity increased with increasing density, particularly in the case of PSU/NG. This increase was due to the solid phase created by the mixture of PSU and thermally conductive Gr becoming more and more important for heat conduction.
3.5. Electrical Conductivity
The dispersion, shape and orientation of conductive fillers in an insulator base matrix typically influence both the mechanical characteristics and electrical conductivity of composite materials. Since the filler particles are typically micrometer-sized, relatively significant amounts of fillers are typically required to obtain the threshold percolation value. Poor mechanical qualities and superfluous materials can result from a conductive filler concentration that is too high [
40].
Graphite is a form of filler made of carbon, and at temperatures as high as those of carbon fibers, it has an electrical conductivity of 10
4 S/cm [
41].
The amount of conductive filler in a composite material with a polymeric matrix, the size and shape of its particles and other factors such as the host phase’s adhesion to the matrix, the processing technique and potential interactions between the conductive filler and conductive phase are all related to electrical conductivity.
The variation of the electrical conductivity of the PSU composite filled with NG, AG and EG, as a function of filler content is shown in
Table 5 and demonstrates that the electrical conductivity increases continuously at any level of loading concentration. The electrical conductivity of NG ranges from 0.0305 S/cm for 30 wt.%, 8 S/cm for 40 wt.%, 37.5 S/cm for 50 wt.%, and 49.6 S/cm for 60 wt.%, to 52.9 S/cm for 70 wt.%, whereas AG and EG only reach 3.8 S/cm and 17 S/cm for 70 wt.%, respectively. This is related to the creation of conducting networks and the well-distributed NG sheets inside the polymer. Therefore, it is obvious that the conductivity depends on elements such as the composite’s filler content and how much of it is incorporated into the matrix. In comparison to the small flake filler of AG, the giant graphite flakes in the NG that made up the composite had the lowest resistance at every concentration. Large flake filler composites exhibit better conductivity as expected because it is well known that the size of the grains and crystallites affects the electrical conductivity of carbon composites.
When conducting particles come into contact with one another above a specific particle content, an electrical conduction path forms in an insulating polymer matrix. The packing state of the conducting particles in a matrix was found to be linked with an increase in the probability of contact with each conducting particle. As a result, in NG, the graphite sheets were stacked on top of one another and formed good conductive paths, whereas in AG, the small spheres did not form good conductive paths because the particles compacted together and created agglomerations.
Although EG has a large surface ratio and interactions similar to NG, its electrical conductivity is still lower than that of NG composites, due to a flaw in EG’s structure.
For fuel cell applications, Rzeczkowski et al. [
42] investigated the electrical conductivity of highly filled polypropylene (PP)/graphite composites. The findings indicate that the electrical conductivity tends to rise as filler content does. Even samples containing 10 wt.% graphite are electrically percolated and have conductivities of about 0.6 S/cm. The conductivity values start to climb practically linearly at 20 weight percent graphite, reaching a maximum of 15.9 S/cm for PP composites with 80 wt.% graphite.
The thermal conductivity was measured perpendicular to the axis of the graphite sheets placed in the matrix, so its values are less than they would be if it was measured along the axis of the graphite sheets as we did in measuring the electrical conductivity, where the electrical conductivity of the current passing through the compound was measured horizontally. In comparison to AG and EG, NG sheets have a larger surface area and dispersed in the matrix in a more organized way; they were well compacted with the matrix, which increased their conductivity because the graphite sheets more efficiently created conductive channels. The dispersion of EG is similar to NG but due to its structural defects it could not be as efficient as NG in conductive properties.
As we previously said, the conductivity of AG is lower than that of NG and EG because its conductivity paths are created by point interactions between graphite particles.
4. Summary and Conclusions
Thermo-electroconductive composites are cutting-edge materials that are frequently employed in a variety of sectors, including the machine-building and construction industries. These materials, for instance, can be used as sensors to track changes in structures, shield stray currents from electrification networks, block electromagnetic radiation in operating rooms, provide cathodic protection from moisture or shield buildings from high voltages.
This study focuses on the study of thermoelectrically conductive polymeric composites containing fillers made of graphite. In this study, we examined the electroconductive properties of composites with various graphite ratios and kinds, as well as their mechanical characteristics, such as compressive and tensile strength. In this work, the PSU-based composition was prepared using the solution-casting method and filled with different filler concentrations up to 70 wt.%. Three different types of graphite were employed as filler to improve mechanical and thermo-electrical conductivity.
In order to achieve high conductive properties in composites, our work aimed to develop high filled composites with high density and low porosity. Several types of graphite as a filler were used to highlight the effects of filler-type, particle size and aspect ratio on the conductivity and mechanical performance of the composites. The results show that using NG as filler resulted in a denser and lower porosity composite compared to AG and EG. To get rid of high porosity in this study, we improved the preparation method of the samples using a steel mold with holes for a steel frame and improved the mixing process. By achieving a more flawless structure, lowering material porosity, and raising material density, we were able to improve composites’ heat conductivity.
According to the SEM data, percolation grids of AG occur as a result of point connections between graphite particles, whereas in the case of NG, contacts form as a result of particle overlap, allowing for improved heat transmission. Point connections among EG particles cause them to create a grid.
The accomplishment of thermal conductivity of 7.35 W/m · K and electrical conductivity of 52.9 S/cm was made possible by high filling levels using graphite fillers. Natural graphite has been found to have the biggest influence on thermal and electrical properties, while materials containing scattered artificial graphite have the best mechanical features. The resulting materials are appealing for the manufacturing of parts for redox batteries and other electrochemical energy converters because of their advantageous thermal, electrical, and chemical properties.


