1. Introduction
Binocular stereo vision uses two cameras to obtain two-dimensional images of the same scene at different positions simultaneously. The parallax image between the two images is obtained by matching the two images by computer. By relevant calculation combined with the parameters of the binocular camera, the 3D point cloud data corresponding to the object surface can be obtained. The 3D reconstruction of the corresponding scene is realized based on the obtained point cloud data [
1,
2]. Zhang [
3] et al. have used the spatiotemporal correlation of 3D motion in 3D reconstruction technology. Currently, feature-based 3D reconstruction and tracking technology is widely applied in the medical field [
4]. Binocular stereo vision is widely used in robot vision, industrial measurement, medical information processing, and other fields because of its simple equipment and easy operation.
The taxonomy of stereo matching can be divided into two types: local and global. Among them, the taxonomy of the local stereo algorithm can be divided into three aspects: region, function, and phase. Based on the global situation, it can be divided into dynamic programming stereo matching algorithm, graph cutting stereo matching algorithm, belief propagation stereo matching algorithm, and other global-based stereo matching algorithms. As a research difficulty and hotspot in stereo vision, many scholars have conducted the work of studying the three-dimensional sound matching algorithm and solved various problems in stereo matching. For example, in the research of stereo matching algorithms based on the local area and the problem of support window selection in regional stereo matching, Kanade T [
5] has been widely used in the research of stereo matching. For the problems of high algorithm complexity and low matching efficiency in the adaptive window, Fusiello et al. [
6] proposed a matching method based on a multi-window mechanism, which selects the optimal matching window from a certain number of pre-set windows of different shapes, thus reducing the complexity of the algorithm to a certain extent; later, to further improve the matching precision, Samadi et al. [
7] proposed a matching method that introduces non -parameter transformations on the basis of adaptive windows to achieve the rapid and accurate three -dimensional matching of the image, and its effect is more satisfactory. In this work, a matching method that is based on the adaptive window and non-parametric transformation is proposed to realize fast and accurate stereo matching of images. The effect is satisfactory. Aiming at the problem that it is difficult to extract accurate and unique features in a feature-based matching algorithm, Lowe proposed in 1999 and further improved a new local feature extraction operator sift [
8,
9], the corresponding feature points have a suitable effect on scale, rotation, translation, and illumination invariance, and can avoid the influence of affine transformation and noise to a certain extent. Since then, research in this direction has been continuously promoted, and many improved versions of sifting have emerged [
10,
11].To solve the problem of the phase winding in phase acquisition in a phase-based stereo matching algorithm, Zadeh et al. [
12] and Hawi et al. [
13] respectively proposed a method that takes the correlation of band-pass signal obtained by wavelet transform as the matching cost and a stereo matching algorithm that uses phase correlation function to obtain the similarity between corresponding image points, which effectively improves this problem, but there are still some problems in the phase-based matching algorithm, that is, the matching accuracy will decrease with the increase in disparity search range, At the same time, when the output signal amplitude of the band-pass filter is too low, the phase singularity problem may occur, which leads to mismatching.
To overcome the problem that continuity constraints in horizontal and vertical directions cannot be effectively fused in dynamic programming, avoid the generation of fringe defects, and obtain higher matching accuracy, Boykov et al. [
14] proposed an energy function optimization algorithm for graph cuts. Based on this algorithm, many improved algorithms should be put into operation [
15,
16]. This kind of algorithm is the best matching algorithm at present, but it has high complexity and poor real-time performance. In addition, many foreign scholars have studied stereo matching algorithms based on belief propagation [
17,
18], Markov random fields [
19,
20] and artificial intelligence [
21,
22].
At present, the research on the three-dimensional vision of the eyes is mainly concentrated on the three-dimensional sound matching algorithm, but its application background is mainly in industry, aerospace, and other aspects [
22]. However, the research on the three-dimensional reconstruction of the corresponding soft tissue in the surgical robot, which is based on the stereo endoscope, is less [
23]. In this research, much attention is mainly focused on the three-dimensional reconstruction of sparse points. This three-dimensional reconstruction involves two steps. Firstly, the sparse three-dimensional space points are reconstructed. Then, through the sparse points, we can fit the corresponding surface. This method has a great error.
In this study, we focus on a stereo matching algorithm based on the absolute value of gray difference and the Hamming distance corresponding to the census transform of the joint similarity and adaptive weight. Among them, the matching cost calculation method based on a joint similarity measure, the matching cost aggregation method based on adaptive weight, and the specific forms of disparity calculation and post-processing operations are studied. Then, some problems in it are studied, corresponding improvement schemes are proposed, and the matching cost calculation method based on joint similarity measure in the original algorithm is improved. The absolute value of each color channel’s grayscale difference of two pixels in the color image [
24] and the Hamming distance corresponding to the improved census transform is used as their joint similarity measure, and some problems existing in the adaptive weight in the original algorithm are improved. Drawing on the idea of graph cut, certain segmentation rules are equations, and each pixel is segmented by the color and distance similarity between each pixel in the central pixel and the support window.
2. Dataset
In this study, some experiments on the improved stereo matching algorithm, which is based on joint similarity measure and adaptive weight, are carried out. The algorithm is programmed on MATLAB 2010b. The experimental materials used in the experiment are two sets of heart model stereo images and corresponding CT provided by the Imperial University of England. The scan data and a set of actual stereoscopic images of heart soft tissue are available on the open data website of the Imperial University of England (
https://imperialcollegelondon.app.box.com/s/kits2r3uha3fn7zkoyuiikjm1gjnyle3 (accessed on 1 February 2022)). The standard parallax map is to take the left image as the reference image, according to the CT. After scanning the 3D point cloud data and the corresponding stereo endoscope vision system model, the disparity search range is [0, 40] and [0, 50], respectively. The actual scene image is the heart soft tissue stereo image corrected by the image correction algorithm, and the matching accuracy of the algorithm is evaluated by the evaluation standard of mismatched pixels. The evaluation standard of mismatched pixels is shown in Equation (1) [
8,
9].
where
refers to the pixel coordinates of the point,
and
refer to the calculated parallax value and standard parallax value of the corresponding point,
refers to the number of pixel points in the image,
refers to the set parallax value deviation threshold, and
refers to the ratio of the number of pixel points and all pixel points whose deviation between the parallax map and the standard parallax map is greater than the set threshold value. The smaller it is, the higher the matching accuracy and the better the algorithm performance.
Since the standard parallax map corresponding to the heart model image adopted in the experiment was obtained through the three-dimensional point cloud data of CT scan, the visual system model of the corresponding stereo endoscope and related calculations, its parallax value was in the form of double precision, that is, it itself contained certain decimal numbers. In order to set a reasonable allowable error range, parallax deviation threshold was set here. If the disparity between the obtained parallax value and the standard parallax value is greater than 1.5, it is identified as the wrong matching point; otherwise, it is identified as the correct matching point.
3. Methods
In binocular stereo vision, an image pair is obtained by the binocular vision system, and then the parallax image between the two images is obtained after the image pair is processed by a stereo matching algorithm. Among them, the feature-based stereo matching algorithm can obtain sparse disparity images quickly; the global stereo matching algorithm can obtain global optimal dense disparity image, but the complexity of the global stereo matching algorithm is too high, which is not suitable for real-time processing environment; the complexity of the region-based stereo matching algorithm is relatively low and can obtain dense disparity map. In view, the objective of this project is to reconstruct the surface of heart soft tissue, so we need a dense disparity map. At the same time, considering the real-time requirements in the process of endoscopic use, the idea of region-based stereo matching is selected as the main idea of the stereo matching algorithm in this project.
3.1. The Stereo Matching Algorithm in this Paper
The stereo matching algorithm in this project is a new stereo matching algorithm based on the region stereo matching algorithm. The matching cost calculation method combines SAD [
25] and census non-parametric transformation. The aggregation of matching costs is based on the idea of adaptive weight, which changes the weight of each pixel according to the local distribution of pixels in the support window. Finally, the dense disparity image is obtained by left-right consistency detection and post-processing (interpolation, median filtering, etc.).
The matching cost aggregation based on adaptive weight first assigns weight to each pixel in the support window based on the gray scale and distance similarity between each pixel in the support window and the central pixel, that is, the closer the color is and the smaller the distance is, the greater the weight will be. Then, the aggregation matching cost of all pixels in the support window can be obtained according to the assigned weight and corresponding matching cost. This method can effectively avoid the mismatching phenomenon caused by depth discontinuity and color difference. The corresponding gray scale and distance similarity in the adaptive weight refers to the absolute gray scale difference between two pixels and the geometric distance between pixel coordinates, respectively; that is, the weight is assigned according to the absolute gray scale difference between each pixel in the support window and the central pixel and the geometric distance between pixel coordinates. The distribution rule is shown in Equation(2).
where
p is the center pixel of the supporting window,
is the set of all pixel points in the window,
is the weight of pixels in the support window,
,
are pixel coordinates of point
p and point
q, respectively.
,
are the absolute value of gray difference and pixel coordinate geometric distance between point
p and point
q, respectively.
,
are gray and distance factors, respectively, which are used to adjust the influence of the absolute value of gray difference and the geometric distance of pixel coordinates on the weight.
3.2. Matching Cost Calculation Method
The calculation of matching cost is the first step of stereo matching operation, and its calculation method directly affects the accuracy of matching results and the complexity of the matching algorithm. The SAD algorithm is based on the difference of pixel gray values. It assumes that the gray values of the same feature point in the two images are the same, and the matching accuracy is directly related to the size of the support window. Its advantage is that the calculation is simple and fast, and it can obtain dense disparity images. However, it is difficult to complete the correct matching for large areas without texture or weak texture, and it is difficult to complete the correct matching for large areas without texture or weak texture. Shadows and noise are very sensitive. The structure of the census algorithm is relatively simple, the amount of calculation is small, and it can also obtain dense disparity images. The calculation result is only related to the comparison between the intensity values of gray pixel values. Therefore, it has suitable robustness and can effectively avoid the influence of radiation distortion and halo. However, it is easy to produce false matching in texture repetition or similar areas, and the matching performance will be reduced. To combine the advantages of the two algorithms and reduce the mismatching when the two algorithms are used alone, a weighted fusion of the matching cost calculation methods of the two matching algorithms is carried out in this paper to obtain a new matching cost calculation method.
The SAD algorithm uses the sum of absolute values of the difference of gray values of all pixels in the support window as its matching cost. Considering that the existing image is generally a color image, to make full use of the information contained in the color image, the sum of the absolute values of the difference between the gray values of the three-color channels of the color image is used as the matching cost of two pixels. Then, the two points’ corresponding matching cost in the left and right image support Windows is shown in Equation (3).
Among them, the gray similarity between the two pixels corresponding to the value , and respectively, represents the gray value of the pixel in the left image and the corresponding pixel in the right image on the color channel ), which refers to the visual difference.
Noise is an inevitable attribute when a camera acquires an image. It is a point with a jump in the intensity value compared with the surrounding area, so it will lead to a high matching cost. To reduce its adverse effects, truncated absolute differences (TAD) are introduced here, as shown in Equation (4).
where
is the set truncation absolute error value.
The census algorithm is a non-parametric transformation method that transforms the pixels in the matching window according to the transformation rules. The size relationship between the gray value of the center pixel of the window and the neighboring pixels in the window is transformed into a continuous bit string. The Hamming distance of the bit string of the corresponding block in the left and right images is used to measure the matching degree. The smaller the distance, the higher the matching degree.
However, the basic census method is used for the gray image. To make full use of the information contained in the color image, the color distance between the neighborhood pixel and the center pixel in the matching window is used as a reference. To reduce the algorithm’s complexity, the Manhattan distance is selected as the color distance, as shown in Equation (5).
where
is the Manhattan distance of the color between the points, and
refers to the gray value on the corresponding color channel
) at the point
.
The traditional census algorithm is very dependent on the center pixel’s gray value. That is, if the center point changes suddenly due to noise, the bit string generated by it will no longer be correct. That is, it is vulnerable to noise interference. To solve this problem, the standard deviation of Manhattan color distance between all neighborhood pixels and center pixels in the support window and the difference between Manhattan color distance corresponding to neighborhood pixels and average Manhattan color distance between neighborhood pixels are selected to replace the gray values of center and neighborhood pixels in the traditional census algorithm, so that the gray value of center and neighborhood pixels can be replaced. When the pixels change suddenly due to noise, the color image census transform still has suitable rubric properties. At this time, the color image census transformation rule is shown in Equation (6).
where
is any pixel in the support window,
is the standard deviation
of Manhattan color distance between all pixels in the neighborhood and the center pixel, and is the difference between the Manhattan color distance between the point
and the center point
and the average value of the Manhattan color distance between all pixels in the neighborhood and the center pixel, and
is shown in Equation (7).
The left and right color images are transformed according to the census transformation rules shown in Equation (4). That is, after the transformation, the corresponding values of each pixel in the left and right images are bit strings composed of 0 and 1. That is, when matching, the matching cost, which is between the corresponding two points in the left and right images, is the Hamming distance between the corresponding bit strings of these two points, and the matching cost is shown in Equation (8).
By combining the matching cost of SAD and census algorithm, the matching cost (9) between the corresponding two points in the left and right image support Windows is obtained. Among them,
is to adjust the specific gravity between SAD and census.
3.3. Match Cost Aggregation Methods
In the aggregation operation of matching cost, the algorithm selects the support window with a fixed size and shape. Matching cost aggregation means that the matching costs corresponding to all pixels in the support window are accumulated to obtain the overall matching cost of left and right image regions. After aggregating, the matching cost is between the corresponding pixels in the left and right images. However, this method is often based on the premise that all pixels in the window have similar depth information. In fact, in the edge areas such as depth discontinuity and color difference, it often does not meet this condition, so it is easy to produce false matching.
To solve this problem, this algorithm uses an adaptive weight method based on color similarity and distance similarity to aggregate the matching cost, that is, the more similar the color of the neighborhood points and the center points, the greater the allocation weight; the closer the space distance between the inner point and the center point, the greater the allocation weight. Among them, color similarity refers to the degree of color similarity between two pixels. To reduce the amount of calculation, Manhattan color distance is used to describe; distance similarity refers to the geometric distance between two pixels, which is described by the Euclidean distance between pixel coordinates, as shown in Equation (10).
where
is the pixel coordinate of the pixel,
is the Euclidean distance between the two points
,
.
For a central pixel
, the weight of any pixel
in the support window is determined by the color distance and space distance corresponding to the point
, and the weight is shown in Equation (11)
3.4. Parallax Calculation and Post-Processing
After the aggregation calculation of the matching cost, the disparity value corresponding to the minimum matching cost is selected as the disparity value of the corresponding pixel according to the WTA principle, as shown in Equation (12).
D is the set of all parallax values within the allowable parallax range.
In the disparity map based on the WTA principle, there are some mismatching points. To eliminate these mismatches, the left-right consistency constraint is used to detect the resulting disparity map. In stereo matching, when the left image is taken as the reference image, a point p ‘is searched in the right image as the midpoint of the left image. If the right image is used as the reference image, the matching point of “Midpoint” in the left image must be a point; if not, it is an error-matching point.
The left-right consistency constraint is shown in Equation (13). The left-right consistency detection is to use the obtained initial disparity map with the left and right images as the reference image to determine whether the disparity values of the corresponding matching points in the left and right images are equal. If they are equal, they are considered correct matching points. If they are not equal, they are identified as wrong matching points, and their parallax values are determined to be invalid so that their parallax values are 0.
where
is the parallax values of the midpoint
of the left and the midpoint
of the right image, respectively.
For the detected mismatching points, if the difference between the left and right pixels is effective and close to each other, if it does not meet this condition, that is, it is not a single mismatching point, and the corresponding image is taken as the reference image. For the point with an effective disparity value in the window, according to the gray level and distance between the pixels in the window and the central pixel, the disparity value of the point in the window can be directly replaced by the average value of the disparity value. For the mismatched points in the window, the weight is 0, and the average value of the weight disparity value of all points in the window is used to replace the disparity value of the current point, as shown in Equation (14).
Among them, is the new disparity value of non-single mismatched point , is the set of all pixels in the window, and are the weight value and disparity value of point q, respectively.
Because the parallax obtained in the matching process is an integer, and the matching point of the actual left image in the right image is almost impossible to fall on a complete pixel in the right image, that is, the phenomenon of precision loss exists in the previous matching operation. To reduce the precision loss, the parallax image is refined by the sub-pixel enhancement method to obtain sub-pixel precision. The interpolation Equation of the parallax image is shown in Equation (15).
Among them, , , represent the matching cost of point when the parallax is , and , respectively, is the Subpixel-precision disparity value obtained after interpolation. Finally, median filtering is used to smooth the obtained refined disparity map to eliminate possible noise points.
3.5. Improved Stereo Matching Algorithm Based on Joint Similarity Measure and Adaptive Weight
In this paper, the three-dimensional image of the heart soft tissue map is a color image. Compared with a gray image, the color image contains more information. To make full use of the information contained in the color image, this section improves the basic stereo matching algorithm, which is based on joint similarity measure and adaptive weight, To make the best of color image information. Secondly, some problems in adaptive weight are improved.
The implementation process of the improved stereo matching algorithm, which is based on joint similarity measure and adaptive weight, is as follows: the sum of absolute gray difference values of color channels between two pixels (called CAD) and Hamming distance between the corresponding bit strings of improved census transform (called CAD) is as follows. The linear combination of the two is used as the similarity measure. Therefore, in the process of the algorithm, the modified census transform is applied to the left and right images after correction, and then the corresponding CAD and CHD values are obtained according to the gray values of each channel of the left and right images and the improved census transform values, and then the corresponding CAD is obtained. Then, according to the improved adaptive weight method, each pixel in the support window is assigned a weight, and the matching cost of all pixels in the support window is aggregated. After the aggregated matching cost is obtained, the WTA is used to calculate the matching cost. In principle, the best matching points of each pixel are searched, the initial disparity map with the left and right images as reference images is obtained, and the disparity map post-processing operation is carried out on the obtained initial disparity map,
3.6. Matching Cost Calculation Based on the Improved Joint Similarity Measure
Considering that the corresponding heart soft tissue image in this project is a color image, to make full use of the information contained in the color image, the sum of the absolute values of the difference between the gray values of the three-color channels in the color image is selected as the matching cost between the two pixels, and the two points’ corresponding matching cost in the left and right image support Windows is shown in Equation (16).
The traditional census algorithm is used for the grayscale image. In order to make full use of the information contained in the color image, the color distance between the neighborhood pixel and the center pixel in the matching window is used as the feature of each point. To reduce the complexity of the algorithm, Manhattan distance is selected as the color distance, as shown in Equation (17).
where
is the Manhattan distance of the color between the points
p and
q,
refers to the gray value of the corresponding color channel
at the point.
The traditional census algorithm is very dependent on the center pixel’s gray value. That is, if the center point changes suddenly due to noise, the bit string generated by it will no longer be correct. To solve this problem, the standard deviation of the Manhattan color distance between all the neighborhood pixels and the center pixels in the support window is used to replace the center point in the traditional census algorithm, and the difference between the Manhattan color distance corresponding to the neighborhood pixels and the average Manhattan color distance is used to replace the traditional census. In the algorithm, the gray value of the neighboring pixels in algorithm makes the whole change relatively even when the gray value of the central pixel changes due to the influence of noise, making the corresponding bit string basically unchanged, which ensures the census transform’s robustness. The improved census transform rule is shown in Equation (18).
Among them,
is the standard deviation of Manhattan color distance between all neighborhood pixels and center pixels in the support window,
, which is the average value of Manhattan color distance (
q) between point and center point
and Manhattan color distance
between all pixels except the center point in the neighborhood
. The expression of
is shown in Equation (19), where
is the set of all pixels except the center pixel in the support window, and
is the number of midpoints
.
The left and right color images are transformed according to the improved census transform rule shown in Equation (18), and a bit string composed of 0 and 1 is obtained. When matching between the left and right images, the matching cost in the two corresponding points is the Hamming distance between the corresponding bit strings of these two points. The matching cost is shown in Equation (20).
where
,
is the result of the improved census transform of the pixels in the right image corresponding to the point to be matched, and the parallax value is
d, respectively, and
is the matching cost of the parallax value.
To obtain the joint similarity measure composed of
and
, the gray values of each color channel of the color image are normalized, and then the sum of the absolute values of the gray difference of each color channel is calculated. The result is called CAD, and the ratio of Hamming distance of the corresponding census transform to the length of a bit string is obtained, as shown in Equation (20). The result is called CHD, in which
is the length of the bit string.
To avoid the influence of noise and unmatched points, truncated absolute differences (TAD) are introduced here, and the matching cost is shown in Equation (22).
Among them, Ta is the set CAD truncation absolute error value, and Th is the set CHD truncation absolute error value, which is to adjust the proportion between CAD and CHD.
3.7. Matching Cost Aggregation Based on Improved Adaptive Weight
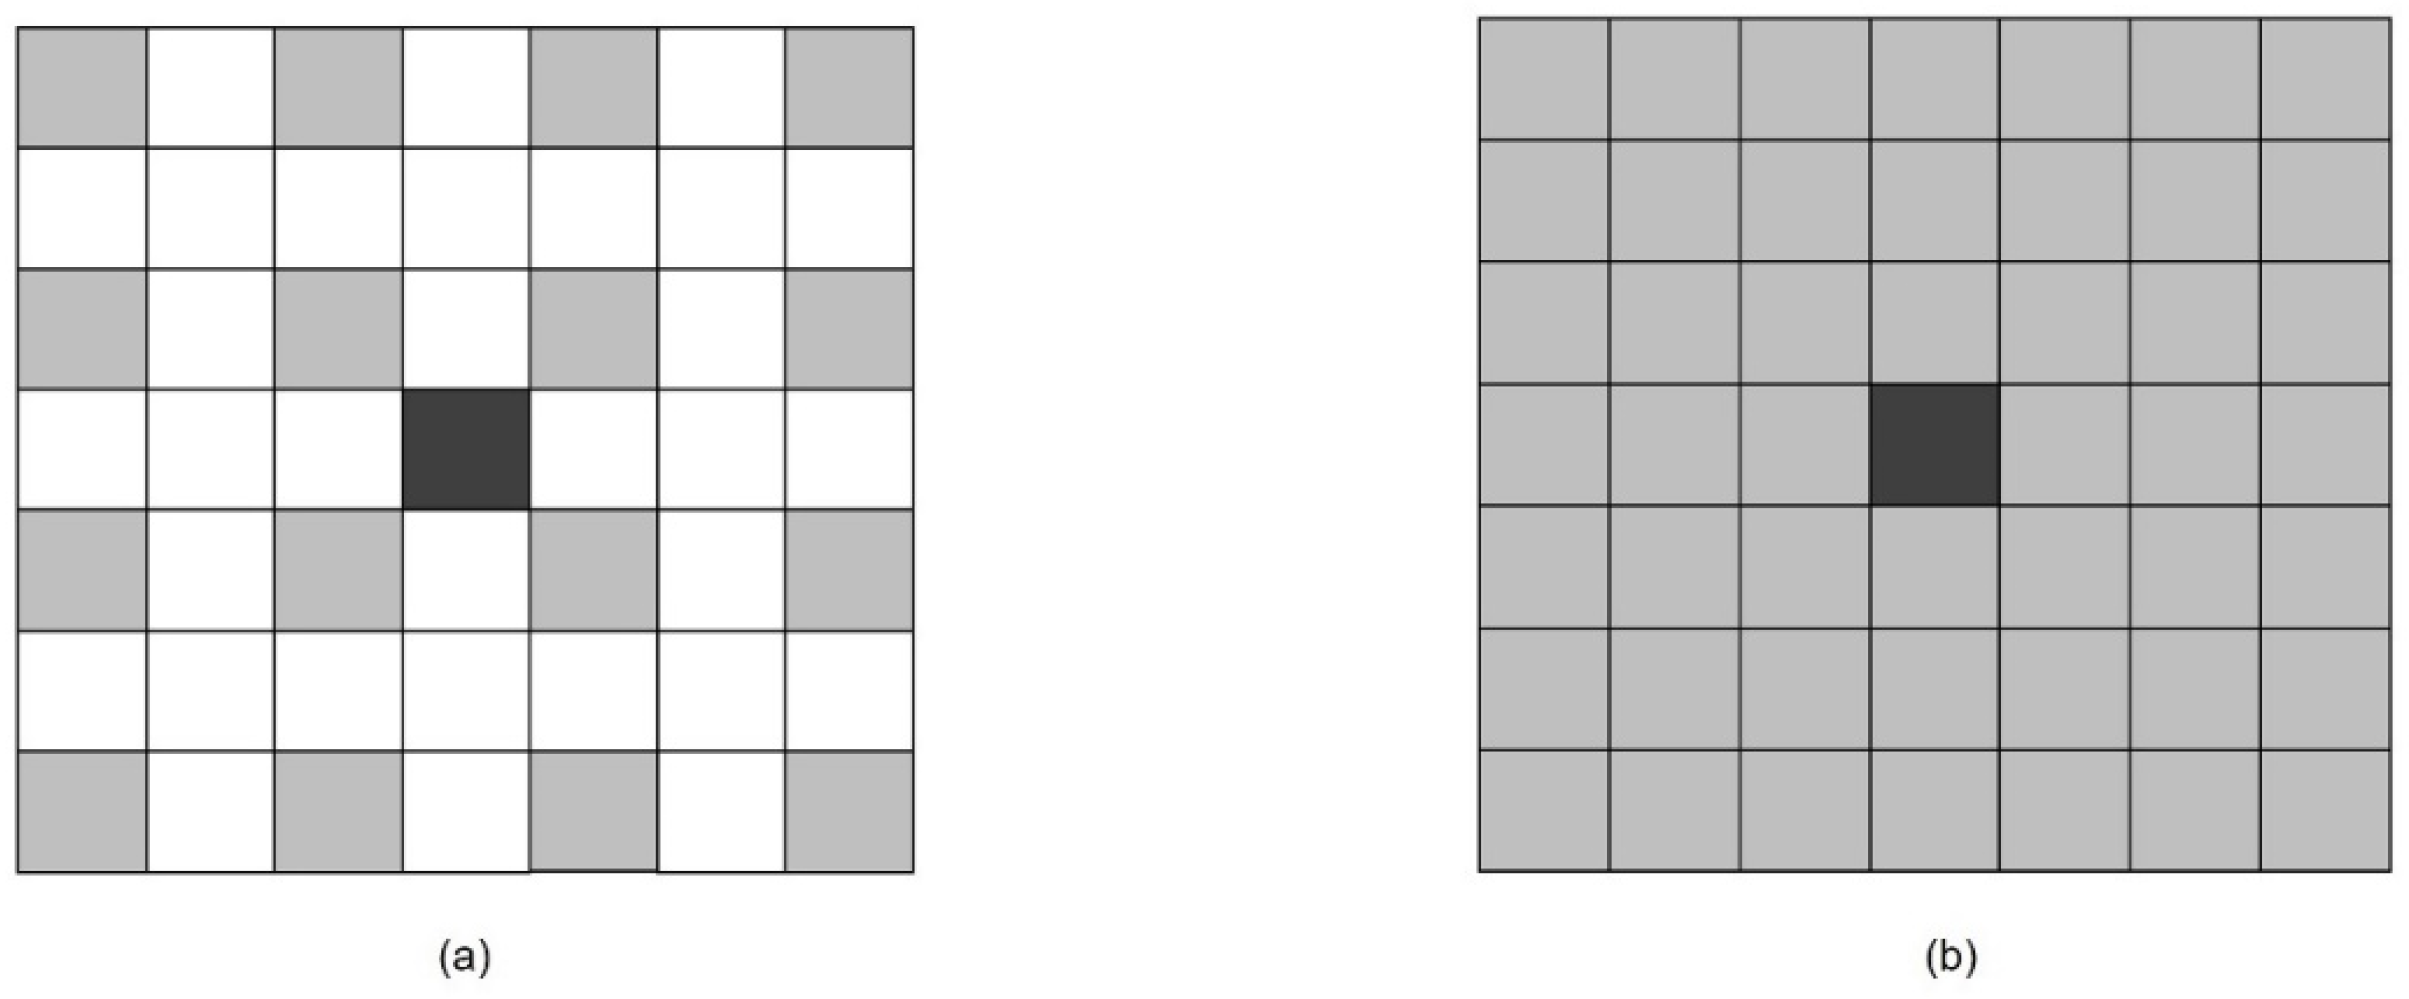
The size and shape of the support window must be determined first in the aggregation operation of matching cost. Since the general support window is a square window with a certain size, which contains all the pixels in the window, to reduce the operation time, this algorithm implements the improved census. The sparse support window is selected when the transformation and matching cost aggregation. The paper [
27] compares the matching effect based on the sparse window and the ordinary window and proves the feasibility of the sparse window. The sparse window and the ordinary window are shown in
Figure 1. If the window size is
, the number of corresponding points in the common window is
. However, the sparse window has only
, which is about 1/4 of the normal window.
When dealing with the problem of mismatching in edge regions, such as depth discontinuity, the matching cost aggregation method based on graph cuts can often achieve better results than adaptive weights. However, the matching accuracy corresponding to the method based on graph cuts depends heavily on the segmentation effect. In general, the cost of obtaining high matching accuracy is to enhance the robustness of the segmentation algorithm, and this operation also makes the overall complexity of the algorithm very high. That is, it is not suitable for occasions that require real-time performance. Based on adaptive, the weight method is relatively stable and less complex than the graph cut algorithm, but its matching accuracy is lower than that of the graph cut method.
To combine the advantages of graph cuts and adaptive weights, based on the adaptive weight method, we first use the color and distance similarity between the pixels in the support window and the center pixel to segment each pixel in the support window. If the pixel satisfies the set conditions, it is determined that it belongs to the same segmentation unit as the center point, and the maximum weight value 1 is assigned to it; if not, it is determined according to the color and distance similarity between the two pixels. Assigning weights, that is, the complexity of the improved adaptive weighting algorithm, remains unchanged. The rule for judging whether it belongs to the same division unit as the center point is shown in Equation (23).
where
is the corresponding segmentation units of the central pixel
,
are the color difference and distance between the two points
, as shown in Equation (24),
are the threshold value of the set color difference, and
;
are the threshold value of the distance set. When the distance between two pixels is very close, a slightly loose range of color difference is used to judge whether the two pixels belong to the same segmentation unit as the center pixel. When the distance increases, the color threshold is reduced. It is considered that only when the color is very close can they be recognized as belonging to the same segmentation unit. When the distance is too large, it is considered that they do not belong to the same unit.
According to the method, the weight distribution rules of each pixel in the support window can be obtained, as shown in Equation (25).
Among them, and are color and distance factors, which are used to adjust the influence of color difference and distance on weight.
When matching, the weight of each pixel in the support window corresponding to the left and right images is considered. That is, the aggregate matching cost corresponding to two points in the left and right images is shown in Equation (26).
where
is the parallax between the matching points,
and
are the center point in the corresponding support window in the left and right images,
and
are the corresponding matching point in the left and right image support windows, respectively.
is the matching cost of
and
.
5. Discussion
This section mainly carries out some relevant experiments on the improved stereo matching algorithm, which is based on joint similarity measures and adaptive weight. The following discussion can be obtained from the experiments: With the comparison of the standard parallax image and the parallax image corresponding to the census transformation before and after the improvement, it can be seen that in the same case of supporting the size of the window, the traditional census algorithm and the improved census algorithm can obtain relatively complete parallax images. However, there are more obvious error-matching areas corresponding to the parallax images of the traditional census algorithm, and the improved census algorithms are closer to the standard vision image. Count the error-matching rate of the parallax images of the census algorithm before and after the improvement, and it is shown in
Table 1. From the corresponding error-matching rate of the census algorithm before and after the improvement, it can be seen that the corresponding error-matching rate of the two sets of cardiac model images of the traditional census algorithm is more than 25%, while the algorithm after improvement is only about 14%, that is, the corresponding matching effect of the census algorithm that is improved has improved under the same conditions.
When brightness changes, the two algorithms have certain robustness for light distortion. However, the corresponding change in the improved census algorithm is relatively small, and its error-matching rate has decreased significantly.
By comparing the result parallax images with the standard parallax images corresponding to the joint similarity measure before and after the improvement, the joint similarity measure before and after the improvement can obtain a relatively complete dense parallax image to a certain extent. However, there are fewer obvious mismatches in the result parallax images corresponding to the improved joint similarity measure. The mismatching rate in the result parallax images corresponding to the joint similarity measure before and after the improvement is counted, respectively, as shown in
Table 2. It can be seen from the table that for the two groups of heart model images, the corresponding mismatching rate of the joint similarity measure after the improvement is lower than that before the improvement, and the corresponding average mismatching rate before and after the improvement is 12.46% and 7.99%, respectively; that is, the matching accuracy after the improvement is greatly improved compared with that before the improvement.
Comparing the standard parallax image with the result parallax images of the adaptive weight (AW) before and after the improvement, it can be seen that under the same conditions, both matching algorithms can obtain a complete parallax image, but there are more mismatching areas in the AW before the improvement, and the mismatching areas are mainly distributed in the areas with a dark color or certain illumination distortion and the areas with obvious color changes, the matching result of the improved AW is closer to the standard parallax image. The mismatching rate in the parallax image of the AW corresponding to matching results before and after the improvement is counted, respectively, as shown in
Table 3. It can be seen from the table that for the two groups of heart model images, the mismatching rate of the AW after the improvement is lower, and the average mismatching rate of the AW before and after the improvement is 7.99% and 5.92%, respectively; that is, the matching effect of improved AW is significantly higher. The main reason is that the improved AW draws on the idea of graph cutting. Therefore, when assigning weights to pixels in the support window, it is more targeted. Therefore, compared with the AW before the improvement, the false matching points of its matching results are reduced, and the matching effect is better in the edge region of color change.
As shown in
Table 4, for two groups of heart model images, the false matching rates of the algorithm before the improvement are 11.74% and 13.17%, respectively, with an average false matching rate of 12.46%, while the improved algorithm is 6.13% and 5.17%, respectively, with an average error-matching rate of 5.92%. Combined with the previous analysis results, the matching accuracy of the heavy stereo matching algorithm of the improved joint similarity measure and adaptive weight has been greatly improved, and the overall matching effect is better.
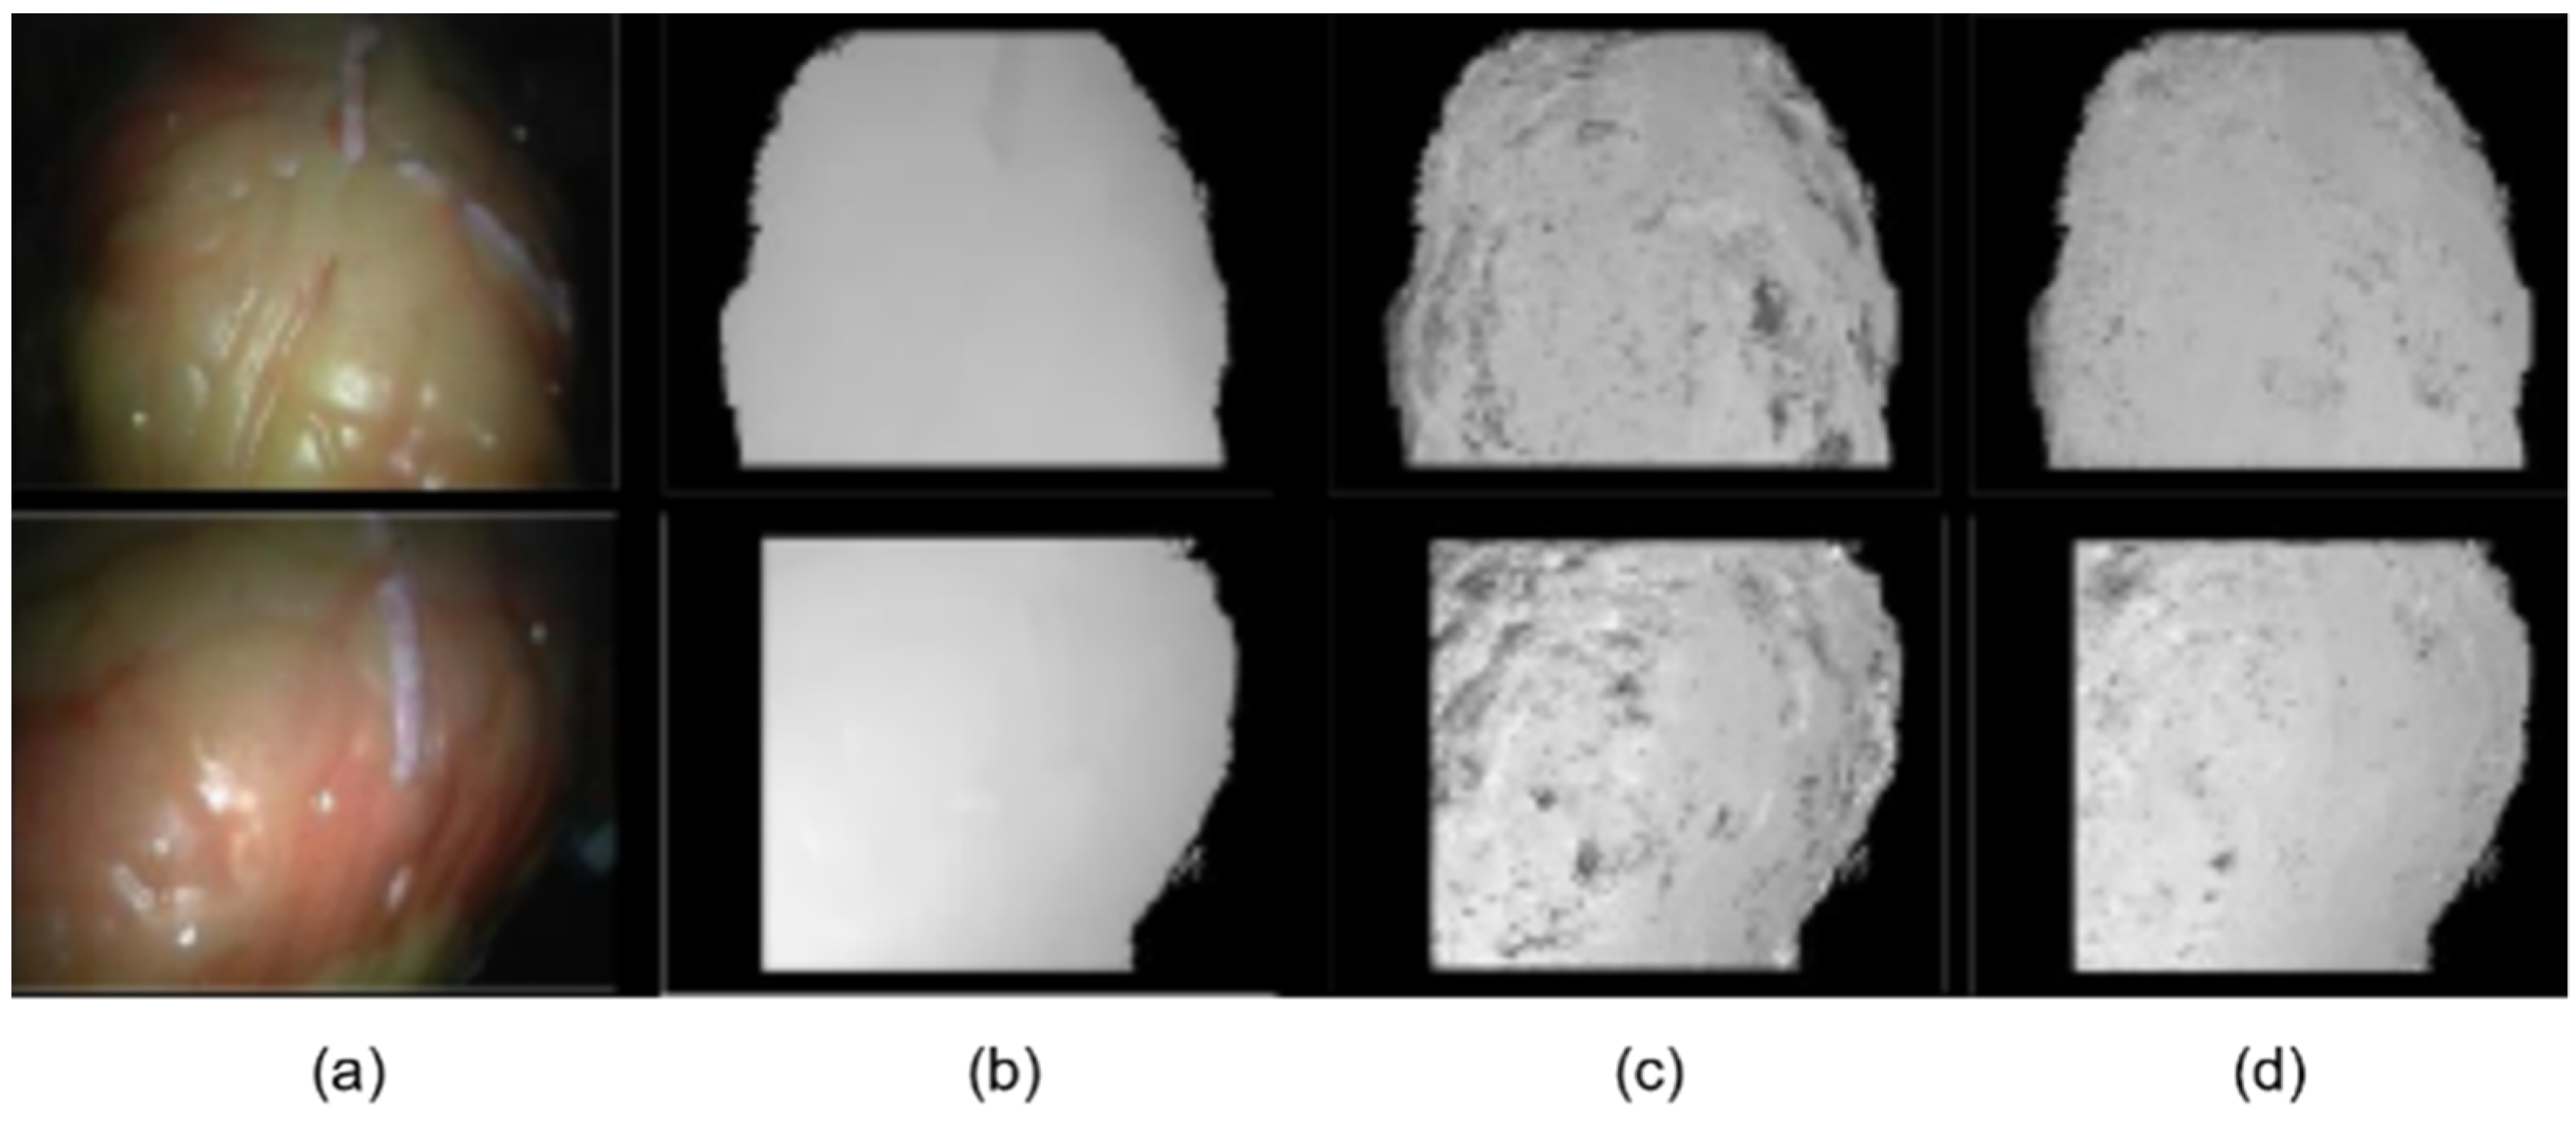
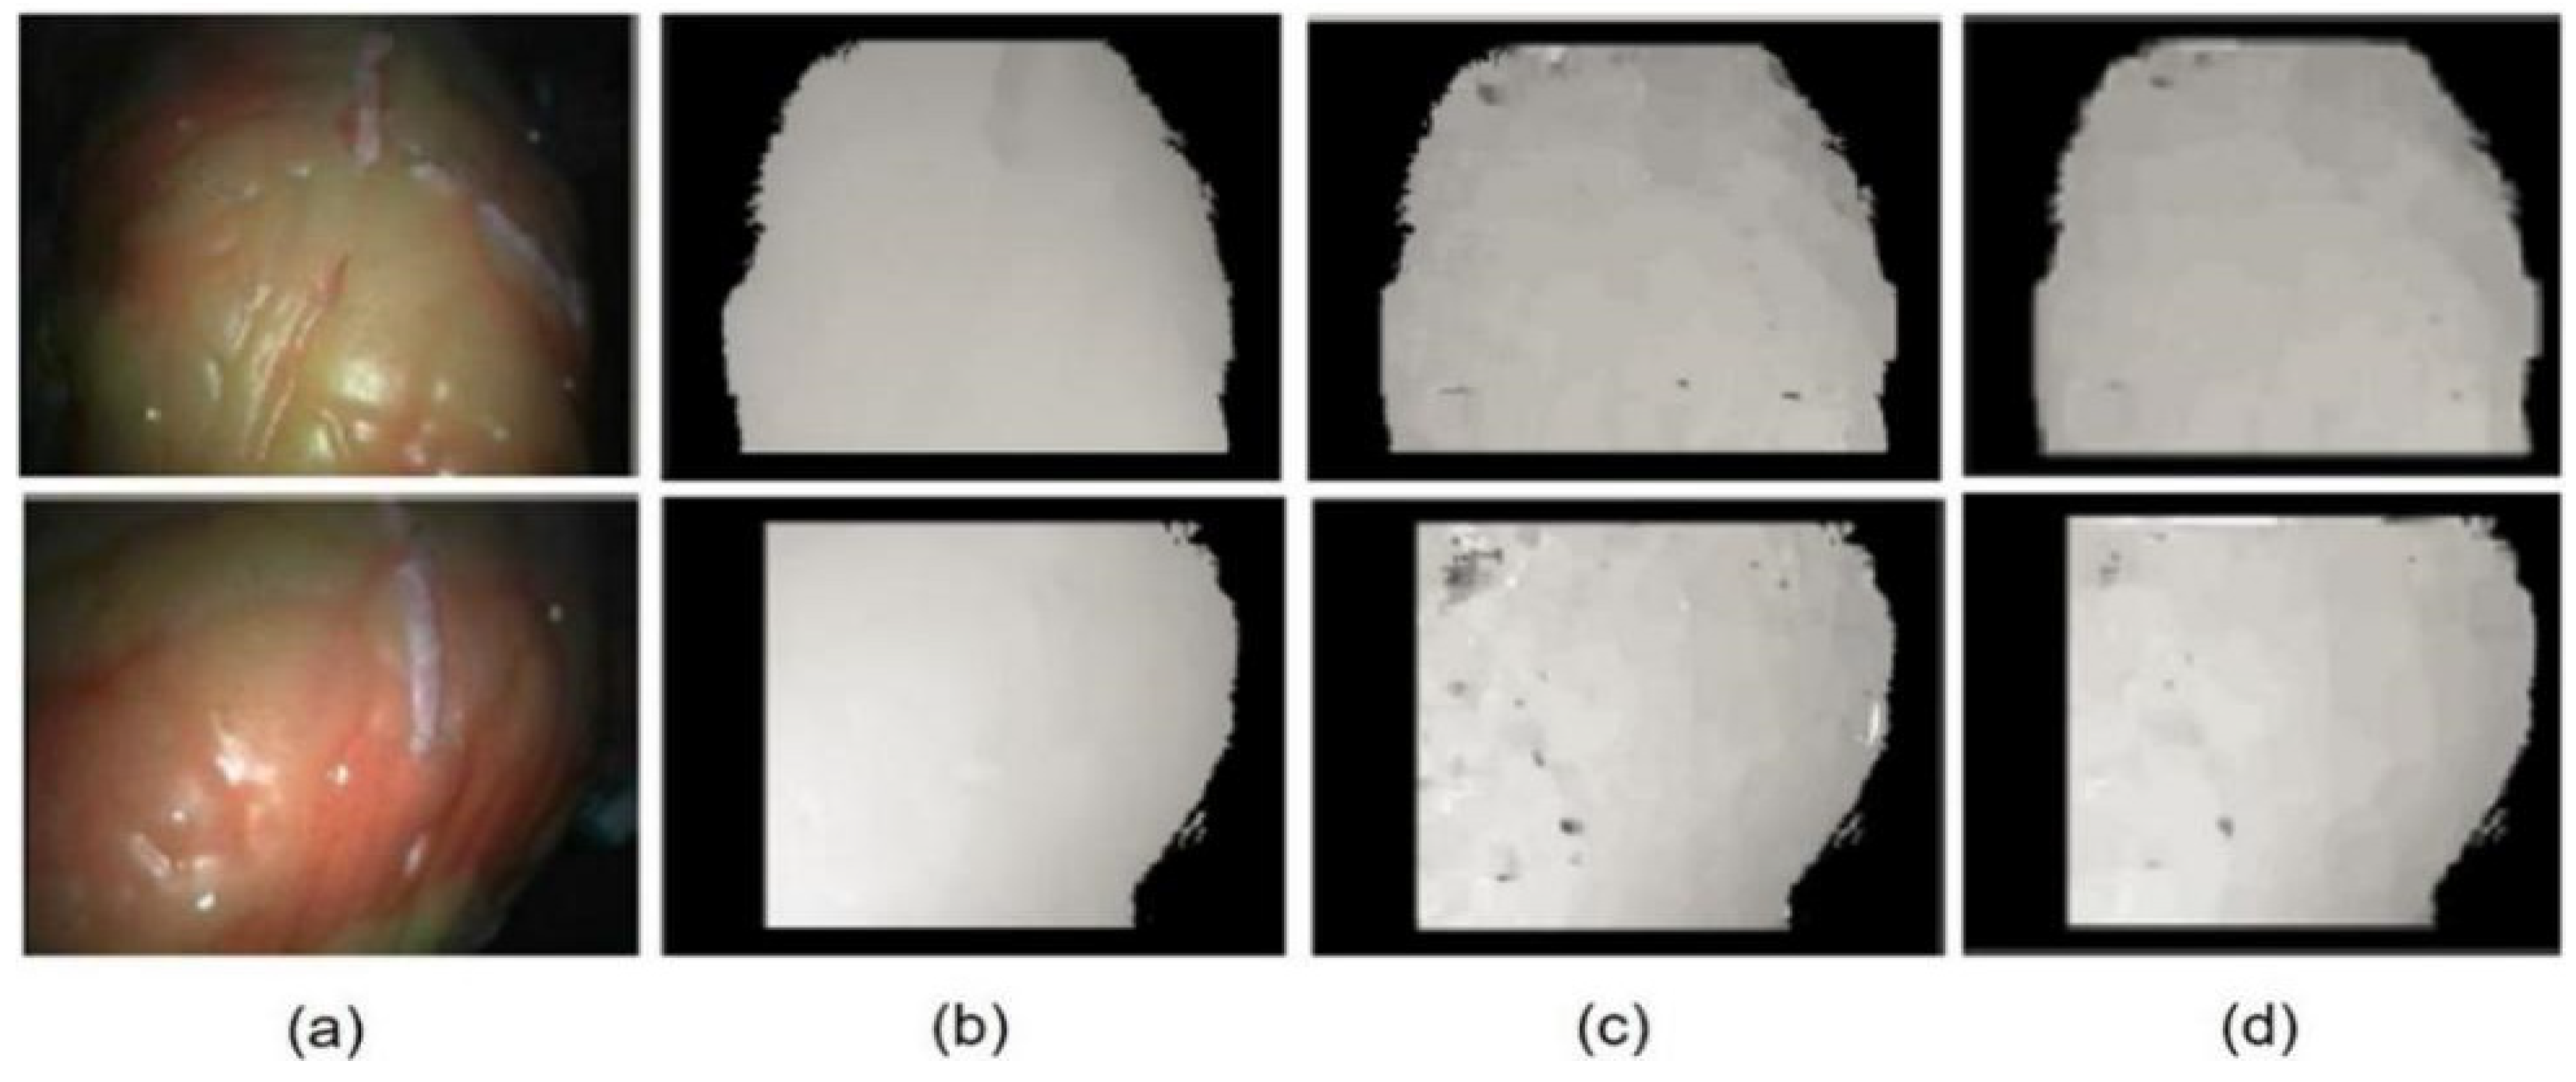
As can be seen from
Figure 8, the first column is the left image in the two groups of heart model images, the second column is the corresponding standard parallax image, and the third column is the final result parallax image corresponding to the two groups of heart model images, and the fourth column is the mismatch distribution corresponding to the final result parallax image. According to the result parallax image and the distribution image of their mismatching points, the mismatching points are mainly distributed in the curved surface area and the area with serious illumination distortion. However, according to the result parallax image, the parallax corresponding to the mismatching points in the illumination distortion area is not very different from the standard parallax value, which shows that the algorithm is robust to illumination distortion. The distribution of mismatched points in the surface area is in the form of stepped small stripes, which are mainly caused by the relatively gentle change of the surface. That is, there is a certain change between the corresponding visual difference of adjacent pixels, but its change value is very small. During the implementation of the algorithm, a single pixel should be taken as the minimum unit, and then sub-pixel enhancement should be carried out according to the matching cost so as to obtain a sub-pixel parallax image. Therefore, there will be some errors in the layered areas in the obtained unprocessed parallax image, so this situation will occur. However, by comparing the standard parallax image with the final result parallax image, it can be seen that the deviation between these mismatched points and the real disparity is still small. That is, the corresponding matching effect of this algorithm is suitable.
To verify the effectiveness of the post-processing process, the corresponding error-matching rate of the before and after post-processing vision images is counted. As shown in
Table 5, the error-matching rate of the sub-vision image is significantly reduced by the post-processing process. That is, the post-processing operation is desirable. After combining the error-matching point distribution of after post-processing parallax figure, it can be seen that the dense vision images obtained by this algorithm are low, and the results figure obtained are basically in line with the image. That is, it can obtain a suitable dense vision image of the heart soft tissue image through this algorithm.
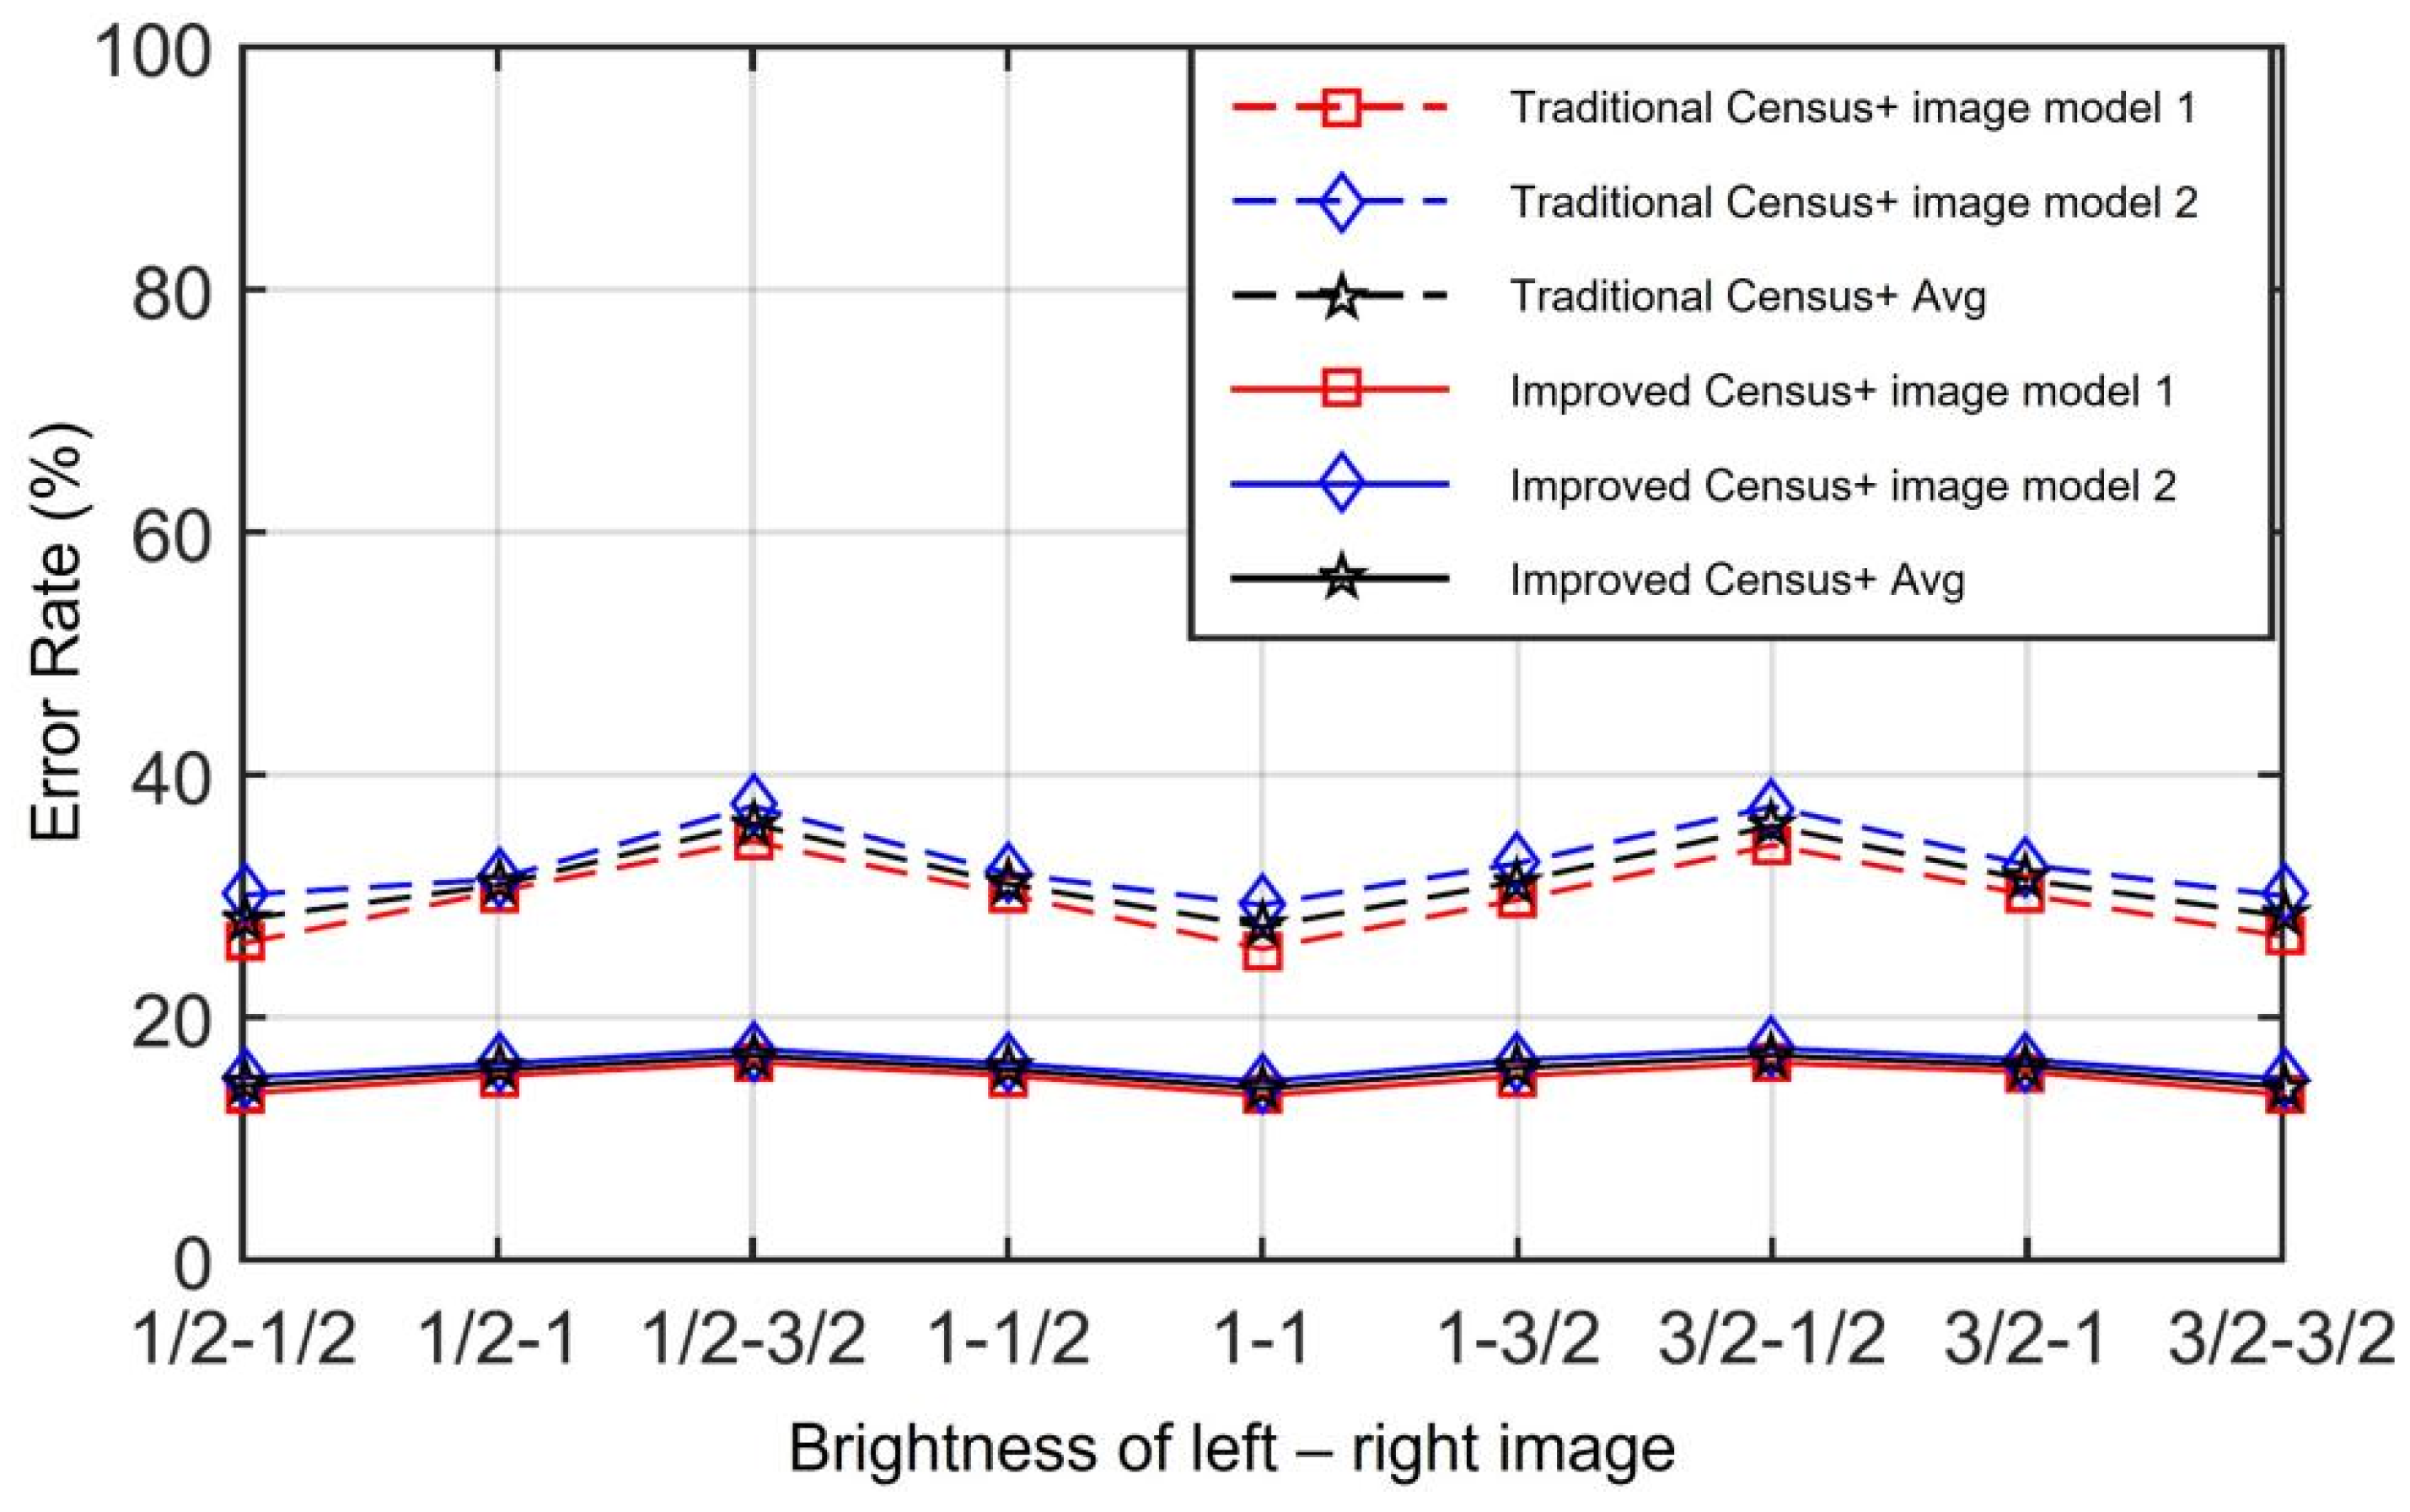
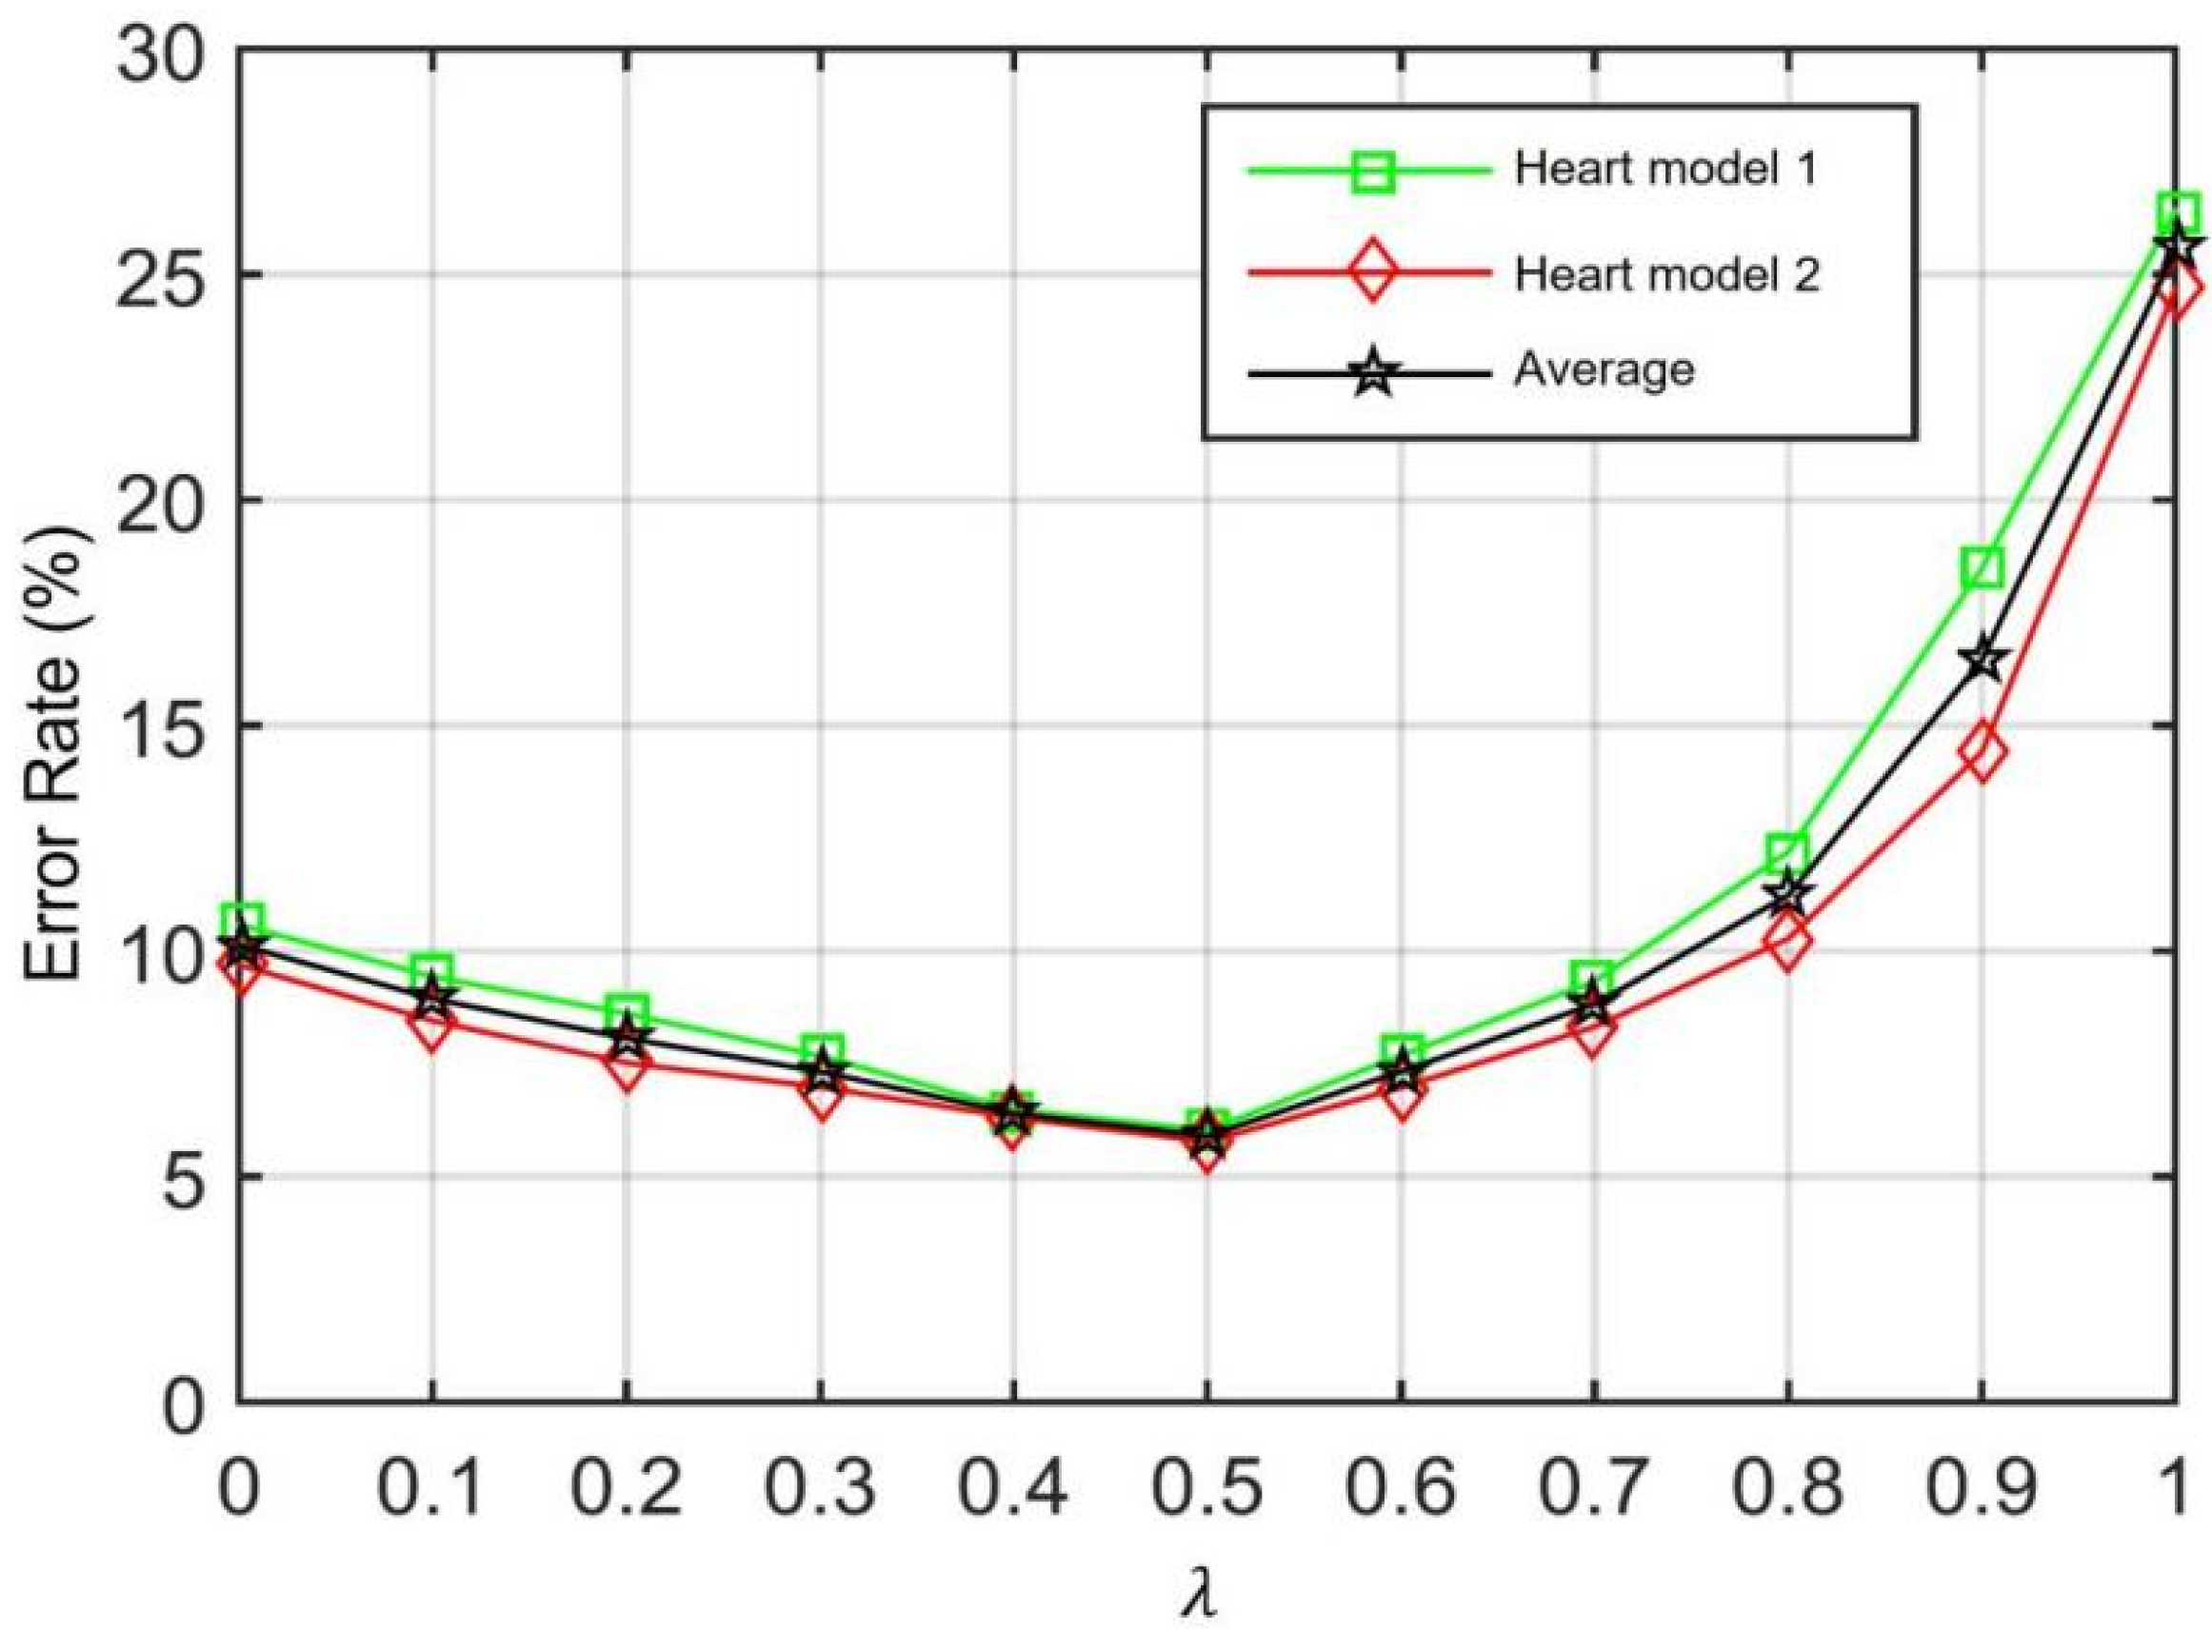
According to the average mismatch rate of each algorithm when combining images with different brightness, when the brightness of the left and right images is different, the corresponding mismatch rate of CAD+AW reaches more than 80%, which basically loses its function. The corresponding mismatch rate of CHD+AW and the algorithm in this paper is about 15%, but the difference between the mismatch rate of CHD+AW when the brightness of the left and right images is different and the brightness is the same, small, and when the brightness of the left and right images of this algorithm is different, its matching effect is basically the same as that of CHD+AW, because when there is a brightness difference between the left and right images, due to the corresponding truncation absolute error value set for CAD, CAD is basically replaced by its truncation absolute error value in parallax calculation; that is, at this time, it is similar to only using CHD as its similarity measure, so when the image brightness is different, the corresponding error-matching rate of this algorithm is only slightly higher than that of CHD+AW. At the same time, when there is no difference in brightness, its matching effect is better than CAD+AW and CHD+AW. In general, this algorithm inherits the robustness of census transform to illumination distortion. At the same time, when there is no difference in brightness, its matching effect is better than that when using a single similarity measure.
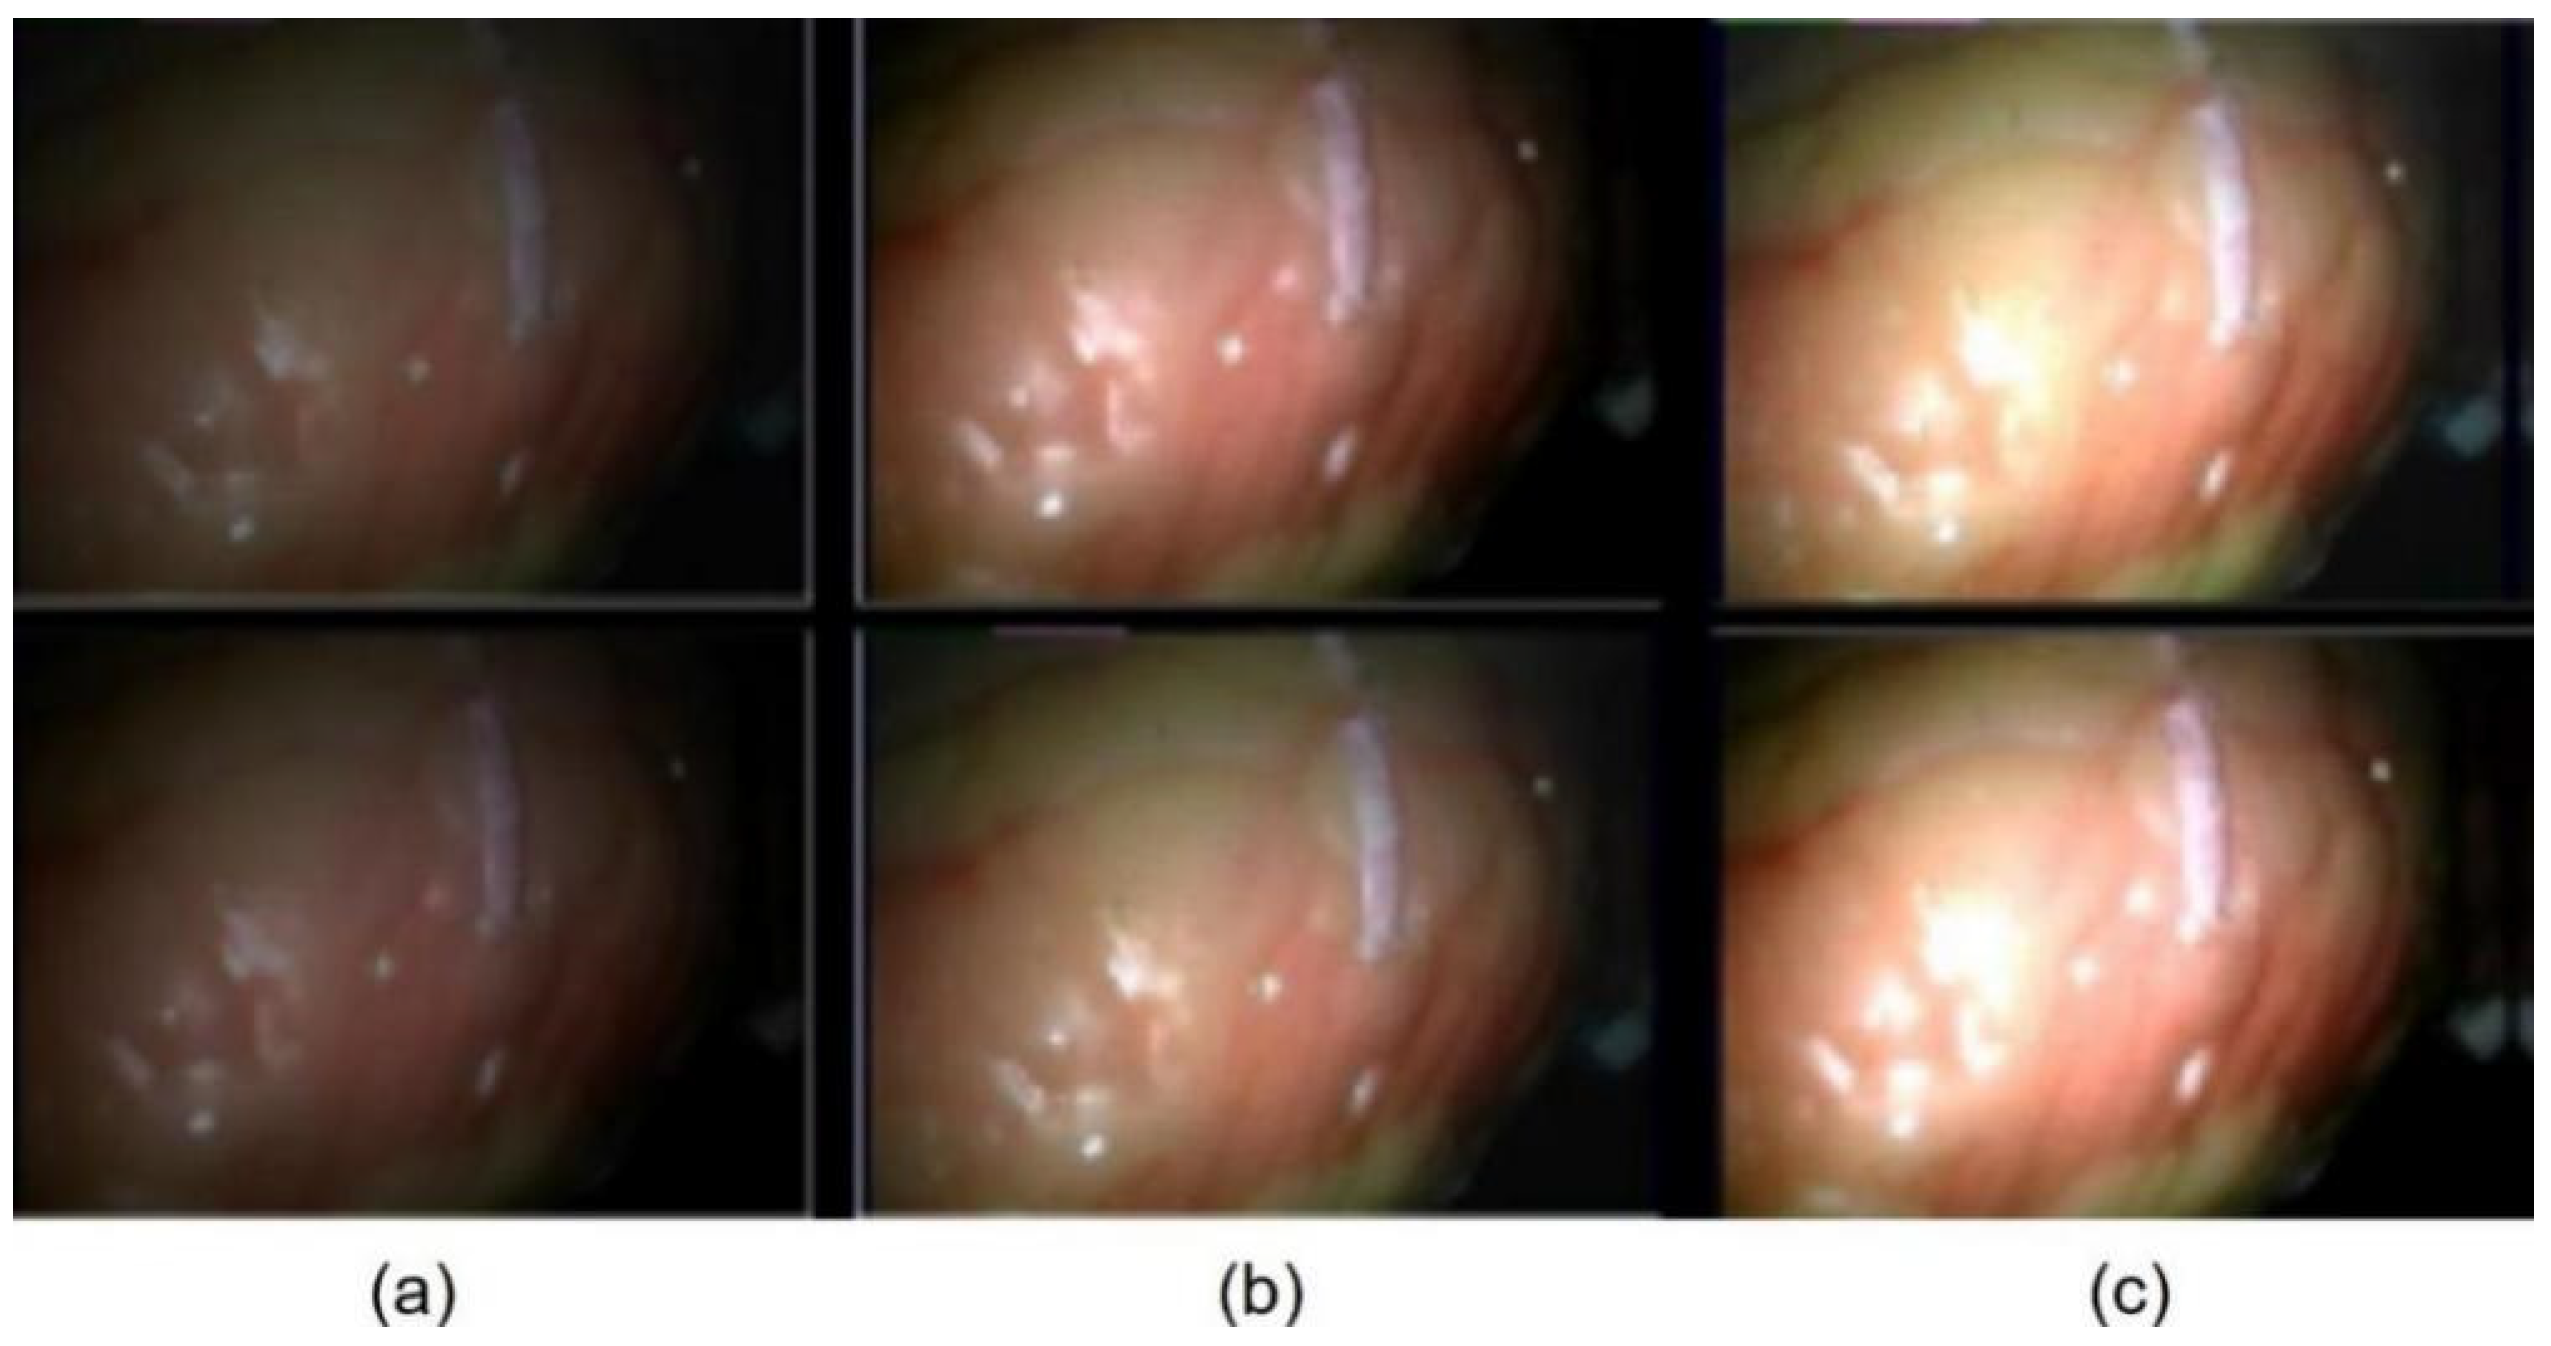
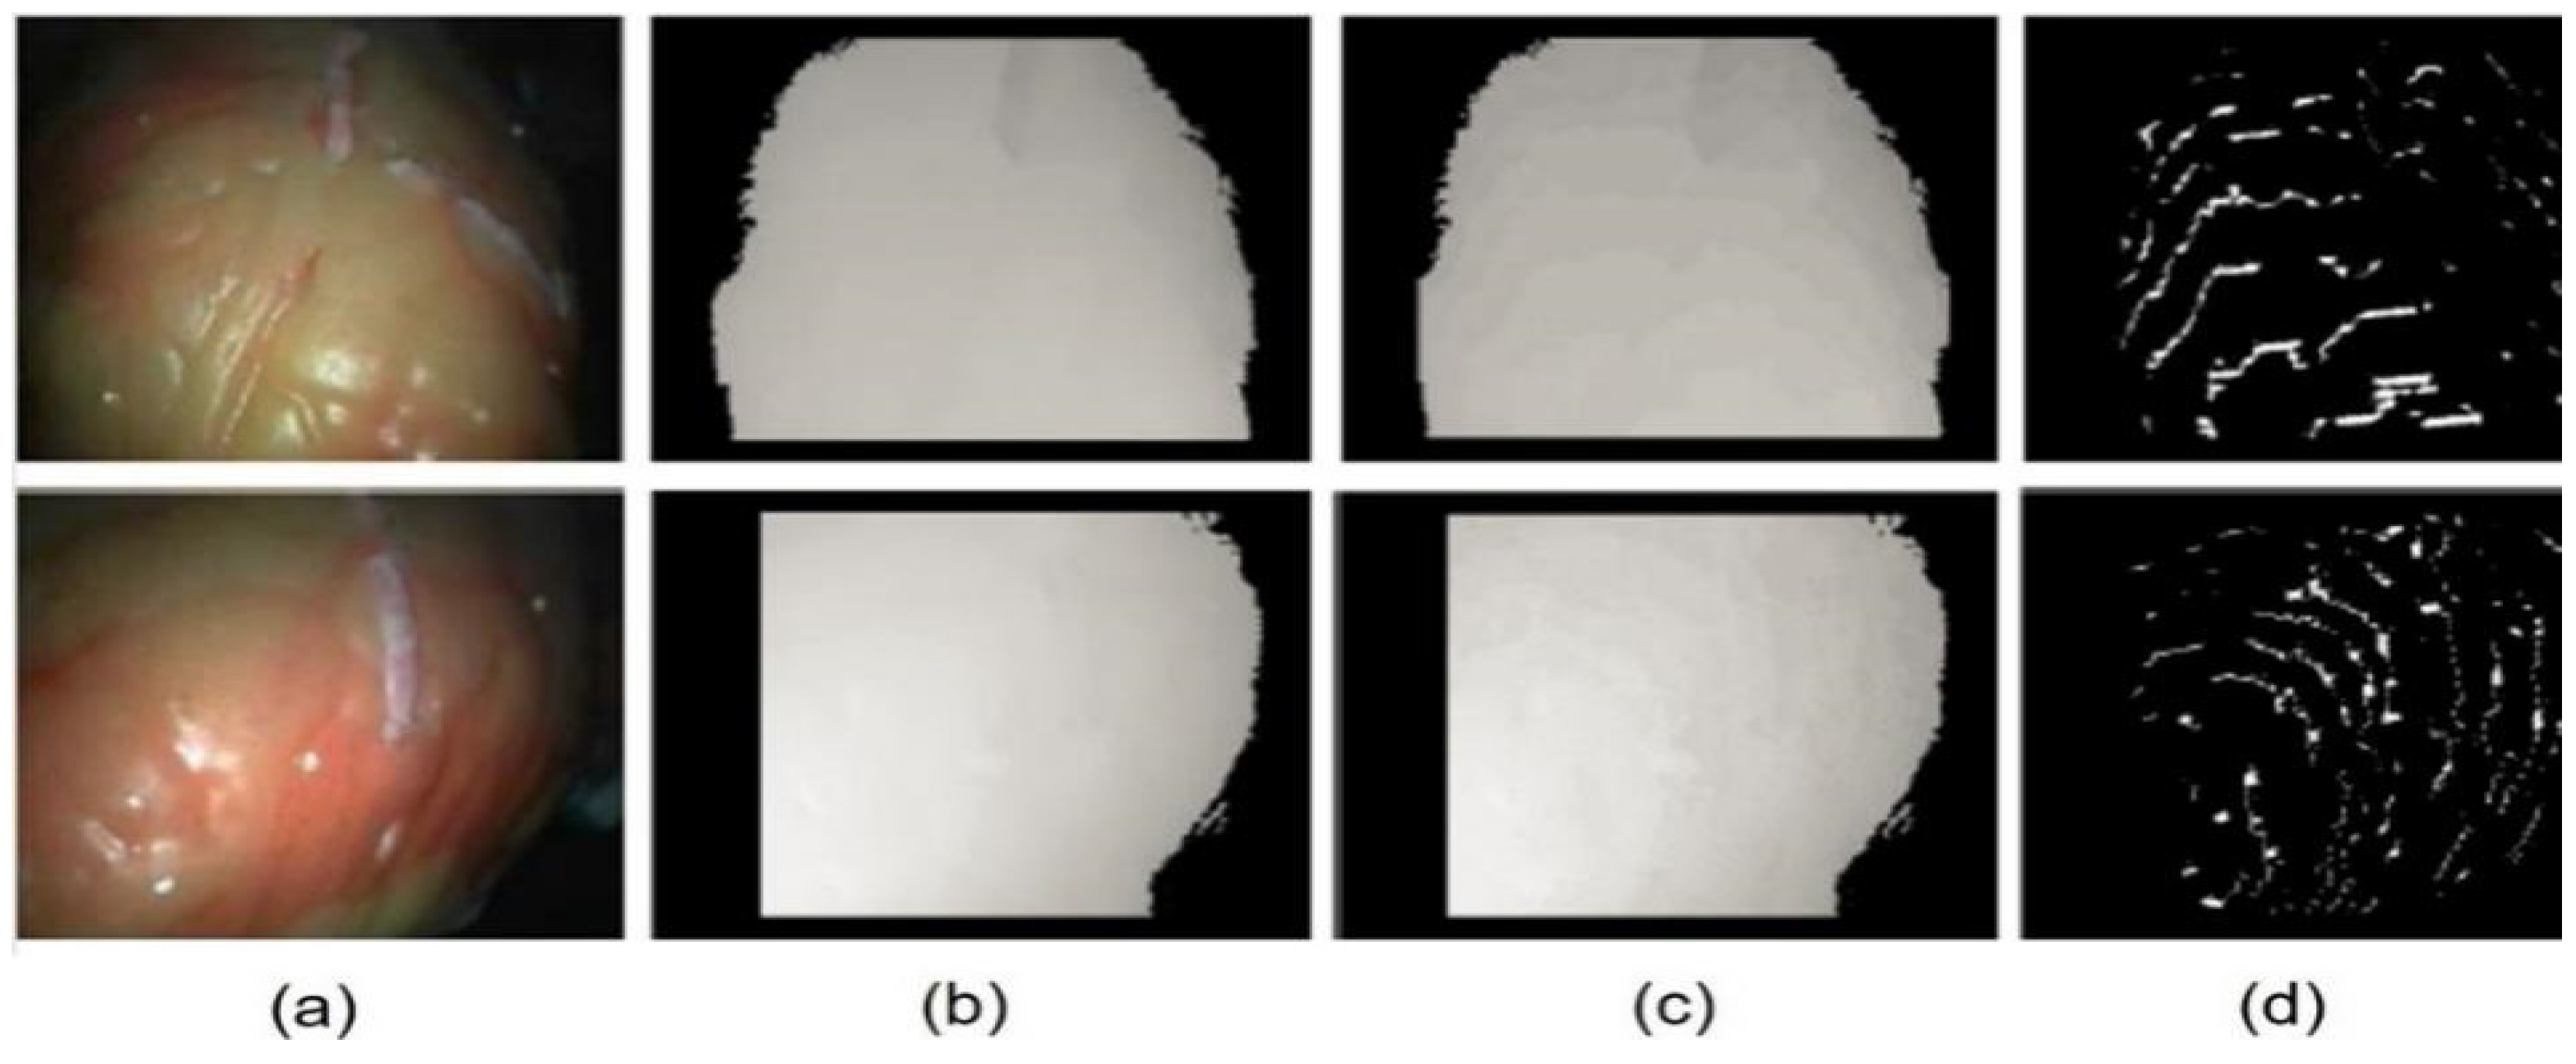
It can be seen from
Figure 10 that the first list is the left image of three-dimensional images of heart soft tissue after correction, the second is the right image of the three-dimensional image of the heart soft tissue after correction, and the third column is the selected interest area corresponds to the result parallax image, which is in the left side obtained from the algorithm, and the fourth is the image that expands the difference of the result parallax image. It can be seen from the diagram after the expansion of the differences and the resulting parallax image. The three-dimensional matching algorithm of this article can obtain a dense visual image corresponding to the heart soft tissue interest block, and it can basically reflect the general outline of the corresponding cardiac tissue, and there are few obvious errors. That is, the three-dimensional matching algorithm in this article can also obtain a better parallax figure in the actual scenario.
6. Conclusions
The main work of this paper is as follows:
Firstly, a stereo matching algorithm based on the joint similarity measure and adaptive weight of Hamming distance corresponding to gray difference absolute value and census transform is studied. Among them, the matching cost calculation method based on a joint similarity measure, the matching cost aggregation method based on adaptive weight, and the disparity calculation and post-processing operation are analyzed.
Then, some problems are studied, and corresponding improvement schemes are proposed. That is, in order to make full use of the color image with more abundant information, the matching cost calculation method based on the joint similarity measure in the original algorithm is improved, and the absolute value of the gray difference of each color channel of two pixels in the color image and the Hamming distance corresponding to the improved census transform is used as its joint similarity measure, Some problems existing in the adaptive weight in the original algorithm are improved. Using the idea of graph cut for reference, 10 are formulated, and each pixel is segmented by using the color and distance similarity between each pixel and the central pixel in the support window. If it conforms to the segmentation rules, it is considered that it belongs to the same segmentation element as the central point, and the maximum weight of 1 is assigned to it, which is explained in
Section 3.7. Otherwise, then it is determined that it does not belong to the same segmentation unit as the central pixel, and the original adaptive weight method is used to allocate weight to it.
Finally, we used the test images (three-dimensional images of the heart model) to conduct the verification experiments on the algorithm of this article. The experimental results show that the improved similarity measurement and the adaptive weight after the improvement of the improved similarities can effectively reduce the error-matching rate. Meanwhile, compared with using only one similarity measure, the corresponding matching effect based on the improved combined similarity measure has a better effect. After the improvement, the corresponding matching effect of the three-dimensional matching algorithm based on the combined similarity measurement and the adaptive weight is more significantly improved. The dense vision image basically meets the approximate outline of the corresponding interest block, and there is no obvious error-matching area.
This paper has made some achievements and progress in terms of the stereo image matching algorithm of cardiac soft tissue. However, there is still room for improvement. This experiment can be improved in the following aspects:
Although dense parallax images with high accuracy can be obtained through this algorithm, the algorithm is relatively complicated, which leads to the weak real-time performance of the algorithm. Therefore, it needs to be improved. The speed of the method, which is based on census transformation, can be increased by using hardware implementation, and the speed of the region-based stereo matching algorithm can be increased by GPU parallelization processing, that is, how to use these technologies to improve the real-time performance of the stereo matching algorithm can be considered next.
The research content of this paper is biased toward theoretical research and lacks practical application. Therefore, how to combine the theoretical results with practical application will be considered next.

 ,
, 


