Article

Classification of High-Concentration Aerosol Phenomena Using Their Physical Properties in Busan, South Korea

1
Observation Research Department, National Institute of Meteorological Sciences, 33, Seohobuk-ro, Seogwipo-si 63568, Republic of Korea
2
Department of Environmental Atmospheric Sciences, Pukyong National University, 45, Yongso-ro, Nam-gu, Busan 48513, Republic of Korea
*
Author to whom correspondence should be addressed.
Appl. Sci. 2023, 13(1), 355; https://doi.org/10.3390/app13010355
Submission received: 6 November 2022 / Revised: 12 December 2022 / Accepted: 23 December 2022 / Published: 27 December 2022
(This article belongs to the Section Environmental Sciences)

Abstract

:
High concentrations of aerosols associated with various meteorological phenomena show different physical characteristics. Because these phenomena are differentiated based on the visibility observed with the eyes, the observation may be unreliable. To investigate aerosol physical properties across various meteorological phenomena and develop an algorithm to classify high-concentration aerosol events, each phenomenon was assessed by analyzing the aerosol number and mass concentrations according to particle size observed with an optical particle counter. Furthermore, the optimal probability density function for each phenomenon was derived using the mass concentration by diameter. In addition, total aerosol mass concentrations, geometric mean particle diameters, and geometric standard deviations were calculated. In the coarse mode, the total mass concentration of the Asian dust case was the highest (16.3 μg·cm−3), whereas in the accumulation mode, the haze value was greatest (22.86 μg·cm−3). Average diameters were 4.41 and 0.41 μm in the coarse and accumulation modes, respectively. A classification algorithm for high-concentration aerosol phenomena was proposed based on the determined physical properties, results of simulating long-distance transport using a backward trajectory model, and meteorological conditions. Among the nine verification cases, all the cases coincided with the observation results of the Korea Meteorological Administration.

1. Introduction

Atmospheric aerosols range in size from 0.001 to 100 μm and are derived from a variety of sources, including natural originating materials such as Asian dust particles generated from soil and volcanic ash, and artificially produced nitrates, sulfates, and soot. Accordingly, rapid industrialization and urbanization are increasing emissions associated with human activities [1,2]. In particular, suspended dust particles play an important role in the climate by altering the Earth’s radiative balance [3]. Moreover, these particles have negative effects on human health and socioeconomic factors, as they cause respiratory issues while inhibiting transportation and agriculture at regional and global scales.
Aerosol-based meteorological phenomena include Asian dust, haze, and mist. Asian dust originates from the deserts and plateaus of China and Mongolia and is responsible for approximately 25% of global dust emissions, thereby significantly affecting the atmospheric environment of East Asia, located on the leeward side of westerlies [4]. Asian dust is primarily released ~1.5 km above the sea level, largely staying confined to the lower troposphere (<3 km) thereafter. It is affected by a downdraft following the passage of low-pressure conditions, ultimately reaching and affecting the surface. Asian dust occurrence in Korea has been assessed over the past 50 years, revealing that the Inner Mongolian source region accounted for 54.4% (329 days) of the total appearance days, followed by 26.2%, 12.4%, and 7.1% in the Gobi, Manchuria, and Loess Plateau, respectively. Accordingly, the desert regions of Mongolia and northern China, which collectively account for >80% of Asian dust, are known as the representative Asian dust sources [5].
In the 1990s, Chung and Park [6] conducted the first numerical studies on Asian dust, including systematic research involving dust occurrence at the source, as well as movement and deposition processes. Since then, synoptic analyses, long-distance transport, and duration have been explored. In addition, research on the chemical and optical characteristics of dust particles, emissions with critical friction speed, and surface characteristics of the source regions have been continuously carried out [7,8,9,10].
Haze disturbs local visibility and is generated by relatively fine aerosols compared to Asian dust and is a complex mixture of natural and artificial pollutants, along with water droplets. Unlike mist and fog, which are caused by water droplets condensing at high relative humidity, haze occurs at low relative humidity (RH < 75%) conditions. When analyzing a low-visibility phenomenon, the Korea Meteorological Administration (KMA) prioritizes visibility distance. At visibilities of 1–10 km, mist and haze are differentiated based on RH and the concentration of fine particles < 2.5 μm [11].
Recently, in East Asia, studies on the synoptic pattern and movement path tracking, chemical and optical properties, and vertical distribution of dust phenomena, including haze, are actively underway [12,13,14,15]. Since the 2000s, haze affected by long-distance transport caused by westerly winds in the Korean Peninsula has shown a sharp increase in the concentration of secondary pollutants, such as sulfates and nitrates [16,17]. In contrast to Asian dust, haze components are also emitted directly from pollutant sources, such as automobile exhaust gas, and can cause secondary production of smog via photochemical reactions, which maintain distinct aerosol characteristics [7]. Concentrations of each particle size are an important factor to identify the physical characteristics of the aerosol. For this purpose, observation-based research to determine number concentration using aerosol monitoring equipment has been actively conducted in Korea, including Anmyeondo on the west coast [18], Andong in the inland area [19], urban Seoul [20], and the Ieodo Ocean Research Station in an independent marine area [21].
Studies on the properties of aerosols under various weather conditions have also been carried out across Korea. For example, Chun et al. [7] analyzed aerosol physical properties by examining Asian dust and haze in Seoul, whereas Song et al. [22] compared the changes in the aerosol chemical composition of Asian dust, haze, and mist in Gosan, Jeju. Park and Kim [23] indirectly revealed the long-distance transport of Asian dust particles by measuring the mass and number concentration according to particle size in Seoul and at the sources.
Classifications and comprehension of long-distance transport or locally occurring high-concentration aerosol phenomena are limited when using only ground observation data. To this end, various long-distance transport studies using backward trajectory analysis and satellite observation data have been performed [24,25,26]. Choo et al. [27] used the backward trajectory model to classify aerosols transported over long ranges and studied the optical and chemical aerosol properties in each case. Sokolov et al. [28] classified cases of fog, high wind events, and sea-breezes using ground measurements data from coastal areas in France; however, mist, haze, and Asian dust occur in a complex manner, and identifying their sources remains challenging. In addition, studies on the classification of the high-concentration aerosol phenomena considering their physical characteristics and migration path are currently insufficient.
Accordingly, the purpose of this study was to investigate the microphysical properties of aerosols in various weather conditions during the spring season in Busan, South Korea. A classification algorithm for meteorological phenomena occurring in Busan was proposed using the results of aerosol physical properties for each phenomenon. The findings from such research stand to benefit from identifying regional characteristics through the physical properties of aerosols and inferring external factors such as long-distance transport. In addition, statistical arrangement and analysis of the representative characteristics of each weather condition can contribute to the prediction of urban air pollution and corrective judgment by classifying the haze, mist, and Asian dust phenomena based on the physical properties of aerosol using a more objective and scientific method.

2. Materials and Methods

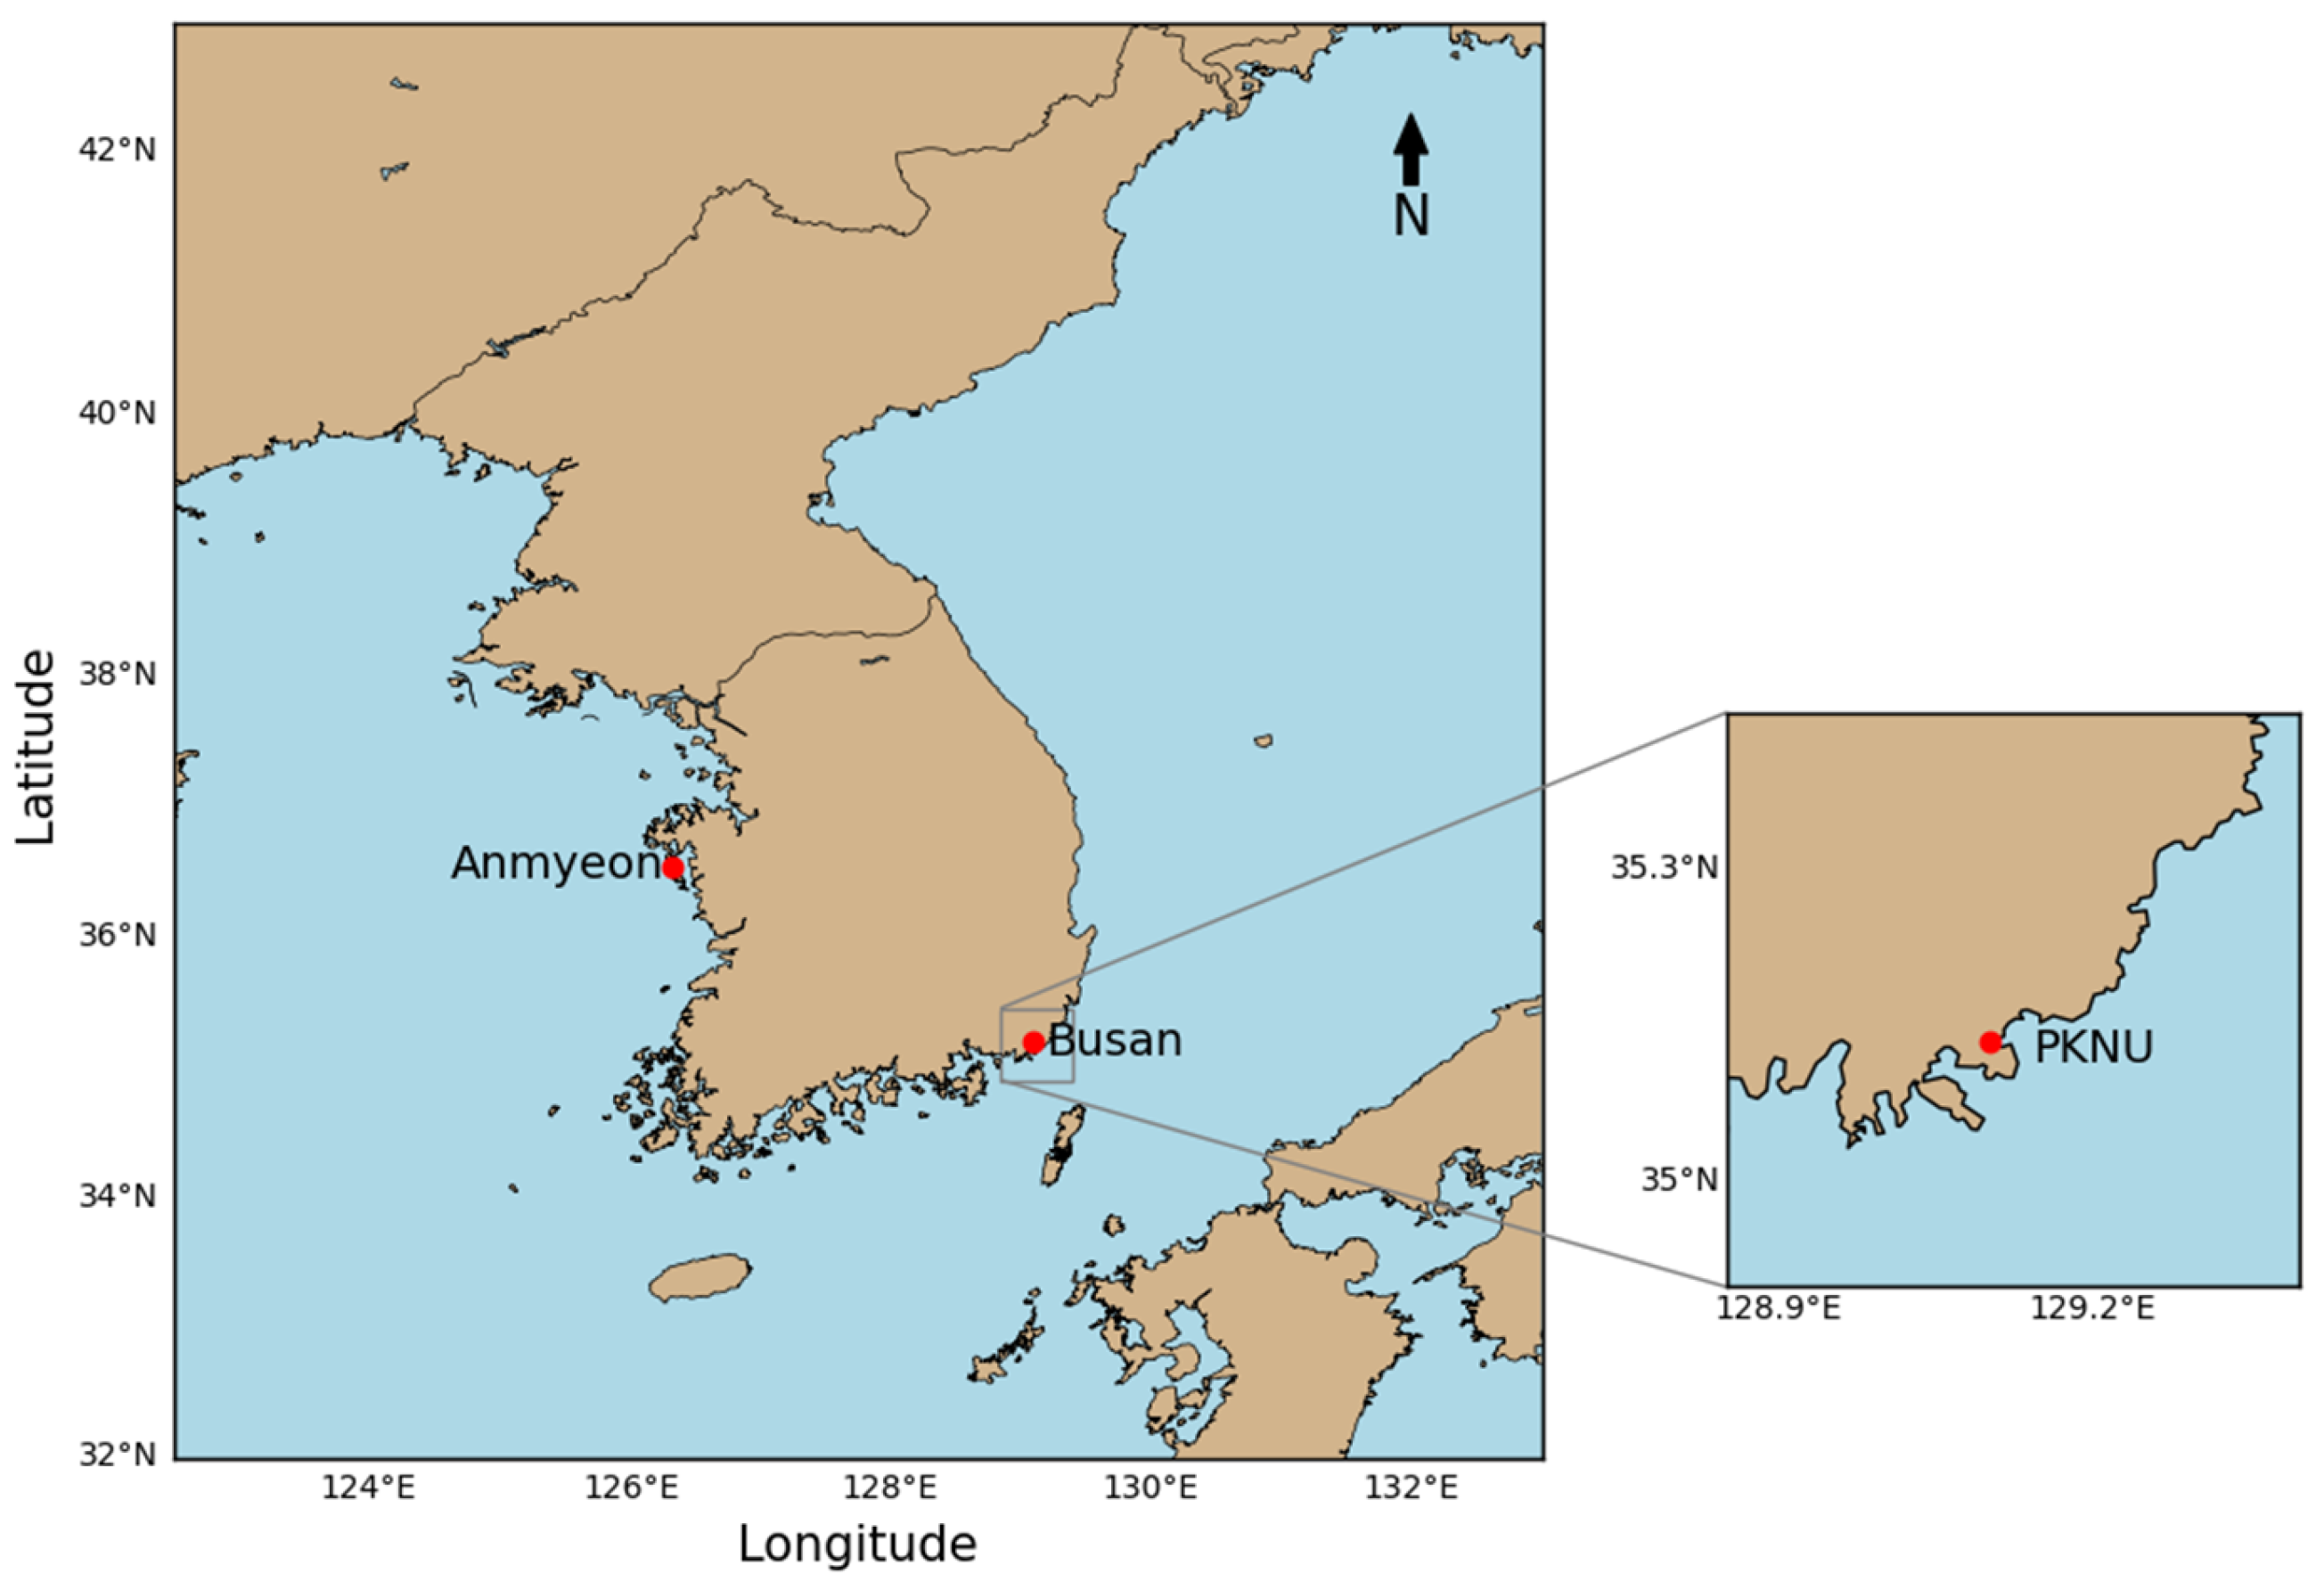
2.1. Intensive Observation for Aerosol Phenomena

To monitor aerosol number concentration by particle size during spring, intensive observations were performed every 10 min at a flow rate of 28.3 L·min−1 using a laser particle counter (LPC; KANOMAX 3900; Osaka, Japan) from the Pukyong National University (PKNU, 35°08′ N, 129°06′ E, 8 m.a.s.l.) in Busan, South Korea (Figure 1). An LPC measures concentrations by particle diameter using the size of the pulse shape (proportional to the amount of light scattered by the photomultiplier tube) concerning the particle size, whereas the number of pulses correlates to the particle number. The specifications of the LPC are listed in Table 1 for the measurable aerosol ranges from 0.3 to 10.0 μm. The intensive observations were performed in the spring season (March to May) from 2009 to 2011, and the periods that were not observed due to the inspection of equipment were excluded from the analysis. The LPC was located inside the instrument shelter, and since the tubular inlet faces the ground, observation was possible even during precipitation.
The aerodynamic particle sizer (APS) observation data was acquired from the World Meteorological Organization/Global Atmosphere Watch regional station located in Anmyeondo (36°32′ N, 126°19′ E, 45.7 m.a.s.l.) on the west coast of the central Korean Peninsula, which is relatively unaffected by pollutants. This data was compared with the aerosol size distribution data derived from the LPC. Moreover, classified daily phenomena were recorded via a combination of visual and instrumental observation at a manned observatory of the KMA (Busan, 35°06′ N, 129°01′ E, 56 m.a.s.l.).
The APS monitors velocity according to the size of the particles flowing into the measuring module. This module is composed of the particle acceleration nozzle and light scattering device capable of detecting avalanche photodetector scatter to measure the concentration of each particle size. The APS observes the aerosol number concentration every 3 min for 52 size channels, for particle diameters ranging from 0.5 to 20.0 μm. Sample and external flow rates were 1 L·min−1 and 4 L·min−1, respectively, with a measurement uncertainty of approximately ± 10% [29].

2.2. Aerosol Size Distribution Function

Because atmospheric aerosols occur over a large size range, particle size distribution was represented by a mathematical description to accurately calculate the aerosol concentration. The aerosols were assumed to be spherical with the same optical properties. Assuming that d N = n N D p d D p represents the number of particles in the size range D p ,   D p + d D p , the aerosol number distribution n N D p and mass distribution n m D p can be expressed according to Equations (1) and (2):
n N D p = d N d D p
n m D p = ρ p 10 6 π 6 D p 3 n N D p
where N is the number of particles per unit volume (cm−3) and Dp is the diameter of the particles (μm) [30]. The density ρp (g·cm−3) of the particles generally has a value between 1 and 2 [31] and is affected by particle size, type, season, and region. Because this study primarily analyzed atmospheric particles observed during spring, a density of 1.6 suggested by Kim et al. [32] was considered. Equations (3) and (4) are the common logarithm of Equations (1) and (2):
d N d l o g D p = 2.303 D p n N D p
d M d l o g D p = 2.303 D p n m D p
The hourly observation data were calculated to obtain the descriptive statistics, including the following: mean, standard deviation (SD), 25 and 75 percentiles (Q1 and Q3), interquartile range (IQR), median absolute deviation (MAD), skewness, and kurtosis to examine the distributions of the variables.
To statistically examine the concentration distribution according to particle size, the optimal probability density function for high-concentration aerosol phenomena was derived using mass concentration data by diameter. The mass concentration per unit volume was converted to a lognormal distribution based on diameter, and statistical variables were estimated from the measured data.
To statistically examine the distribution of mass concentrations according to particle size, two optimum lognormal distribution functions were used (Equation (5)):
dM d l o g D = A 1 e x p l o g D D g 1 2 2 l o g σ g 1 2 + A 2 e x p l o g D D g 2 2 2 l o g σ g 2 2
where A1 and A2 are the amplitudes, D1 and D2 are the geometric mean mass diameters, and σ1 and σ2 are the geometric standard deviations of Modes 1 and 2, respectively. Mode 1 indicates a section where the aerosol size is relatively small, and Mode 2 indicates a relatively large section. The lognormal distribution constants, total mass concentration (Mt), geometric mean diameter (Dg), and geometric standard deviation (σ) values were calculated for meteorological phenomena through the function.

2.3. Hybrid Single-Particle Lagrangian Integrated Trajectory

The backward trajectory was calculated using the hybrid single-particle Lagrangian integrated trajectory (HYSPLIT) model developed by the National Oceanic and Atmospheric Administration (NOAA) Air Resources Laboratory (ARL) to determine the origin of air masses [33]. The model is based on a hybrid calculation between the Lagrangian methodology, using a moving frame of reference for the advection and diffusion calculations as air parcel trajectories extend from their initial locations, and the Eulerian approach, employing a fixed three-dimensional grid as a frame of reference for computing pollutant air concentrations. The model can be executed on the web through the Real-time Environmental Applications and Display sYstem (READY) of NOAA (www.ready.noaa.gov/ HYSPLIT_traj.php). In this study, the HYSPLIT model was applied using the initial data from the Global Data Analysis System (GDAS) and the modeled vertical motion calculation method for 72 h, at a mean sea level of 0 km. The vertical motion option for analysis was selected as the vertical speed produced by the model, and the analysis was conducted at three altitudes (50, 500, and 1000 m) from the time when the concentrations in Busan reached their maximum levels in each case.

2.4. Classification of Meteorological Phenomena for Aerosol Physical Properties

A method for classifying meteorological phenomena occurring in Busan considering various sources using the aerosol observation data from the LPC during the periods of intensive observation in the spring seasons of 2009–2011 was proposed in the study.
As the meteorological data obtained by the KMA were provided daily, the classification algorithm was set to daily intervals in the present study. Based on the mass concentration distribution results, wherein the aerosol mass concentration for each phenomenon was derived as described in Section 3.1 and Section 3.2, and considering the aerosol detection range of APS and LPC equipment, the channels between 0.5 μm and 1 μm were classified as Mode 1, and those between 3 μm and 5 μm were classified as Mode 2. The results derived by the classification algorithm were verified considering cases where Asian dust (AD), haze (HZ), mist (MI), and precipitation (PR) phenomena occurred individually based on daily weather status observed at the synoptic weather station of KMA in Busan. The details of the classification algorithm are as follows:
  • The PR cases were first classified by determining the presence or absence of precipitation during the day.
  • If precipitation did not occur, the results wherein the Mode 2 concentrations of the AD and HZ were higher than those of the CD were used, and the cases were classified based on the median mass concentration (0.162 μg·m−3) in Mode 2 during CD.
  • If the concentration was higher than the standard value, the capacity for long-distance transport was determined by comparing it with the aerosol size distribution data of Busan (LPC) and Anmyeondo (APS) and performing backward trajectory analysis using the HYSPLIT model at PKNU, whereby the LPC observation location was considered the starting point. When comparing the aerosol data between the two sites, the mass concentrations of both Modes 1 and 2 were compared. If it was not a long-distance transport phenomenon, we proceeded to Step 5. When the air masses undergo long-range transport through the Yellow Sea, the concentration of aerosol number may be influenced by sea salt particles. According to a previous study [34] on aerosol and sea salt particles in Busan, the same area analyzed in this study, the concentration of sea salt particles relative to the PM10 concentration was 3.86 μg/m3 when transported from the Shandong Peninsula, China, and 4.04 μg/m3 otherwise. In the case of aerosols transported over long distances to Busan, the authors judged that there was no large difference, and the influence near Busan was greater. Therefore, the difference according to the chemical properties of the particles did not exert a significant effect, and this study focused on the physical properties of the aerosols.
  • If long-distance transport was confirmed, based on the AD cases with significantly higher mass concentration than HZ cases in Mode 2, the phenomenon was classified as a reference value (0.487 μg·m−3) based on the Q1 value of the mass concentration in Mode 2 of AD cases. If the concentration exceeded or was below this reference value, the phenomenon was classified as AD, or long-range transported haze (LH), respectively.
  • If the mass concentration was lower than the standard value in Step 2, the cases were classified by setting the RH to 75% as the reference value. As MI and HZ events are visibility disturbances (from 1 to ≤ 10 km), these were classified based on the RH [35]. If RH was >75%, the phenomenon was considered an MI event.
  • If RH was <75% in Step 5, the cases were classified based on the median mass concentration (0.055 μg·m−3) in Mode 1 during CD cases. If the concentration was lower than the standard value, the phenomenon was classified as CD.
  • If the concentration exceeded the standard value in Step 6, the case was classified as a reference value (0.107 μg·m−3) based on the Q1 of the mass concentration in Mode 2 during HZ cases. If the concentration was lower than this reference value, the phenomenon was classified as CD.
  • Finally, the events were divided into LH and urban haze (HZ) by determining the possibility of long-distance transport.
A flow chart showing all the above steps of the classification algorithm is shown in Figure 2.

3. Results and Discussion

3.1. Aerosol Concentration Distributions

To analyze the distinct aerosol fluctuation characteristics for each dust phenomenon, including the most severe Asian dust on 20 March 2010, data observed from 2009 to 2011 during the spring seasons were analyzed. In addition, because few in situ sites were present where the aerosol number concentration was observed based on the particle size, the data observed by LPC was used in this study. Here, the smaller the particle size of aerosols, the larger is the contribution to total number concentration, and the lower is the proportion of the total surface or volume concentration.
Figure 3 shows the total period of measured aerosols for each particle size and number concentration. The number concentration distribution showed a typically decreasing tendency in concentration as the particle size increased, whereas the mass concentration distribution tended to increase based on the 1–3 μm channel, which was notably distinct from the number concentration results. For the 5th and 95th percentiles of 3–5 μm and 5–10 μm, the concentration distribution was wider than those in the other channels, with the values peaking in the 3–5 μm channel (0.123 μg·m−3).
Based on the LPC observation data across the study period, hourly data for a total of 173 days were included in the analysis. If data loss affected >6 h·d−1, that day was excluded from the analysis. Figure 4 shows the frequency of occurrence on days where AD, HZ, MI, PR, multiple events (ME), and clear days (CD) were observed by the KMA. Among all the cases, the numbers of single-case occurrence days were 19, 13, 7, and 3 for PR, MI, HZ, and AD cases, respectively, and the physical properties of the aerosols were investigated for these cases. In this study, the analysis was conducted focusing on each individual meteorological phenomenon.
Median values ± MAD were used in the present study to effectively analyze the wide distribution of concentrations based on aerosol particle size. In the distribution of aerosol mass concentration by meteorological phenomena (Figure 5), the highest mass concentrations in coarse particle mode (>1 μm) were observed for AD, which were 0.124 ± 0.046, 0.722 ± 0.322, and 1.028 ± 0.944 μg·m−3 for particle size 1–3, 3–5, 5–10 μm, respectively. For the fine particle mode (<1 μm), the highest mass concentrations in the first channel observed were for MI (2.213 ± 0.950 μg·m−3), and the phenomenon of HZ showed the highest mass concentrations in the second channel (0.192 ± 0.106 μg·m−3). The lowest concentrations in the total channel were recorded for CD. The mass concentrations in the coarse particle mode (5th channel) were observed to be in the order of AD > MI > HZ > CD > PR, whereas the concentrations in the fine particle modes (1st channel) followed the order of MI > HZ > AD > CD > PR (Table 2).
The MAD and IQR were calculated to measure the overall deviation. Overall, the patterns of MAD and IQR for each phenomenon were similar. The MAD and IQR values of AD cases were the largest in all the channels, and the variability was especially evident in the 4th and 5th channels. In particular, the MAD of the 5th channel was approximately 13 times higher than that of the other channels on average. This shows that the mass concentration in the coarse particle mode increases rapidly when Asian dust occurs compared to that for other phenomena. Excluding AD, the MAD and IQR values of the first channel were the highest. This implied that the aerosol concentration in the 0.3 to 0.5 section was the farthest from the median value—i.e., the channel with the largest increase in aerosol concentration was channel 1 during each phenomenon.
The MAD values for all phenomena of the 2nd and 3rd channels showed low variability with low values of ≤0.2, but the 1st channel showed high variability of ≥0.5.
Skewness and kurtosis before logarithmic transformation showed that most of the variables do not follow the normal distribution (Table 3). Therefore, the skewness and kurtosis were calculated by converting a wide range of mass concentration values into their logarithmic forms based on the aerosol distribution characteristics. The skewness ranged from −1.58 to 1.84 and the kurtosis ranged from −1.49 to 6.86, which are consistent with the normality criteria presented by West et al. [36].
To examine the aerosol concentration characteristics for each phenomenon, the concentration distributions for each of the five phenomena are shown in Figure 6a. Overall, the distribution showed a bimodal shape with two peaks in the 1st and 4th channels. For PR, the average concentration decreased by 31.6 % compared to CD across all particle size channels, most notably in the 5–10 µm channel, where a 66.2% difference was observed. Thus, it displayed the influence of the washout effect of precipitation through the substantially reduced number of coarse particles. Furthermore, the proportion of mass concentration for each phenomenon by particle size was compared with that for CD. The average concentration for AD increased more than six times in the coarse mode and 2.5 times in the 0.5–1 μm channel. During HZ events, the concentrations increased by 1.16–3.48 times across all particle size distributions, whereas for MI events, the concentrations decreased by factors of 0.7 in the 3–5 μm channel but increased by 2.67 times in the 0.3–0.5 μm channel (Figure 6b).
Figure 7 shows the distribution of meteorological variables by phenomena. According to the meteorological observation guidelines of KMA [11], the haze and mist were classified based on an RH of 70–80% when a visibility disturbance occurs. During MI events, the average daily humidity was 70.2%, which was relatively high compared to those of AD (41.2%), HZ (44.8%), and CD (47.5%). This pattern may be likely attributed to the increase in number concentration by coagulation and subsequent growth when fine particles ≤ 1 μm are hygroscopic. Moreover, instances of MI and PR related to atmospheric hygrometers were associated with high RH, whereas wind speeds ≤ 2.5 m·s−1 were observed in all cases, except for AD.

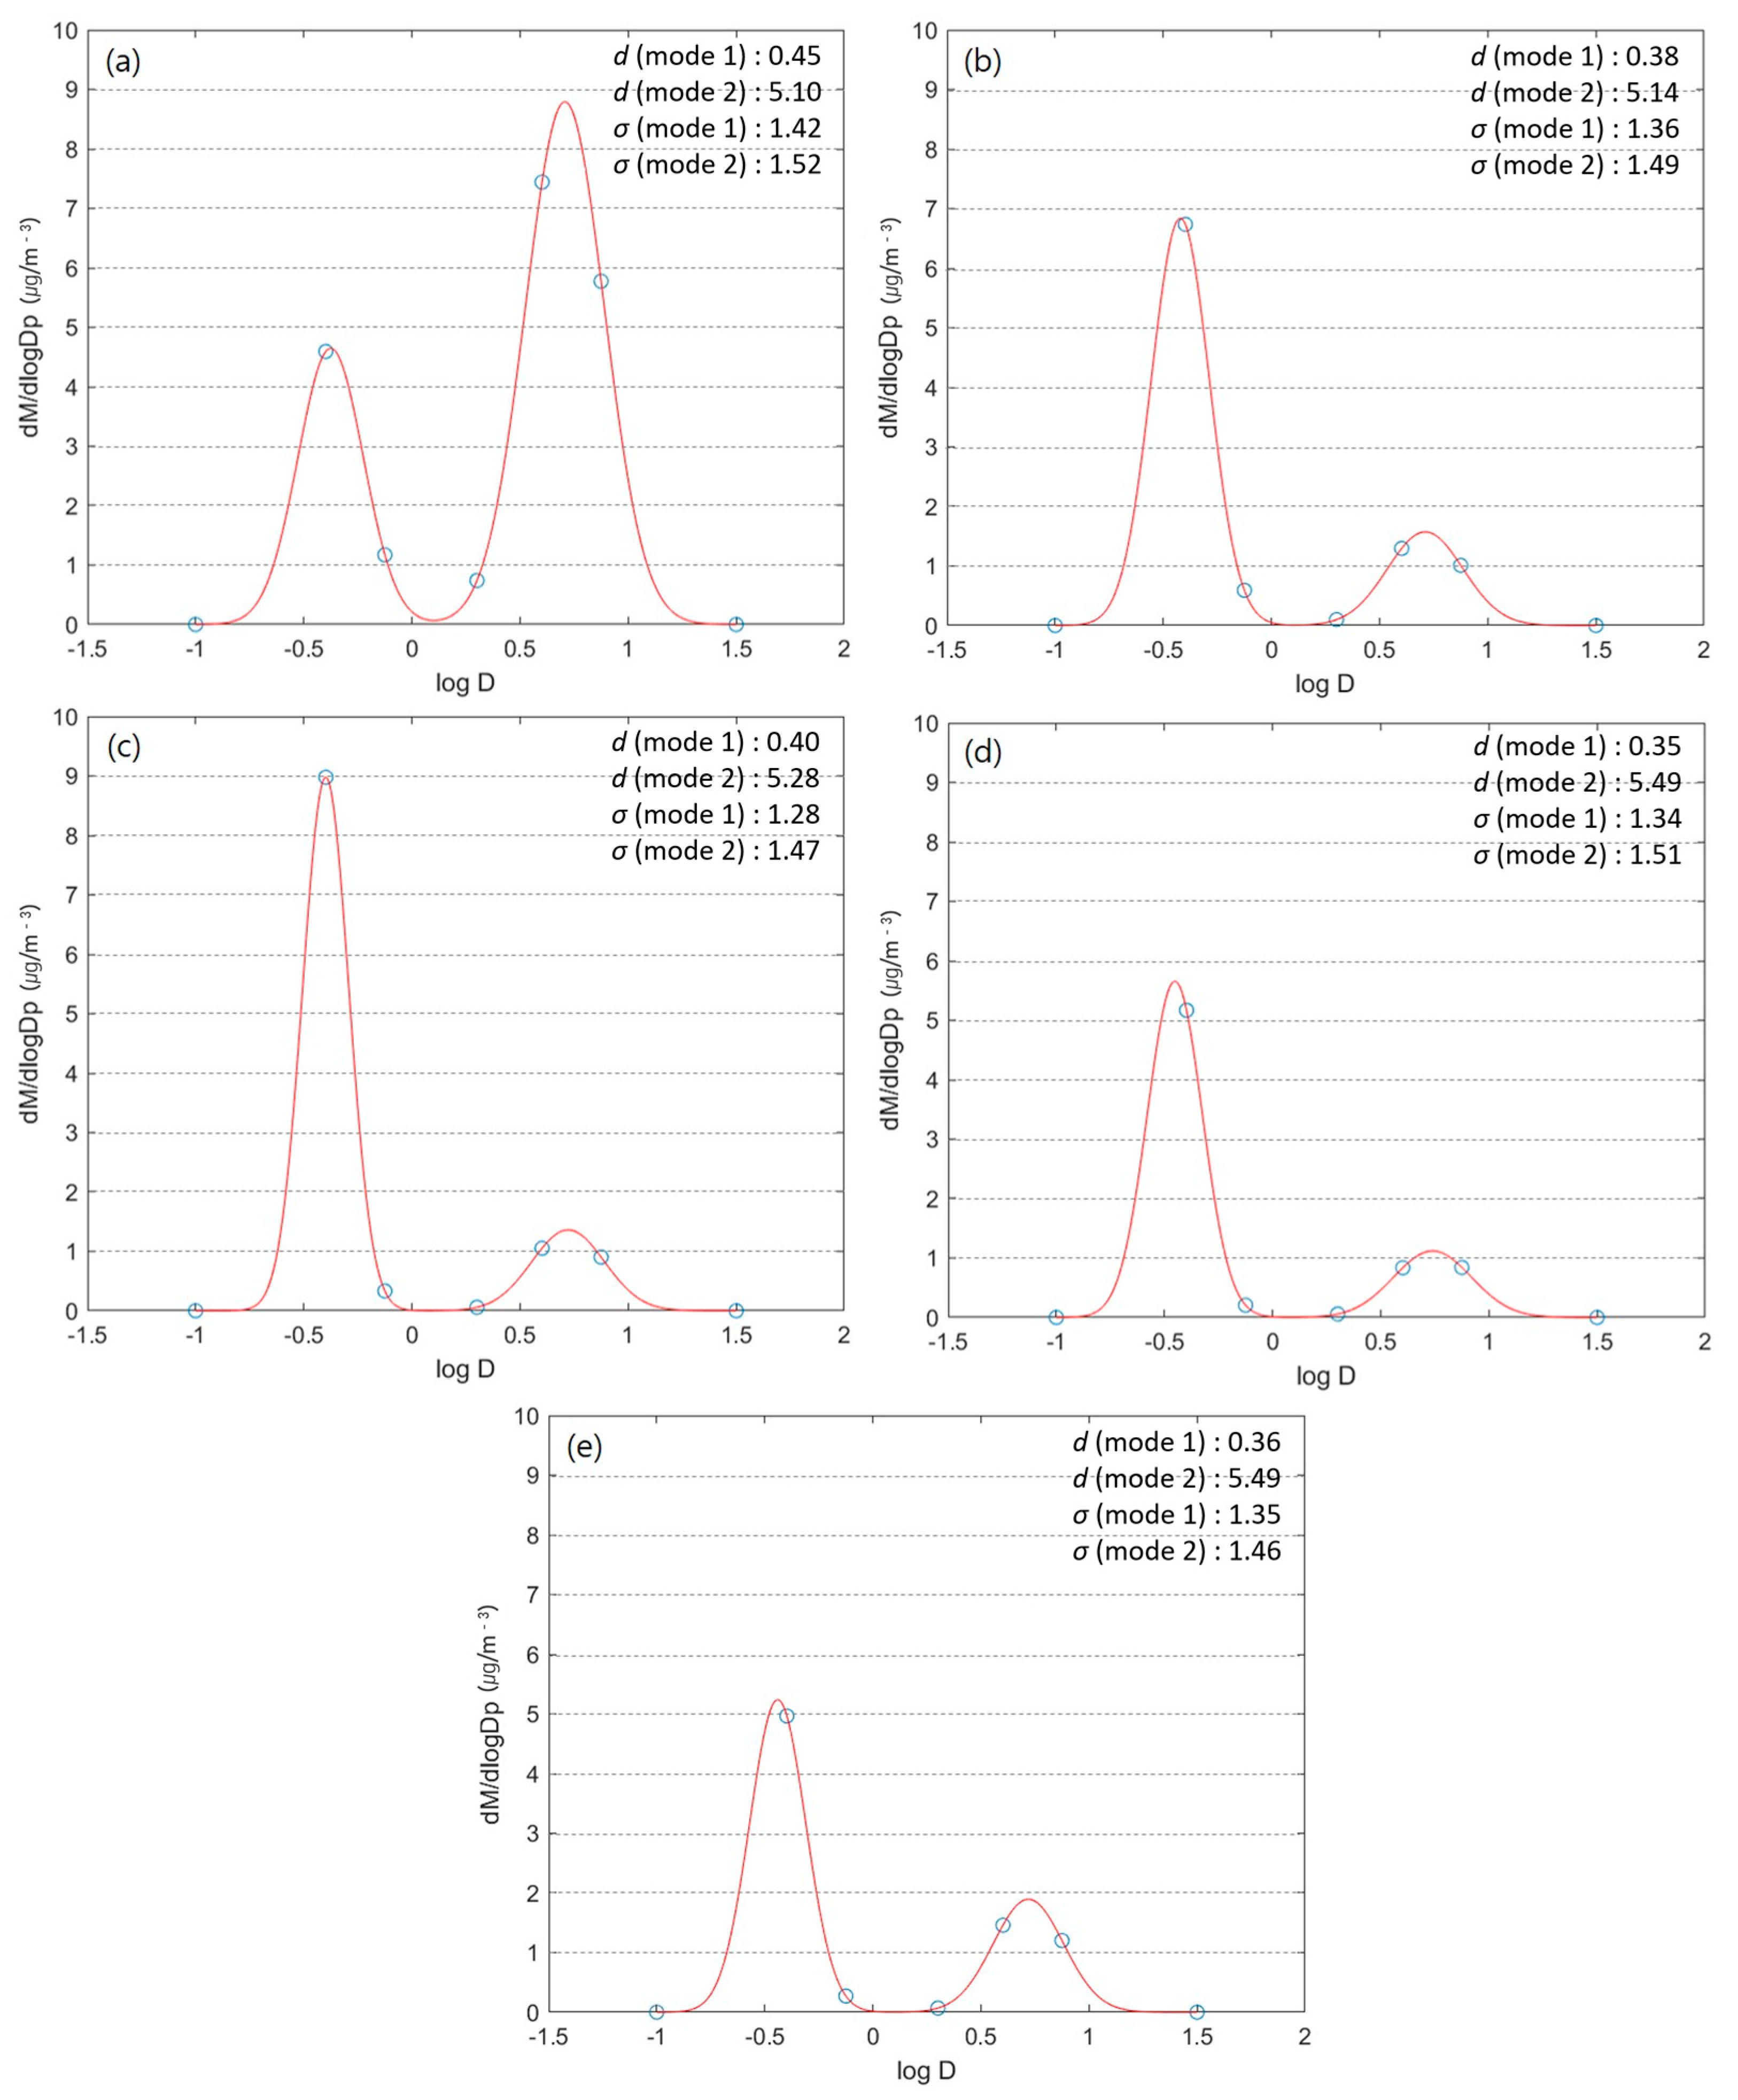
3.2. Derivation of Optimal Probability Density Function

In general, the particle size distribution of atmospheric aerosols showed a bimodal distribution, with two peaks on either side of the fine and coarse particle areas (~1–2 μm) due to the influence of various anthropogenic and natural sources [37].
To statistically examine the mass concentration distribution according to measured particle size data, an optimal probability density function with two peaks was calculated using Equation (5). The function was optimized for each of the five weather conditions, and the lognormal distribution constants, Mt, Dg, and σ values were calculated (summarized in Table 4). Figure 8 shows the probability density function of the aerosol mass concentration distribution for each phenomenon, indicating their bimodal lognormal distributions.
During AD events, the total mass concentrations in fine and coarse modes were estimated as 1.76 μg·m−3 and 4.03 μg·m−3, with average diameters of 0.42 μm and 5.10 μm, respectively. Compared with other phenomena, the total mass concentration of Mode 2 (larger mode) showed a very high value and was estimated to be the most pronounced bimodal distribution. The largest average diameter was observed in Mode 1, whereas the SD of Mode 2 was 1.52 μm, showing the largest value among the various studied phenomena. For HZ events, the total mass of smaller particles (Mode 1) was larger than that of the larger particles (Mode 2), estimated as 3.00 and 0.53 μg m−3 (mean diameters of 0.38 and 5.14 μm), respectively, whereas MI cases displayed concentrations of 3.79 and 0.36 μg·m−3 (mean diameters of 0.40 and 5.28 μm), respectively. Although the mass concentration in Mode 1 was the highest, the SD was the lowest (1.28 μm).
Furthermore, the concentration of Mode 2 showed the lowest value (0.36 μg·m−3) observed during PR events. Moreover, the largest mean diameter for PR events was observed in Mode 2 (5.49 μm), whereas the greatest mass concentration was recorded in Mode 1 (1.44 times higher than that during AD). During CD observations, the total aerosol numbers were estimated as 2.14 and 0.62 μg·m−3, and the mean diameters were 0.36 and 5.24 μm in Modes 1 and 2, respectively.
The results were compared with those of Park and Kim [19], who analyzed the mass concentration characteristics of aerosol values in Seoul, producing mean diameters for AD events of 0.89 (±2.4) and 9.12 (±2.14) μm, respectively. During non-AD events, mean diameters of 0.6 (±1.78) and 8.51 (±2.14) μm were observed, respectively. Accordingly, during AD events, the corresponding results showed a clearer concentration distribution in Mode 2 than in Mode 1, although the mean diameter differed by approximately 4 μm. The smaller mean diameter observed in the present study compared to other cases may be due to the regional differences between Seoul and Busan, and the corresponding reduction in coarse mode particles according to the distance from the Asian dust source.

3.3. Verification of Classification Accuracy

The accuracy of the previously proposed meteorological phenomenon classification algorithm was verified by considering nine cases based on intensive observation data: one case of AD, two cases of HZ, three cases of MI, and three cases of PR. The same observation periods as described in Section 3.1 and Section 3.2 were considered, but the validation cases were excluded from this analysis. Table 5 shows the meteorological phenomena observed by the KMA as well as the results of the applied classification algorithms. All nine cases were consistent with the KMA observations. The results of back-trajectory analysis and mass concentration variability for AD and LH, which are long-distance transport cases, and one MI case are shown.
The first case was an AD event occurring on 17 March 2009. The KMA site at Busan indicated that the AD event occurred in isolation, and the algorithm result was consistent with this finding. When assessing the backward trajectory model (Figure 9), we found that air masses generated near the Gobi Desert moved to the southern part of the Korean Peninsula. Based on the aerosol mass concentration time series in Busan and Anmyeondo, we further confirmed that an extreme AD event was observed in Anmyeondo on March 16, 2009, and it reached Busan at dawn on March 17, 2009. The time lag of the peak aerosol mass concentration at the two points was recorded as 6 h based on Mode 2. The median mass concentration of Mode 2 was 1.540 μg·m−3, and because the standard value (0.487 μg·m−3) was exceeded, the phenomenon was determined as AD.
The second case refers to an LH event occurring on 12 April 2009, which was classified as a simple HZ event by the KMA. For the 72-h backward trajectory analysis, air masses were introduced from Shandong Peninsula in China, and the high aerosol mass concentration of Mode 1 (which occurred in Anmyeondo on 11 April 2009) was observed in Busan on 11 April 2009 (Figure 10). The RH was approximately 63%, and the median mass concentration of Mode 2 was 0.237 μg·m−3. The concentration at Busan did not have a distinct peak compared to the AD case, but a high mass concentration of Mode 1 was observed at Anmyeondo. In addition, we determined that the air flowed to Busan during the back-trajectory analysis, and the mass concentration did not exceed the standard value (0.487 μg·m−3); therefore, the phenomenon was identified as LH.
The third case was recorded on 13 April 2010 during a simultaneous MI event, as consistently identified by both KMA observation values and the classification algorithm. The backward trajectory analysis (Figure 11) showed a different pattern from AD or HZ, which was generally transported over long distances from the northwest. The analysis did not record a time lag in the aerosol mass concentration time series from Anmyeondo to Busan. Based on the mass concentration in Mode 1, the observation results at Busan produced a value close to the reference value for CD. Moreover, a high RH was recorded (up to 87%, 06LST), and at that time, a high concentration of 4.573 μg·m−3 was recorded in the first channel. No significant increase in the concentration was observed in Mode 1, but a relatively high concentration was recorded in Mode 2 after 12LST when the RH decreased to ≤50%.

4. Conclusions

In this study, the aerosol characteristics and meteorological classification algorithms for high-concentration aerosol phenomena were investigated according to aerosol physical properties. Each phenomenon was investigated by analyzing the aerosol mass concentrations based on particle diameter during AD, HZ, MI, and CD events. During AD events, the overall mass concentration of aerosols in terms of particle size distribution increased by 4.4 times compared to the mass concentration during CD cases, whereas that in the coarse mode (≥1 μm) increased by six times. During HZ events, the concentration of accumulation-mode aerosols < 1 μm increased by 2.5 times. The concentration of the MI particles in Mode 2 decreased by 0.7 times due to the washout effect of rainfall on the overall particle size distribution.
Furthermore, to statistically examine the distribution of mass concentration according to aerosol particle size, an optimal probability density function was derived for each weather condition using mass concentration data based on particle diameter. The function was categorized into accumulation and coarse modes, and the total aerosol mass concentration, geometric mean diameter of particles, and geometric SD were calculated for each phenomenon. In the coarse mode, the total mass concentration during AD events was the highest (16.3 μg·cm−3), whereas in the accumulation mode, HZ events exhibited the largest value (22.86 μg·cm−3). The average diameters were 4.41 and 0.41 μm in the coarse and accumulation modes, respectively.
Finally, a classification algorithm was proposed for the meteorological phenomena occurring in Busan based on the determined physical properties of aerosols, meteorological variables, and the physical properties for each phenomenon. First, the presence of precipitation was assessed, and when present, it was classified as PR. When precipitation did not occur, using the daily median value of Mode 2, we determined whether the daily values exceeded the standard values for CD cases. If the value in Mode 2 did not exceed this threshold, RH had the greatest effect on the fluctuation of aerosol concentrations. Thus, the phenomena were classified using 75% RH as a reference value, whereas if RH > 75%, it was classified as an MI event. Alternatively, if RH < 75%, the phenomena were classified as HZ and CD cases based on the standard value of aerosol mass concentration in Mode 1 during CD cases or classified as LH and UH events when considering long-distance transport. If both Modes 1 and 2 exceeded the standard values, the differences between aerosol concentrations in Anmyeondo and Busan, in conjunction with the results of backward trajectory analysis, were used to determine whether long-distance transport had occurred. Finally, distinctions between AD and LH, UH, and CD were accomplished by considering the ratio of aerosol mass concentrations in Modes 1 and 2. Among the nine daily verification cases, all the cases coincided with the observation results of KMA.
In this study, meteorological phenomena at high aerosol concentrations were split into more objective and scientific classes, including UH, LH, AD, MI, PR, and CD event categories. The results presented herein can help identify regional characteristics based on the physical properties of aerosols, as well as infer external factors, such as long-distance transport. In addition, if the representative characteristics of each weather condition are statistically arranged and analyzed, it can contribute to the prediction of urban air pollution and implementation of corrective actions by classifying HZ, MI, and AD phenomena by considering the aerosol physical properties.

Author Contributions

Conceptualization, D.-D.K.; methodology, D.-D.K.; validation, D.-D.K. and D.-I.L.; formal analysis, D.-D.K.; investigation, D.-D.K.; writing—original draft preparation, D.-D.K.; writing—review and editing, all authors; supervision, T.-Y.G. and D.-I.L.; funding acquisition, T.-Y.G. All authors have read and agreed to the published version of the manuscript.

Funding

This work was funded by the Korea Meteorological Administration Research and Development Program “Developing Application Technology for Atmospheric Research Aircraft” [Grant KMA2018-00222].

Institutional Review Board Statement

Not applicable.

Informed Consent Statement

Not applicable.

Data Availability Statement

Not applicable.

Acknowledgments

The authors gratefully acknowledge the NOAA Air Resources Laboratory (ARL) for providing the HYSPLIT backward trajectory model (http://ready.arl.noaa.gov, accessed on 1 August 2022).

Conflicts of Interest

The authors declare no conflict of interest.

References

  1. Zhang, Q.; Streets, D.G.; Carmichael, G.R.; He, K.B.; Huo, H.; Kannari, A.; Klimont, Z.L.; Park, I.S.; Reddy, S.; Fu, J.S.; et al. Asian emissions in 2006 for the NASA INTEX-B mission. Atmos. Chem. Phys. 2009, 9, 5131–5153. [Google Scholar] [CrossRef] [Green Version]
  2. Choi, D.-R.; Koo, Y.-S.; Jo, J.-S.; Jang, Y.-K.; Lee, J.-B.; Park, H.-J. The Effect of Dust Emissions on PM10 Concentration in East Asia. J. Korean Soc. Atmos. Environ. 2016, 32, 32–45. [Google Scholar] [CrossRef] [Green Version]
  3. Tegen, I.; Hollrig, P.; Chin, M.; Fung, I.; Jacob, D.; Penner, J. Contribution of different aerosol species to the global aerosol extinction optical thickness: Estimates from model results. J. Geophys. Res. 1997, 102, 23895–23915. [Google Scholar] [CrossRef]
  4. Ginoux, P.; Prospero, J.M.; Torres, O.; Chin, M. Long-term simulation of global dust distribution with the GOCART model: Correlation with North Atlantic Oscillation. Environ. Model. Softw. 2004, 19, 113–128. [Google Scholar] [CrossRef]
  5. Kim, S.Y.; Lee, S.H. The analysis of the weather characteristics by source region of the Asian dust observed in South Korea. J. Korean Geogr. Soc. 2013, 48, 167–183. [Google Scholar]
  6. Chung, K.Y.; Park, S.U. Characteristic synoptic features associated with the transport of Asian dust to Korea, Korean. J. Atmos. Sci. 1995, 31, 45–63. [Google Scholar]
  7. Chun, Y.; Lim, J.; Choi, B. The features of aerosol in Seoul by Asian dust and haze during springtime from 1998 to 2002. J. Korean Meteorol. Soc. 2003, 39, 459–474. [Google Scholar]
  8. Kim, K.-M.; Kim, S.-W.; Choi, M.; Kim, M.; Kim, J.; Shin, I.; Kim, J.; Chung, C.-Y.; Yeo, H.; Kim, S.-W.; et al. Modeling Asian dust storms using WRF-Chem during the DRAGON-Asia field campaign in April 2012. J. Geophys. Res. Atmos. 2021, 126, e2021JD034793. [Google Scholar] [CrossRef]
  9. Kim, H.-S.; Cho, J.-H. Case studies of mass concentration variation in the Central-Southern Korean Peninsula caused by synoptic scale transport of dust storms. J. Korean Earth Sci. Soc. 2019, 40, 414–427. [Google Scholar] [CrossRef]
  10. Maki, T.; Furumoto, S.; Asahi, Y.; Lee, K.C.; Watanabe, K.; Aoki, K.; Murakami, M.; Tajiri, T.; Hasegawa, H.; Mashio, A.; et al. Long-range-transported bioaerosols captured in snow cover on Mount Tateyama, Japan: Impacts of Asian-dust events on airborne bacterial dynamics relating to ice-nucleation activities. Atmos. Chem. Phys. 2018, 18, 8155–8171. [Google Scholar] [CrossRef] [Green Version]
  11. Korea Meteorological Administration. Ground Meteorological Observation Guidelines; Korea Meteorological Administration: Seoul, Republic of Korea, 2016. [Google Scholar]
  12. Ye, X.; Song, Y.; Cai, X.; Zhang, H. Study on the synoptic flow patterns and boundary layer process of the severe haze events over the North China Plain in January 2013. Atmos. Environ. 2016, 124 Pt B, 129–145. [Google Scholar] [CrossRef]
  13. Shu, L.; Xie, M.; Gao, D.; Wang, T.; Fang, D.; Liu, Q.; Huang, A.; Peng, L. Regional severe particle pollution and its association with synoptic weather patterns in the Yangtze River Delta region, China. Atmos. Chem. Phys. 2017, 17, 12871–12891. [Google Scholar] [CrossRef] [Green Version]
  14. Tang, Y.; Han, S.; Yao, Q.; Cai, Z.; Qiu, Y.; Feng, J. Analysis of a Severe Regional Haze-fog-dust Episode over North China in Autumn by Using Multiple Observation Data. Aerosol Air Qual. Res. 2020, 20, 2211–2225. [Google Scholar] [CrossRef]
  15. Sheng, Z.; Che, H.; Chen, Q.; Xia, X.; Liu, D.; Wang, Z.; Zhao, H.; Gui, K.; Zheng, Y.; Sun, T.; et al. Aerosol vertical distribution and optical properties of different pollution events in Beijing in autumn 2017. Atmos. Res. 2019, 215, 193–207. [Google Scholar] [CrossRef]
  16. Kang, C.M.; Lee, H.S.; Kang, B.W.; Lee, S.K.; Sunwoo, Y. Chemical characteristics of acidic gas pollutants and PM2.5 species during hazy episodes in Seoul, South Korea. Atmos. Environ. 2004, 38, 4749–4760. [Google Scholar] [CrossRef]
  17. Jeon, B.-I. Characteristics of fine particle concentration and case during haze days in Busan. J. Environ. Sci. Int. 2017, 26, 751–765. [Google Scholar] [CrossRef]
  18. Lee, Y.G.; Cho, C.H. Characteristics of aerosol size distribution for a severe Asian dust event observed at Anmyeon, Korea in April 2006. J. Korean Meteorol. Soc. 2007, 43, 87–96. [Google Scholar]
  19. Jeong, G.Y.; Kim, J.Y.; Seo, J.; Kim, G.M.; Jin, H.C.; Chun, Y. Long-range transport of giant particles in Asian dust identified by physical, mineralogical, and meteorological analysis. Atmos. Chem. Phys. 2013, 14, 505–521. [Google Scholar] [CrossRef] [Green Version]
  20. Bae, G.N.; Kim, M.C.; Lim, D.Y.; Moon, K.C.; Baik, N.J. Characteristics of urban aerosol number size distribution in Seoul during the winter season of 2001. J. Korean Soc. Atmos. Environ. 2003, 19, 167–177. [Google Scholar]
  21. Park, S.H.; Jang, S.M.; Jung, W.S.; Jeong, J.H.; Lee, D.I. The fluctuation of marine aerosol number concentrations related with vertical winds. J. Korean Earth Sci. Soc. 2012, 33, 259–268. [Google Scholar] [CrossRef] [Green Version]
  22. Song, J.-M.; Bu, J.-O.; Yang, S.-H.; Lee, J.-Y.; Kim, W.-H.; Kang, C.-H. Influences of Asian dust, haze, and mist events on chemical compositions of fine particulate matters at Gosan site, Jeju Island in 2014. J. Korean Soc. Atmos. Environ. 2016, 32, 67–81. [Google Scholar] [CrossRef] [Green Version]
  23. Park, S.-U.; Kim, J.-W. Aerosol size distributions observed at the Seoul National University campus in Korea during the Asian dust and non-Asian dust periods. Atmos. Environ. 2006, 40, 1722–1730. [Google Scholar] [CrossRef]
  24. Hyeon, D.-R.; Song, J.-M.; Kim, K.-J.; Kim, W.-H.; Kang, C.-H.; Ko, H.-J. Compositions of haze aerosols and their variation by inflow pathway of air mass at Gosan site in Jeju Island during 2012–2013. Anal. Sci. Technol. 2014, 27, 213–222. [Google Scholar] [CrossRef] [Green Version]
  25. Jung, J.; Kim, Y.J.; Lee, K.Y.; Cayetano, M.G.; Batmunkh, T.; Koo, J.-H.; Kim, J. Spectral optical properties of long-range transport Asian dust and pollution aerosols over Northeast Asia in 2007 and 2008. Atmos. Chem. Phys. 2010, 10, 5391–5408. [Google Scholar] [CrossRef] [Green Version]
  26. Shi, H.; Lee, S.-S.; Chun, H.-W.; Song, H.-J.; Noh, Y.-C.; Sohn, B.-J. Optical properties of aerosols related to haze events over Seoul inferred from skyradiometer and satellite-borne measurements. Atmosphere 2016, 26, 289–299. [Google Scholar] [CrossRef]
  27. Choo, G.-H.; Lee, K.; Seo, J.; Kim, S.-Y.; Lee, D.-W.; Shin, H.-J. Optical and chemical properties of long-range transported aerosols using satellite and ground-based observations over seoul, South Korea. Atmos. Environ. 2021, 246, 118024. [Google Scholar] [CrossRef]
  28. Sokolov, A.; Dmitriev, E.; Gengembre, C.; Delbarre, H. Automated Classification of Regional Meteorological Events in a Coastal Area Using In Situ Measurements. J. Atmos. Ocean. Technol. 2020, 37, 723–739. [Google Scholar] [CrossRef]
  29. Lee, Y.; Cho, C.; Kim, M. Developing a Method for Detecting the Asian dust event Among High PM10 events Using aerodynamic particle Sizer (APS). Atmosphere 2008, 18, 25–32. [Google Scholar]
  30. Seinfeld, J.H.; Pandis, S.N. Atmospheric Chemistry and Physics; John Wiley & Sons: New York, NY, USA, 1998. [Google Scholar]
  31. Kim, J.-E.; Lee, H.-Y. Aerosol density determined using micro-orifice uniform deposit impactor and aerosol dust monitors data at Seoul. J. Korean Soc. Atmos. Environ. 2010, 26, 298–304. [Google Scholar] [CrossRef] [Green Version]
  32. Kim, M.-J.; Kim, Y.J.; Sohn, E.-H.; Kim, K.-L.; Ahn, M.-H. The study on the Quantitative Dust Index Using geostationary Satellite. Atmosphere 2008, 18, 267–277. [Google Scholar]
  33. Stein, A.F.; Draxler, R.R.; Rolph, G.D.; Stunder, B.J.B.; Cohen, M.D.; Ngan, F. NOAA’s HYSPLIT atmospheric transport and dispersion modeling system. Bull. Am. Meteorol. Soc. 2015, 96, 2059–2077. [Google Scholar] [CrossRef]
  34. Jo, H.-Y.; Kim, C.-H. Characteristics of East Asian Synoptic Meteorological Conditions in Association with Haze phenomena. Atmosphere 2010, 20, 161–172. [Google Scholar]
  35. Jeon, B.-I. Characteristics of Metallic and Ionic Elements Concentration in PM10 at Guducsan in Busan. J. Environ. Sci. 2016, 25, 715–726. [Google Scholar] [CrossRef] [Green Version]
  36. West, S.G.; Finch, J.F.; Curran, P.J. Structural equation models with nonnormal variables: Problems and remedies. In Structural Equation Modeling: Concepts, Issues, and Applications; Hoyle, R.H., Ed.; Sage Publications, Inc.: Thousand Oaks, CA, USA, 1995; pp. 56–75. [Google Scholar]
  37. Whitby, K.T. The physical characteristics of sulfur aerosols. Atmos. Environ. 1978, 12, 135–159. [Google Scholar] [CrossRef]
Figure 1. Location of the intensive observation site. PKNU, Pukyong National University.
Applsci 13 00355 g001
Figure 2. Classification of urban haze (UH), long-range transported haze (LH), Asian dust (AD), mist (MI), precipitation (PR), and clear days (CD). MC stands for the aerosol mass concentration; Mode 1 is the fine aerosol channel (0.5–1.0 μm); Mode 2 is the coarse aerosol channel (3–5 μm); AM and BU refer to Anmyeondo and Busan sites, respectively; and Q1 indicates the 25th percentile concentration.
Applsci 13 00355 g002
Figure 3. (a) Number and (b) mass concentration size distributions observed at each channel over the entire period. The bottom and top of each box represent the lower and upper quartiles, respectively, whereas the line within each box represents the median.
Applsci 13 00355 g003
Figure 4. Frequency distribution of the Asian dust (AD), haze (HZ), mist (MI), precipitation (PR), multiple events (ME), and clear days (CD) cases for the spring, 2009–2011 in Busan. Values in parenthesis indicate frequency number and percentage (%), respectively.
Applsci 13 00355 g004
Figure 5. Aerosol mass concentration size distribution for cases of the following: (a) Asian dust (AD), (b) haze (HZ), (c) mist (MI), (d) precipitation (PR), and (e) clear days (CD) over the entire analysis period.
Applsci 13 00355 g005
Figure 6. (a) Aerosol mass concentration size distribution for the AD, HZ, MI, PR, and CD cases. (b) The proportion of mass concentration for each phenomenon (AD, HZ, MI, and PR) by particle size compared with CD conditions (dashed line).
Applsci 13 00355 g006
Figure 7. Meteorological factor distributions for each phenomenon: (a) temperature and relative humidity, (b) pressure and wind speed. AD: Asian dust, HZ: haze, MI: mist, CD: clear days, and PR: precipitation.
Applsci 13 00355 g007
Figure 8. Logarithmic probability density function for mass concentration versus particle diameter (D) for the following: (a) Asian dust (AD), (b) haze (HZ), (c) mist (MI), (d) precipitation (PR), and (e) clear days (CD) cases. Red lines show the optimum regression curve. d is the geometric mean diameter, and σ is the geometric standard deviation.
Applsci 13 00355 g008
Figure 9. (a) Backward trajectory of air masses at 0400 UTC 17 March 2009 in Busan. Time series of aerosol mass concentrations in (b) Mode 1 and (c) Mode 2 at Busan (black line) are presented with those of Anmyeondo (red line) for 25–26 December 2009. The dashed lines are the median aerosol mass concentration for the CD cases in Modes 1 and 2, respectively.
Applsci 13 00355 g009
Figure 10. (a) Backward trajectory of air masses at 0000 UTC 12 April 2009 in Busan. Time series of aerosol mass concentrations in (b) Mode 1 and (c) Mode 2 at Busan (black line) are presented with those of Anmyeondo (red line) for 9–12 January 2009. The dashed lines are the median aerosol mass concentration for the CD cases in Modes 1 and 2, respectively.
Applsci 13 00355 g010
Figure 11. (a) Backward trajectory of air masses at 0300 UTC 13 April 2010 in Busan. Time series of aerosol mass concentrations in (b) Mode 1 and (c) Mode 2 at Busan (black line) are presented with those of Anmyeondo (red line) for 9–12 January 2009. The dashed lines are the median aerosol mass concentrations for the CD cases in Modes 1 and 2, respectively.
Applsci 13 00355 g011
Table 1. Specification of the laser particle counter (LPC).
ItemContents
Light collectionWide-angle light collection by the ellipsoidal mirror
Light sourceLaser diode
Particle diameter<10.0 μm
Size channels0.3, 0.5, 1.0, 3.0, 5.0, and 10.0 μm
Sample flow rate28.3 L·min−1
Power supplyNi-Cd Battery with AC adaptor (standard) dry cell battery/U2X9 (optional)
Table 2. Statistical summary for the results of aerosol mass concentration by particle size (D, μm) for the instances of meteorological phenomena; all variables are expressed in μg·m−3.
CaseParticle SizeMeanStandard
Deviation
25 Percentile (Q1)Median
(Q2)
75
Percentile (Q3)
IQRMAD
AD0.3–0.51.17550.70100.53181.16881.62431.09250.6083
0.5–1.00.40990.80500.09590.13660.21640.12050.0439
1.0–3.00.38580.97890.08090.12350.21500.13410.0458
3.0–5.01.72913.65000.48680.72221.32650.83970.3217
5.0–102.21005.16970.08551.02831.97611.89060.9436
HZ0.3–0.51.57760.94110.94421.25612.42671.48250.5105
0.5–1.00.18940.10980.07910.19150.28080.20170.1061
1.0–3.00.04940.02710.02720.04050.06460.03740.0185
3.0–5.00.30000.30560.10720.18930.35240.24520.1131
5.0–100.31710.36800.05580.15750.47830.42250.1179
MI0.3–0.52.23091.27511.08582.21253.09212.00630.9497
0.5–1.00.11410.08180.06390.09320.11800.05410.0283
1.0–3.00.03140.02650.00880.02590.04600.03720.0177
3.0–5.00.24750.44720.06850.11340.23320.16470.0614
5.0–100.28280.34160.05850.17480.33820.27970.1224
PR0.3–0.51.11781.17020.23270.62581.50171.26910.5244
0.5–1.00.06270.03880.03540.05490.07900.04360.0213
1.0–3.00.02820.03030.01190.02130.03430.02240.0123
3.0–5.00.17790.35710.03550.07910.18430.14880.0590
5.0–100.24410.78490.01670.03950.19730.18060.0349
CD0.3–0.51.08870.93870.31650.82781.59631.27980.5654
0.5–1.00.08220.06740.03680.05500.10540.06860.0232
1.0–3.00.03330.02920.01420.02550.04240.02820.0136
3.0–5.00.32640.41350.09390.16200.38700.29310.0999
5.0–100.36840.59440.04020.11680.49630.45610.0967
IQR: interquartile range, MAD: median absolute deviation, AD: Asian dust, HZ: haze, MI: mist, PR: precipitation, and CD: clear days.
Table 3. Skewness and Kurtosis for the aerosol mass concentration by particle size before and after logarithmic transformation for the instances of meteorological phenomena.
Logarithmic Transformation
BeforeAfter
VariablesCases0.3–0.50.5–1.01.0–3.03.0–5.05.0–100.3–0.50.5–1.01.0–3.03.0–5.05.0–10
SkewnessAD0.513.974.794.704.63−0.631.431.841.63−0.09
HZ0.620.260.682.162.00−0.52−0.250.060.18−0.08
MI0.281.731.514.622.30−0.74−0.66−0.76−0.64−0.49
PR1.441.904.266.187.74−0.36−1.28−0.52−0.460.27
CD1.172.031.840.941.78−0.090.57−0.42−1.58−1.17
KurtosisAD−0.2216.7823.2622.3921.84−0.661.383.593.43−0.76
HZ−0.66−1.23−0.804.874.36−0.38−1.49−1.21−0.46−0.90
MI−0.772.693.7424.915.90−0.522.220.481.84−0.02
PR1.478.0026.5747.7668.410.016.860.431.08−0.09
CD1.024.353.310.683.81−0.86−0.080.953.232.27
AD: Asian dust, HZ: haze, MI: mist, PR: precipitation, and CD: clear days.
Table 4. Lognormal fit parameters to the mass concentration distribution for each case, where Nt is the total aerosol mass concentration, d is the geometric mean diameter, and σ is the geometric standard deviation.
CaseParameterNt (μg·m−3)d (μm)σ (μm)
Asian Dust
(AD)
Mode 11.760.421.42
Mode 24.035.101.52
Haze (HZ)Mode 13.000.381.36
Mode 20.535.141.49
Mist (MI)Mode 13.790.401.28
Mode 20.365.281.47
Precipitation
(PR)
Mode 12.550.351.34
Mode 20.365.491.51
Clear days (CD)Mode 12.140.361.35
Mode 20.625.241.46
Table 5. Meteorological phenomena observed by the KMA, and the corresponding results derived from the classification algorithm.
DateAlgorithmKMAVerificationMode 1
(μg·m−3)
Mode
(μg·m−3)
17 March 2009ADADO0.1911.540
12 April 2009LHHZO0.1950.237
2 April 2011UHHZO0.0680.172
12 March 2010MIMIO0.2460.087
13 April 2010MIMIO0.0720.313
19 May 2011MIMIO0.0470.094
16 April 2009PRPRO0.0340.127
15 April 2010PRPRO0.0370.200
23 May 2011PRPRO0.0290.007
Here, O indicates that both results match. The aerosol mass concentrations of Modes 1 and 2 are the daily median values. AD: Asian dust, LH: long-range transported haze, UH: urban haze, MI: mist, PR: precipitation, and HZ: haze.
Disclaimer/Publisher’s Note: The statements, opinions and data contained in all publications are solely those of the individual author(s) and contributor(s) and not of MDPI and/or the editor(s). MDPI and/or the editor(s) disclaim responsibility for any injury to people or property resulting from any ideas, methods, instructions or products referred to in the content.

