
Evaluation of Emission Characteristics and Microstructure of Particulate Matters from Excavation and Restoration Work on Asphalt Concrete Pavement

Abstract
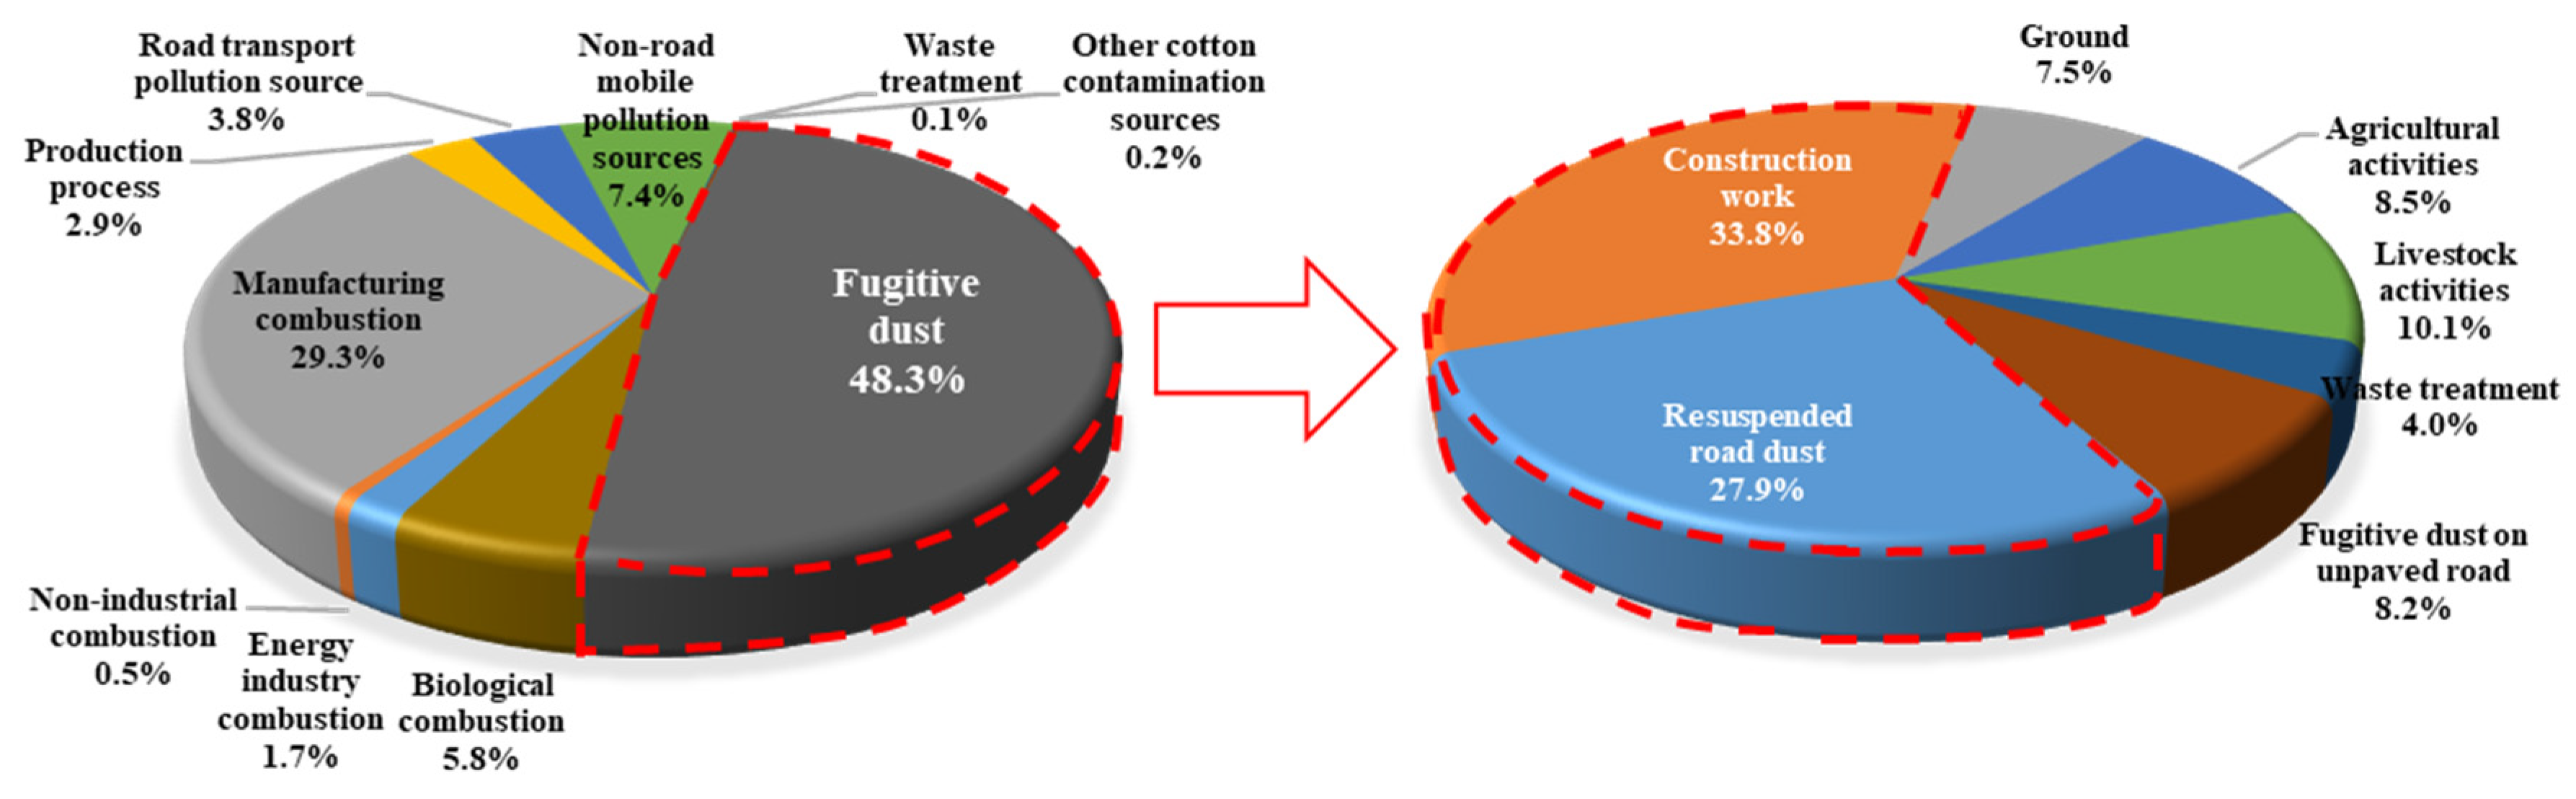
:1. Introduction
2. Analysis of PM10 Emission Trends through Excavation–Restoration Field Experiment (Level 1)
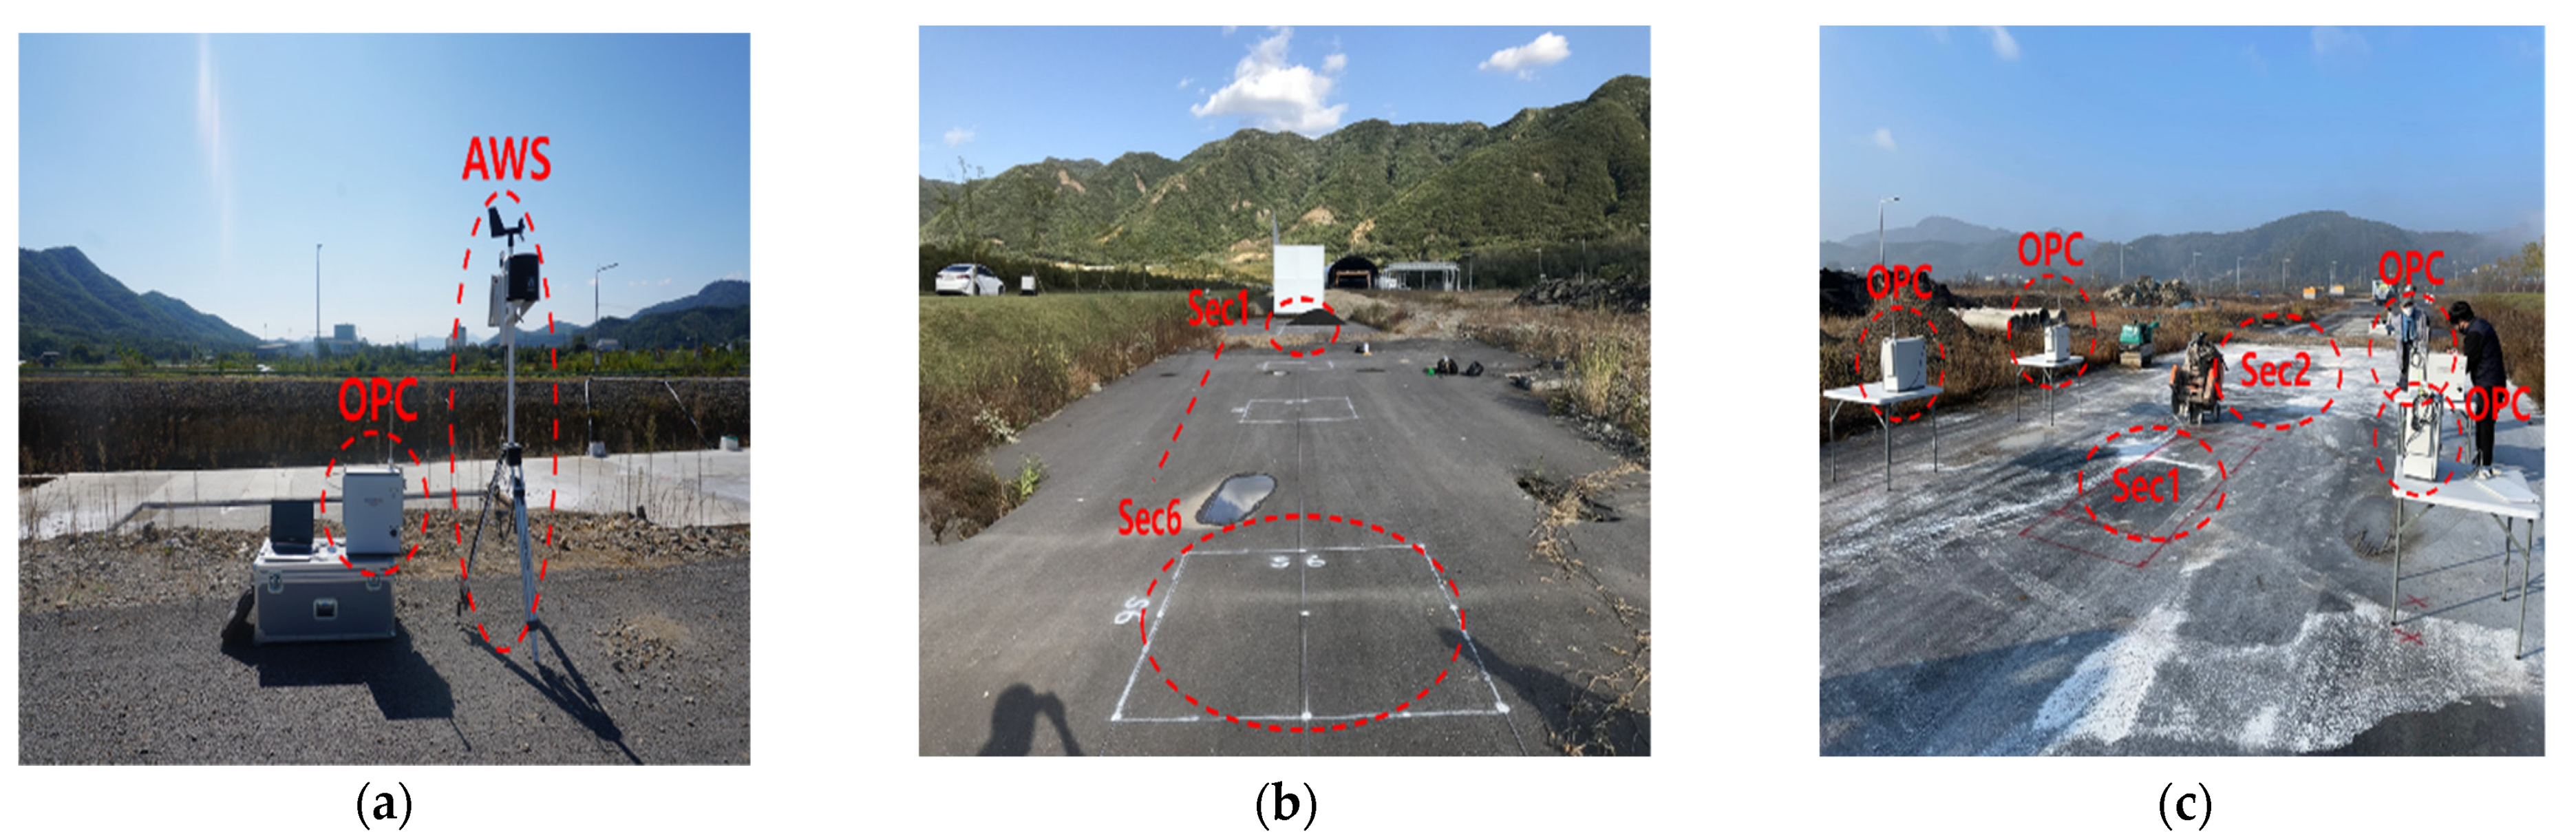
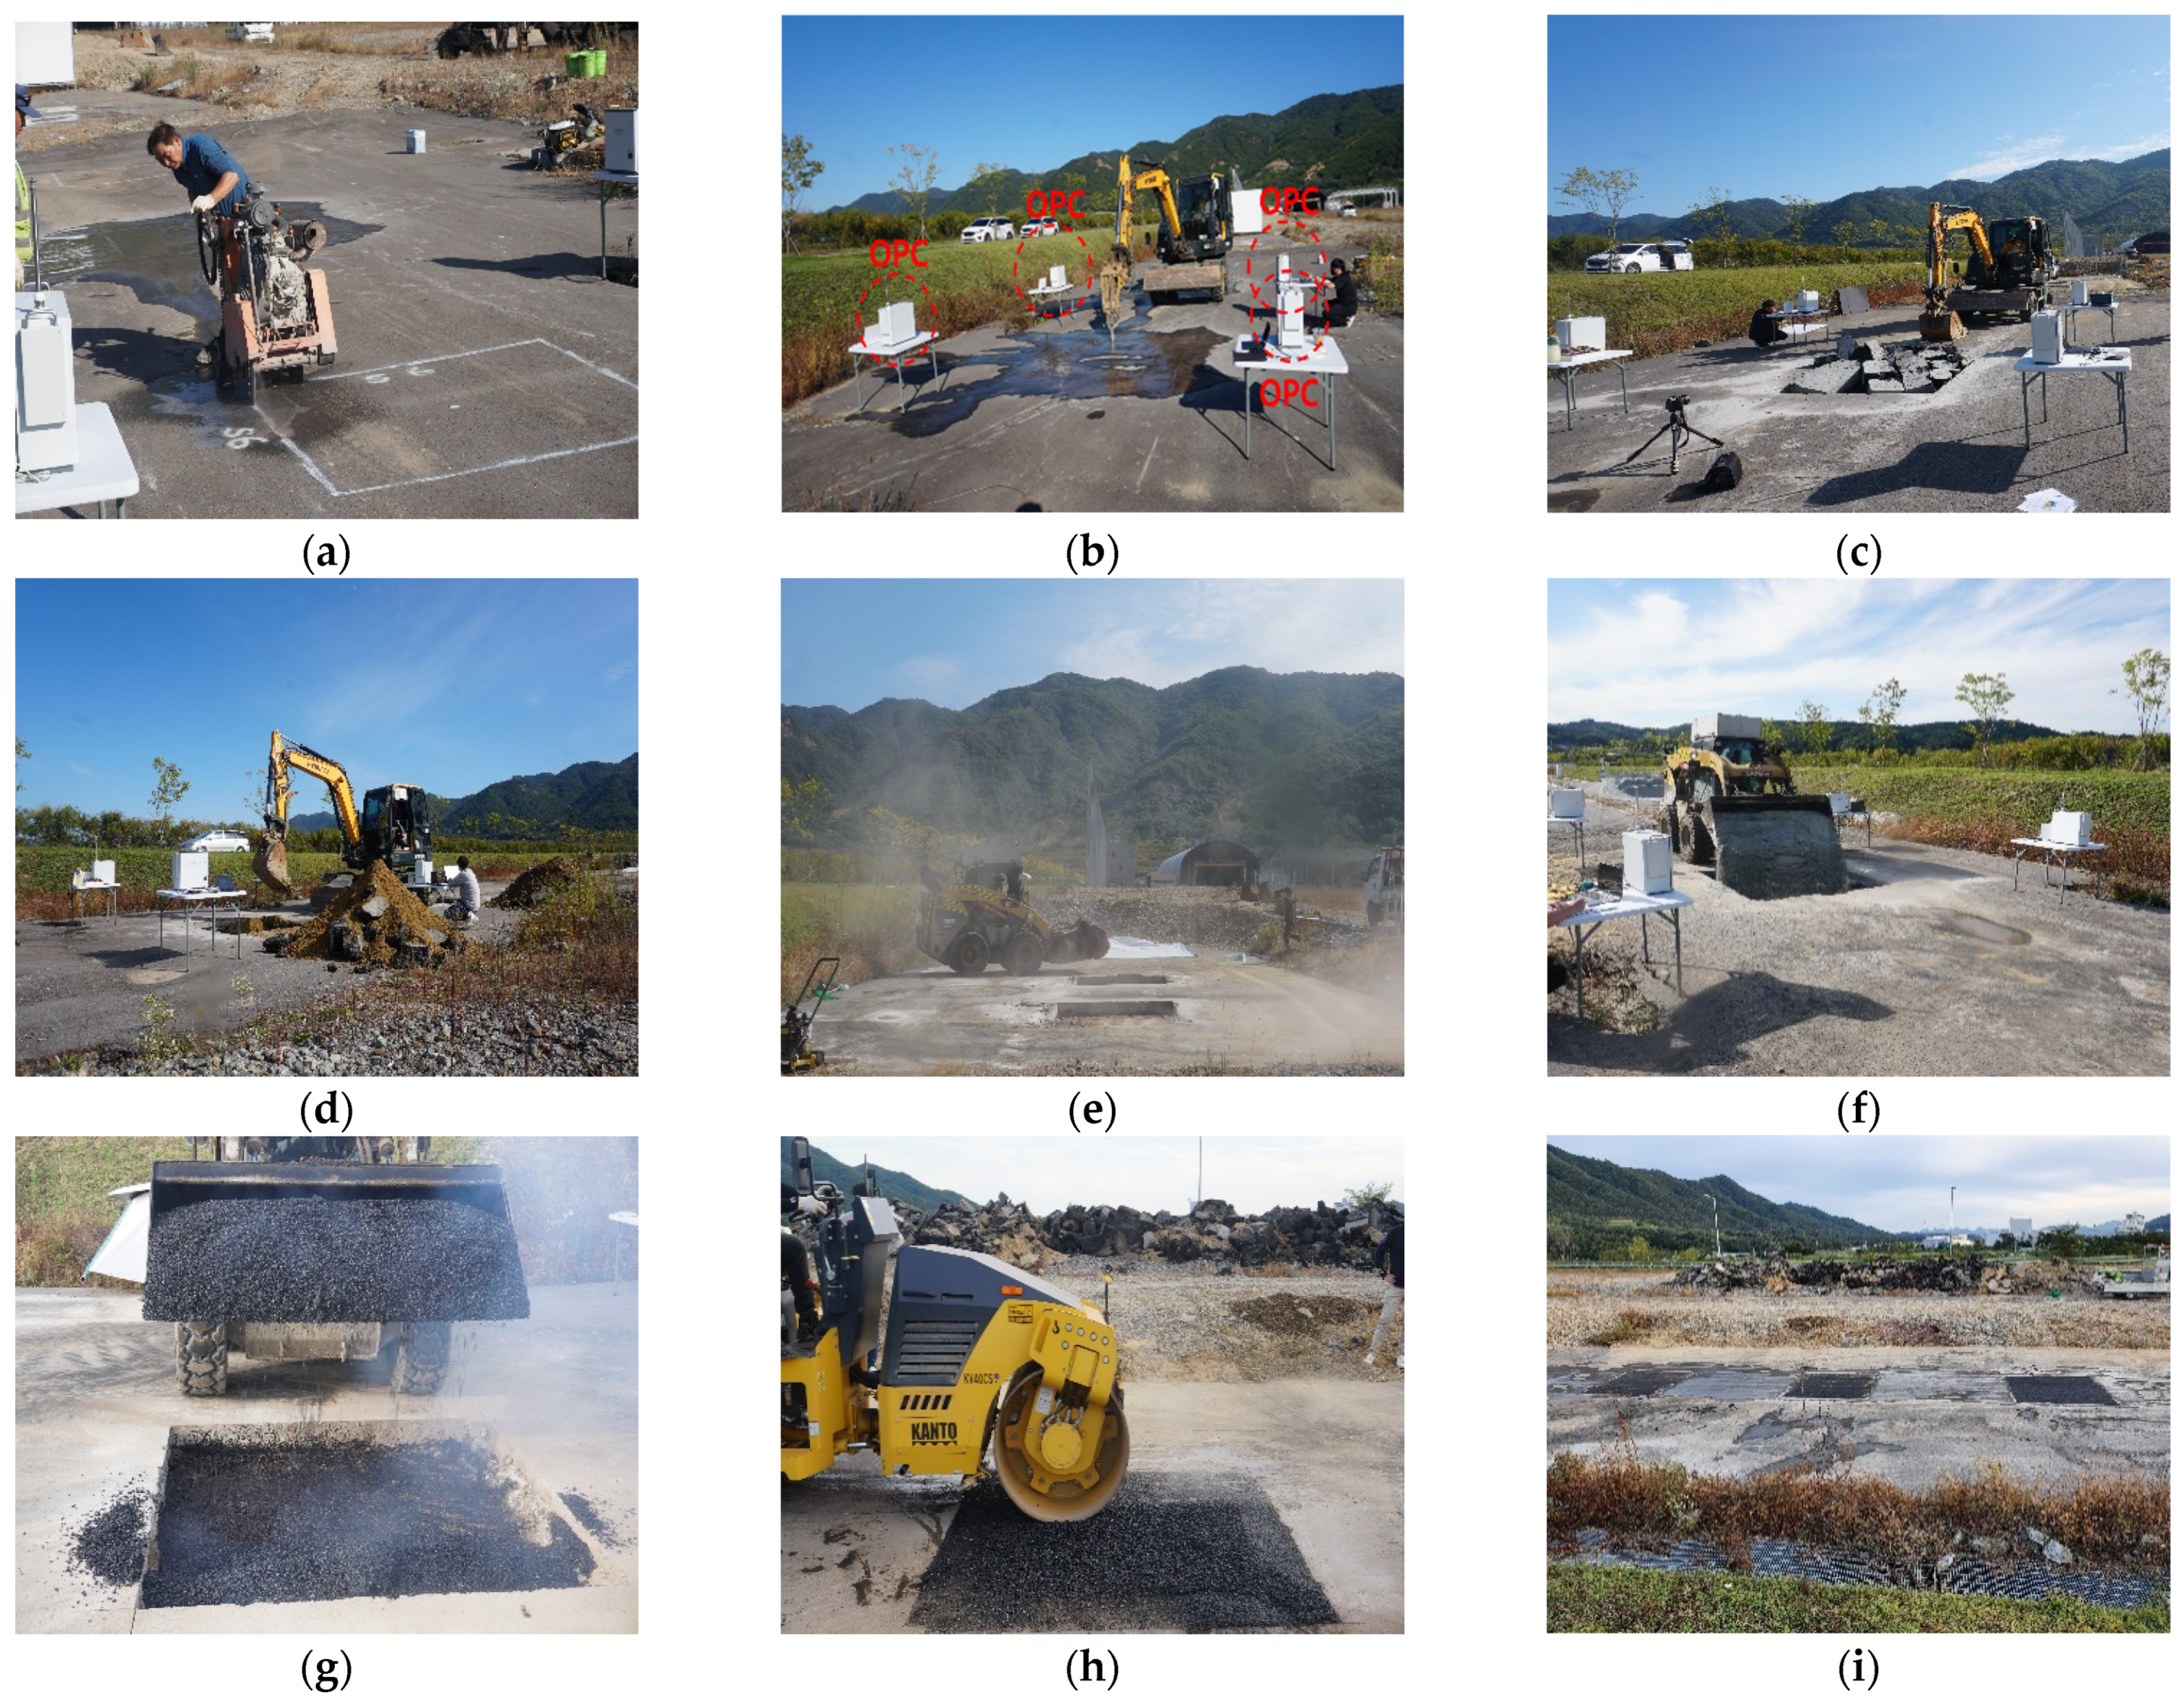
2.1. Methodology
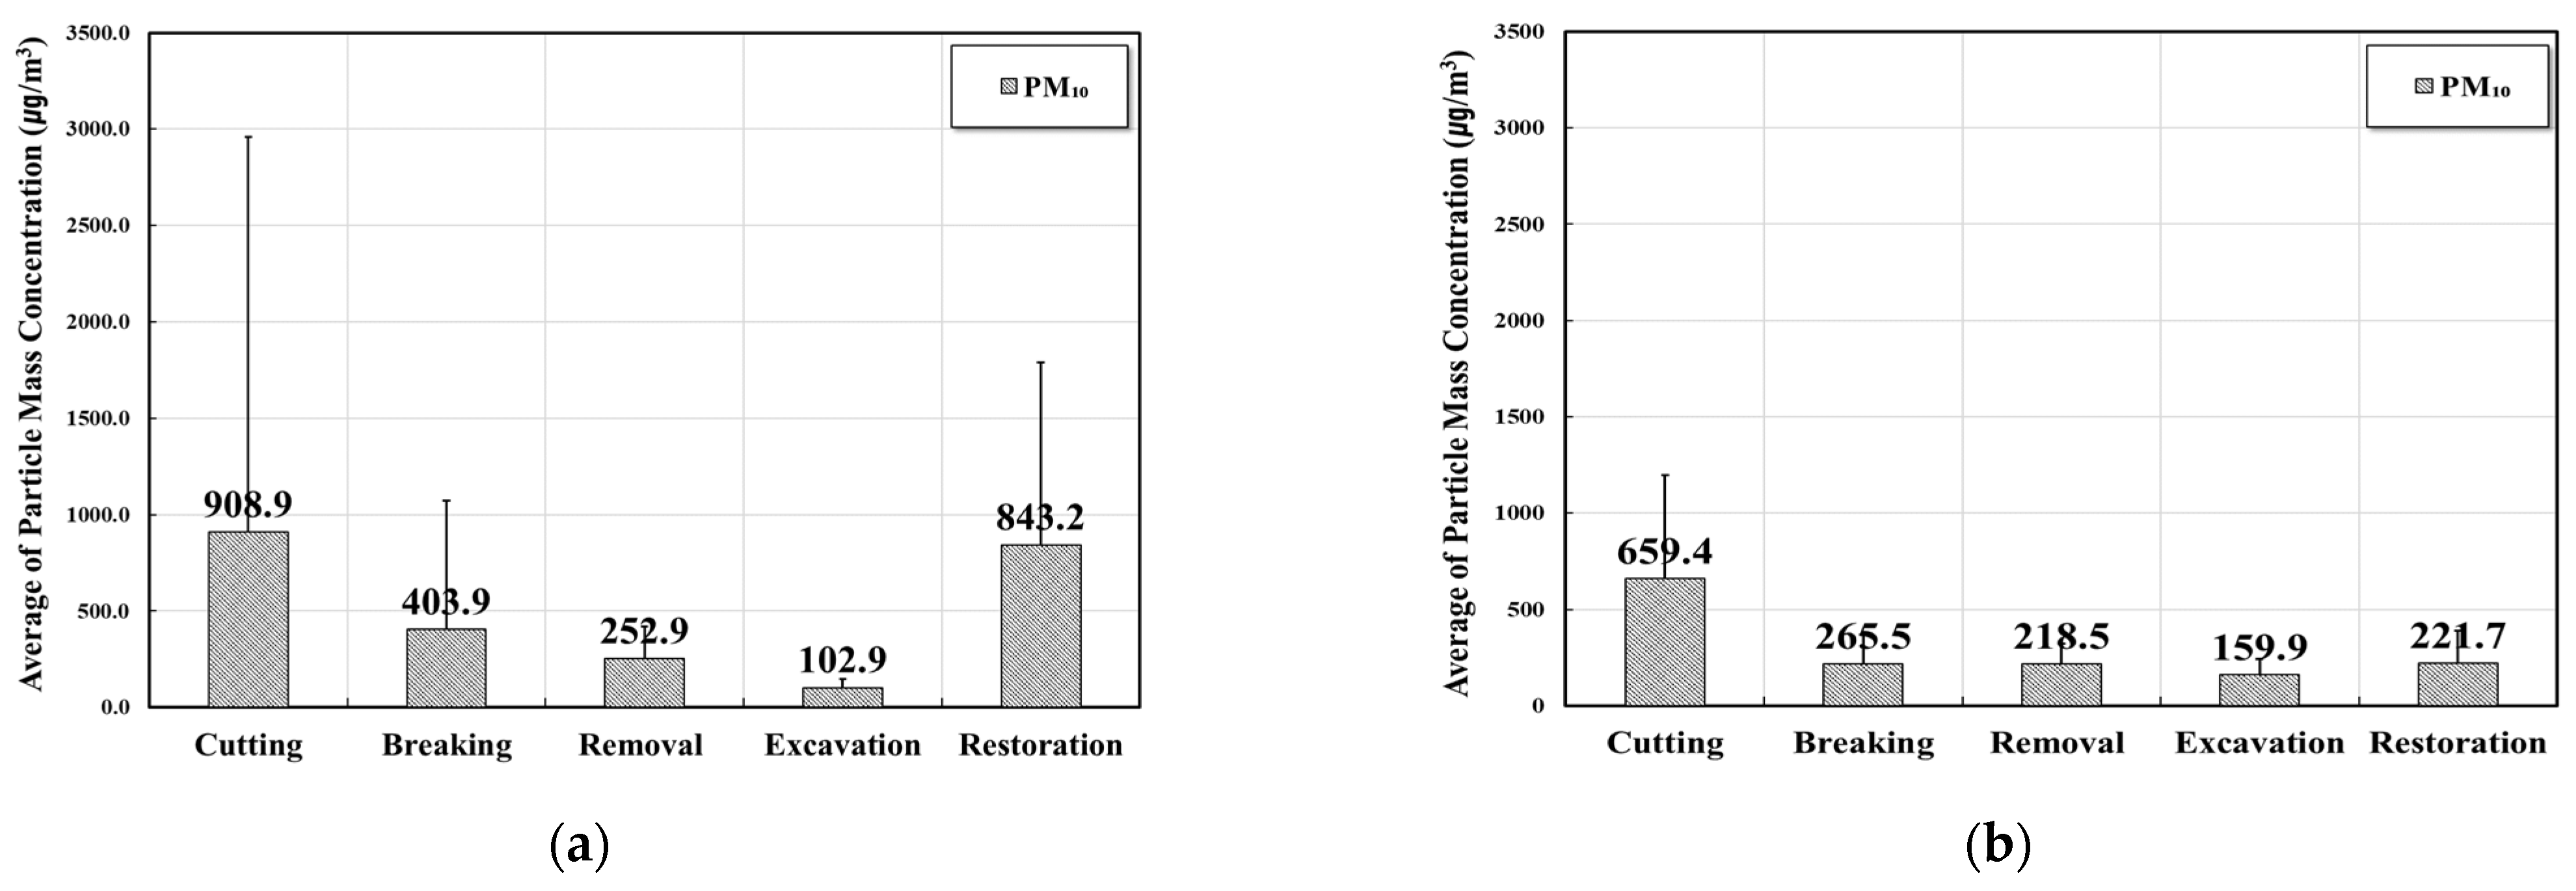
2.2. Field Experimental Results and Analysis
3. Evaluation of PM10 Generated in Cutting Operation through Chamber Experiment (Level 2)
3.1. Methodology
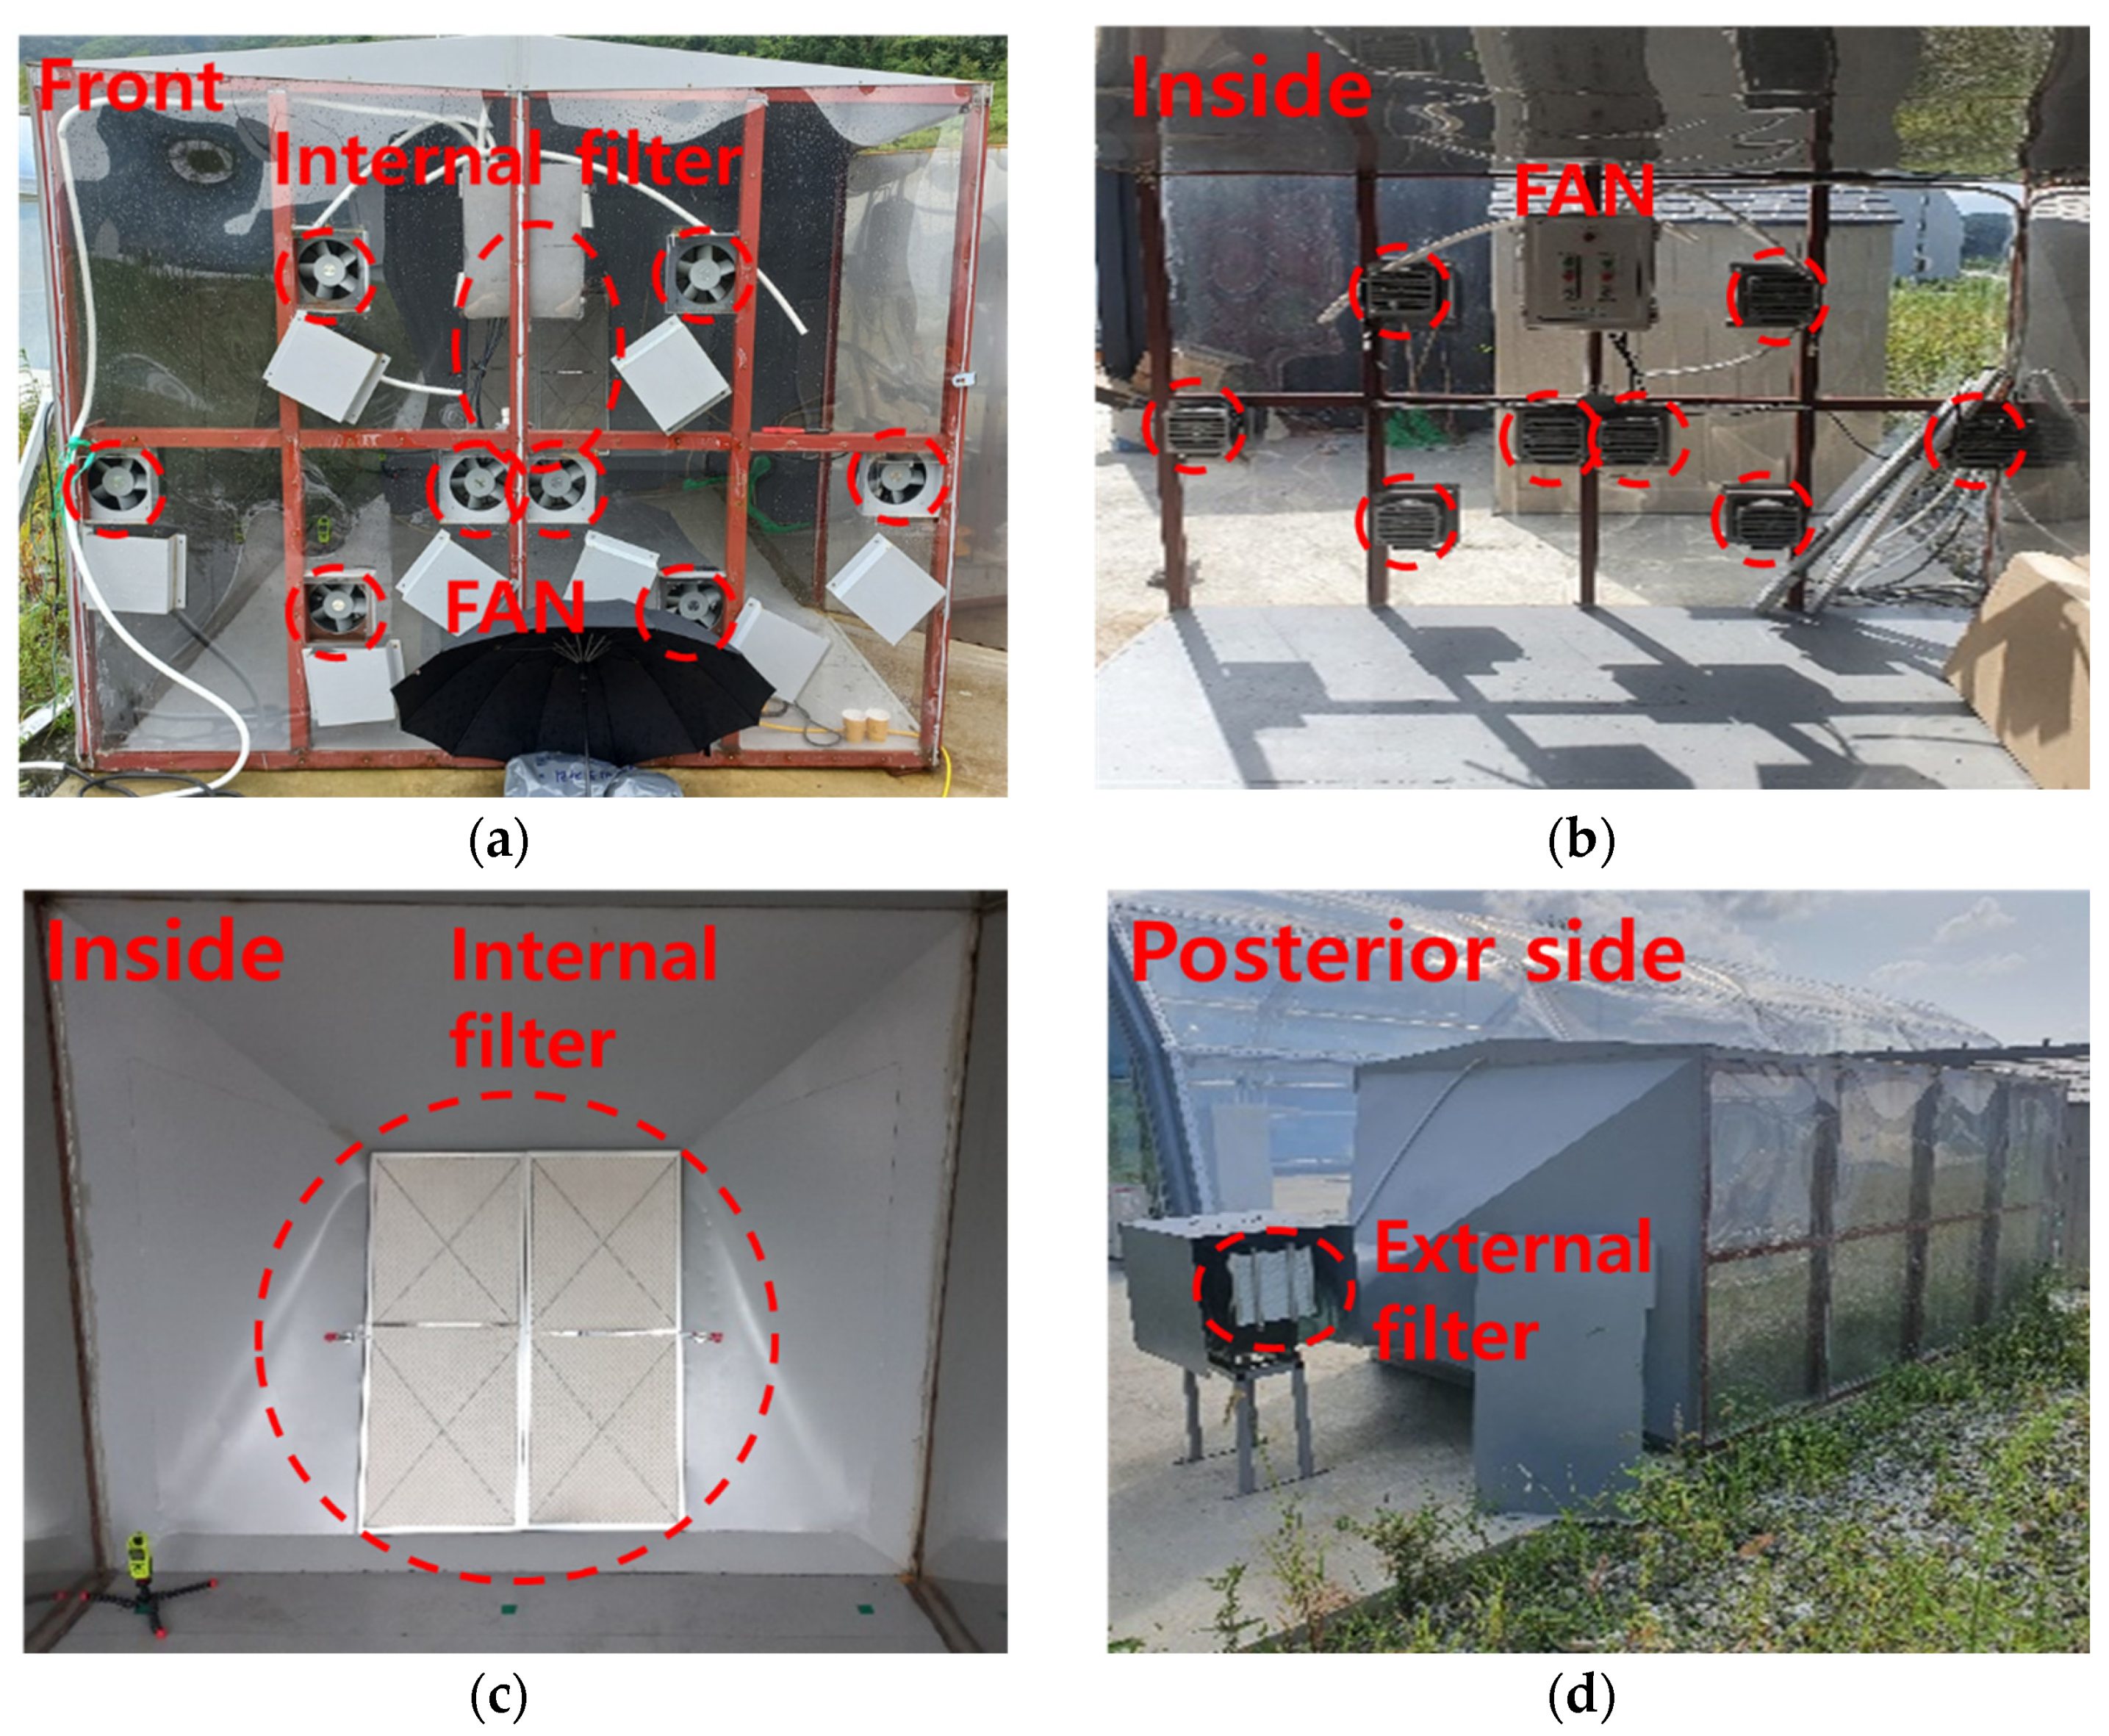
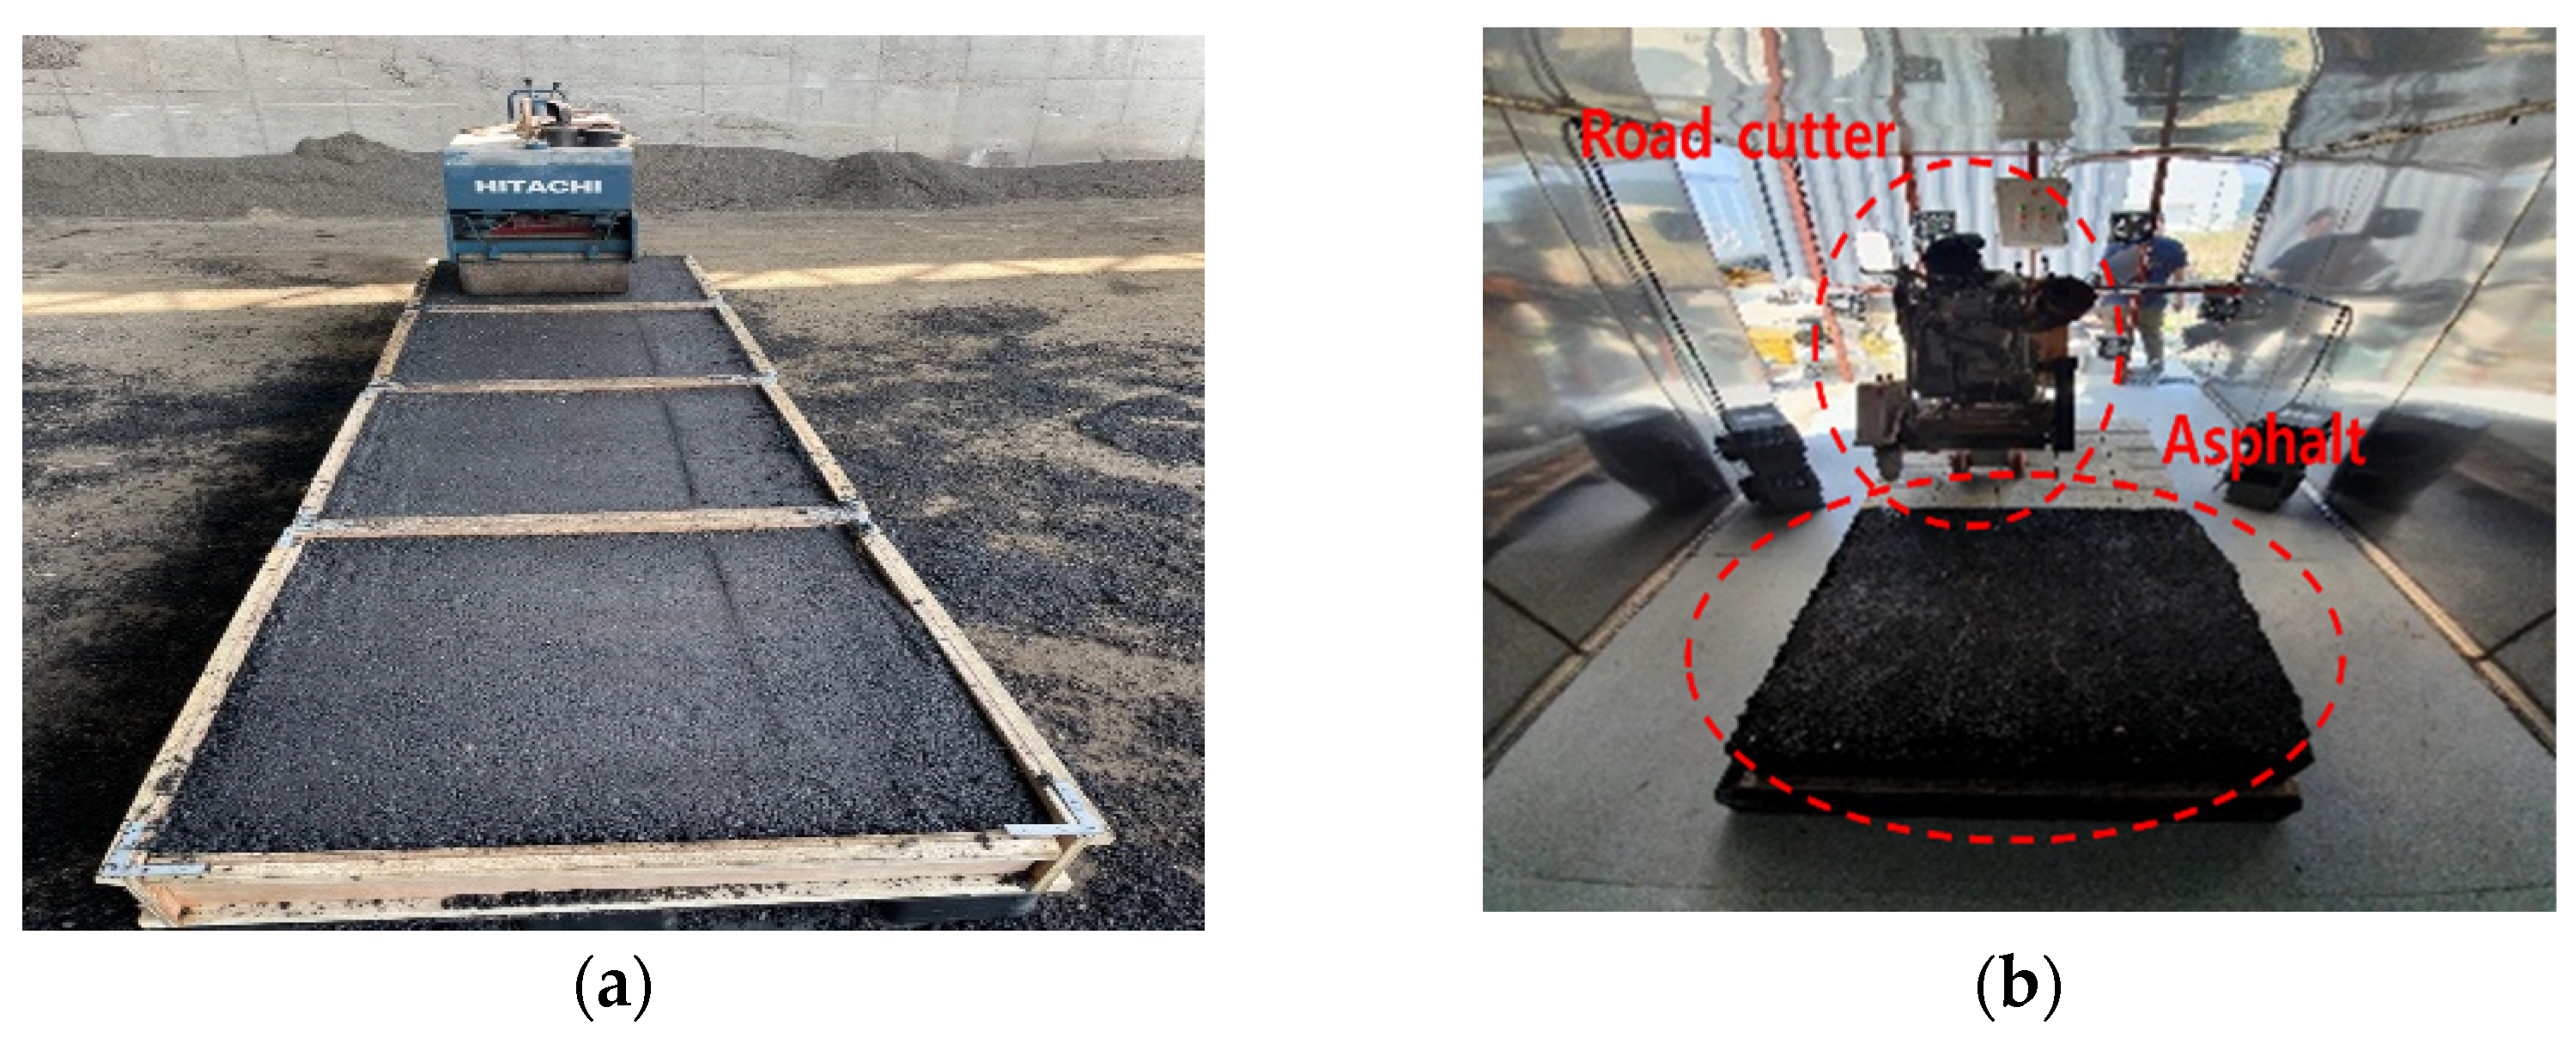
3.1.1. Experimental Setup
3.1.2. Experimental Method
3.2. Experimental Results and Analysis
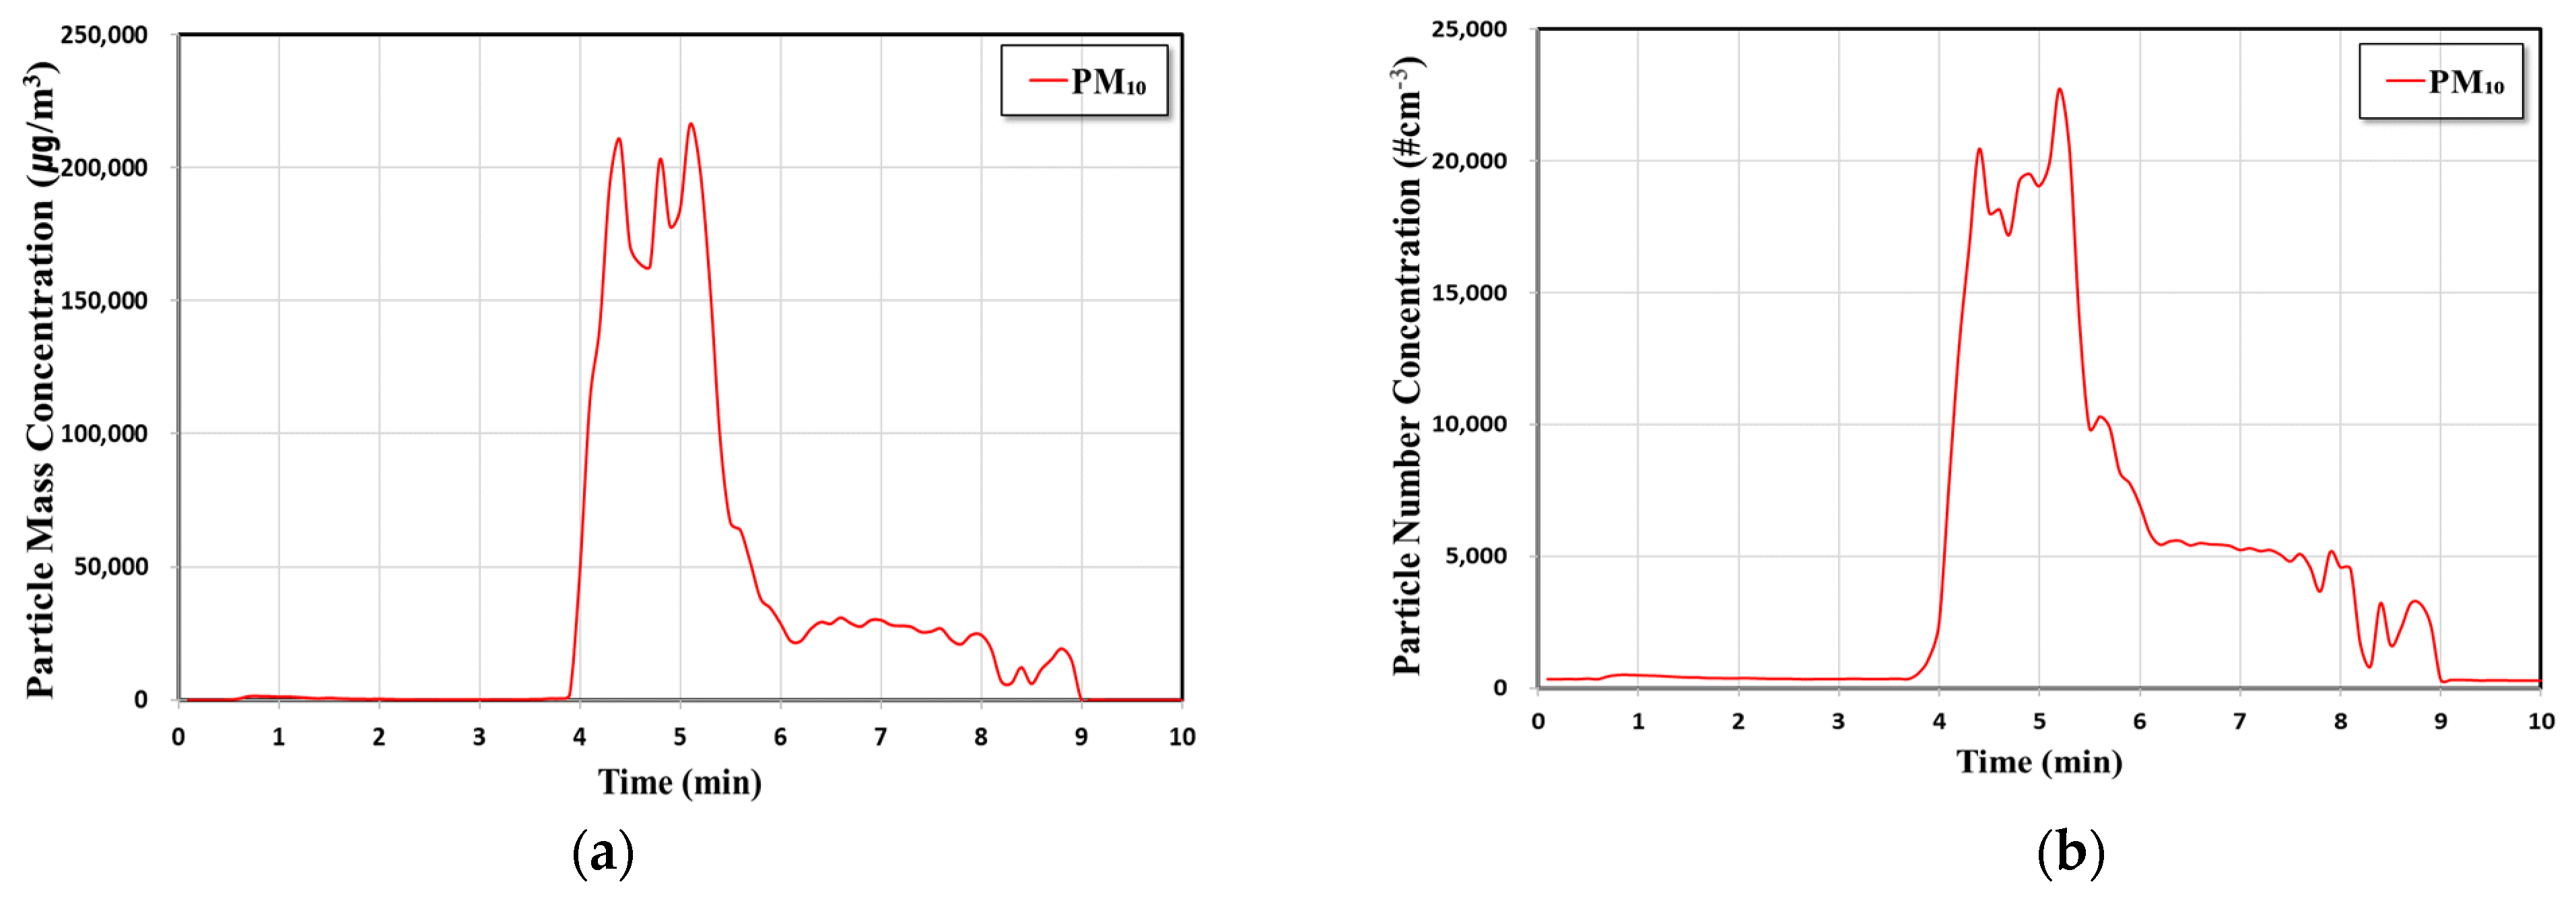
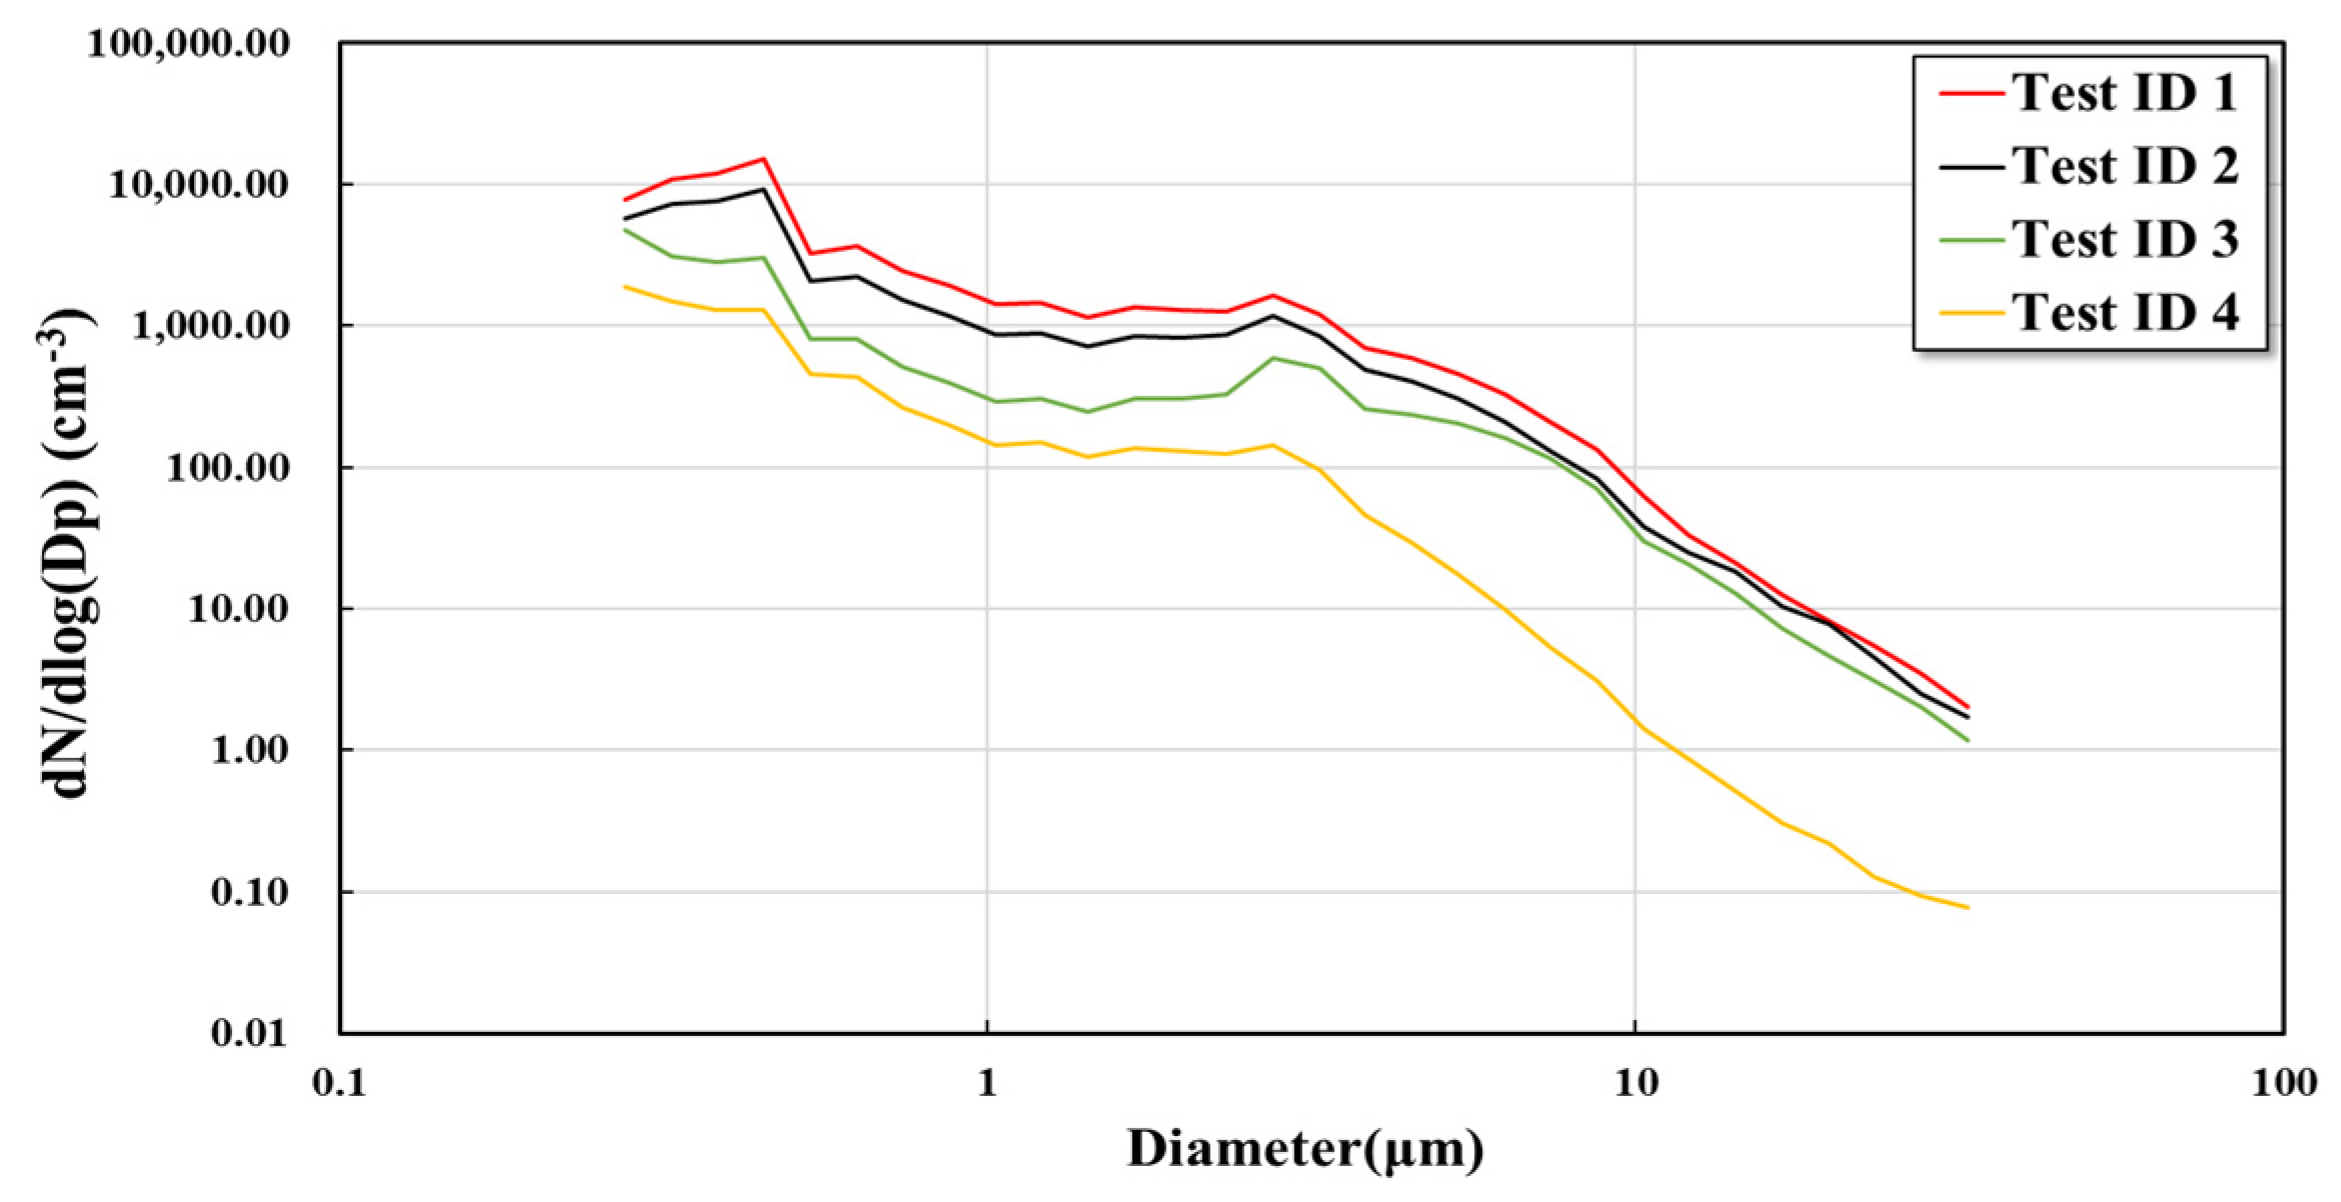
3.2.1. Scattered PM
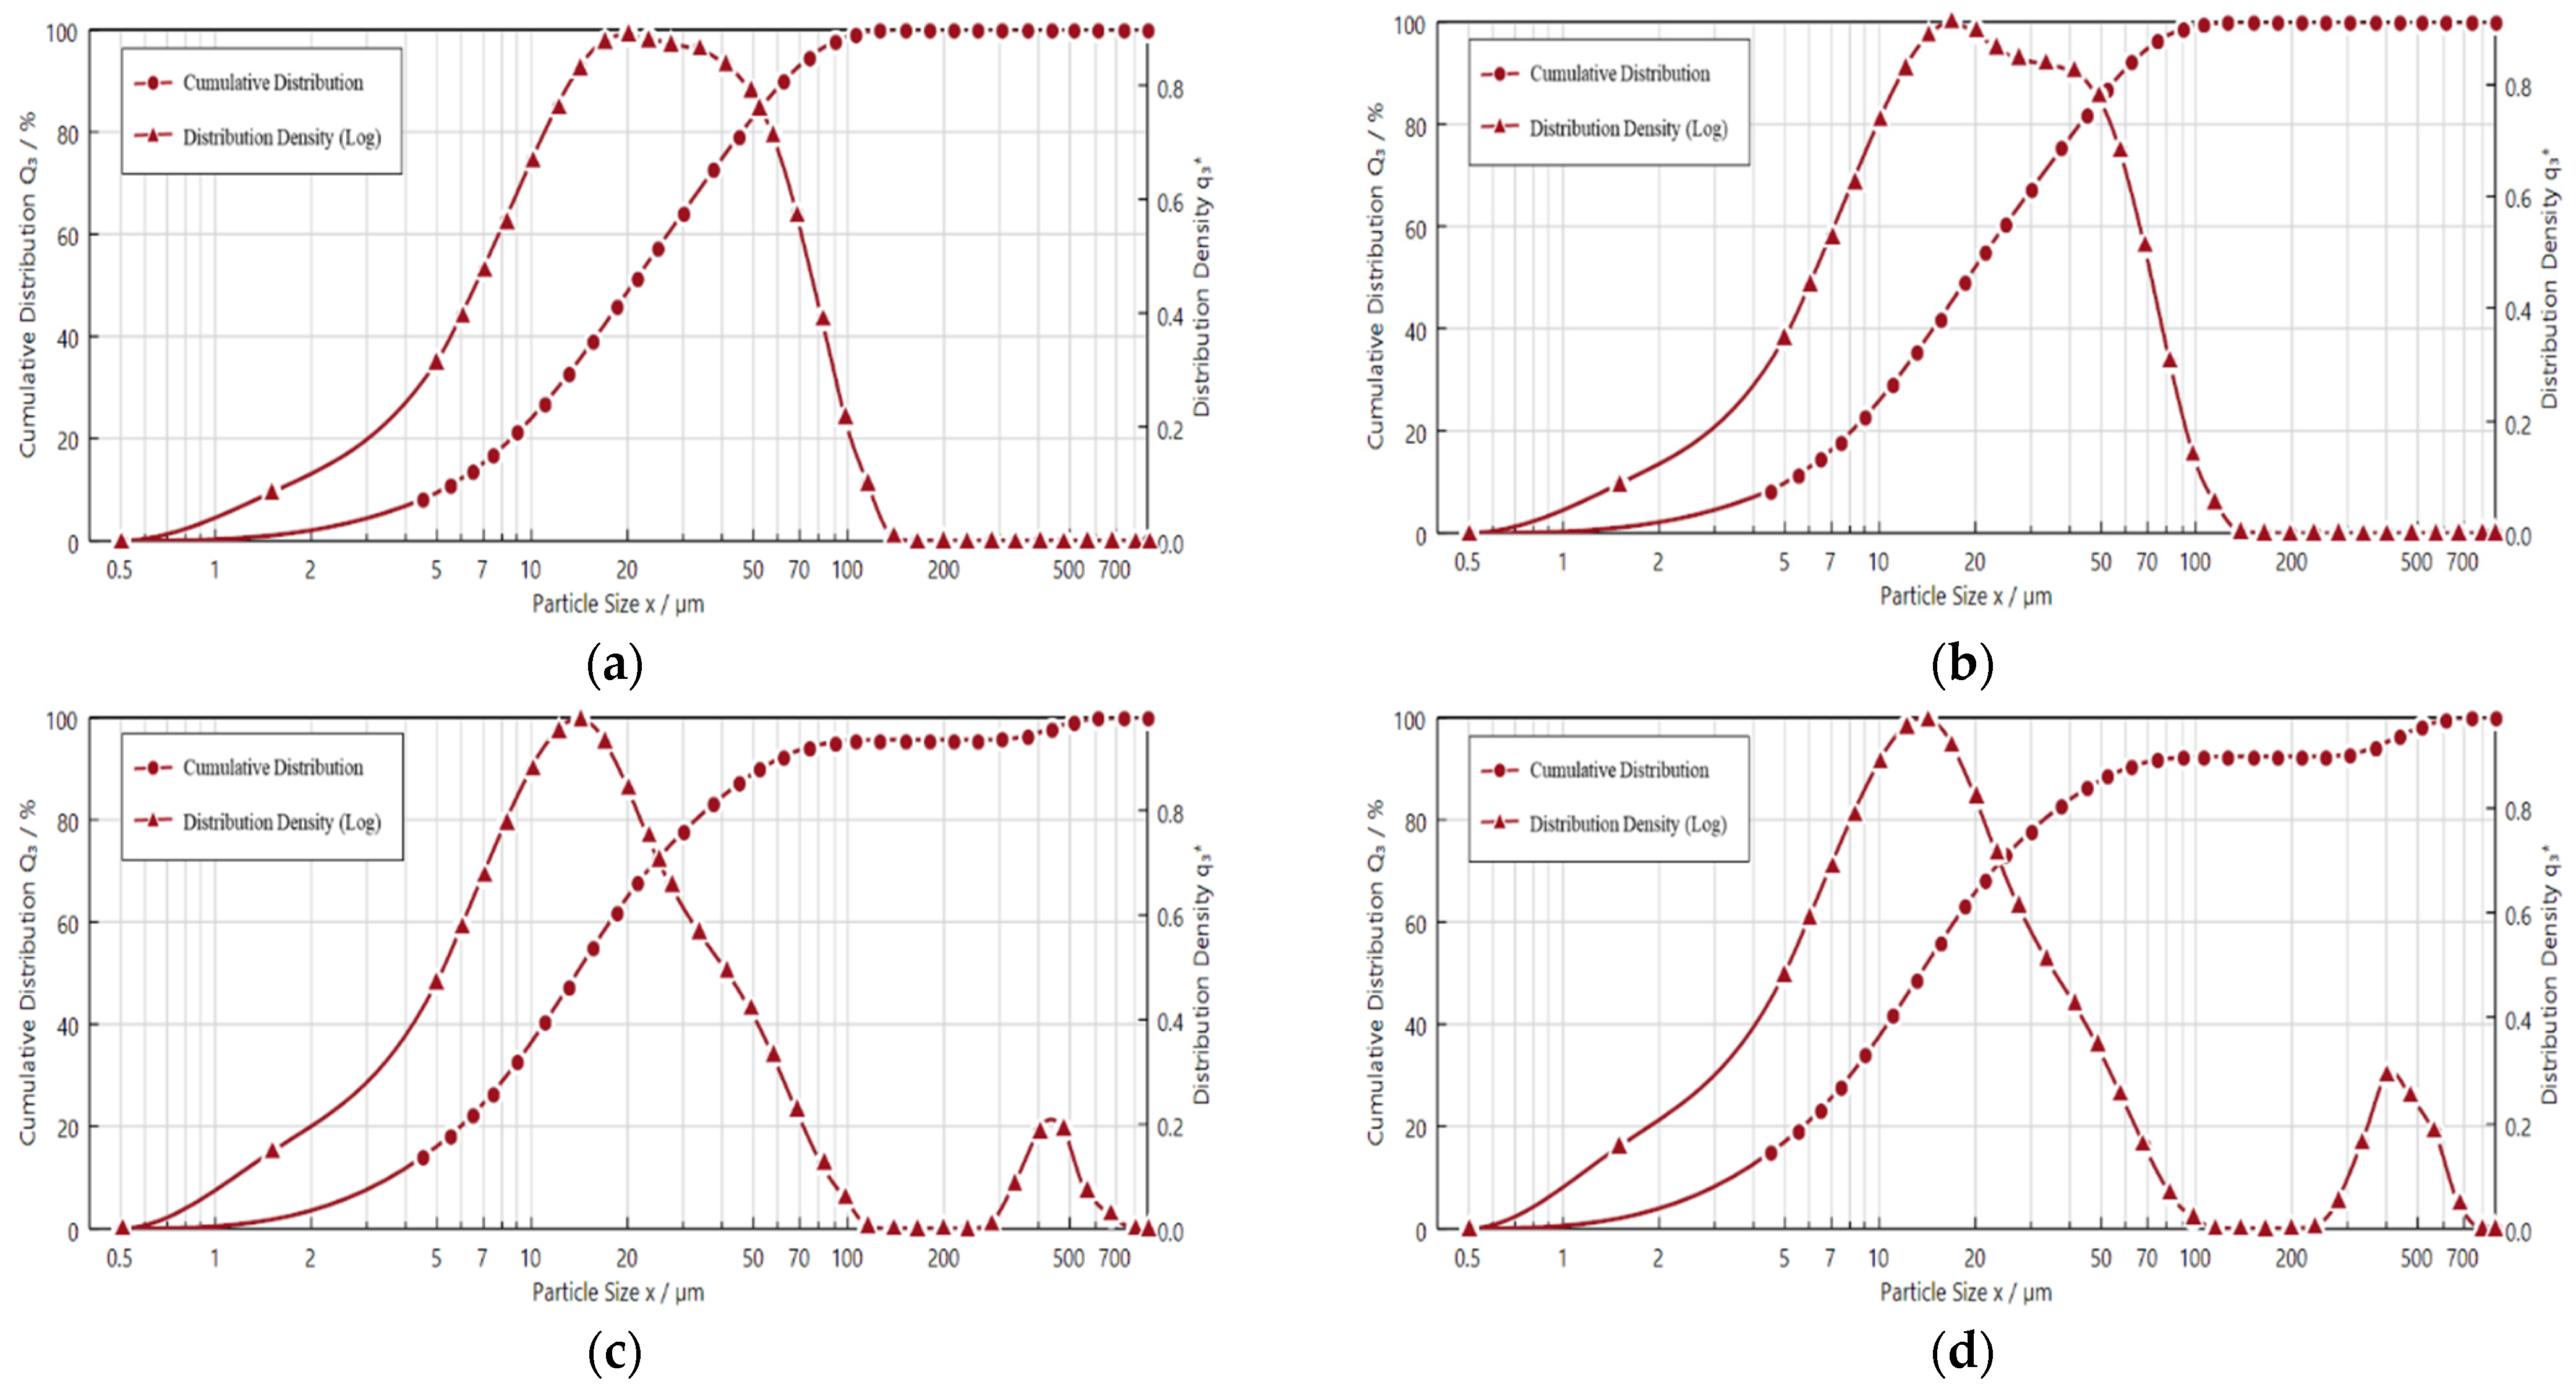
3.2.2. Deposited PM
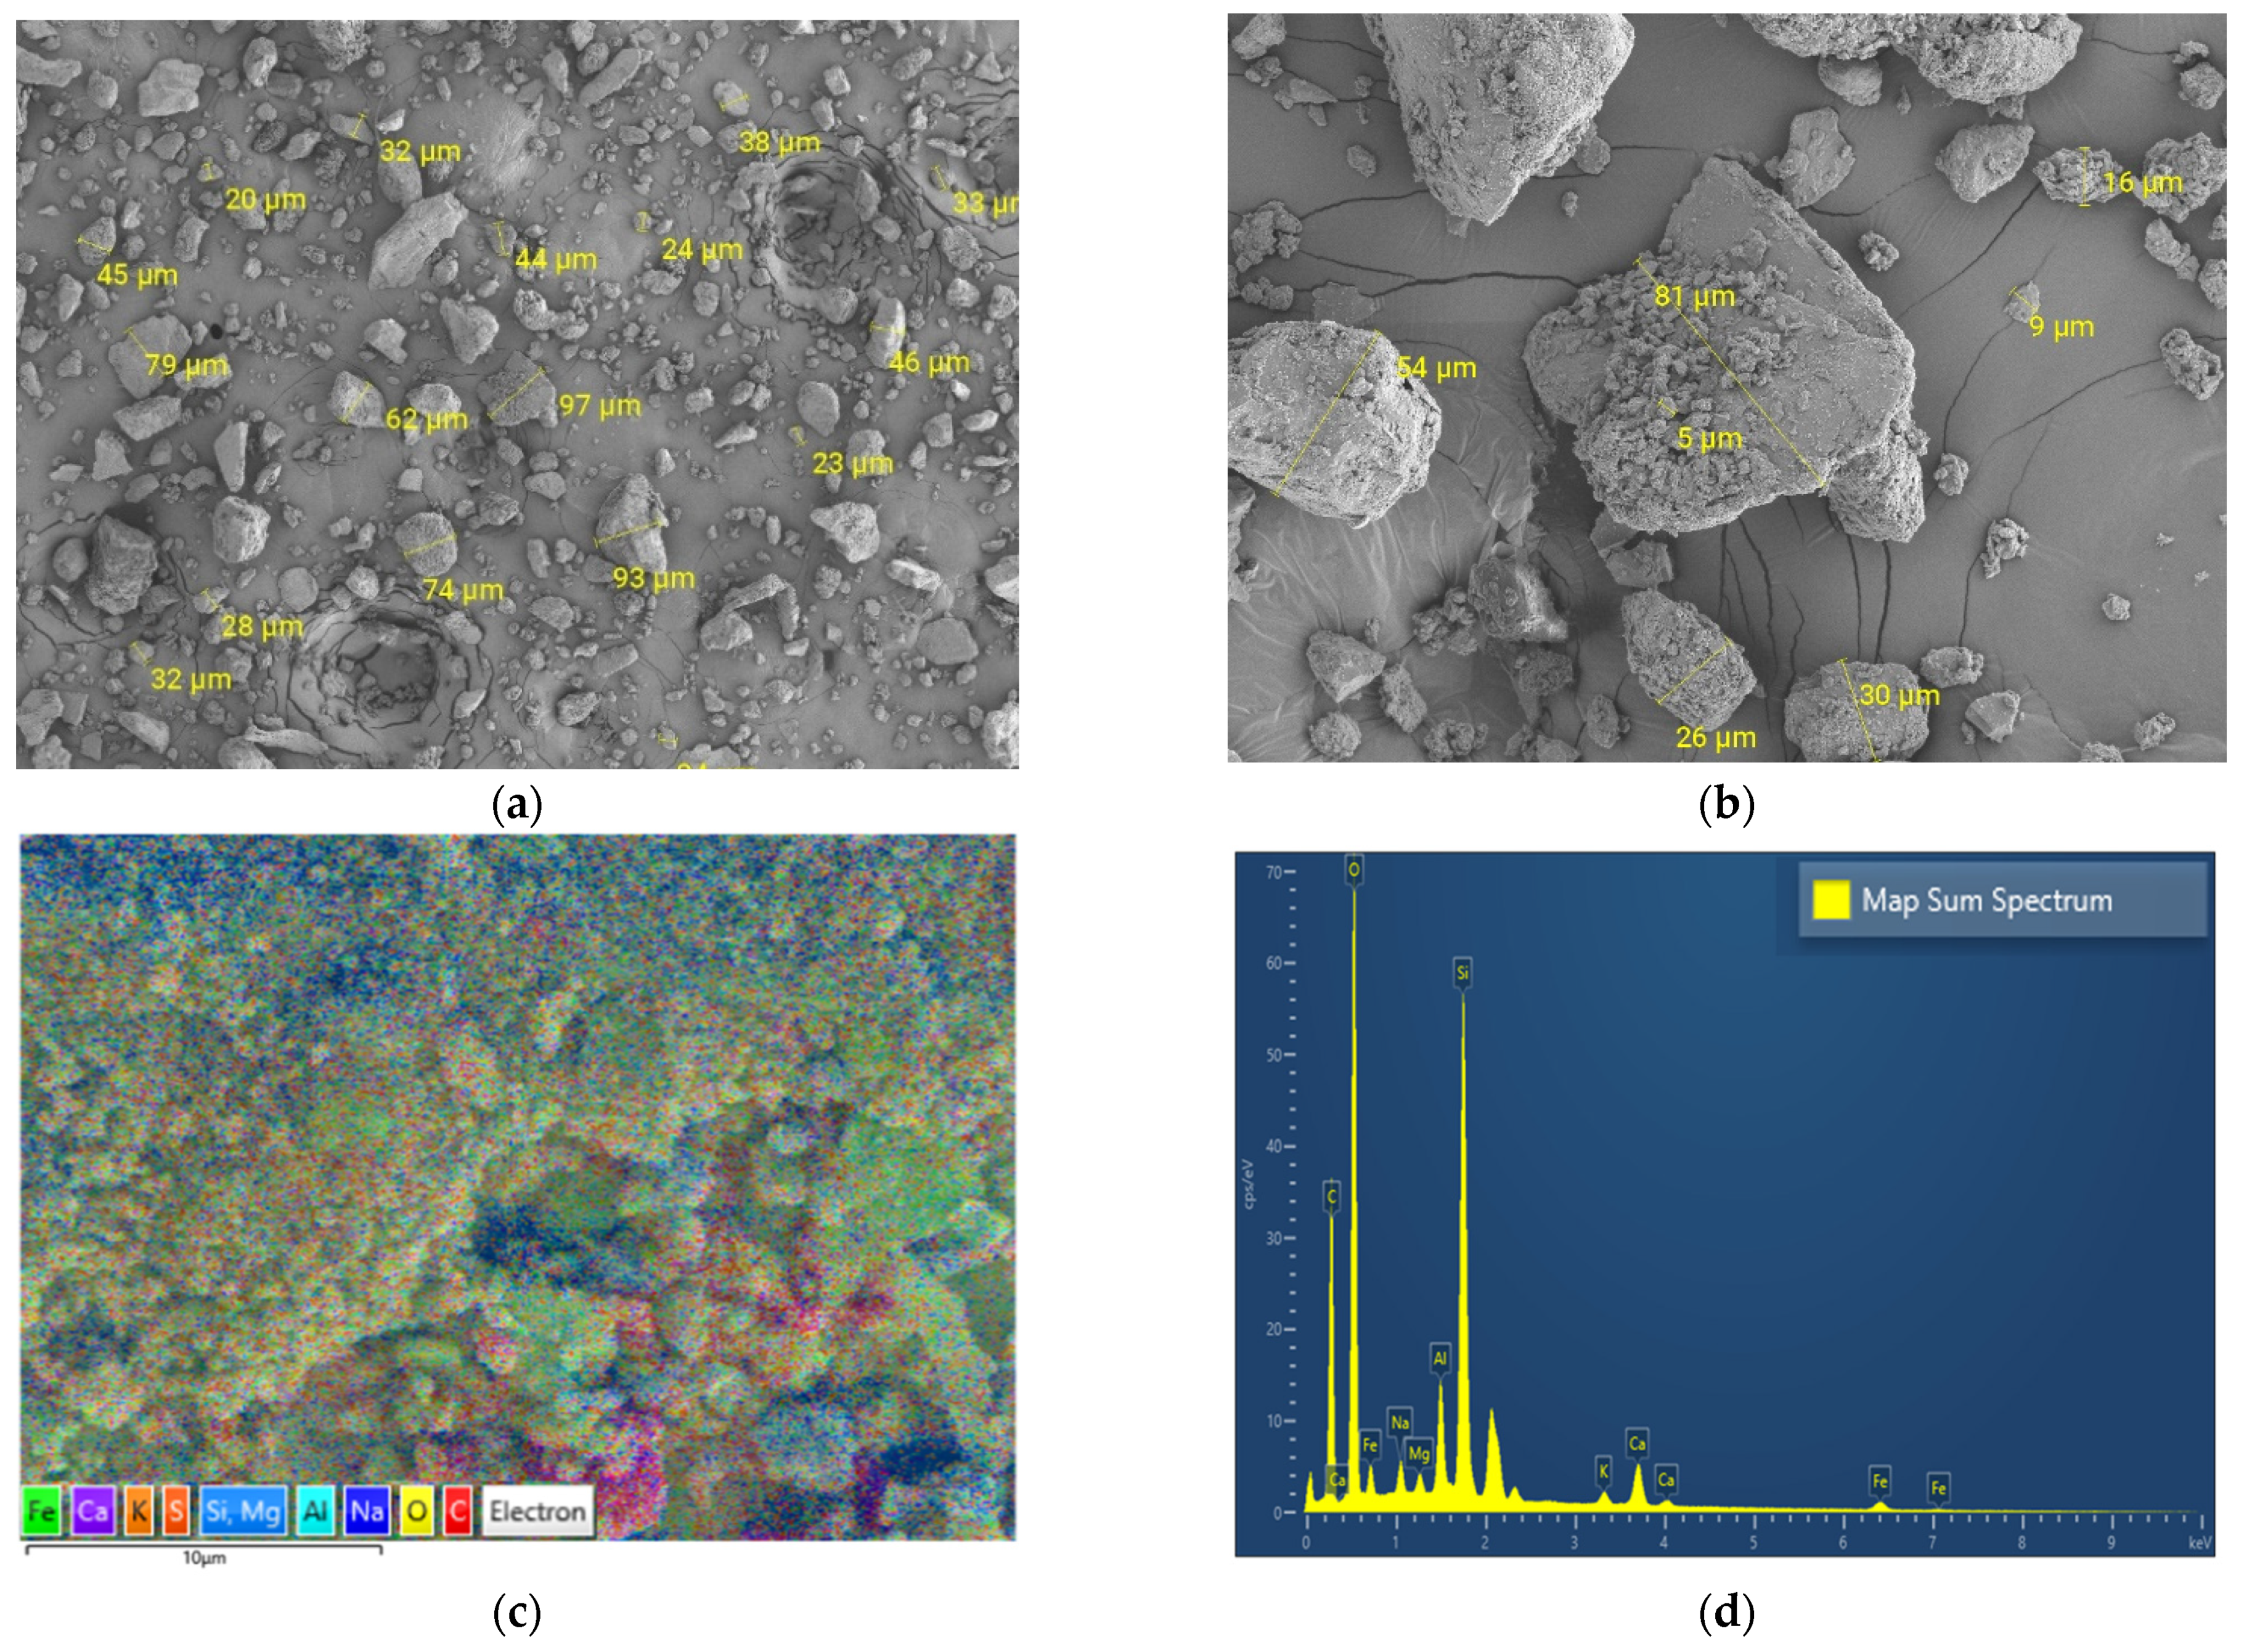
3.2.3. SEM Analysis
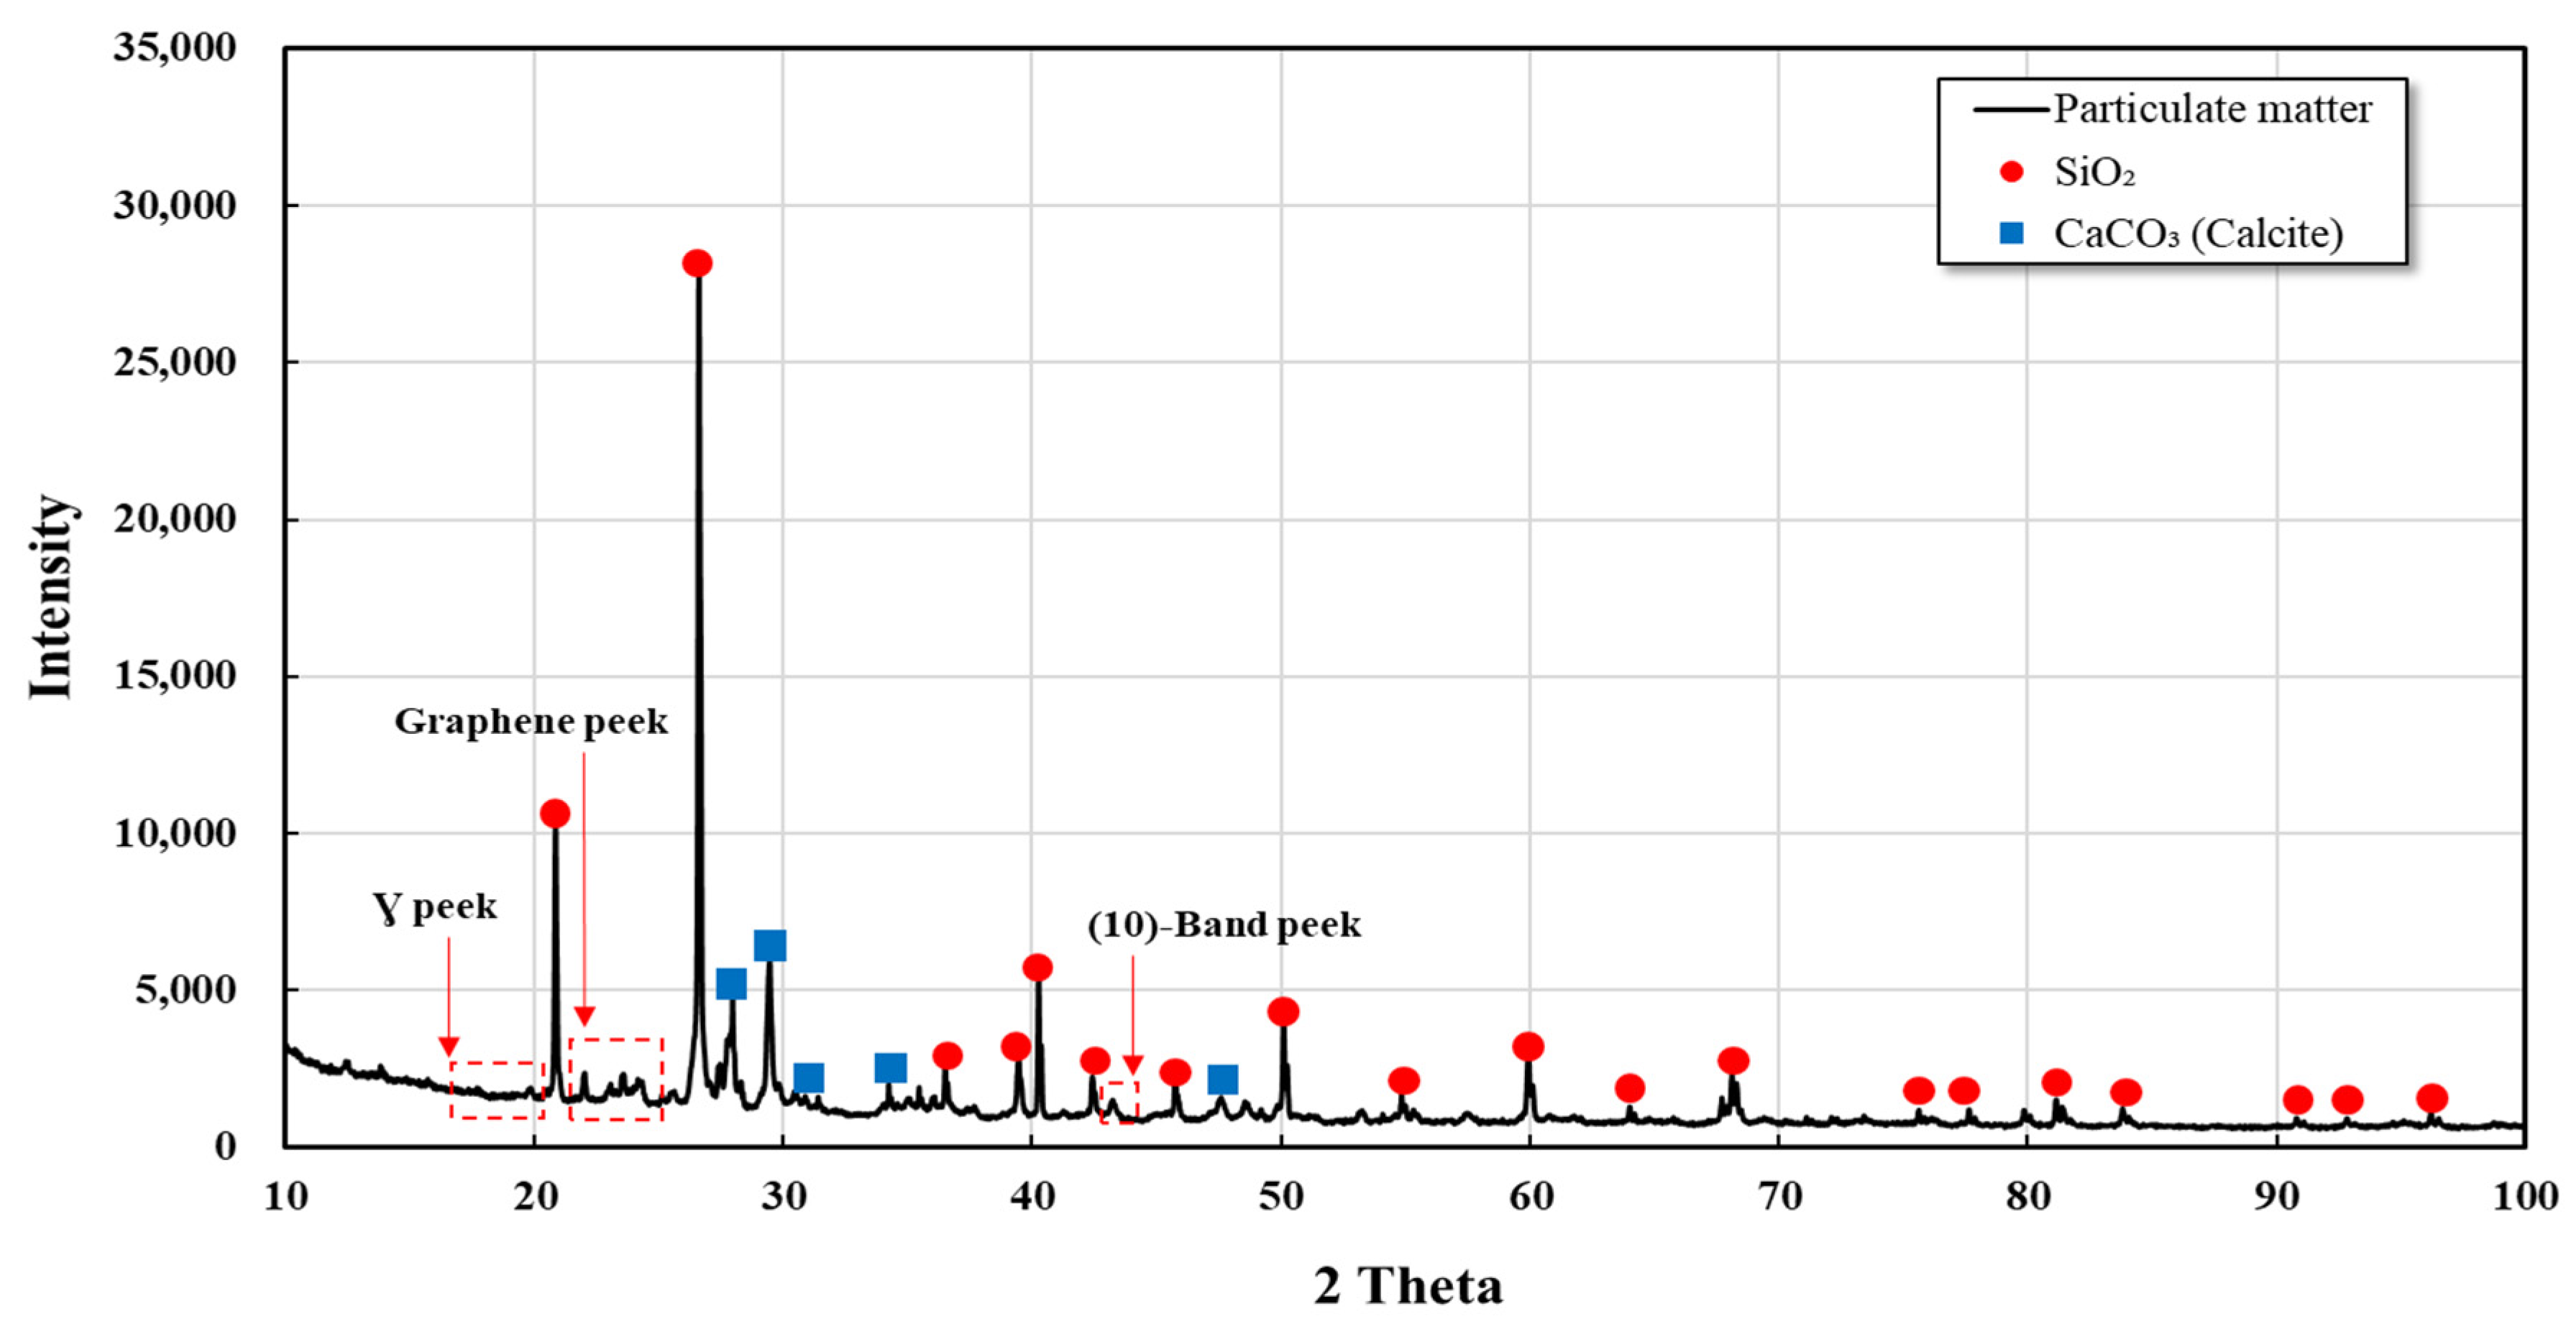
3.2.4. XRD Analysis
4. Conclusions
Author Contributions
Funding
Institutional Review Board Statement
Informed Consent Statement
Data Availability Statement
Conflicts of Interest
References
- EPA. Particulate Matter (PM) Pollution. 2021. Available online: https://www.epa.gov/pm-pollution (accessed on 17 January 2022).
- Ministry of Environment of Korea. Fugitive Dust Management Manual. Available online: www.me.go.kr (accessed on 12 January 2022).
- Loomis, D.; Grosse, Y.; Lauby-Secretan, B.; El Ghissassi, F.; Bouvard, V.; Benbrahim-Tallaa, L.; Guha, N.; Baan, R.; Mattock, H.; Straif, K. The carcinogenicity of outdoor air pollution. Lancet Oncol. 2013, 14, 1262–1263. [Google Scholar] [CrossRef]
- Pope, C.A., III; Dockery, D.W. Health Effects of Fine Particulate Air Pollution: Lines that Connect. J. Air Waste Manag. Assoc. 2006, 56, 709–742. [Google Scholar] [CrossRef] [PubMed]
- Brunekreef, B.; Forsberg, B. Epidemiological evidence of effects of coarse airborne particles on health. Eur. Respir. J. 2005, 26, 309–318. [Google Scholar] [CrossRef] [PubMed]
- Heal, M.R.; Kumar, P.; Harrison, R.M. Particles, air quality, policy and health. Chem. Soc. Rev. 2012, 41, 6606–6630. [Google Scholar] [CrossRef] [PubMed] [Green Version]
- Brown, J.S.; Gordon, T.; Price, O.; Asgharian, B. Thoracic and respirable particle definitions for human health risk assessment. Part. Fibre Toxicol. 2013, 10, 12. [Google Scholar] [CrossRef] [Green Version]
- Thén, W.; Salma, I. Particle Number Concentration: A Case Study for Air Quality Monitoring. Atmosphere 2022, 13, 570. [Google Scholar] [CrossRef]
- Kang, C.-H.; Hu, C.-G. Characteristics of the Number and the Mass Concentrations and the Elemental Compositions of PM10in Jeju Area. J. Environ. Sci. 2014, 23, 447–457. [Google Scholar] [CrossRef] [Green Version]
- Zhang, R.; Han, Z.; Shen, Z.; Cao, J. Continuous measurement of number concentrations and elemental composition of aerosol particles for a dust storm event in Beijing. Adv. Atmos. Sci. 2008, 25, 89–95. [Google Scholar] [CrossRef]
- Na, D.J.; Lee, B.K. A study on the characteristics of PM10 and air-borne metallic elements produced in the industrial city. J. Korean Soc. Atmos. Environ. 2000, 16, 23–35. [Google Scholar]
- Cheriyan, D.; Choi, J.-H. A review of research on particulate matter pollution in the construction industry. J. Clean. Prod. 2020, 254, 120077. [Google Scholar] [CrossRef]
- Choi, J. Monitoring Particulate Matter Emission from Construction Activity Which Causes Long-Term Health Issues and Premature Deaths; CIB World Building Congress: Hong Kong, SAR, China, 2019; p. 8. [Google Scholar]
- Li, C.Z.; Zhao, Y.; Xu, X. Investigation of dust exposure and control practices in the construction industry: Implications for cleaner production. J. Clean. Prod. 2019, 227, 810–824. [Google Scholar] [CrossRef]
- National Center for Fine Dust Information of Korea. Statistics on Air Pollutant Emissions in 2018. Available online: www.air.go.kr (accessed on 17 January 2022).
- Faber, P.; Drewnick, F.; Borrmann, S. Aerosol particle and trace gas emissions from earthworks, road construction, and asphalt paving in Germany: Emission factors and influence on local air quality. Atmos. Environ. 2015, 122, 662–671. [Google Scholar] [CrossRef]
- Air Quality Expert Group (AQEG)-Defra. Non-Exhaust Emissions from Road Traffic. 2019. Available online: https://uk-air.defra.gov.uk/ (accessed on 15 January 2022).
- Jancsek-Turóczi, B.; Hoffer, A.; Nyírő-Kósa, I.; Gelencsér, A. Sampling and characterization of resuspended and respirable road dust. J. Aerosol Sci. 2013, 65, 69–76. [Google Scholar] [CrossRef] [Green Version]
- Tervahattu, H.; Kupiainen, K.J.; Räisänen, M.; Mäkelä, T.; Hillamo, R. Generation of urban road dust from anti-skid and asphalt concrete aggregates. J. Hazard. Mater. 2006, 132, 39–46. [Google Scholar] [CrossRef] [PubMed]
- Kumar, P.; Robins, A.; Vardoulakis, S.; Britter, R. A review of the characteristics of nanoparticles in the urban atmosphere and the prospects for developing regulatory controls. Atmos. Environ. 2010, 44, 5035–5052. [Google Scholar] [CrossRef] [Green Version]
- Charron, A.; Harrison, R.M. Primary particle formation from vehicle emissions during exhaust dilution in the roadside atmosphere. Atmos. Environ. 2003, 37, 4109–4119. [Google Scholar] [CrossRef]
- Dall’Osto, M.; Thorpe, A.; Beddows, D.C.S.; Harrison, R.M.; Barlow, J.F.; Dunbar, T.; Williams, P.I.; Coe, H. Remarkable dynamics of nanoparticles in the urban atmosphere. Atmos. Chem. Phys. 2011, 11, 6623–6637. [Google Scholar] [CrossRef] [Green Version]
- Han, S.; Youn, J.-S.; Jung, Y.-W. Characterization of PM10 and PM2.5 source profiles for resuspended road dust collected using mobile sampling methodology. Atmos. Environ. 2011, 45, 3343–3351. [Google Scholar] [CrossRef]
- Abu-Allaban, M.; Gillies, J.A.; Gertler, A.W.; Clayton, R.; Proffitt, D. Tailpipe, resuspended road dust, and brake-wear emission factors from on-road vehicles. Atmos. Environ. 2003, 37, 5283–5293. [Google Scholar] [CrossRef]
- National Institute for Occupational Safety and Health (NIOSH). In Depth Survey of Dust Control Technology for Asphalt Milling; National Institute for Occupational Safety and Health (NIOSH): Cincinnati, OH, USA, 2007.
- Freund, A.; Zuckerman, N.; Baum, L.; Milek, D. Submicron particle monitoring of paving and related road construction operations. J. Occup. Environ. Hyg. 2012, 9, 298–307. [Google Scholar] [CrossRef]
- Han, S.H.; Yang, S.L.; Lee, J.W.; Baek, C.M. Evaluation of fugitive dust emission generated by the construction process of pavement excavation–restoration through the field test. J. Korean Soc. Road Eng. 2020, 22, 61–68. [Google Scholar] [CrossRef]
- Elihn, K.; Ulvestad, B.; Hetland, S.; Wallén, A.; Randem, B.G. Exposure to Ultrafine Particles in Asphalt Work. J. Occup. Environ. Hyg. 2008, 5, 771–779. [Google Scholar] [CrossRef] [PubMed]
- Azarmi, F.; Kumar, P.; Mulheron, M. The exposure to coarse, fine and ultrafine particle emissions from concrete mixing, drilling and cutting activities. J. Hazard. Mater. 2014, 279, 268–279. [Google Scholar] [CrossRef] [PubMed] [Green Version]
- Akbar-Khanzadeh, F.; Milz, S.; Ames, A.; Susi, P.P.; Bisesi, M.; Khuder, S.A.; Akbar-Khanzadeh, M. Crystalline Silica Dust and Respirable Particulate Matter During Indoor Concrete Grinding—Wet Grinding and Ventilated Grinding Compared with Uncontrolled Conventional Grinding. J. Occup. Environ. Hyg. 2007, 4, 770–779. [Google Scholar] [CrossRef]
- Yang, J.H.; Tae, S.H.; Lee, K.S. Basic Study on the Measurement of Finedust Based on Light Scattering Method in Construction Site. In Proceedings of the Annual Conference of the Architectural Institute of Korea, Architectural Institute of Korea, Seoul, Republic of Korea, 20–26 September 2019; Volume 39, pp. 476–479. [Google Scholar]
- Im, S.; Yu, J. Analysis of fugitive dust measurement technique for fugitive dust management in construction site. Proc. Korean Inst. Archit. Spring 2018, 38, 672–673. [Google Scholar]
- Choi, S.I.; An, J.; Jo, Y.M. Review of analysis principle of fine dust. KCI News 2018, 21, 16–23. [Google Scholar]
- Singh, G.K.; Choudhary, V.; Gupta, T.; Paul, D. Investigation of size distribution and mass characteristics of ambient aerosols and their combustion sources during post-monsoon in northern India. Atmos. Pollut. Res. 2019, 11, 170–178. [Google Scholar] [CrossRef]
- EPA. AP 42, Air Emission Factors and Quantification. Miscellaneous Sources, 13.2.1 Paved Roads. Available online: www.epa.gov/air-emissions-factors-and-quantification/ap-42-fifth-edition-volume-i-chapter-13-miscellaneous-0 (accessed on 17 January 2022).
- Pachauri, T.; Singla, V.; Satsangi, A.; Lakhani, A.; Kumari, K.M. SEM-EDX Characterization of Individual Coarse Particles in Agra, India. Aerosol Air Qual. Res. 2013, 13, 523–536. [Google Scholar] [CrossRef]
- Satsangi, P.G.; Yadav, S. Characterization of PM2. 5 by X-ray diffraction and scanning electron microscopy–energy dispersive spectrometer: Its relation with different pollution sources. Int. J. Environ. Sci. Technol. 2014, 11, 217–232. [Google Scholar] [CrossRef] [Green Version]
- Byeon, S.-H.; Willis, R.; Peters, T.M. Chemical Characterization of Outdoor and Subway Fine (PM2.5–1.0) and Coarse (PM10–2.5) Particulate Matter in Seoul (Korea) by Computer-Controlled Scanning Electron Microscopy (CCSEM). Int. J. Environ. Res. Public Health 2015, 12, 2090–2104. [Google Scholar] [CrossRef] [Green Version]
- Lough, G.C.; Schauer, J.J.; Park, J.-S.; Shafer, M.M.; DeMinter, J.T.; Weinstein, J.P. Emissions of Metals Associated with Motor Vehicle Roadways. Environ. Sci. Technol. 2004, 39, 826–836. [Google Scholar] [CrossRef] [PubMed]
- Siddiqui, M.N.; Ali, M.F.; Shirokoff, J. Use of X-ray diffraction in assessing the aging pattern of asphalt fractions. Fuel 2002, 81, 51–58. [Google Scholar] [CrossRef]
- AlHumaidan, F.S.; Hauser, A.; Rana, M.S.; Lababidi, H.M.; Behbehani, M. Changes in asphaltene structure during thermal cracking of residual oils: XRD study. Fuel 2015, 150, 558–564. [Google Scholar] [CrossRef]


| Data Type | Activity Type | Instrument Used | Size Range (μm) | Location | Source |
|---|---|---|---|---|---|
| PMC | Asphalt milling | Sampling pumps | 0.1–10 | Outdoor | [25] |
| PNC | Road works | CPC | 0.02–1 | Outdoor | [26] |
| PMC, PNC | Concrete mixing, drilling, cutting | DMA, OPC | 0.005–20 | Indoor | [29] |
| PMC | Concrete grinding | Sampling pumps | 0.1–10 | Indoor | [30] |
| PMC, PNC | Asphalt works | SMPS, CPC, OPC, OPS | 0.014–10 | Outdoor | [28] |
| PMC | Asphalt works | OPC | 0.3–35 | Outdoor | [27] |
| Characteristics | Portability | Real Time | Accuracy | |
|---|---|---|---|---|
| Method | ||||
| Gravimetric analysis | X | X | ◎ | |
| Beta-ray absorption | X | X | ◎ | |
| Light scattering | ○ | ○ | ○ | |
| Digital image information analysis | ○ | ○ | △ | |
| Test ID | Data Type | Activity Type | Measuring Equipment | Position from Source (m) | Inlet Height (m) | Number of Sections | Weather Conditions | ||
|---|---|---|---|---|---|---|---|---|---|
| Temp (°C) | Winds (m/s) | Humidity (%) | |||||||
| 1 | PMC | Asphalt road-cutting, breaking, removal, excavation, restoration | OPC | 2, 4.25 | 1.5 | 6 | 18.5 | 3.3 | 62.4 |
| 2 | PMC | OPC | 2 | 1.5 | 2 | 16.2 | 2.7 | 53.9 | |
| Test ID | Depth (mm) | Length (mm) | Condition | Cut Area (m2) |
|---|---|---|---|---|
| 1 | 50 | 800 | Dry | 0.04 |
| 2 | 70 | 800 | Dry | 0.056 |
| 3 | 100 | 800 | Dry | 0.08 |
| 4 | 100 | 800 | Wet | 0.08 |
| Test ID | Depth (mm) | PM10 (μg/m3) | PM2.5 (μg/m3) | PM1 (μg/m3) |
|---|---|---|---|---|
| 1 (dry) | 50 | 38,069.43 | 4669.73 | 588.71 |
| 2 (dry) | 70 | 24,894.83 | 3139.14 | 369.41 |
| 3 (dry) | 100 | 18,475.79 | 1455.27 | 147.91 |
| 4 (wet) | 100 | 1713.62 | 427.14 | 67.48 |
| Test ID | PM of Internal Filter (g) | PM of External Filter (g) | Total PM (g) |
|---|---|---|---|
| 1 (dry) | 5.31 | 17.53 | 22.84 |
| 2 (dry) | 1.38 | 15.27 | 16.65 |
| 3 (dry) | 1.34 | 14.88 | 16.22 |
| 4 (wet) | 0.23 | 0.88 | 1.11 |
| Test ID | Collected PM (g) | Silt (g) | Cut Area (m2) | sL (g/m2) |
|---|---|---|---|---|
| 1 (dry) | 200 | 35.19 | 0.04 | 879.79 |
| 2 (dry) | 323 | 64.31 | 0.056 | 1148.39 |
| 3 (dry) | 442 | 96.97 | 0.08 | 1212.14 |
| 4 (wet) | 560 | 133.08 | 0.08 | 1663.44 |
| Sample | Weight (%) | ||||||||||
|---|---|---|---|---|---|---|---|---|---|---|---|
| C | O | Na | Mg | Al | Si | S | K | Ca | Ti | Fe | |
| Type 1 | 30.2 | 35.6 | 0.96 | 0.53 | 3.18 | 15.8 | 0.48 | 1.16 | 4.9 | 0.7 | 6.49 |
| Type 2 | 6.46 | 49.6 | 2.88 | - | 8.43 | 27.9 | - | 0.73 | 3.20 | - | 0.80 |
| Type 3 | 12.9 | 39.4 | 2.66 | 6.25 | 10.9 | 15.4 | 0.28 | 0.62 | 5.97 | 0.4 | 5.22 |
Disclaimer/Publisher’s Note: The statements, opinions and data contained in all publications are solely those of the individual author(s) and contributor(s) and not of MDPI and/or the editor(s). MDPI and/or the editor(s) disclaim responsibility for any injury to people or property resulting from any ideas, methods, instructions or products referred to in the content. |
© 2022 by the authors. Licensee MDPI, Basel, Switzerland. This article is an open access article distributed under the terms and conditions of the Creative Commons Attribution (CC BY) license (https://creativecommons.org/licenses/by/4.0/).
Share and Cite
Han, S.; Lee, J.; Baek, C. Evaluation of Emission Characteristics and Microstructure of Particulate Matters from Excavation and Restoration Work on Asphalt Concrete Pavement. Appl. Sci. 2023, 13, 323. https://doi.org/10.3390/app13010323
Han S, Lee J, Baek C. Evaluation of Emission Characteristics and Microstructure of Particulate Matters from Excavation and Restoration Work on Asphalt Concrete Pavement. Applied Sciences. 2023; 13(1):323. https://doi.org/10.3390/app13010323
Chicago/Turabian StyleHan, Soohyun, Jongwon Lee, and Cheolmin Baek. 2023. "Evaluation of Emission Characteristics and Microstructure of Particulate Matters from Excavation and Restoration Work on Asphalt Concrete Pavement" Applied Sciences 13, no. 1: 323. https://doi.org/10.3390/app13010323