1. Introduction
The rapid urbanization of cities necessitates the availability of updated information regarding various urban features that can assist urban planning tasks, such as predicting population growth, analyzing park space, surveying the water supply, identifying transportation patterns, recognizing food supply demands, analyzing the impact of land use, and others. Counting and geotagging the number of particular features in a given urban area or city is crucial when making decisions for government policies and administration. Urban planning officials and stakeholders often lack updated information regarding such features and that can potentially lead to wrong decisions. The traditional methods used for counting and geotagging features such as trees, trash bins, street lamps, retail shops, and others, in most cases include manual inspection and consequently are time-consuming, costly, and labor-intensive. Therefore, there is an increasing need for an automated approach to replace conventional visual inspection.
Recently, following the advent of deep learning (DL) and the availability of large datasets, many new models and approaches have emerged. These new methods have proven promising to revolutionize the way particular problems are tackled. Related literature keeps expanding with research studies that use deep learning to achieve better results. Specifically, computer vision (CV) is a domain that showcases substantial progress in recent years and a lot of research effort is directed toward CV applications. convolutional neural network (CNN), one of the basic building blocks of CV models, outperform many of their traditional machine learning (ML) counterparts. Consequently, CV tasks, such as object detection, object tracking, and semantic or instance segmentation have gained significant interest. The field has reached a state where powerful models and datasets are publicly available and even used for commercial and business applications, such as self-driving cars [
1] and healthcare [
2].
In the digital era, many urban research studies are trying to integrate methods that quickly process and analyze the complexity of urban dynamics and fast-paced surrounding changes. Machine learning and deep learning approaches are suitable tools for complex task automation for various urban elements [
3]. For example, many works incorporate DL models to overcome specific urban problems, such as waste management [
4], urban environment quality [
5], structure damage detection [
6], traffic prediction [
7], and others.
In this work, we present StreetScouting, a platform that utilizes powerful deep learning and computer vision techniques to automatically detect and extract urban features in cities. StreetScouting is a fully featured platform and its main task is to process GPS and video data of a particular region and output visualizations and data regarding various objects and urban features. Objects, such as trees, trash and recycle bins, street light poles and lamps, vehicles, traffic lights, traffic signs, and other features, such as the width of the road or the existence of sidewalks are some of the features that can be detected and localized by the platform. To achieve this, StreetScouting incorporates many state-of-the-art computer vision approaches for object detection, semantic segmentation, multiple object tracking, depth estimation, and others. Ultimately, StreetScouting aspires to be an extensible platform that can automatically capture and extract multiple visual features from urban streets and progressively eliminate the need for visual inspection.
StreetScouting is a web application that provides an organized and easy-to-use environment that can be utilized by urban planning administrators and policymakers, municipal offices, geoinformatics companies, and other commercial organizations. StreetScouting uses street data as input and generates geotagged feature information that can be further utilized according to user needs.
StreetScouting was developed in the context of the GRUBLES (georeferenced urban landscape and socioeconomic indicators using machine vision) project (
https://GRUBLES.datascouting.com/, accessed date: 1 December 2022). The main purpose of the project is to extract geotagged features in urban areas with the use of machine learning methods. StreetScouting is responsible for detecting and tracking those features and transforming them into primary indicators of a region. Primary indicators are a set of data that contain geolocation information regarding the number of trees, street lights, retail shops, bins, cars, and others. GRUBLES aspires to utilize primary indicators in order to perform a statistical study to find correlations with some socioeconomic indicators of the region. Publicly available data and statistics are used with StreetScouting data in order to infer indicators, such as financial status, lighting quality, green areas, traffic, and waste management. The final goal is to utilize StreetScouting outcomes and build statistical models that can infer many of these indicators for a particular urban region.
The contributions of this work are therefore as follows:
Design of data acquisition and preprocessing paradigm for high-rate street-level photography data, beyond the use of Google Street View.
A deep learning-based computational workflow for automatic urban feature measurements, including the novel use of state-of-the-art object tracking and localization components.
System architecture and design of the StreetScouting end-to-end web application.
The sequence of the article is as follows. We first present some related studies, followed by a description of the data and DL and ML methods that are used by StreetScouting. Then we showcase the platform’s architecture and the user interface. We later demonstrate some quantitative and qualitative results and finally, we discuss the usage, limitations, and future of StreetScouting and we conclude the findings after reviewing the functionalities of the platform.
2. Related Work
Modern cities face several challenges and urban planners must develop urban forms that address them. Solutions to this problem based on ML and DL algorithms are now possible [
3], thanks to the large volumes of data generated by new information and communication technologies (smartphones, GIS, IoT, sensors, etc.) and the availability of high computational power. For instance, there are works that estimate urban growth using ML approaches [
8], predict building heights, based only on open-access geospatial data on urban forms, such as building footprints and street networks [
9], predict building-level waste generation [
4], access the urban environment quality [
5], detect structure damage [
6], predict traffic [
7] and others.
The manual analysis of street-level photography has been extensively explored as an efficient strategy for measuring urban characteristics linked with demographic or socioeconomic indicators, e.g., with respect to health-related behaviors [
10], obesity [
11], or pedestrian safety [
12]. These “audit tools” allow researchers to quantify characteristics at the neighborhood level without the need to actually visit each location.
Although initial attempts to automate this process were not effective enough to replace manual processing (e.g., [
13]), the advent of effective, deep learning-based computer vision methods has enabled the fully automated extraction of urban indicators from street images [
14]. For example in [
15], the authors use a mask regional convolutional neural network (Mask R-CNN) to detect and locate trees from street images and use a monocular depth estimation method to estimate precise tree location. Another study [
16] uses a faster region-convolutional neural network (Faster R-CNN) to measure street cleanliness from images that are captured by high-resolution cameras installed on vehicles. Similarly in [
17], the authors use a segmentation and classification workflow to measure the presence of unhealthy food advertisements in Liverpool, UK.
A significant body of work goes beyond the measurement of individual urban features, to the use of computer vision for estimating demographic and socioeconomic indicators. In a large-scale study in the USA, the authors of [
18] propose to automatically analyze the make and model of cars in street-level images to successfully estimate the demographic markup of urban neighborhoods. In [
19], the authors leverage deep multiple-instance learning to eliminate the requirements for manually annotated data for the direct estimation of socioeconomic indicators from cars detected in street images. In that case, cars are detected using Faster-RCNN, and a deep learning model is used for the estimation of demographic indicators. In [
20], the authors use Siamese CNNs to analyze images of properties/buildings obtained from Google Street View to map gentrification over a 9-year period in Ottawa, Canada. Street-level imagery is also used as input to a multi-modal U-Net architecture in [
21], to measure income, overcrowding, and environmental deprivation in urban areas. Other examples include linking blue and green spaces with geriatric depression [
22], the estimation of infection incidence rate [
23], and the estimation of social, environmental, and health inequalities in major UK cities [
24].
Additionally, various platforms have been developed to assist in many urban challenges with the use of ML and DL techniques, such as improving the visitor experience in urban parks [
25], monitoring urban street lighting infrastructure [
26], classifying the type of the streets [
27], predicting parking spaces [
28], and urban mobility [
29].
The proposed StreetScouting platform extends these efforts by introducing the architecture and implementation details of an end-to-end deep learning-based automated urban feature extraction platform including:
High-rate data acquisition and pre-processing from a 360 camera. Most methods in the bibliography rely on Google Street View data, which are subject to license restrictions with respect to their use for urban feature measurement.
Object detection and privacy protection methods (license plates, faces). The relevant literature usually assumes that these issues have already been resolved but this is often not trivial.
Novel use of object tracking (to avoid duplicates across frames) and depth mapping for object location estimation.
A method for road/sidewalk segmentation/measurement.
A complete system architecture for the measurement and visualization of urban features.
3. Data and Methods
3.1. Data Collection
To detect objects, such as trees and lights, there is a need for visual data from the streets of a region or a city. As we mentioned in
Section 2, many similar works use Google Street View to retrieve street data. One major problem is that Google Street View has imposed restrictive permission for data usage that prevents the use of the service for our purposes. Additionally, some of the detection approaches that are described in the paper, work under the assumption that the input data are consecutive frames from a video, extracted under a specific frame per second (FPS) rate. Such data cannot be retrieved from Google Street View or similar services. Last but not least, Google Street View data are usually not updated, especially in smaller cities. Although updating such data with our data collection approach is costly, is still a good trade-off for the users of the platform that would otherwise perform the detection task using manual inspection methods.
As mentioned in
Section 1, StreetScouting can be used by urban planning administrators and policymakers, municipal offices, geoinformatics companies, and other commercial organizations. These users are responsible for collecting the street data according to their needs and the regions of interest. StreetScouting currently assumes that the data collection route is not overlapping. This assumption is made to deal with duplicate detections.
In the context of the GRUBLES project, the footage is captured by specific personnel from a geoinformatics company partner, that participates in the project. The Insta Pro2 camera (
https://store.insta360.com/product/Pro_2, accessed date 29 November 2022) is used to capture visual content. This camera consists of 6 ultra-wide-angle lenses for recording 360° scenes with a 200° coverage angle each, with the aim of stitching the images and reconstructing them into either a 2D or 3D panoramic scene. During data collection, this camera is mounted on a car and precise routes are designed beforehand. For wireless remote sensing, real-time camera control, and wireless pairing, an antenna is connected to the RF socket of the wireless access point and an application for survey devices with a user-friendly interface is utilized. The application provides options to control the number of frames per second (FPS), the size of the frame resolution as well as the real-time stitching of the panorama. In contrast to the short distance of the wireless local connection between the survey device and the camera, the signal received by the camera’s internal GPS unit is likely to show discontinuities leading to successive null or undefined GPS coordinates. This problem is solved by adding an external antenna to the appropriate socket of the camera. During the dataset collection process, the maximum suitable speed to avoid GPS distortions was set empirically to be 50 km/h, which is often the upper limit of speed in most urban areas.
Apart from the collected data using the Insta Pro2 camera, the personnel responsible for data collection may also input additional video data from conventional cameras. In this case, it is possible for the user to insert a GPS signal from an external device in GPX file format.
For the GRUBLES use case, the collected dataset amounts to approximately 10 h of footage from the city center of Thessaloniki in Greece.
3.2. Data Processing
The processing of the collected data from the Insta Pro2 camera is essential in order to retrieve multimedia and metadata in a proper format. As we mentioned in the previous paragraph, Insta Pro2 consists of 6 individual cameras. The footage from one camera is processed by the StreetScouting platform, and usually, the camera that is directed towards the front road is chosen. To process the multimedia stream, the video frames are extracted at a specific FPS which is set to 10 by default. Moreover, the frames are clipped to specific dimensions to eliminate any distortion from the ultra-wide lens. Then, the GPS data of the video is extracted from the metadata. The GPS data are synchronized with the extracted frames and any missing data are filled with linear interpolation. In the case of the video input from a conventional camera and external GPS data file in GPX format, the processing pipeline is similar. The only difference is that the frames are not clipped but resized to particular dimensions preserving the aspect ratio of the image.
3.3. Data Annotation
Deep learning models require annotated datasets in order to be trained in a supervised manner. Although a supervised learning [
30] paradigm can only be applied with the availability of large-scale datasets with annotations, fine-tuning pre-trained models is a less data-demanding task. For example, pre-trained object detectors on the COCO dataset [
31] can be easily fine-tuned to detect new classes with relatively few samples.
Motivated by this observation, we randomly sampled 1000 frames from the dataset that is described in the previous subsection and we manually annotate particular objects. The annotation involves objects that are not present in popular open-sourced datasets. More specifically, the objects that are annotated are trees, trash bins, recycling bins, street lighting poles, and shops. 5228 total object instances of interest are annotated, as seen in
Table 1. We refer to this dataset as the
GRUBLES objects dataset. The CVAT (
https://github.com/opencv/cvat, accessed date 29 November 2022) annotation tool is used for the labeling process. A useful feature of CVAT is the ability to export labeling data in a wide range of different formats, from YOLO to PascalVOC annotation formats.
Apart from the deep learning models utilized to detect urban features, the project needs to comply with the European General Data Protection Regulation (GDPR). The license plates of parked and bypassing vehicles and the faces of passing pedestrians are considered sensitive data and need to be detected and blurred. For the latter task, there is a variety of pre-trained DL models and open-source datasets. For the former task, there are no out-of-the-box models available, so we fine-tune a pre-trained model, as described in
Section 3.4.3. In order to evaluate the aforementioned model, we randomly sampled 105 images from the Stanford cars dataset [
32]. From this sample, 106 license plates were annotated; we refer to this dataset as the
license plate evaluation dataset.
3.4. Object Detection
StreetScouting platform is based on a couple of state-of-the-art object detection approaches in order to detect objects that are of a particular point of interest. More specifically, the Cascade R-CNN [
33], and the RetinaFace [
34] architectures are utilized. Cascade R-CNN is a multi-stage object detection architecture that consists of a sequence of detectors trained with increasing IoU thresholds, to be sequentially more selective against close false positives. RetinaFace is a robust single-stage face detector, which performs pixel-wise face localization on various scales of faces by taking advantage of extra supervision by facial landmark annotations, in combination with self-supervised multi-task learning, and is shown to achieve great results in the task of face detection. In this section, we describe the object detection models that are used from the platform.
3.4.1. GRUBLES Objects
The
GRUBLES objects dataset is a driving video dataset illustrating street scenes from central Thessaloniki. In order to train an object detection model to trace urban features from an image, a variety of diverse objects is annotated, as seen in
Table 1. A neural network based on the Cascade R-CNN architecture [
33], with a backbone pre-trained on the COCO dataset [
31] is used. In detail, the
GRUBLES objects dataset is split into training, validation, and testing subsets with a 0.8/0.1/0.1 split, respectively. The aforementioned neural network is fine-tuned using the training subset of the
GRUBLES objects dataset, the fine-tuning process is monitored utilizing the validation subset and the resulting model is evaluated exploiting the testing subset, as presented in
Section 5.
3.4.2. BDD100k Objects
The BDD100K dataset [
35] is the largest driving video dataset with over 100 K videos and 10 diverse tasks to evaluate. It possesses geographic, environmental, and weather diversity, which is useful for training models that cope with the rapid changes of a street scene. For the object detection task, the dataset consists of 10 object classes and contains bounding box annotations for 100K images from different scenarios, such as streets, tunnels, gas stations, parking lots, residential, and high-ways under diverse conditions at different times of day and night in real traffic urban street and is split into training, validation, and testing subsets with a 0.7/0.1/0.2 split, respectively. More specifically, a neural network based on the Cascade R-CNN architecture [
33] and pre-trained on the aforementioned training subset of the dataset is used to detect cars, trucks, buses, motorcycles, traffic lights, and traffic signs. The pre-trained model achieves 0.563 mAP on the validation and 0.534 mAP on the testing subset at 0.5 IoU threshold. These performance scores are quite satisfactory, as stated in public benchmarks (
https://github.com/SysCV/bdd100k-models/tree/main/det, date accessed 10 December 2022).
3.4.3. Licence Plates
For vehicle license plate detection, the analysis is comprised of two consecutive stages. Initially, a neural network based on the Cascade R-CNN architecture [
33] and pre-trained on the BDD100K dataset [
35] is used for vehicle detection. Indicative performance metrics for the pre-trained model are presented in
Section 3.4.2. Subsequently, the detected objects are cropped from the frame and form the input to the neural network used in the second stage of the process. More specifically, in order to detect vehicle license plates we fine-tune a neural network based on the Cascade R-CNN architecture. The neural network is fine-tuned within the PyTorch framework [
36] and the backbone part of the model is pre-trained on the COCO dataset [
31]. The license plates dataset that is utilized consists of 433 images of vehicles of different types accompanied by the corresponding license plate annotation files in PascalVOC format and is publicly available on MakeML (
https://makeml.app/datasets/cars-license-plates, date accessed 10 December 2022). In order to evaluate the model, we use the
license plate evaluation dataset described in
Section 3.3.
3.4.4. Faces
Regarding the detection of faces, we used a neural network based on the RetinaFace architecture [
34], pre-trained on the WIDER FACE dataset [
37]. This dataset consists of 32.203 images containing 393.703 annotated faces at different scales, poses, expressions, and illuminations and is split into training, validation, and testing subsets with a 0.4/0.1/0.5 split, respectively. Based on the detection rate of EdgeBox [
38], three levels of difficulty (i.e., easy, medium, and hard) are defined by incrementally incorporating hard samples. RetinaFace produces the best AP in all subsets of both validation and test sets, i.e., 0.969 (Easy), 0.961 (Medium) and 0.918 (Hard) for the validation set, and 0.963 (Easy), 0.956 (Medium), and 0.914 (Hard) for the test set.
3.5. Object Tracking
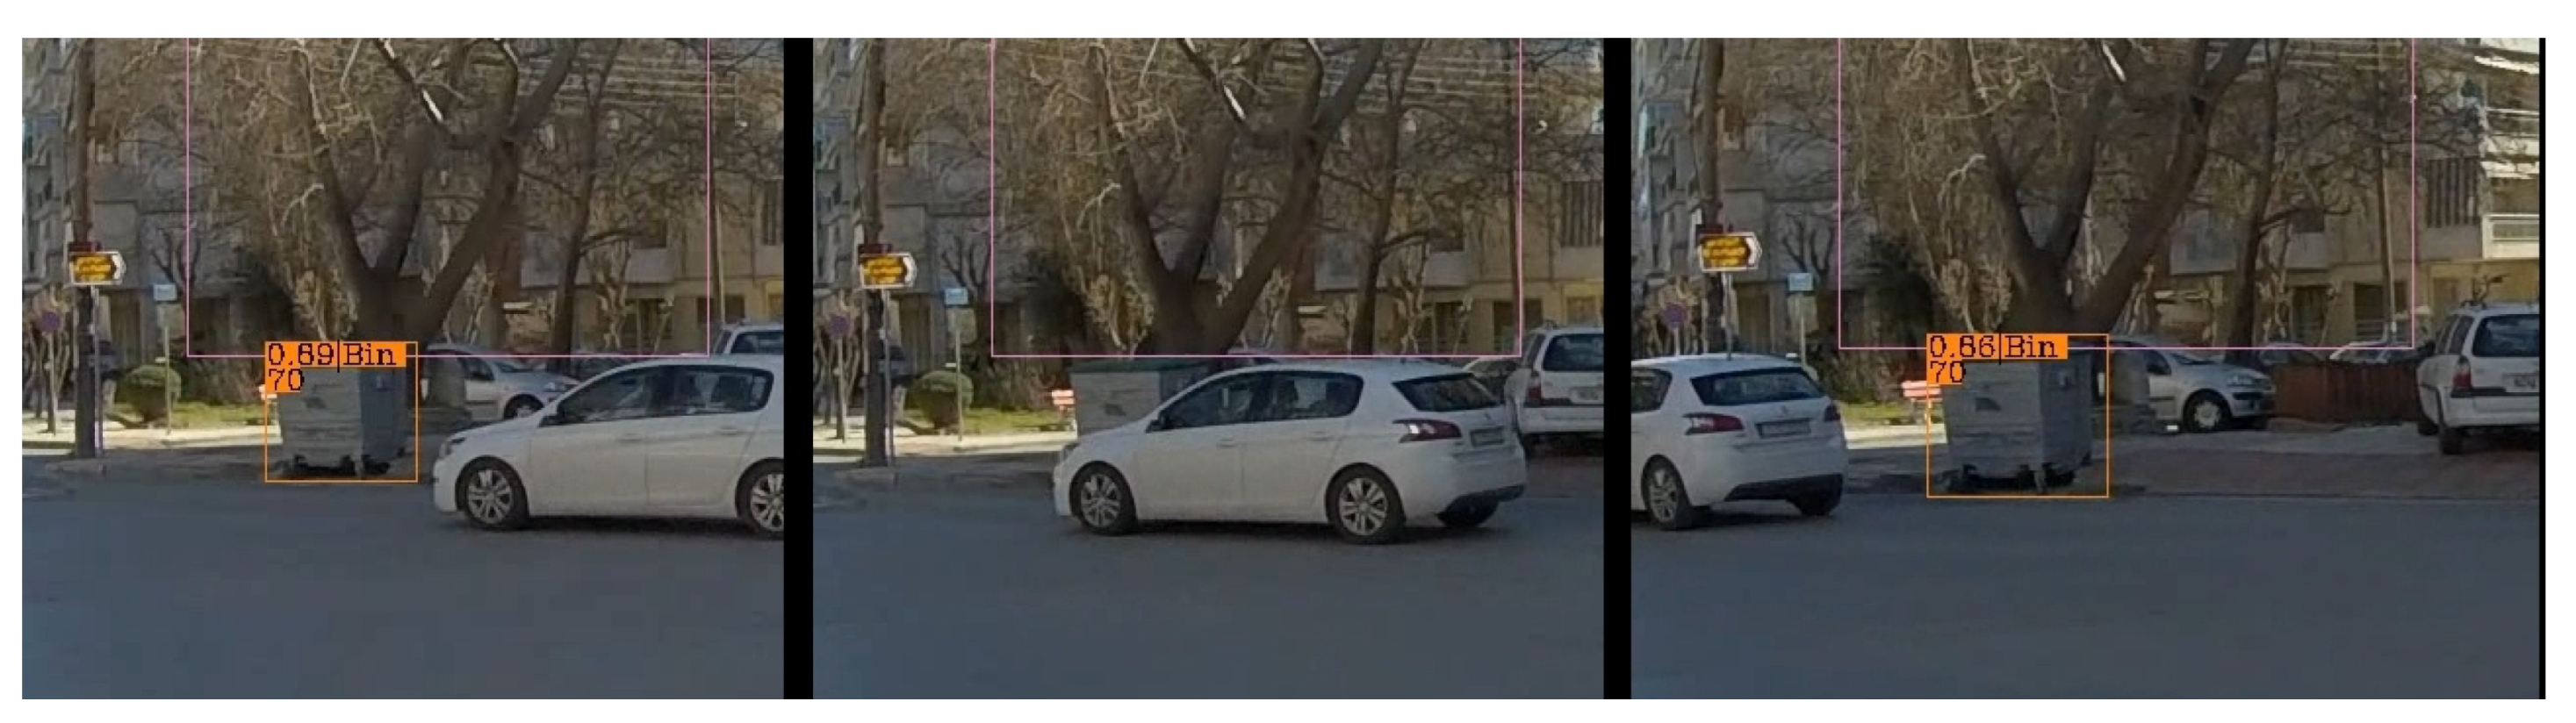
To detect unique objects in consecutive frames, an additional mechanism is required that tracks the objects as long as they are visible to the camera frame. This mechanism should account for object occlusion that frequently occurs in driving scenarios. For example,
Figure 1 shows three consecutive frames. In the first and third frames, there is a detection of a bin. An object tracking mechanism should be responsible for understanding that these two detections correspond to the same object and at the same time account for the brief object occlusion that is depicted in the second frame of
Figure 1.
Several candidate approaches are tested for the tracking task, such as DeepSort [
39], Tracktor [
40], and ByteTrack [
41]. The latter achieves 78.1, the best evaluation result in terms of the MOTA metric [
42] in MOT17 [
43] benchmark dataset. This method accounts for temporarily occluded objects and utilizes low-confidence detections to generate object tracks. These low-confidence detections are associated with previous or following confident predictions of the same object in a video stream to form these tracks. For example, if an object is far from the camera or partially occluded then is assigned with a low confidence detection, but as it comes closer or its features are fully visible then the new high confident detections are associated with the lower ones and the object is still identified. Another important feature of this method is that it can run very fast, especially if object detection inference data are available.
3.6. Object Location Estimation
Providing information regarding detected objects should be accompanied by accurate GPS coordinates. The position of the objects is important for many GIS systems and geoprocessing tools, especially when aiming to apply statistical modeling to specific regions of interest. For this task, we consider two different approaches, the first is focused on accuracy, and the second aims at low execution time. It is worth noting that location estimation in both approaches is still a rough estimation and is not suggested for applications that require precise location information.
For the first approach, we employ a depth estimation method that follows the object detection and tracking procedure. Depth estimation is the task of measuring the distance of each pixel relative to the camera. For this task, we use DNET [
44], which is a novel self-supervised monocular depth estimation pipeline that exploits densely connected hierarchical features to obtain more precise object-level depth inference, and uses dense geometrical constraints to eliminate the dependence on additional sensors or depth ground-truth to perform scale recovery, so that it is easier to transform relative to absolute depth. The data split of the KITTI [
45] dataset by Eigen et al. [
46] was used for training and evaluation purposes. DNET achieves 4.812 RMSE on the evaluation subset containing 697 test images.
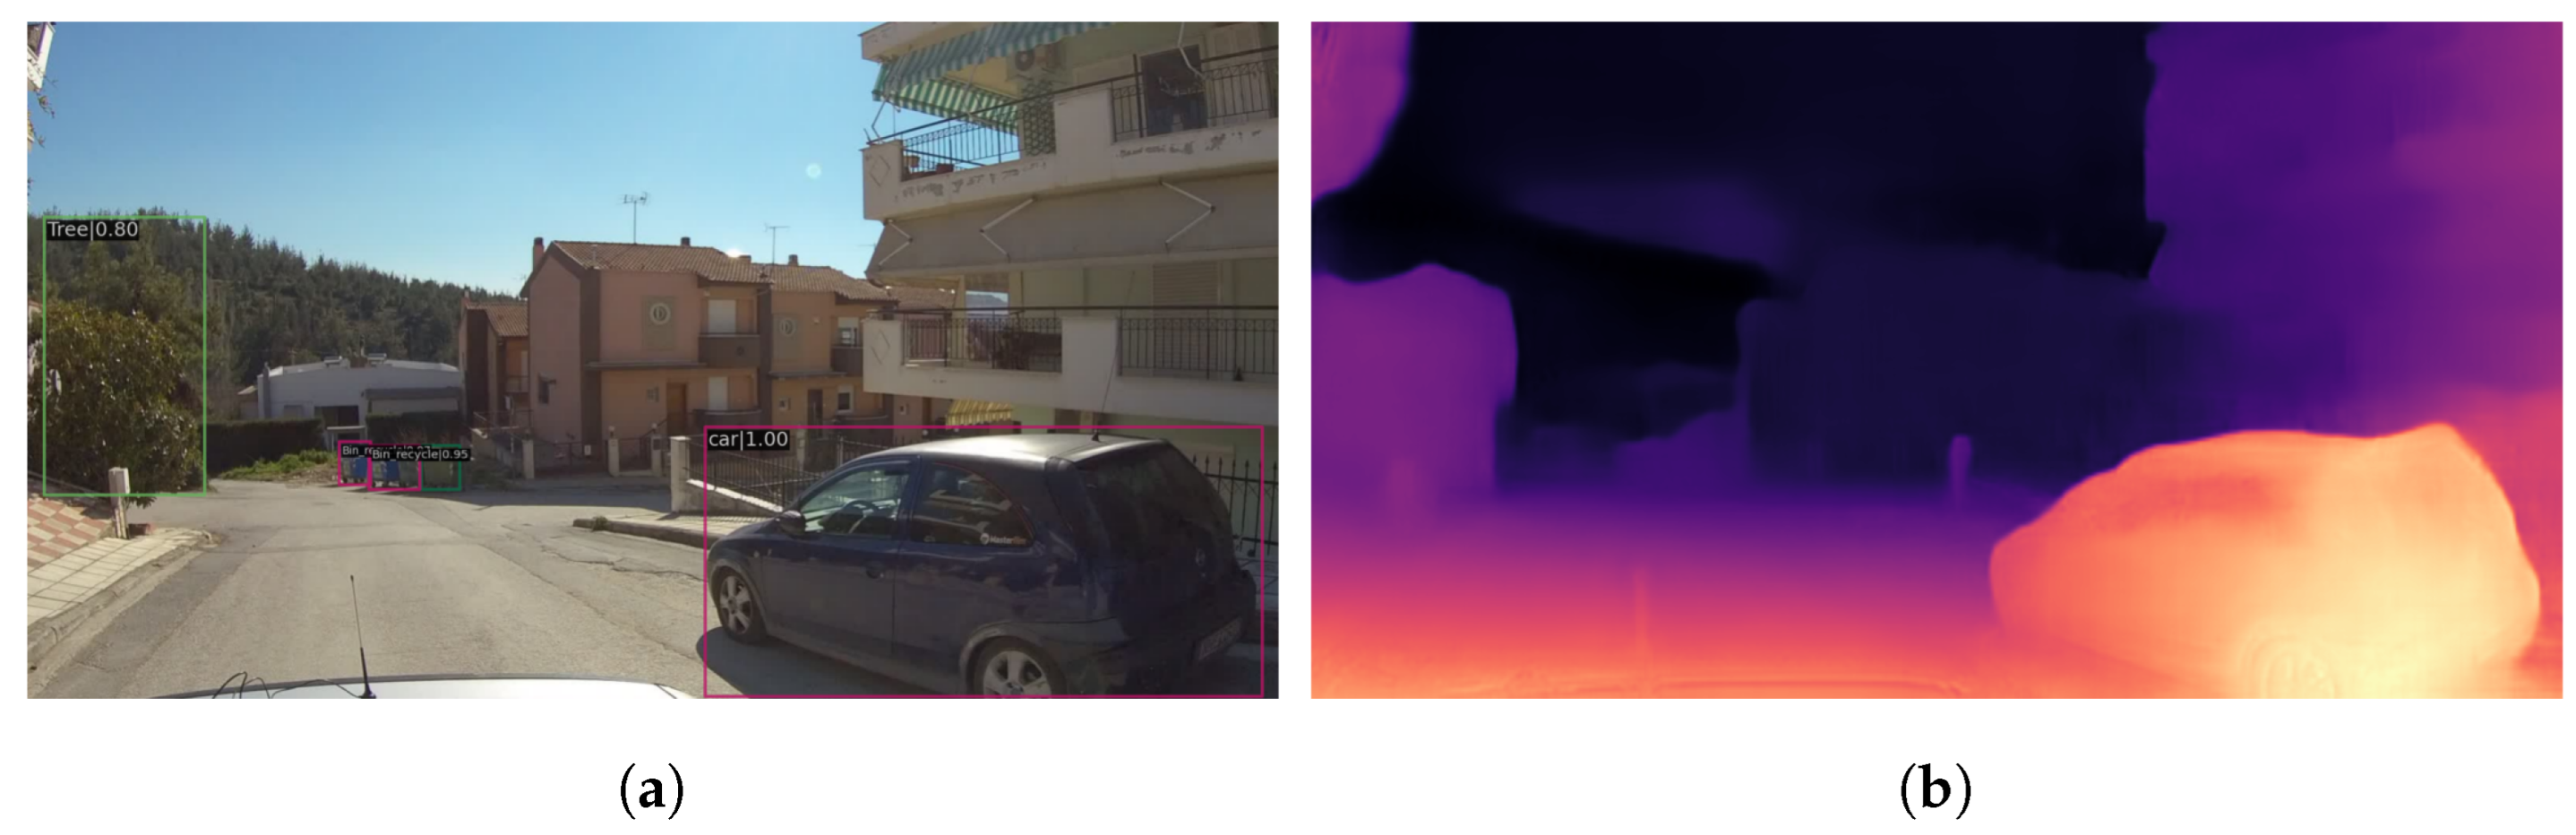
To estimate the location of an object with this approach, we first apply the object detection models to localize it in the frame (
Figure 2a) and then we calculate the distance of the object from the camera by applying the depth estimation model (
Figure 2b). Having the object’s bounding box and the respective pixel-level absolute depth in meters, we calculate the median depth value for every object localization to compute the distance [
47]. Knowing the object’s distance
d from the camera and the camera’s GPS
coordinates we can also infer the bearing
from the direction of the car and camera and the object localization in the frame. Let
R be the radius of Earth and
be the angular distance i.e.,
The resulting coordinates
in radians are given from the following formulas:
This procedure can be applied iteratively in every frame the object appears and then average the calculations for the final estimation. We refer to this approach as depth location estimation.
One disadvantage of this approach is that it is slow. For applications that do not require such a fine-grained location estimation approach, we also provide a simpler heuristic approach. This approach is based on the assumption that the final detection of an object occurs when the object is very close to the camera. Although this might not always be true, generally is an acceptable rule of thumb. Based on this, the GPS coordinates of the camera, when the last detection of the object occurs, are used as the final position of the object. We refer to this approach as fast location estimation. StreetScouting provides both location estimation methods. The first is preferred when accurate location estimation is required and the latter is used in scenarios that require faster processing sacrificing the location accuracy.
3.7. Road Width Estimation and Sidewalk Segmentation
The width of the roads in one region can be an important feature for many statistical analyses. StreetScouting supports the automatic road width estimation in each frame. Additionally, the existence of sidewalks is evaluated. A segmentation model is initially used to semantically segment the frame. Specifically, we use the
DeepLabv3+ [
48] segmentation model. This model combines a Spatial pyramid pooling module and encode–decoder structure to obtain the advantages of both methods. It also applies the depth-wise separable convolution to both atrous spatial pyramid pooling and decoder modules, resulting in a faster and stronger encoder–decoder network. This architecture is used pre-trained in the
cityscapes [
49] dataset.
Cityscapes is a dataset for semantic urban scene understanding and it contains several classes, such as the
BDD100k dataset. The effectiveness of the model is assessed on the test subsets of the PASCAL VOC 2012 [
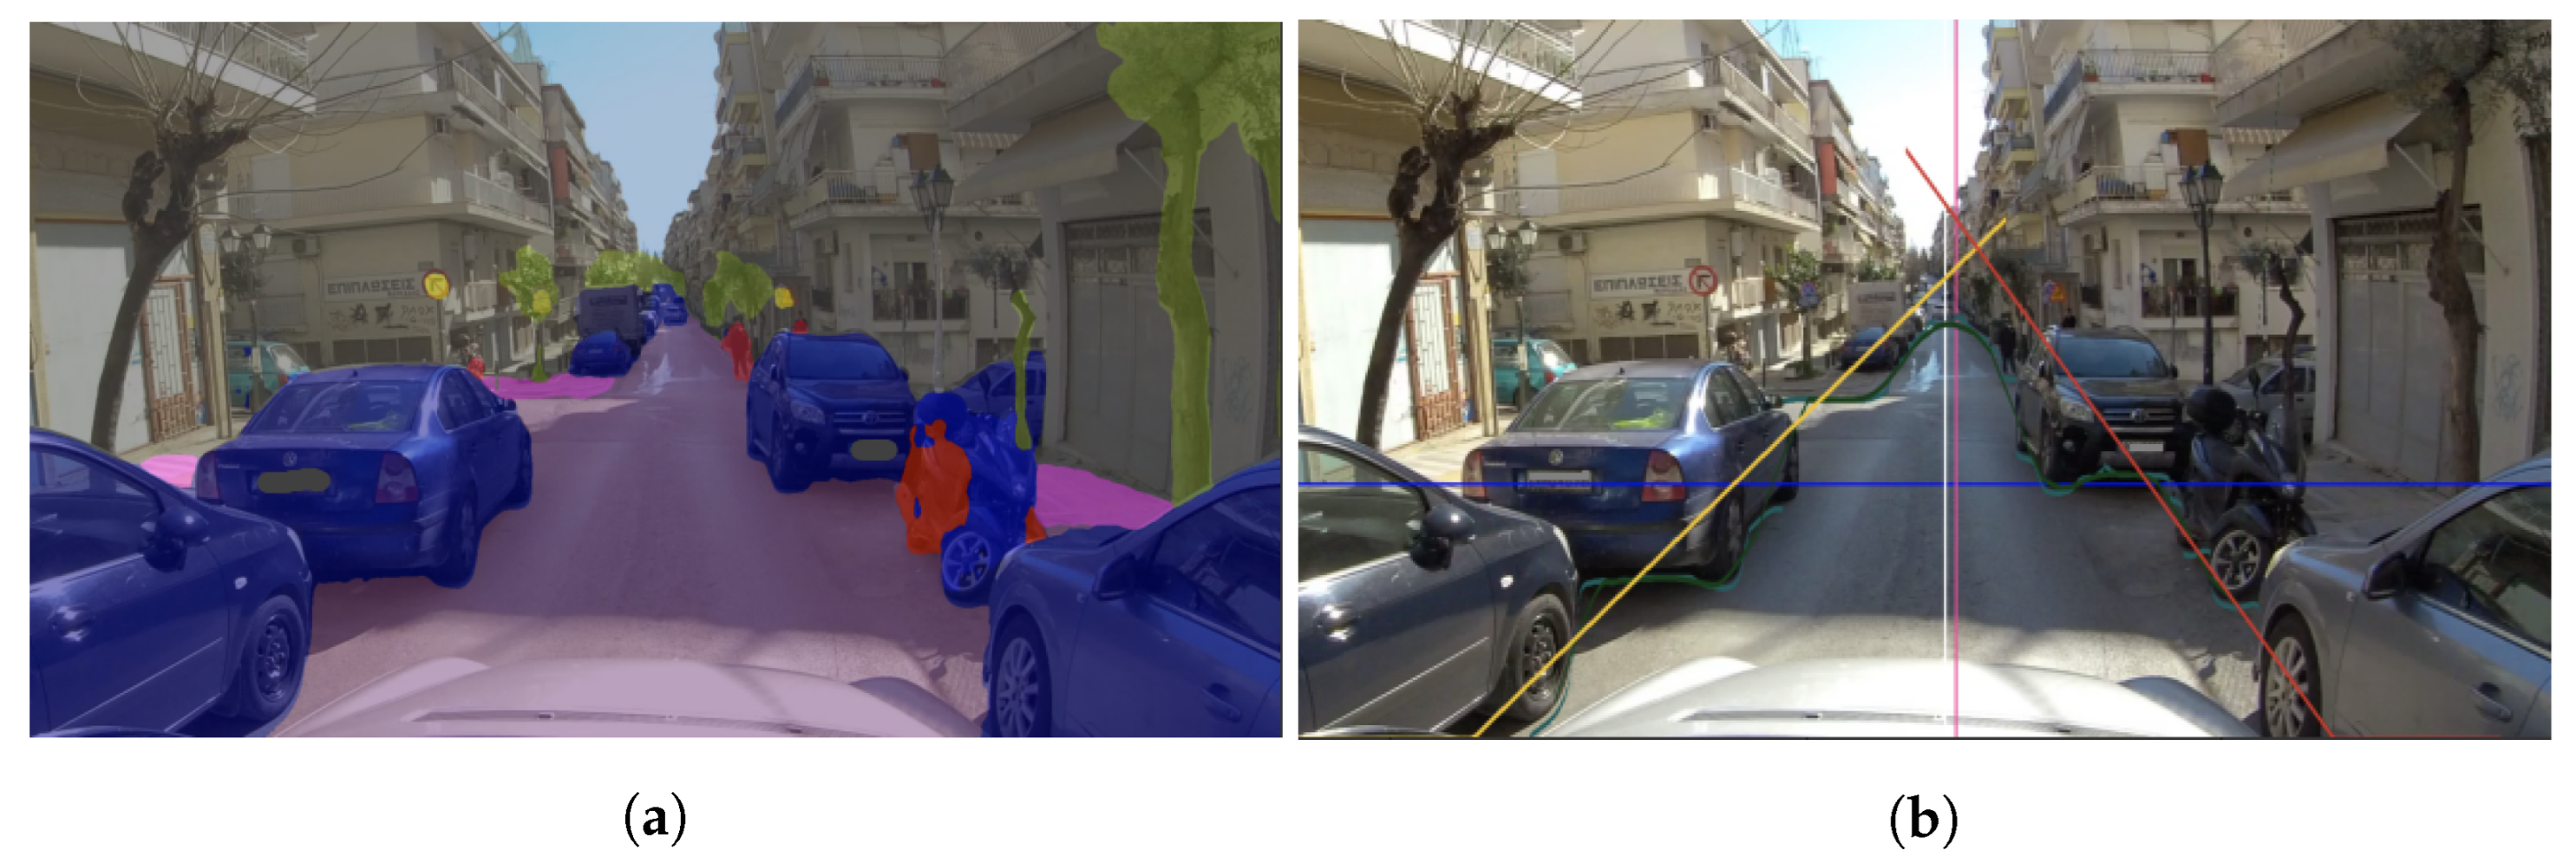
50] and Cityscapes datasets, accomplishing the performance of 0.89 and 0.821 mean IoU, respectively. An example outcome of the model is shown in
Figure 3a. Road and sidewalk classes are overlaid with purple and pink colors respectively. Using just this result we can infer whether there is a sidewalk in the frame.
To estimate the road width additional work have to be done which is depicted in
Figure 3b. First, we use the outline (green line) of the road mask. Then this outline is split into two signals from the center of the camera (white line). We calculate the first differences in these two signals to detect strictly increasing intervals for the left and strictly decreasing intervals for the right signal. With this approach, we estimate the intervals that potentially represent the road boundaries. To estimate the road boundaries we perform linear regression in the intervals of these two signals. The result is two fitted lines that represent the left (yellow line) and the right (red line) road boundaries.
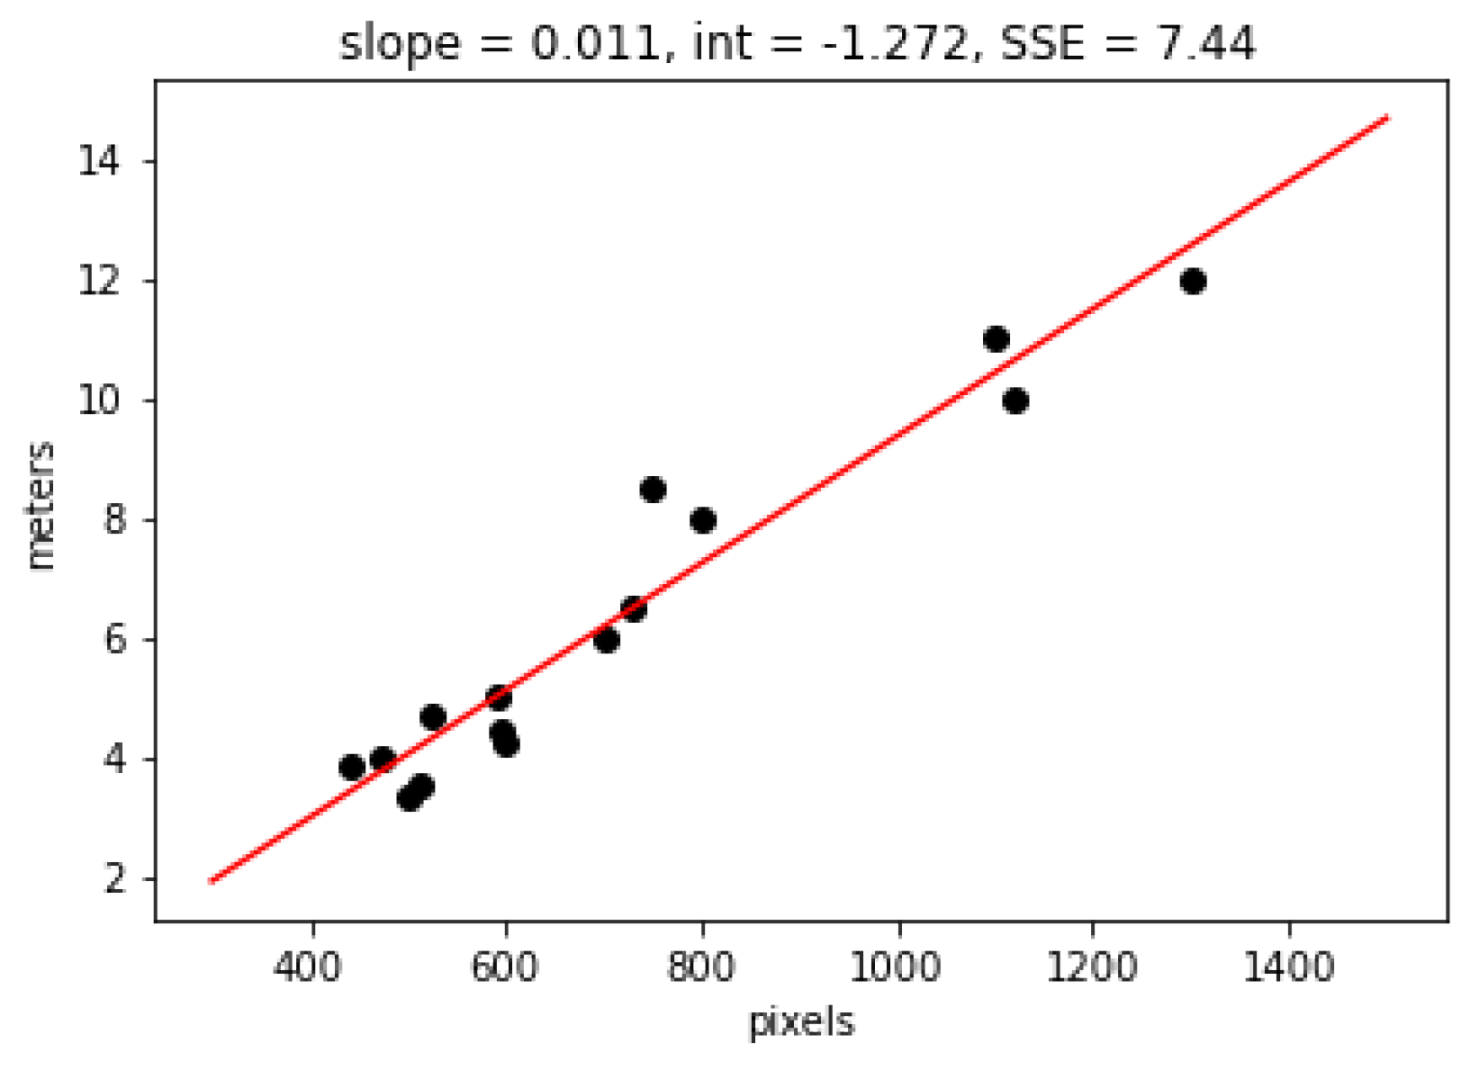
For the final estimation, we calculate the number of pixels among the two boundaries for a specific horizontal line (blue line). Then we fit another linear regression model associating the pixels with ground truth measurements in meters. For fitting the model we use 15 training samples with the number of pixels and corresponding ground truth values in meters. To obtain ground truth values, we manually measured the width of various streets. The fitted linear regression model and its details are shown in
Figure 4. The sum of squares error is 7.44, the slope is 0.011 and the intercept is −1.272.
The final road width is given by Equation (3), where m denotes the width in meters and p is the number of pixels.
4. Platform Architecture and User Interface
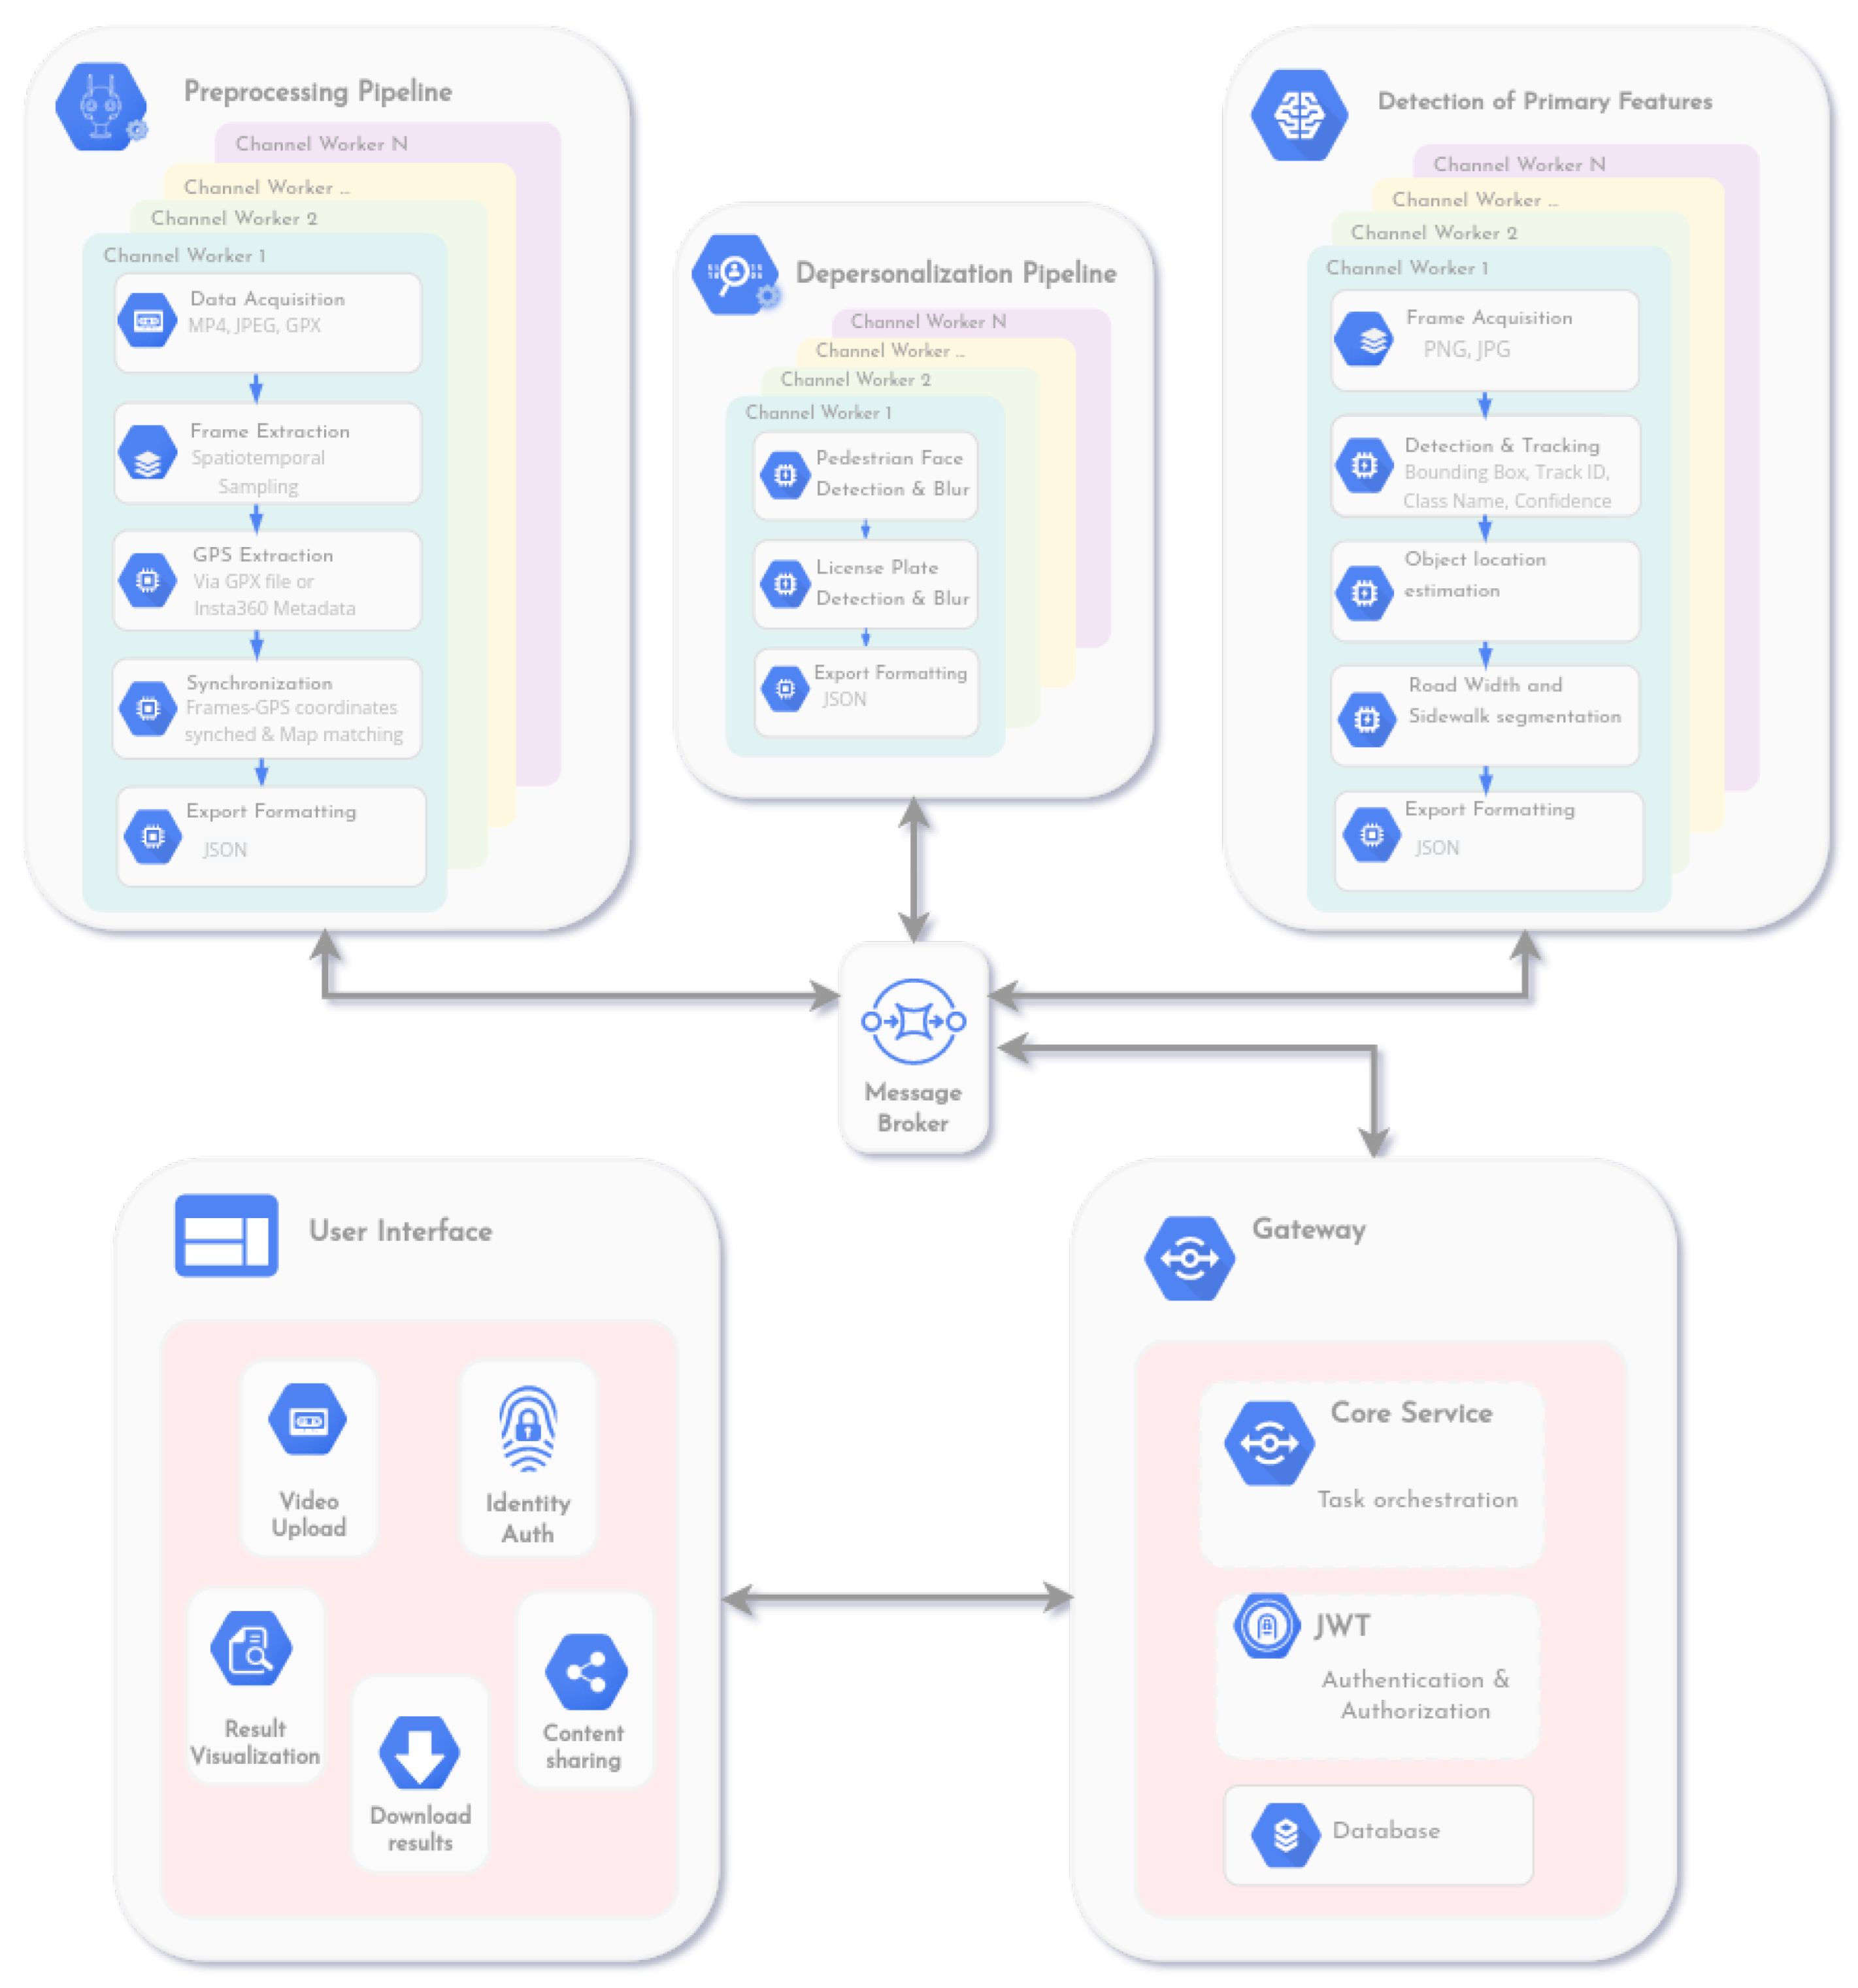
The schematic representation of the platform’s architecture is depicted in
Figure 5. StreetScouting consists of five modules that communicate with each other and are described in this Section. The proposed platform is currently running as a web application on a server and consists of a microservice architecture that enables portability and scalability.
4.1. Gateway
The gateway is the core management service and is utilized as an intermediary between the user interface and the modules responsible for urban feature detection. It is in charge of most of the platform’s actions, such as user creation and authentication, action authorization, video upload, and others. The gateway also acts as an orchestrator between the modules. Specifically, it stores the uploaded multimedia from the user and informs the appropriate modules to start the processing, depersonalization, and detection procedures. Upon completion of the processes, the resulting JSON file is returned to the gateway and successively back to the user interface. The aforementioned JSON file can be shared among users as well as utilized for visualization purposes. The communication between the modules is performed with a message broker.
4.2. User Interface
The user interface of the platform offers an organized and easy-to-use environment that provides a variety of options. Through the user interface, a user is able to create an account that will ensure the privacy and security of his data. The user has also the ability to upload a video and the GPS metadata to the platform. The data will be securely stored on the server and can be deleted at any time upon request. The automatic data processing and detection task will enable the visualization of the geotagged urban features on a map. Moreover, the aggregated results of each detected object will be presented. Sharing data among users is also allowed. Specifically, the interface provides an option to upload and share content with specific users that belong to the same organization. The user interface also provides an option for downloading the aforementioned results.
4.3. Preprocessing
The preprocessing module illustrated in
Figure 5 provides a visual representation of the successive steps of the preprocessing pipeline analyzed in
Section 3.2. In the final step of the module, the results of the synchronization between the video frames and the GPS data take the JSON format and are inserted into the communication queue of the message broker. This module can support multiple workers to process many requests at the same time.
4.4. Depersonalization
The depersonalization module consists of three successive procedures. At first, the license plates of each vehicle are detected using the two-stage license plate detection model described in
Section 3.4.3, for each video frame. Subsequently, a smoothing filter is applied to the detected license plate area to hide the sensitive information, using the OpenCV tool [
51]. In the second phase, the faces of bypassing pedestrians are detected utilizing the face detector described in
Section 3.4.4, for each video frame. The same smoothing filter that was applied in license plate blurring is used to hide the detected faces. Finally, the detection results are transformed into JSON format and forwarded to the communication queue of the message broker. This module can also support multiple workers to process many requests at the same time.
4.5. Primary Features Detection
The primary features detection module is comprised of five steps and is responsible for detecting urban features. Initially, the video frames from the depersonalization module are retrieved. The following step consists of the object detection and tracking process. Specifically, information regarding the bounding box coordinates of each detected object in the frame, the object class name, and the score representing the model’s confidence in the detection is calculated, utilizing the detection models analyzed in
Section 3.4.1 and
Section 3.4.2. Then, object tracking is applied to avoid counting the same object multiple times, using the mechanism described in
Section 3.5. The tracking process assigns a unique identifier to each detected object in the video stream. In the next step, the location of each object is estimated, making use of the techniques documented in
Section 3.6. Moreover, the process of estimating the road width and the existence of a sidewalk is performed using the semantic segmentation models and estimation techniques defined in
Section 3.7. Finally, the results are transformed into JSON format and forwarded to the communication queue of the message broker for the Gateway service.
5. Results
5.1. Object Detection Evaluation
We use Average Precision (AP) to evaluate the effectiveness of object detection since this is the metric commonly used in the relevant computer vision literature. It encapsulates the trade-off between precision and recall and maximizes the effect of both metrics.
Table 2 illustrates the AP of each object at a specific IoU threshold. The license plate model shows high performance in temps of AP and usually misses some license plates that are far from the camera. Trash and recycling bins are also detected with high precision. In the case of trees and street lights which are evaluated with 0.857 and 0.841 AP, respectively, there are some false negative detections. Trees that are very close to each other sometimes are detected as one, and street lights with specific particularities that are not part of the training set might be missed. Finally, the retail shop detection has 0.754 AP, this is mainly due to false negative detections of retail shops with small storefronts. The fine-tuned detection models and evaluation datasets utilized for each object class are described in
Section 3.4. The pre-trained models that are used to detect faces and urban features from BDD100k are analyzed in
Section 3.4.4 and
Section 3.4.2, respectively. These models demonstrate high performances on benchmark datasets that exhibit similarities with the collected street scene dataset and are utilized by StreetScouting.
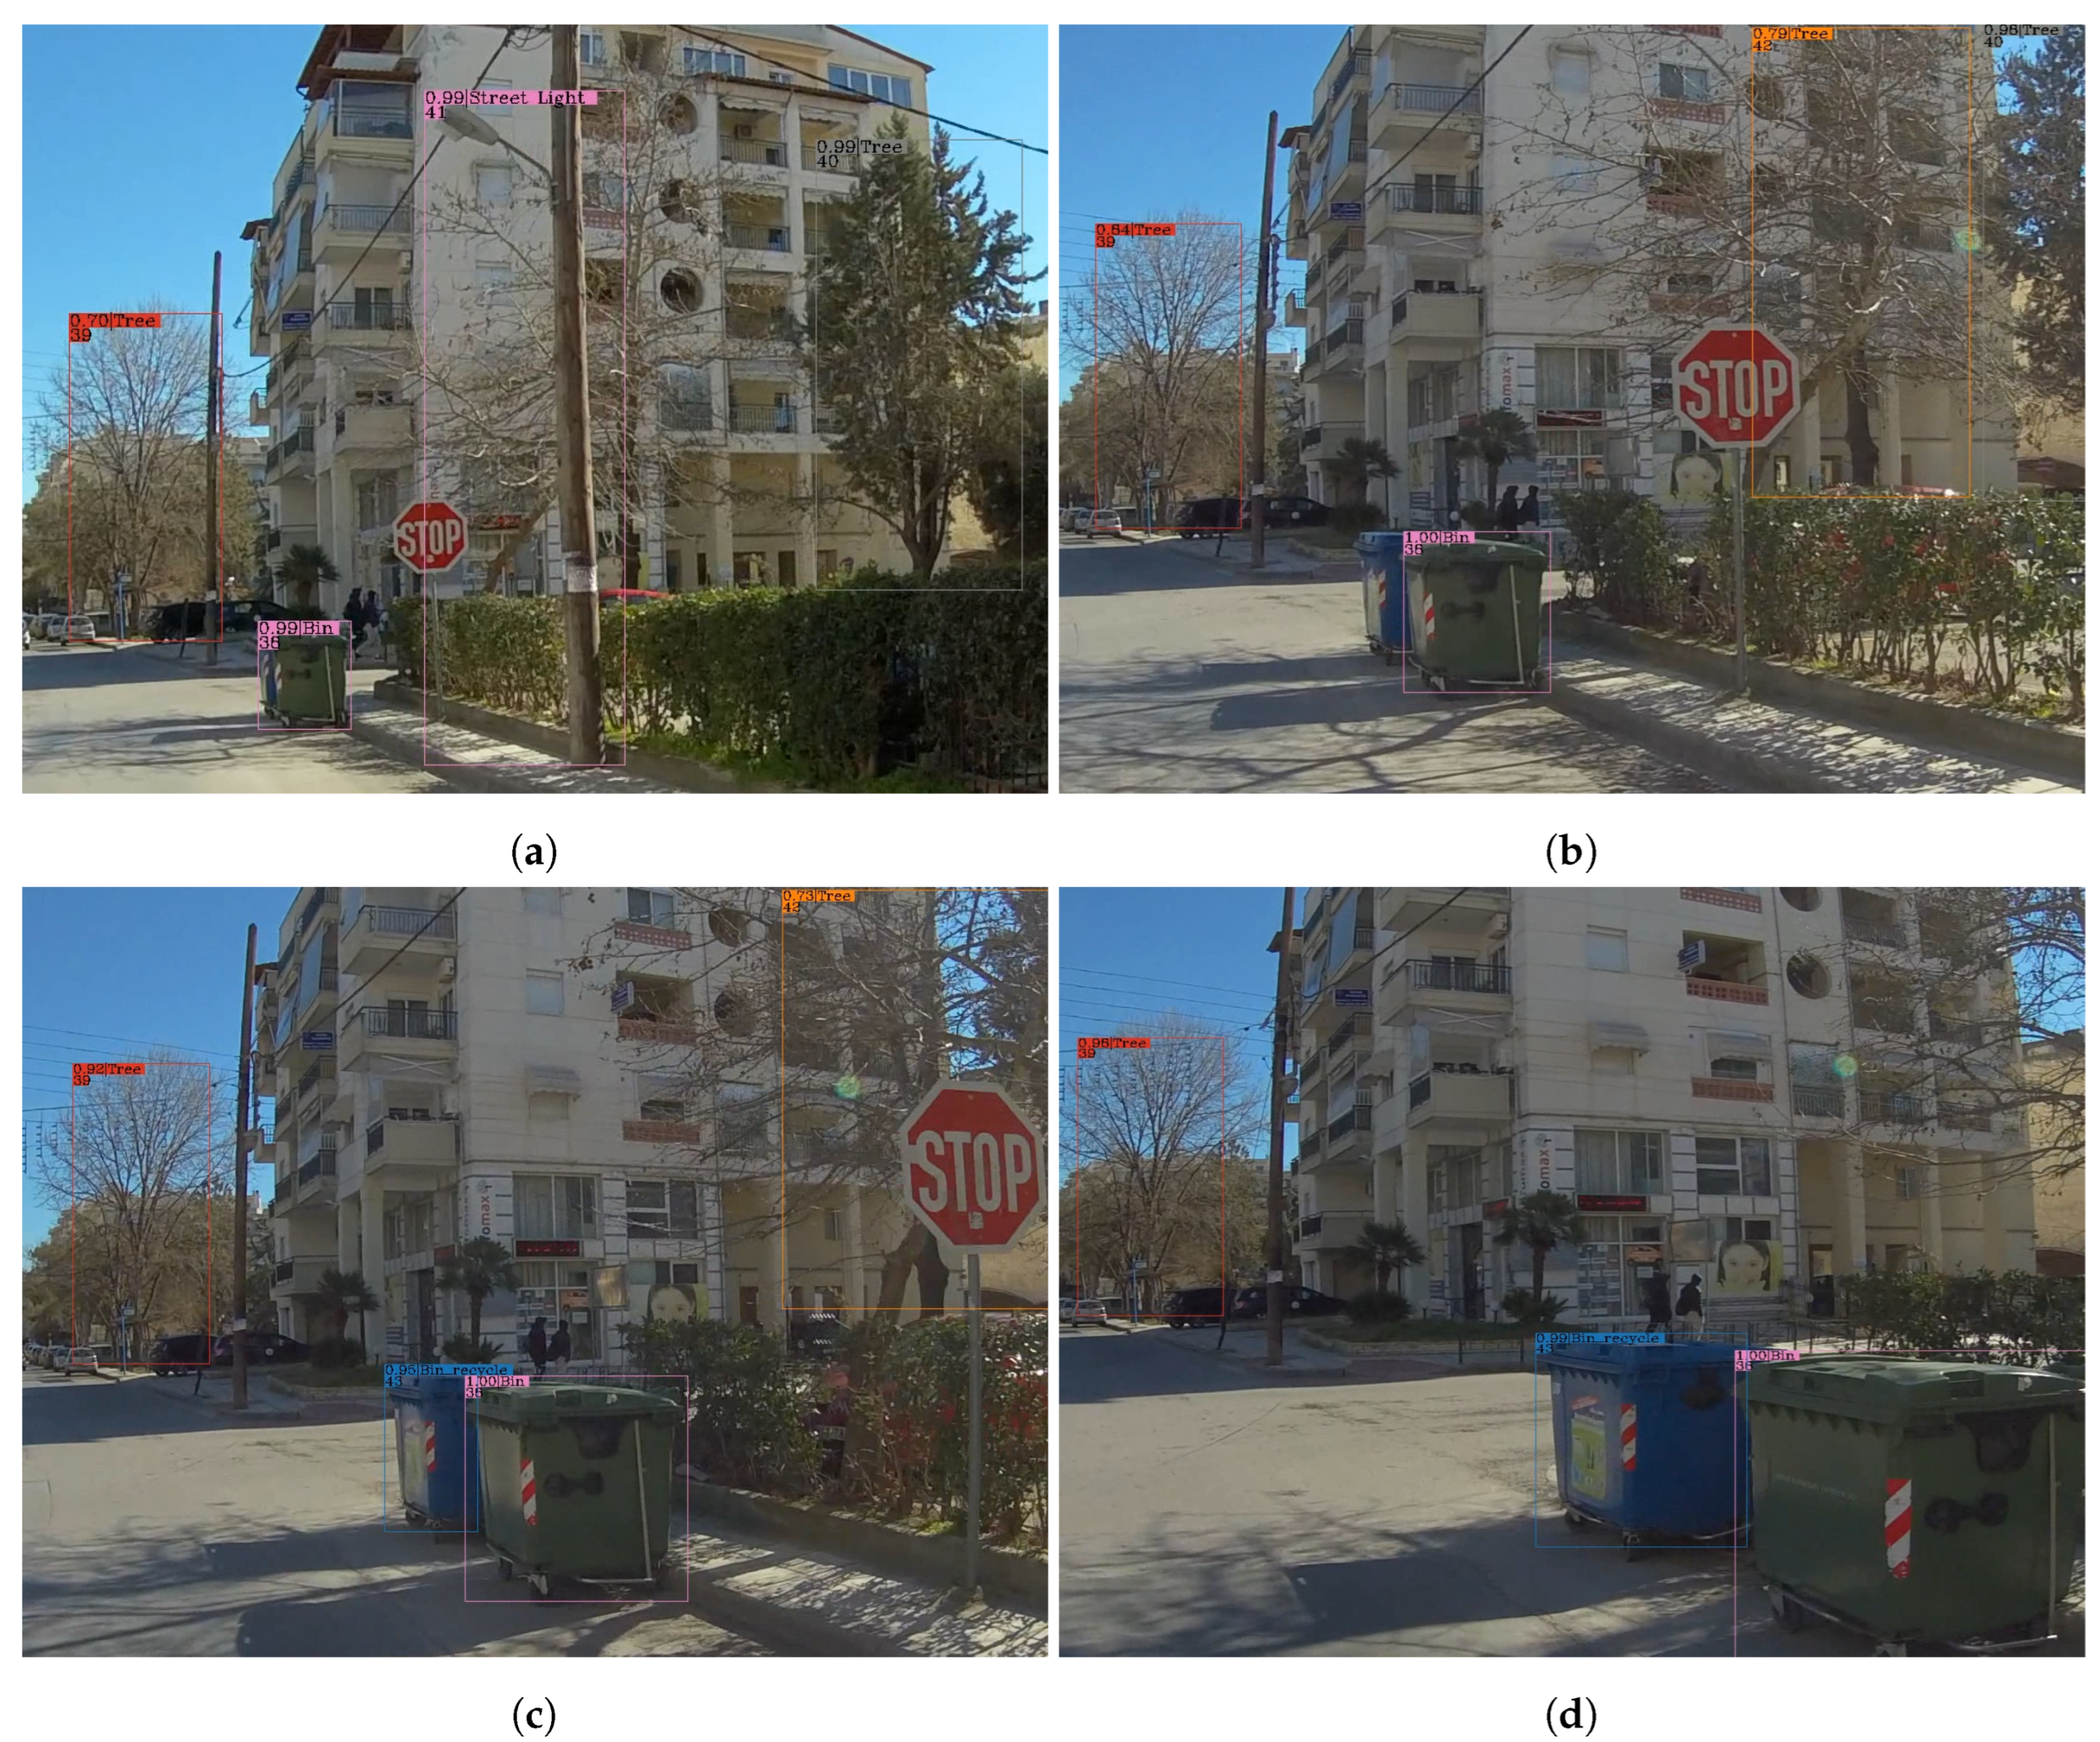
5.2. Object Tracking Evaluation
Figure 6 shows an example of the qualitative evaluation of the ByteTrack tracking method. The method uses the object detector described in
Section 3.4.1. In the first frame (
Figure 6a), there are four object detections: {id:39, class: Tree, score:0.70}, {id:41, class: street light, score:0.99}, {id:36, class: Trash bin, score:0.70}, {id:40, class: Tree, score:0.99}. Each detection has a unique id, the class name, the detection score, and the bounding box coordinates which are omitted in this example. In the second frame (
Figure 6b) there are three object detections: {id:39, class: Tree, score:0.54}, {id:36, class: Trash bin, score:0.70}, {id:42, class: Tree, score:0.79}. Objects with ids 40 and 41 are no longer visible and new Tree detection (42) is no longer occluded. Note that the confidence score for tree 39 dropped to 0.54. This fluctuation is usual for objects that are far from the camera, but generally, the confidence is higher when the objects are closer. This is visible in frames
Figure 6c,d, where the confidence score for tree 39 is 0.92 and 0.95, respectively. In the frame in
Figure 6c, a recycle bin is detected with id 43 and a score of 0.95. In the next frame, the recycle bin is even closer and obtains a detection score of 0.99.
In most scenes, the tracking process demonstrates high effectiveness. However, there are cases where tracking fails to correctly track the objects especially when there are many objects that appear next to each other or when the camera travels at high-speed leading to substantial discrepancies among consecutive frames. Such cases are not frequent in the collected dataset.
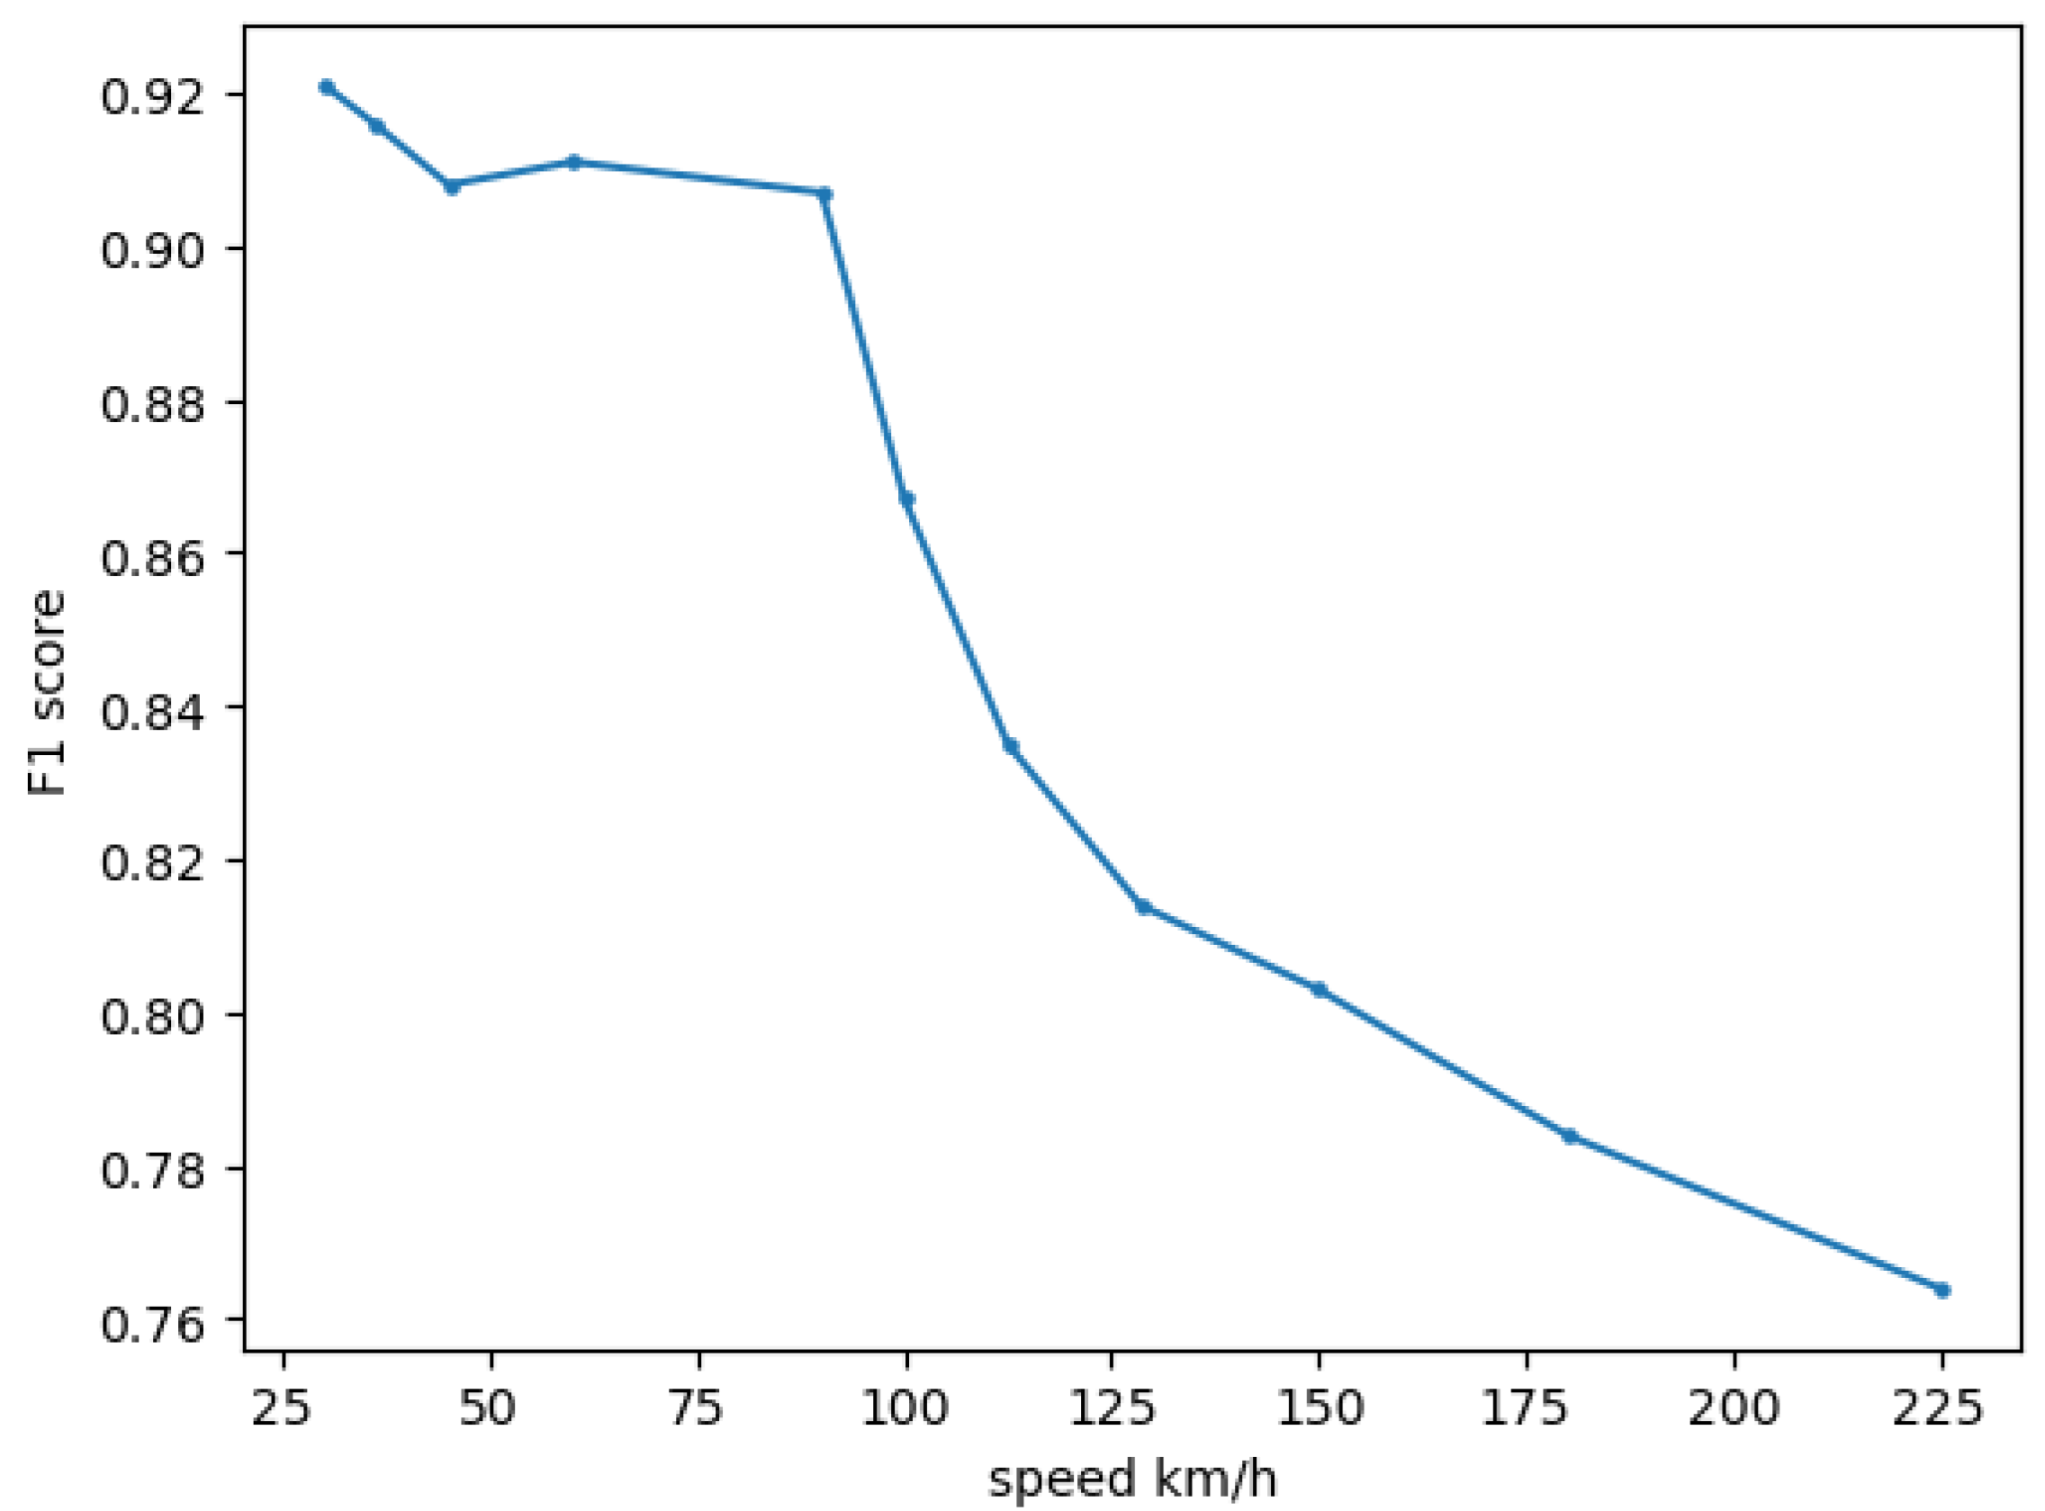
To evaluate tracking performance, we annotate a short video clip and evaluate the tracking quantitatively in terms of the F1 score. Additionally, to investigate the impact of the speed camera on the tracking method, we subsample the number of acquired frames to emulate various car speeds and investigate the impact of speed on the overall accuracy of the tracking approach. Specifically, the original video has 30 FPS and the camera speed is traveling at 30 km/h. Reducing the number of frames with a specific rate increases the emulated speed for that rate. Using this sub-sampling approach we evaluate the tracking methods at various speeds in terms of F1 score. The F1 score is calculated using the tracked objects and the annotated objects.
Figure 7 shows the evaluation results. We observe that the performance is above 0.9 F1 for speeds up to 90 km/h. The performance starts dropping significantly for higher speeds. The best score is observed at 30 km/h with an F1 score of 0.921. From the Figure, we can conclude that the performance does not drop significantly for the speed of 50 km/h, which is often the upper limit of speed in most urban areas, but a performance drop is expected for speeds above 90 km/h. We also note that this experiment does not account for motion blurring that might be introduced from the camera at very high speeds, which will further hinder performance.
5.3. Object Location Estimation Evaluation
In
Section 3.6, we described two methods to estimate the GPS coordinates of the detected objects. To evaluate these models, we obtain the ground truth coordinates of ten different urban objects and apply the two location estimation methods. Using the predicted and actual points, we calculate the error for each object and average them for each method.
Table 3 shows the evaluation results for the two location estimation methods. As expected, the
depth is more accurate with only a 3.54 m average distance from the ground truth locations. On the other hand, the
fast method makes more coarse estimations with a 7.47 average error but requires no computation-intensive processing.
5.4. Road Width Estimation Evaluation
For the evaluation of the regression model that is described in
Section 3.6 we use the model to estimate the road width in 10 randomly sampled frames and retrieve ground truth measurements. Then we calculate the mean absolute error of the predicted
and actual measurements of
given by the following formula:
with
, resulting in 0.53 m which is quite accurate taking into account the dynamic street environment.
5.5. User Interface Example
After video processing, the UI provides helpful visualizations for the user. For instance,
Figure 8 shows count aggregations of each detected urban class for a sample 60-min video in the city of Thessaloniki. The detected urban classes are aggregated into four general categories. This visualization gives a quick overview of the results but also can be helpful to extract insights for the region. For example, the 10,745 cars detected might be indicative of traffic congestion or parking problems in the region.
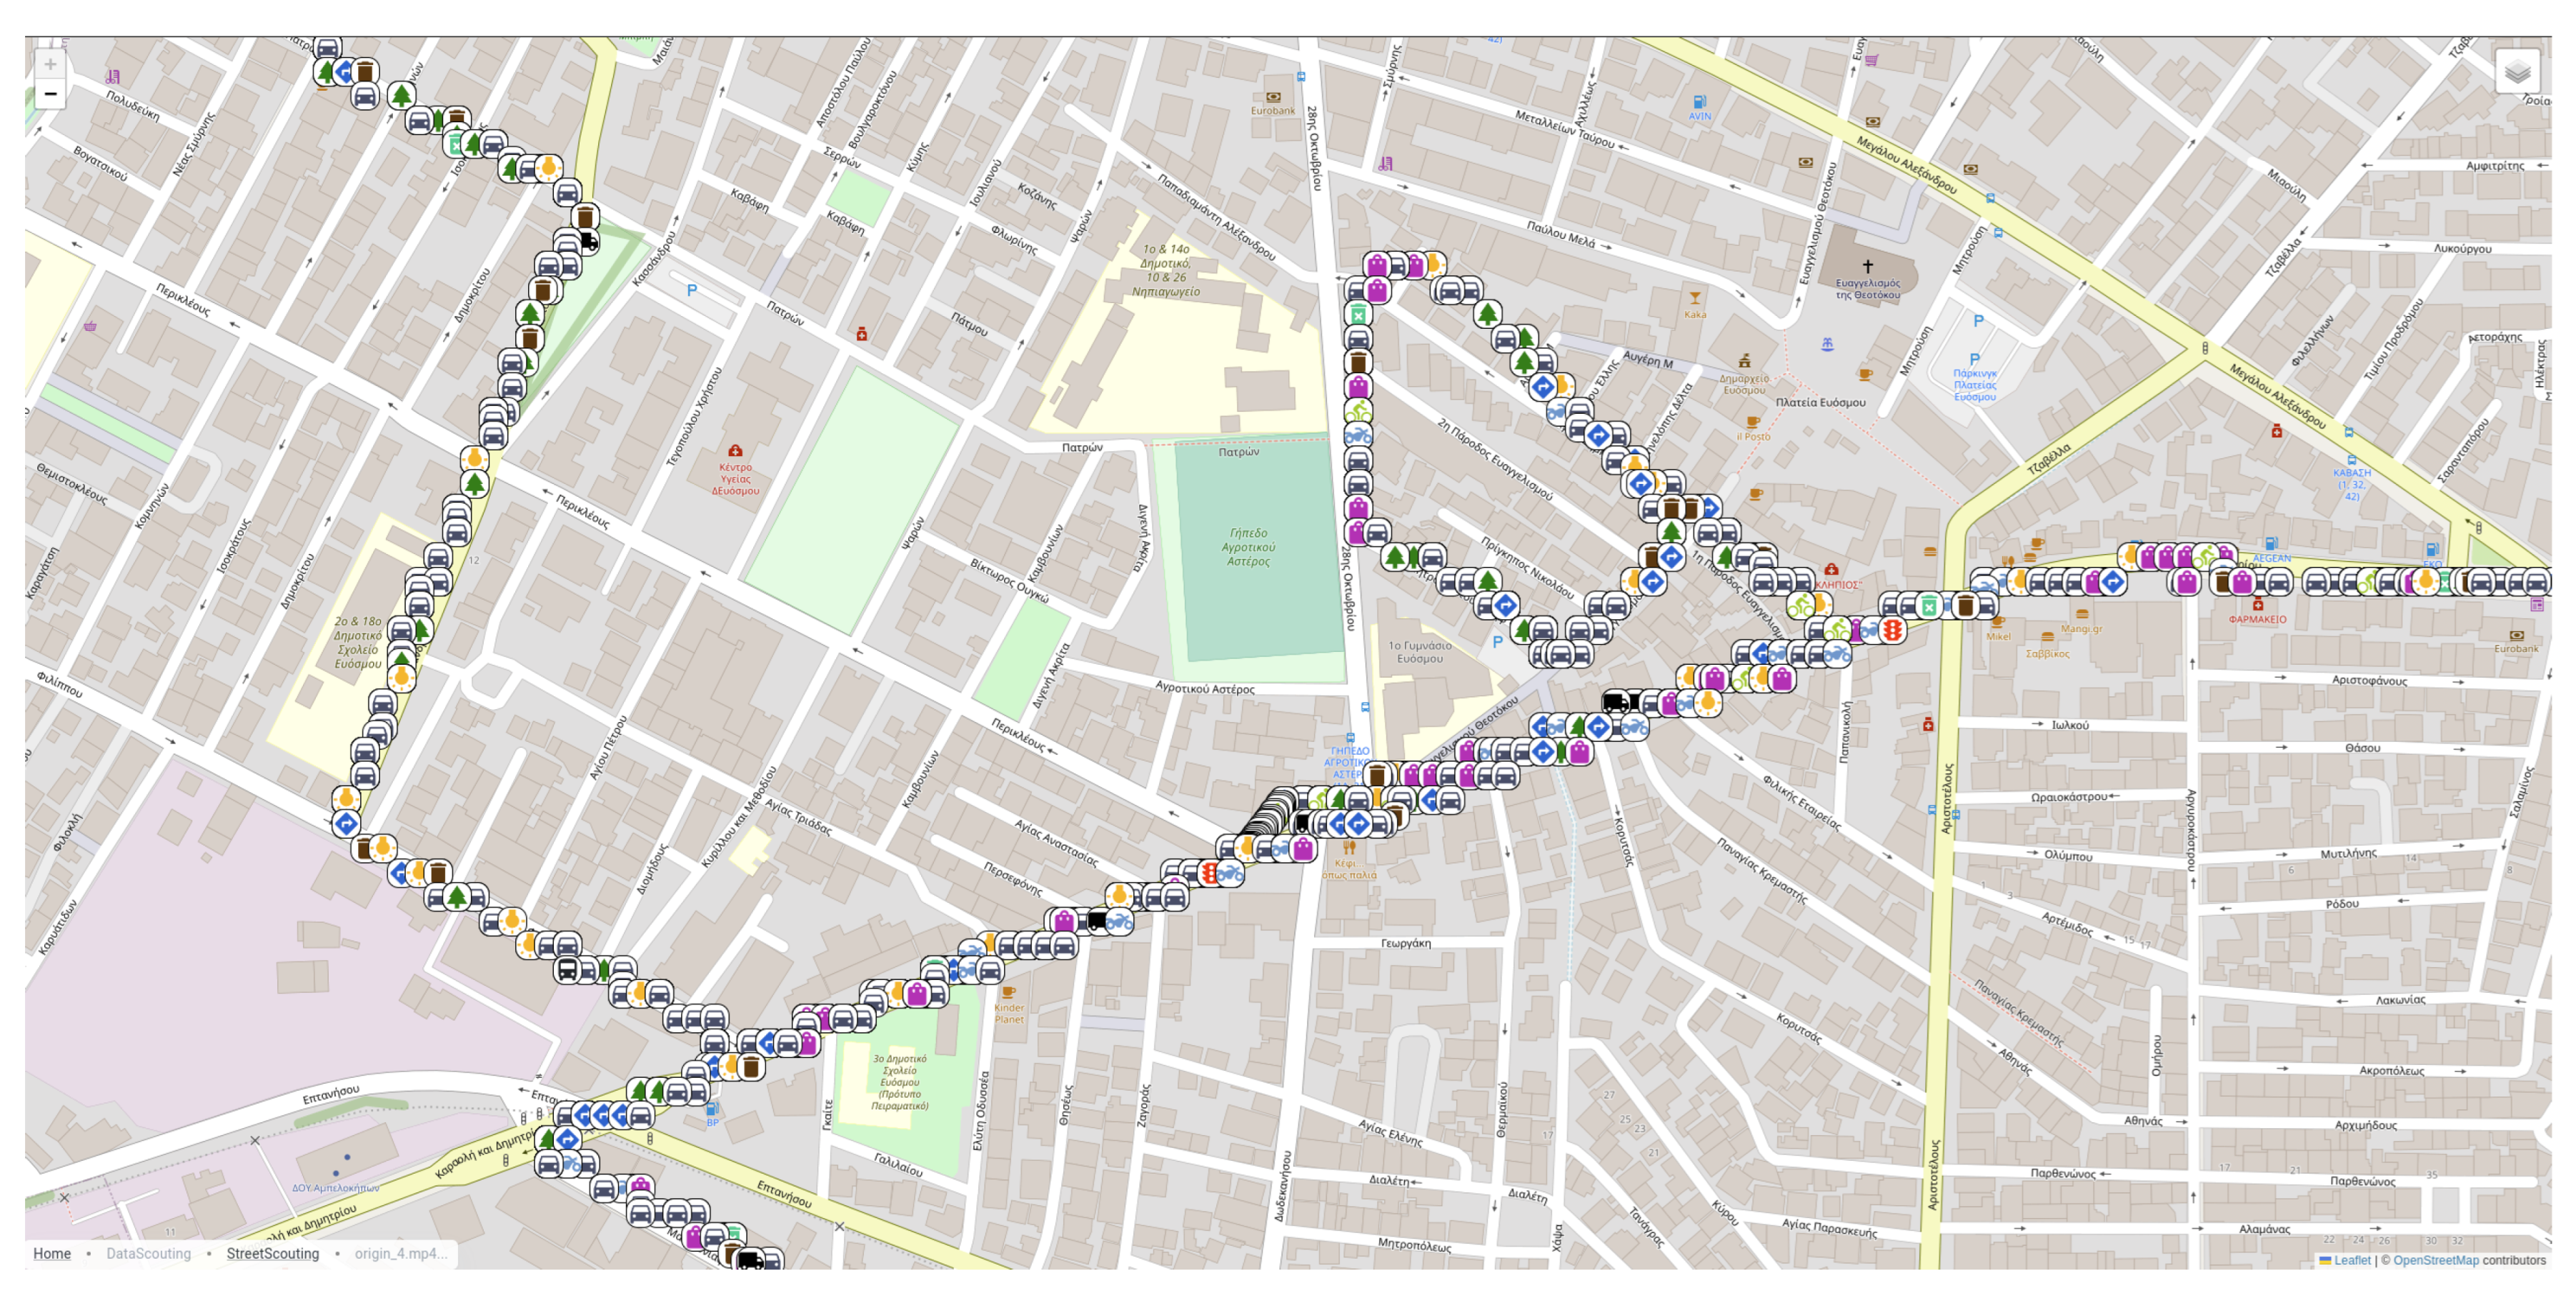
Additionally, StreetScouting also supports map visualization and navigation (
Figure 9). The user can navigate the map and inspect the geotagged urban features. Each object is denoted by a particular urban class icon. The user can also filter results to examine specific object classes and click on particular objects to obtain details regarding the detection. The user can download the data in JSON format to proceed with further analysis.
6. Discussion
StreetScouting can be utilized by urban planning administrators and policymakers, municipal offices, geoinformatics companies, and other commercial organizations, for applications related to public health, real estate, traffic detection, waste management, and others. More specifically, urban planning officials can automatically check the density of the trees in particular regions to plan the creation of parks or new green areas. Municipal administrators can collect data regarding the number of street lights that are available. Information regarding the number of retail shops can be important for a real estate application. The number and position of recycling or trash bins can support waste management campaigns. StreetScouting generated data can be further utilized for statistical analysis and geographic information systems.
The motivation for StreetScouting started in the context of the GRUBLES project. The goal of the project is to build statistical models that can infer socioeconomic indicators of a region by using information regarding the number and locations of urban features. For this use case, StreetScouting is configured to track specific urban features, such as trees, street lights, retail shops, recycling, and trash bins, vehicles, traffic signs, and traffic lights. Some of these features are selected based on the related literature. For example, trees are important for health in an urban environment [
52], the detection of trash bins can enable efficient waste management activities [
53], and the detection of vehicles is important for traffic management [
54]. The rest of the features are selected from the user requirements process of the GRUBLES project. One example of the outcomes of GRUBLES can be seen in
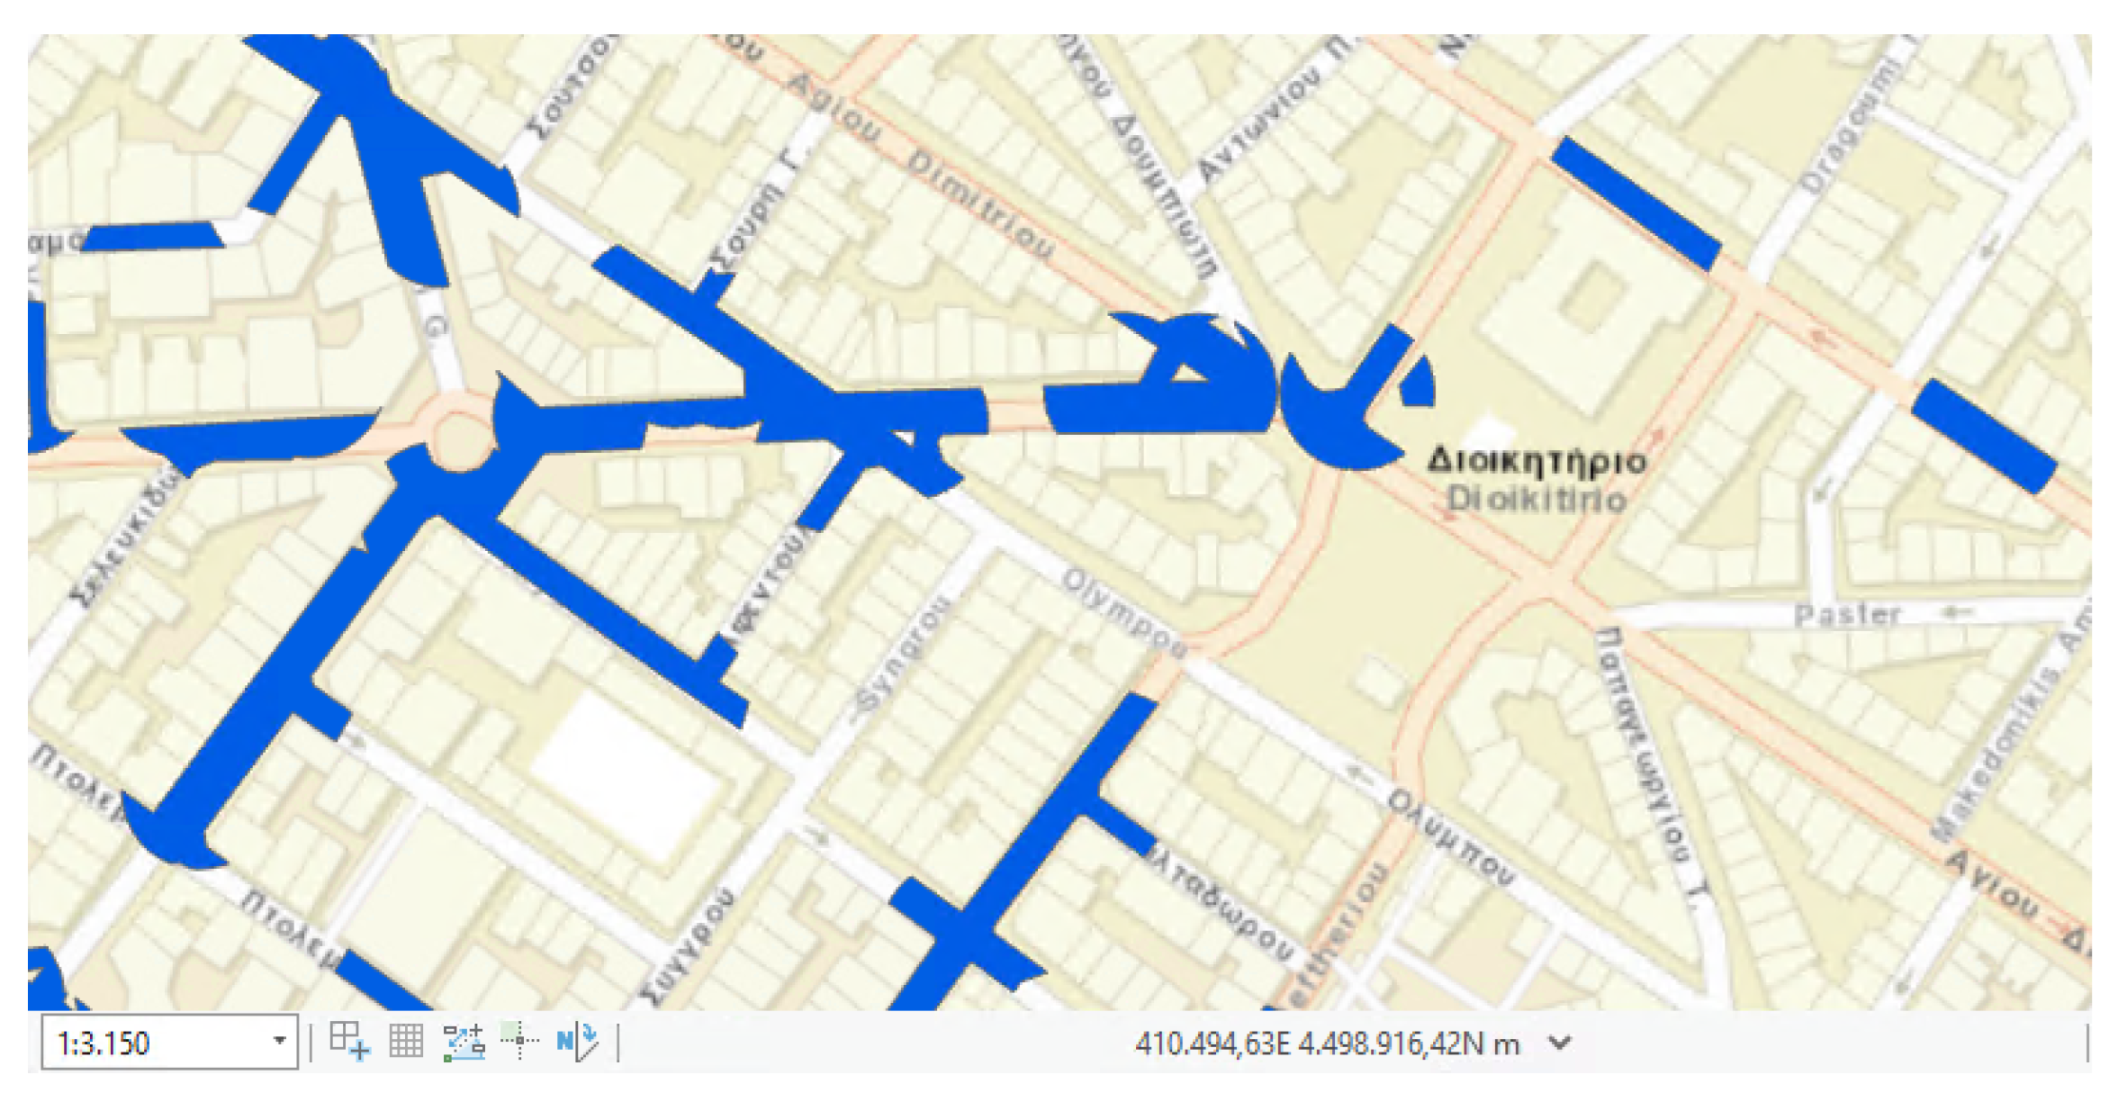
Figure 10. In the figure, the recycling bin coverage of a particular region is shown. This analysis uses the results of StreetScouting and other publicly available census data to calculate additional statistics, such as how many residents correspond to one recycle bin and locations that require more bins.
It is easy to extend StreetScouting to other use cases. Any new user of the platform can collect data with the proposed data collection method and define the region of interest. Data collection should be performed with car speeds that are imposed within urban regions but in any case not higher than 90 km/h to avoid object tracking errors. There is no limitation on the size of the region coverage. Besides the already mentioned urban features, StreetScouting can be configured to detect other features as well, for example in rural areas. This process would require the creation of need object detection models using annotation and fine-tuning.
The generation of the StreetScouting results is asynchronous and the processing time increases linearly with the duration of input videos. The hardware requirements for StreetScouting include a typical server with at least 32 GB ram, a multi-core CPU, and a CUDA-enabled GPU. The average execution time of StreetScouting is equal to the input video duration.
One limitation of StreetScouting is that the location estimation module cannot estimate precise location information. This limitation is not so crucial for the intended use of StreetScouting as it is more important for StreetScouting to correctly detect the object and provide a rough estimation of the location. StreetScouting is not proposed for applications that require accurate location information. Moreover, as mentioned in
Section 3.1, StreetScouting currently assumes that the data collection route is not overlapping, meaning that precise routes are designed beforehand by specific personnel. For the updated version of the platform, we plan to exploit the GPS information of the detected objects in order to discard duplicate detected features from overlapping data collection routes. To further validate and improve the model’s performance, we plan to expand the training datasets with additional annotations, create evaluation datasets for pre-trained models and provide a benchmark for the tracking approach. StreetScouting is a platform that can be configured to detect and track specific urban features. The platform can be extended to detect more urban objects according to needs. StreetScouting will continue to obtain updates and keep up with the latest trends in deep learning research. In the future, StreetScouting will support processing
visual signals to better capture urban objects and decrease the processing times. Finally, we plan to release a public benchmark dataset to automatically evaluate all approaches described in this work.
7. Conclusions
In this work, we presented StreetScouting, a platform for the automatic detection of urban features, such as trees, bins retail shops, vehicles, and others. StreetScouting utilizes state-of-the-art computer vision approaches to detect and geotag urban features from visual data. The platform offers an organized and easy-to-use environment that provides a variety of options, such as visualization and data aggregation techniques to efficiently process, review, and handle the resulting data.
StreetScouting is able to detect and track urban features, reducing the gap between a fully automatic and manual detection approach. The small performance drop of the automatic approach is definitely a good trade-off to the labor-intensive manual inspection.
In the context of the GRUBLES project, publicly available statistics and indicators, such as financial status, lighting quality, green area coverage, traffic, waste management, and others were studied in the analyses. The extracted information can be utilized by many other commercial or public organizations, providing automatic and accurate data without the need for manual inspection. This information is vital for urban planning tasks and related commercial use cases.
Author Contributions
Conceptualization, S.V., P.C. and C.D.; methodology, P.C. and S.M.; software, A.P., M.M. and I.J.T.; validation, S.M., M.M. and A.P.; formal analysis, P.C. and S.M.; investigation, P.C. and S.M.; resources, S.V. and S.D.; data curation, S.M.; writing—original draft preparation, P.C. and S.M.; writing—review and editing, P.C., S.D., C.D. and S.V.; visualization, A.P; supervision, S.D., C.D. and S.V.; project administration, S.D. and S.V.; funding acquisition, S.D. and S.V. All authors have read and agreed to the published version of the manuscript.
Funding
This research was co-financed by the European Regional Development Fund of the European Union and Greek national funds through the Operational Program Competitiveness, Entrepreneurship, and Innovation, under the call RESEARCH–CREATE–INNOVATE. Project Acronym: GRUBLES, Project Code: T2EDK-04533.
Institutional Review Board Statement
Not applicable.
Informed Consent Statement
Not applicable.
Data Availability Statement
Not applicable.
Conflicts of Interest
The authors declare no conflict of interest.
Abbreviations
The following abbreviations are used in this manuscript:
| AP | average precision |
| DL | deep learning |
| FPS | frames per second |
| GIS | geographic information system |
| GPS | global positioning system |
| GPX | GPS exchange format |
| IoU | intersection over union |
| IoT | Internet of Things |
| JSON | JavaScript Object Notation |
| ML | machine learning |
| MOTA | multiple object tracking accuracy |
| RMSE | root mean square error |
| UI | user interface |
References
- Grigorescu, S.; Trasnea, B.; Cocias, T.; Macesanu, G. A survey of deep learning techniques for autonomous driving. J. Field Robot. 2020, 37, 362–386. [Google Scholar] [CrossRef] [Green Version]
- Esteva, A.; Robicquet, A.; Ramsundar, B.; Kuleshov, V.; DePristo, M.; Chou, K.; Cui, C.; Corrado, G.; Thrun, S.; Dean, J. A guide to deep learning in healthcare. Nat. Med. 2019, 25, 24–29. [Google Scholar] [CrossRef] [PubMed]
- Tekouabou, S.C.K.; Diop, E.B.; Azmi, R.; Jaligot, R.; Chenal, J. Reviewing the application of machine learning methods to model urban form indicators in planning decision support systems: Potential, issues and challenges. J. King Saud-Univ.-Comput. Inf. Sci. 2021, 34, 5943–5967. [Google Scholar]
- Kontokosta, C.E.; Hong, B.; Johnson, N.E.; Starobin, D. Using machine learning and small area estimation to predict building-level municipal solid waste generation in cities. Comput. Environ. Urban Syst. 2018, 70, 151–162. [Google Scholar] [CrossRef]
- Liu, L.; Silva, E.A.; Wu, C.; Wang, H. A machine learning-based method for the large-scale evaluation of the qualities of the urban environment. Comput. Environ. Urban Syst. 2017, 65, 113–125. [Google Scholar] [CrossRef]
- Kim, B.; Cho, S. Automated multiple concrete damage detection using instance segmentation deep learning model. Appl. Sci. 2020, 10, 8008. [Google Scholar] [CrossRef]
- Liu, Z.; Li, Z.; Wu, K.; Li, M. Urban traffic prediction from mobility data using deep learning. IEEE Netw. 2018, 32, 40–46. [Google Scholar] [CrossRef]
- Gómez, J.A.; Patiño, J.E.; Duque, J.C.; Passos, S. Spatiotemporal modeling of urban growth using machine learning. Remote Sens. 2019, 12, 109. [Google Scholar] [CrossRef] [Green Version]
- Milojevic-Dupont, N.; Hans, N.; Kaack, L.H.; Zumwald, M.; Andrieux, F.; de Barros Soares, D.; Lohrey, S.; Pichler, P.P.; Creutzig, F. Learning from urban form to predict building heights. PLoS ONE 2020, 15, e0242010. [Google Scholar] [CrossRef]
- Rundle, A.G.; Bader, M.D.; Richards, C.A.; Neckerman, K.M.; Teitler, J.O. Using Google Street View to audit neighborhood environments. Am. J. Prev. Med. 2011, 40, 94–100. [Google Scholar] [CrossRef] [Green Version]
- Bethlehem, J.R.; Mackenbach, J.D.; Ben-Rebah, M.; Compernolle, S.; Glonti, K.; Bárdos, H.; Rutter, H.R.; Charreire, H.; Oppert, J.M.; Brug, J.; et al. The SPOTLIGHT virtual audit tool: A valid and reliable tool to assess obesogenic characteristics of the built environment. Int. J. Health Geogr. 2014, 13, 52. [Google Scholar] [CrossRef] [PubMed]
- Mooney, S.J.; Wheeler-Martin, K.; Fiedler, L.M.; LaBelle, C.M.; Lampe, T.; Ratanatharathorn, A.; Shah, N.N.; Rundle, A.G.; DiMaggio, C.J. Development and validation of a Google Street View pedestrian safety audit tool. Epidemiology (Cambridge Mass.) 2020, 31, 301. [Google Scholar] [CrossRef] [PubMed]
- Smith, V.; Malik, J.; Culler, D. Classification of sidewalks in street view images. In Proceedings of the 2013 International Green Computing Conference Proceedings, Arlington, VA, USA, 27–29 June 2013; pp. 1–6. [Google Scholar]
- Biljecki, F.; Ito, K. Street view imagery in urban analytics and GIS: A review. Landsc. Urban Plan. 2021, 215, 104217. [Google Scholar] [CrossRef]
- Lumnitz, S.; Devisscher, T.; Mayaud, J.R.; Radic, V.; Coops, N.C.; Griess, V.C. Mapping trees along urban street networks with deep learning and street-level imagery. ISPRS J. Photogramm. Remote Sens. 2021, 175, 144–157. [Google Scholar] [CrossRef]
- Zhang, P.; Zhao, Q.; Gao, J.; Li, W.; Lu, J. Urban street cleanliness assessment using mobile edge computing and deep learning. IEEE Access 2019, 7, 63550–63563. [Google Scholar] [CrossRef]
- Palmer, G.; Green, M.; Boyland, E.; Vasconcelos, Y.S.R.; Savani, R.; Singleton, A. A deep learning approach to identify unhealthy advertisements in street view images. Sci. Rep. 2021, 11, 1–12. [Google Scholar] [CrossRef]
- Gebru, T.; Krause, J.; Wang, Y.; Chen, D.; Deng, J.; Aiden, E.L.; Fei-Fei, L. Using deep learning and Google Street View to estimate the demographic makeup of neighborhoods across the United States. Proc. Natl. Acad. Sci. USA 2017, 114, 13108–13113. [Google Scholar] [CrossRef] [Green Version]
- Diou, C.; Lelekas, P.; Delopoulos, A. Image-based surrogates of socio-economic status in urban neighborhoods using deep multiple instance learning. J. Imaging 2018, 4, 125. [Google Scholar] [CrossRef] [Green Version]
- Ilic, L.; Sawada, M.; Zarzelli, A. Deep mapping gentrification in a large Canadian city using deep learning and Google Street View. PLoS ONE 2019, 14, e0212814. [Google Scholar] [CrossRef]
- Suel, E.; Bhatt, S.; Brauer, M.; Flaxman, S.; Ezzati, M. Multimodal deep learning from satellite and street-level imagery for measuring income, overcrowding, and environmental deprivation in urban areas. Remote Sens. Environ. 2021, 257, 112339. [Google Scholar] [CrossRef]
- Helbich, M.; Yao, Y.; Liu, Y.; Zhang, J.; Liu, P.; Wang, R. Using deep learning to examine street view green and blue spaces and their associations with geriatric depression in Beijing, China. Environ. Int. 2019, 126, 107–117. [Google Scholar] [CrossRef] [PubMed]
- Andersson, V.O.; Cechinel, C.; Araujo, R.M. Combining street-level and aerial images for dengue incidence rate estimation. In Proceedings of the 2019 International Joint Conference on Neural Networks (IJCNN), Budapest, Hungary, 14–19 July 2019; pp. 1–8. [Google Scholar]
- Suel, E.; Polak, J.W.; Bennett, J.E.; Ezzati, M. Measuring social, environmental and health inequalities using deep learning and street imagery. Sci. Rep. 2019, 9, 1–10. [Google Scholar] [CrossRef] [PubMed] [Green Version]
- Pristouris, K.; Nakos, H.; Stavrakas, Y.; Kotsopoulos, K.I.; Alexandridis, T.; Barda, M.S.; Ferentinos, K.P. An Integrated System for Urban Parks Touring and Management. Urban Sci. 2021, 5, 91. [Google Scholar] [CrossRef]
- Kumar, S.; Deshpande, A.; Ho, S.S.; Ku, J.S.; Sarma, S.E. Urban street lighting infrastructure monitoring using a mobile sensor platform. IEEE Sens. J. 2016, 16, 4981–4994. [Google Scholar] [CrossRef]
- Alhasoun, F.; González, M. Streetify: Using street view imagery and deep learning for urban streets development. In Proceedings of the 2019 IEEE International Conference on Big Data (Big Data), Los Angeles, CA, USA, 9–12 December 2019; pp. 2001–2006. [Google Scholar]
- Li, J.; Li, J.; Zhang, H. Deep Learning Based Parking Prediction on Cloud Platform. In Proceedings of the 2018 4th International Conference on Big Data Computing and Communications (BIGCOM), Chicago, IL, USA, 7–9 August 2018; pp. 132–137. [Google Scholar] [CrossRef]
- Jiang, R.; Song, X.; Fan, Z.; Xia, T.; Chen, Q.; Miyazawa, S.; Shibasaki, R. Deepurbanmomentum: An online deep-learning system for short-term urban mobility prediction. In Proceedings of the AAAI Conference on Artificial Intelligence, New Orleans, LA, USA, 2–7 February 2018; Volume 32. [Google Scholar]
- Hastie, T.; Tibshirani, R.; Friedman, J. Overview of supervised learning. In The Elements of Statistical Learning; Springer: Berlin/Heidelberg, Germany, 2009; pp. 9–41. [Google Scholar]
- Lin, T.Y.; Maire, M.; Belongie, S.; Hays, J.; Perona, P.; Ramanan, D.; Dollár, P.; Zitnick, C.L. Microsoft coco: Common objects in context. In Proceedings of the European Conference on Computer Vision, Zurich, Switzerland, 6–12 September 2014; pp. 740–755. [Google Scholar]
- Krause, J.; Stark, M.; Deng, J.; Fei-Fei, L. 3D Object Representations for Fine-Grained Categorization. In Proceedings of the 4th International IEEE Workshop on 3D Representation and Recognition (3dRR-13), Sydney, Australia, 2–8 December 2013. [Google Scholar]
- Cai, Z.; Vasconcelos, N. Cascade r-cnn: Delving into high quality object detection. In Proceedings of the IEEE Conference on Computer Vision and Pattern Recognition, Salt Lake City, UT, USA, 18–22 June 2018; pp. 6154–6162. [Google Scholar]
- Deng, J.; Guo, J.; Ververas, E.; Kotsia, I.; Zafeiriou, S. RetinaFace: Single-shot multi-level face localisation in the wild. In Proceedings of the IEEE/CVF conference on Computer Vision and Pattern Recognition, Seattle, WA, USA, 14–19 June 2020; pp. 5203–5212. [Google Scholar]
- Yu, F.; Xian, W.; Chen, Y.; Liu, F.; Liao, M.; Madhavan, V.; Darrell, T. Bdd100k: A diverse driving video database with scalable annotation tooling. arXiv 2018, arXiv:1805.04687. [Google Scholar]
- Paszke, A.; Gross, S.; Massa, F.; Lerer, A.; Bradbury, J.; Chanan, G.; Killeen, T.; Lin, Z.; Gimelshein, N.; Antiga, L.; et al. PyTorch: An Imperative Style, High-Performance Deep Learning Library. In Advances in Neural Information Processing Systems 32; Curran Associates, Inc.: Red Hook, NY, USA, 2019; pp. 8024–8035. [Google Scholar]
- Yang, S.; Luo, P.; Loy, C.C.; Tang, X. Wider face: A face detection benchmark. In Proceedings of the IEEE Conference on Computer Vision and Pattern Recognition, Las Vegas, NV, USA, 27–30 June 2016; pp. 5525–5533. [Google Scholar]
- Zitnick, C.L.; Dollár, P. Edge boxes: Locating object proposals from edges. In Proceedings of the European Conference on Computer Vision, Zurich, Switzerland, 6–12 September 2014; pp. 391–405. [Google Scholar]
- Wojke, N.; Bewley, A.; Paulus, D. Simple online and realtime tracking with a deep association metric. In Proceedings of the 2017 IEEE international conference on image processing (ICIP), Beijing, China, 17–20 September 2017; pp. 3645–3649. [Google Scholar]
- Bergmann, P.; Meinhardt, T.; Leal-Taixe, L. Tracking without bells and whistles. In Proceedings of the IEEE International Conference on Computer Vision, Seoul, Republic of Korea, 27 October–2 November 2019; pp. 941–951. [Google Scholar]
- Zhang, Y.; Sun, P.; Jiang, Y.; Yu, D.; Yuan, Z.; Luo, P.; Liu, W.; Wang, X. ByteTrack: Multi-Object Tracking by Associating Every Detection Box. arXiv 2021, arXiv:2110.06864. [Google Scholar]
- Bernardin, K.; Elbs, A.; Stiefelhagen, R. Multiple object tracking performance metrics and evaluation in a smart room environment. In Proceedings of the Sixth IEEE International Workshop on Visual Surveillance, in conjunction with ECCV, Graz, Austria, 13 May 2006; Volume 90. [Google Scholar]
- Milan, A.; Leal-Taixé, L.; Reid, I.; Roth, S.; Schindler, K. MOT16: A benchmark for multi-object tracking. arXiv 2016, arXiv:1603.00831. [Google Scholar]
- Xue, F.; Zhuo, G.; Huang, Z.; Fu, W.; Wu, Z.; Ang, M.H. Toward hierarchical self-supervised monocular absolute depth estimation for autonomous driving applications. In Proceedings of the 2020 IEEE/RSJ International Conference on Intelligent Robots and Systems (IROS), Las Vegas, NV, USA, 25–29 October 2020; pp. 2330–2337. [Google Scholar]
- Geiger, A.; Lenz, P.; Stiller, C.; Urtasun, R. Vision meets robotics: The kitti dataset. Int. J. Robot. Res. 2013, 32, 1231–1237. [Google Scholar] [CrossRef] [Green Version]
- Eigen, D.; Fergus, R. Predicting depth, surface normals and semantic labels with a common multi-scale convolutional architecture. In Proceedings of the IEEE International Conference on Computer Vision, Santiago, Chile, 7–13 December 2015; pp. 2650–2658. [Google Scholar]
- Masoumian, A.; Marei, D.G.; Abdulwahab, S.; Cristiano, J.; Puig, D.; Rashwan, H.A. Absolute Distance Prediction Based on Deep Learning Object Detection and Monocular Depth Estimation Models. In Proceedings of the CCIA, Virtual Event, 20–22 October 2021; pp. 325–334. [Google Scholar]
- Chen, L.C.; Zhu, Y.; Papandreou, G.; Schroff, F.; Adam, H. Encoder-decoder with atrous separable convolution for semantic image segmentation. In Proceedings of the European Conference on Computer Vision (ECCV), Munich, Germany, 8–14 September 2018; pp. 801–818. [Google Scholar]
- Cordts, M.; Omran, M.; Ramos, S.; Rehfeld, T.; Enzweiler, M.; Benenson, R.; Franke, U.; Roth, S.; Schiele, B. The cityscapes dataset for semantic urban scene understanding. In Proceedings of the IEEE Conference on Computer Vision and Pattern Recognition, Las Vegas, NV, USA, 27–30 June 2016; pp. 3213–3223. [Google Scholar]
- Everingham, M.; Eslami, S.; Van Gool, L.; Williams, C.K.; Winn, J.; Zisserman, A. The pascal visual object classes challenge: A retrospective. Int. J. Comput. Vis. 2015, 111, 98–136. [Google Scholar] [CrossRef]
- Bradski, G. The OpenCV Library. Dr. Dobb’s J. Softw. Tools 2000, 120, 122–125. [Google Scholar]
- Șandric, I.; Irimia, R.; Petropoulos, G.P.; Anand, A.; Srivastava, P.K.; Pleșoianu, A.; Faraslis, I.; Stateras, D.; Kalivas, D. Tree’s detection & health’s assessment from Ultra-High Resolution UAV Imagery and Deep Learning. Geocarto Int. 2022, 1–21. [Google Scholar] [CrossRef]
- Yu, Y. A Computer Vision Based Detection System for Trash Bins Identification during Trash Classification. J. Phys. Conf. Ser. IOP Publ. 2020, 1617, 012015. [Google Scholar] [CrossRef]
- Song, H.; Liang, H.; Li, H.; Dai, Z.; Yun, X. Vision-based vehicle detection and counting system using deep learning in highway scenes. Eur. Transp. Res. Rev. 2019, 11, 1–16. [Google Scholar] [CrossRef]
| Disclaimer/Publisher’s Note: The statements, opinions and data contained in all publications are solely those of the individual author(s) and contributor(s) and not of MDPI and/or the editor(s). MDPI and/or the editor(s) disclaim responsibility for any injury to people or property resulting from any ideas, methods, instructions or products referred to in the content. |
© 2022 by the authors. Licensee MDPI, Basel, Switzerland. This article is an open access article distributed under the terms and conditions of the Creative Commons Attribution (CC BY) license (https://creativecommons.org/licenses/by/4.0/).


 ,
, 


