Article

Comprehensive Analysis of the Expression and Clinical Significance of RAS Family Members in Non-Small Cell Lung Cancer Based on Bioinformatics Data and the A549 Cell Line Model

Laboratory of Molecular Diagnostics and Pharmacogenomics, Department of Pharmaceutical Biochemistry and Molecular Diagnostics, Medical University of Lodz, Muszynskiego 1, 90-151 Lodz, Poland
*
Author to whom correspondence should be addressed.
Appl. Sci. 2023, 13(1), 166; https://doi.org/10.3390/app13010166
Submission received: 15 November 2022 / Revised: 20 December 2022 / Accepted: 20 December 2022 / Published: 23 December 2022
(This article belongs to the Section Biomedical Engineering)

Abstract

:
Lung cancer is the second most frequent worldwide diagnosed cancer. Mutations in the RAS genes family are among the most common oncogenic alterations occurring in non-small cell lung cancer (NSCLC). Many treatment options against KRAS mutations have been developed for NSCLC; however, they remain insufficient. Moreover, the role of KRAS and HRAS gene expression in lung cancer remains unclear. However, inhibitors of RAS genes expression seem to be a good candidate for new drugs agents in NSCLC. This study used bioinformatical analysis to determine KRAS and HRAS gene expression and its clinical significance, and then examined the influence of three different RAS inhibitors (farnesythiosalicylic acid (FTS), deltarasin and Kobe0065) on cell growth and the KRAS and HRAS gene expression (by RT-qPCR) in human NSCLC A549 cells. KRAS and HRAS were shown to be overexpressed in NSCLC compared to non-tumor lung tissues of healthy individuals (from databases) and significantly associated with different clinicopathological features. It was also found that FTS, in a dose-dependent manner, suppressed proliferation of human A549 cells, while deltarasin reduced expression of HRAS in the lung cancer cells. To sum up, the results obtained from analyses based on bioinformatics databases indicate that the studied genes are potential risk factors for the development of lung cancer. On the other hand, studies of their expression on cell lines indicated that they may also be potentially important in the response to treatment using RAS inhibitors.

1. Introduction

In 2020, lung cancer was found to be the second most commonly diagnosed cancer (11.4% of total cases) and the main cause of cancer death (18%) worldwide for men and women. It is strongly associated with tobacco use as the most important risk factor [1]. Lung cancer is divided into non-small cell lung cancer (NSCLC), which constitutes approximately 85% of all cases, and small cell lung cancer (SCLC), 15% of cases. Histologically, the two major NSCLC subtypes are adenocarcinoma (LUAD) and squamous cell carcinoma (LUSC). Due to the histological, biological, clinical and molecular heterogeneity of NSCLC, it is typically diagnosed at advanced stages; as such, the efficacy of overall treatment remains unsatisfactory [2]. It is essential to identify molecular alterations in tumor tissue or circulating tumor DNA (ctDNA) to implement targeted therapies. For instance, immunotherapies based on tyrosine kinase inhibitors (TKI), and immune checkpoint inhibitors (ICI) based on molecular testing (i.e., EGFR, KRAS, BRAF mutations and ALK, ROS1 rearrangements) have been successfully introduced in routine clinical practice and have become an important part of the NSCLC management [3]. Therefore, there is considerable research interest in the prediction, diagnosis, treatment and prognosis of lung cancer. Another problem is acquired drug resistance developed by tumor cells in different mechanisms; this poses a challenge in patients treated with molecular targeted therapy and thus requires a better understanding of intra-tumoral heterogeneity [4].
RAS proteins (HRAS, KRAS, NRAS) are members of the small GTPase family involved in cell growth, proliferation, differentiation, cell adhesion and migration [5]. Binding of a ligand to receptor tyrosine kinases (RTK), or mutations in RAS, leads to activation of downstream effector signaling pathways, such as RAF/MEK/ERK and PI3K/AKT/mTOR signaling cascades, which frequently determines the survival of cells [6]. Oncogenic alterations in KRAS, HRAS and NRAS genes frequently occur in lots of cancers, such as pancreatic, colorectal or lung tumors. The main cause for converting these protooncogenes into oncogenes are missense gain-of-function mutations [5], while 99% of mutations in KRAS are predominant at residues G12, G13 or Q61. The major substitution in NSCLC is G12C [7]. Therefore, a lot of attention has been directed toward the role of RAS family mutational status as a potential therapeutic effect in NSCLC.
Mutations of KRAS have been found to be negative prognostic factors for survival in NSCLC cases, as well as associated with shorter survival in advanced and at an early stage of NSCLC [6,8,9]. On the other hand, KRAS-mutated NSCLC is a genetically strongly heterogeneous subgroup with many co-occurring mutations (e.g., in TP53, STK11, KEAP1, ATM, MET, ERBB2, EGFR, BRAF), which might have implications in the development of treatment based on specific KRAS inhibitors [10].
In recent years, many studies have focused on using different compounds to suppress oncogenic RAS signaling, i.e., through direct inhibition of RAS, inhibition of membrane association or RAS effector signaling (RAF-MEK-ERK, PI3K-AKT-mTOR and RAL inhibitors), using synthetic lethal interactors of mutant RAS or changes in RAS-driven metabolism [7]. Among numerous interesting RAS-dependent signaling inhibitors is deltarasin, a small molecular inhibitor that blocks the interaction between KRAS–PDEδ and disrupts oncogenic RAF/MEK/ERK and PI3K/AKT KRAS-dependent signaling. Zimmermann et al. indicate that deltarasin plays a role in reducing the binding of KRAS to the plasma membrane, a crucial process for KRAS activation function, in human ductal adenocarcinoma cell lines harboring KRAS mutation. As a result, it suppresses proliferation of cells and favors in vitro and in vivo apoptosis [11]. Another RAS family inhibitor is farnesylthiosalicylic acid (FTS; salirasib), which functions as a mimic of the C-terminal S-farnesyl cysteine modification of Ras. As a result, it decreases plasma membrane association, reduces RAS-GTP levels and protein stability, and lowers effector signaling [7]. Another approach to the inhibition of RAS function is blocking RAS–effector interaction. Shima et al. used the hydrazinecarbothioamide (Kobe0065) to inhibit interaction between RAS-GTP and the RAS binding domain of Raf-1 with a Ki = 46 μM. In vitro models showed it decreased the phosphorylation of downstream proteins in the RAS pathway (i.e., MEK, ERK, and AKT) and suppressed the allosteric RAS binding site of Sos [12]. However, until now, only one RAS GTPase family inhibitor, sotorasib, has been granted accelerated approval by the Food and Drug Administration (FDA) for use in adult patients with KRAS G12C-mutated locally advanced or metastatic NSCLC [13].
Given the important role of RAS proteins in the development of lung cancer, it is important to better understand RAS-targeted therapies. Therefore, the present study investigates the in vitro effects of possible RAS inhibitors known to disturb RAS oncogenic signaling on NSCLC. Although some studies have evaluated the effects of deltarasin, FTS and Kobe0065 on cell proliferation in NSCLC [14,15,16], they have not examined its effect on KRAS and HRAS gene expression. The study first performs a bioinformatic analysis of KRAS and HRAS gene expression levels in NSCLC and evaluates the prognostic and therapeutic significance of these genes; it then examines the impact of three selected chemical compounds (deltarasin, FTS and Kobe0065) on NSCLC A549 cell line viability and on KRAS and HRAS mRNA expression levels, during a 48-h observation period after stimulation.

2. Materials and Methods

2.1. Gene Expression Bioinformatics Analysis

2.1.1. TNMplot

Differential KRAS and HRAS gene expression levels in a variety of human cancers including NSCLC histological subtypes were compared with normal controls using the web tool TNMplot (https://tnmplot.com/analysis/, accessed on 15 June 2022) [17]. These analyses were based on RNA sequencing data.

2.1.2. The UALCAN Database

TCGA (The Cancer Genome Atlas) data available on the UALCAN portal (http://ualcan.path.uab.edu/index.html, accessed on 15 June 2022) [18] was employed to analyze the association between KRAS and HRAS expression with clinical features and demographic status, i.e., age, individual cancer stages, and smoking status in lung squamous cell carcinoma (LUSC) and adenocarcinoma (LUAD).

2.2. Cell Culture and In Vitro Assay

2.2.1. Material

The expression of the selected genes (HRAS and KRAS) was determined under the influence of the specific compounds on the non-small cell lung cancer A549 human cell line. The lung cancer cells used in the experiment were commercially purchased from Sigma Aldrich, Germany and have a certificate of authenticity with the number ECACC (European Collection of Authenticated Cell Cultures) 86012804. Chemical reagents deltarasin, FTS and Kobe0065 were purchased from Selleck Chemicals (Houston, TX, USA); they were dissolved in dimethyl sulfoxide (DMSO) to a 10 or 50 mM stock concentration and stored as small aliquots at −20 °C until further use.

2.2.2. Cell Culture

The epithelial cells of the A549 cell line were characterized by an adherent type of growth in culture which was grown in the presence of RPMI1640 medium enriched with 10% FBS (foetal bovine serum) and gentamicin (50 µg/mL). Cell culture was performed in culture bottles under a humidified atmosphere containing 5% carbon dioxide saturation at 37 °C. Reagents used for cell culture were purchased from Genos, Lodz, Poland. Cultures were passaged with trypsin before it reached 80% confluence. For the experiment, a culture medium devoid of neutral red, serum and antibiotic was used to minimize the risk of interference of the test compounds.

2.2.3. Evaluation of Cell Viability with the MTT Test

Assessment of the cytotoxicity of the tested compounds (deltarasin, Kobe0065, FTS) on lung cancer cells was performed using the MTT test. The A549 cell lines were treated with drugs doses selected on the basis of the publicly available data cited within the manuscript [15,19,20,21]. In the first step, a cell suspension at a density of 1.5 × 10⁴ cells/mL was seeded into appropriately designed 96-well plates in a volume of 100 µL of cell suspension/well. After incubating the cells for 24 h, the plates were loaded with test compounds at various concentrations in the medium. The following concentrations of drugs were used for the study: deltarasin (1.25; 2.5; 5 μM); Kobe0065 (2; 10; 20 µM); FTS (50; 100; 200 µM) (See Supplementary Figure S1 for chemical structures of compounds [22,23,24]). The cells were exposed to the compounds for 24 and 48 h. After the incubation was completed, an enzymatic reaction was carried out with mitochondrial dehydrogenase. In the first stage of the MTT test, the plates were loaded with 100 µL of 3-(4,5-Dimethylthiazol-2-yl)-2,5-diphenyltetrazolium bromide per well and left for two hours for incubation. In the next stage, the formed crystals of formazan were dissolved with solubilization solution and the plates were read colorimetrically at 570 nm. Cell viability was then calculated for each concentration of test compounds. At least three independent experiments were performed. IC50 values (the concentrations required to inhibit growth by 50%) were calculated by using a linear regression equation i.e., Y = Mx + C. Here, Y = 50, M and C values were derived from the viability graph for the A549 cell line.

2.3. Assessment of HRAS and KRAS Gene Expression after Exposure to Deltarasin, Kobe0065 or FTS in A549 Cells

2.3.1. RNA Isolation Exposure of Cells to Tested of Selected Compounds from A549 Cells

The treated A549 cells were used to isolate total RNA. The RNA isolation procedure was carried out using the Genomic Mini Kit (A&A Biotechnology, Gdańsk, Poland) according to the manufacturer’s instructions. The obtained RNA samples were checked for purity and quality using the spectrophotometric method before being subjected to gene expression analyses. Samples with a 260 nm to 280 nm absorbance ratio in the range 1.8–2.0 were used for further analyses.

2.3.2. Reverse Transcription Reaction

The relative levels of gene expression in treated lung cancer cells were determined by reverse transcription using RNA obtained from these cells. The reaction was conducted with the use of high capacity cDNA reverse transcription kit (Applied Biosystems™, Waltham, MA, USA) according to the manufacturer’s procedure. The reaction mixture consisted of 2.0 µL 10× RT Buffer, 0.8 µL 25× dNTP Mix 100 mM, 2.0 µL oligo (dT), 0.5 µg/µL, 1.0 µL, MultiScribe™ Reverse Transcriptase 20 U/µL, 1.0 µL RNase Inhibitor 20 U/µL and 13.2 µL RNA samples. The same final RNA concentration of 0.05 µg/µL was obtained in each reaction. The presence of the obtained cDNA was checked by performing a PCR reaction with primers for the GAPDH housekeeping gene. The presence of PCR products was assessed using electrophoresis.

2.3.3. Real Time PCR

The quantitative assessment of the relative expression levels of selected genes was performed with real-time PCR using the Bio-Rad apparatus (CFX Connect Real-Time PCR Detection System). The real-time amplification reaction was carried out according to the procedure using the iTaq Universal SYBR Green Supermix Reagent Kit (BioRad, Hercules, CA, USA). For each reaction, the composition of the reaction mixture was as follows: 5 µL of master mix, 0.25 µL of each primer (10 µM), 1 µL of cDNA template and 3.75 µL nuclease-free water for a final reaction volume of 10 µL. The sequences of the primers used for the reaction are described in Table 1. For each cDNA sample, the test and reference gene amplification reactions were performed in parallel, in triplicate and in separate test tubes. A no-template control (NTC) was included in each series of reactions. Real-time PCR reactions were run under the following temperature conditions: initial denaturation step at 96 °C for 3 min, 34 cycles with two steps, including denaturation at 94 °C for 50 s and annealing with elongation at 58 °C for 50 s. After each real-time PCR reaction, the specificity of the obtained amplification products was checked by performing melting curves analysis ramping from 65 °C to 95 °C and rising by 0.5 °C every 5 s. The examples of standard, amplification and melting curves are provided in Supplementary Figures S2 and S3. In order to construct the standard curves for the tested genes, allowing for the calculation of efficiency of qPCR, a five serial of 10-fold dilutions of the PCR product (obtained using the same primers as the RT-qPCR reaction) was prepared. Mean Ct values were determined for each amplification; due to the similar values of the qPCR reaction efficiency, these were then applied to calculate the level of gene expression relative to the GAPDH gene using the ΔΔCt method. The negative control samples, cells without added chemical compounds after 24 and 48 h of incubation, for both genes HRAS and KRAS were treated as calibrator, respectively, for samples after 24 h and 48 h incubation with different concentrations of investigated chemical compounds [25].

2.3.4. Statistical Analysis

Statistical analyses, using data from the TNMplot and UALCAN databases, were provided by these platforms. In the TNMplot, the differences in gene expression between different types of cancers and between normal and tumor samples were assessed using the Mann–Whitney U test. In the UALCAN comparisons of gene expression levels (reported as transcripts per million) between LUAD and LUSC samples and normal lung tissue, samples and clinical parameters were carried out using Student’s t-test, assuming unequal variance.
Results with a p-value of <0.05 in all statistical tests were considered significant.
In the case of studies conducted on the A549 lung cancer cell line, due to the small number of samples, no statistical analysis was performed.

3. Results

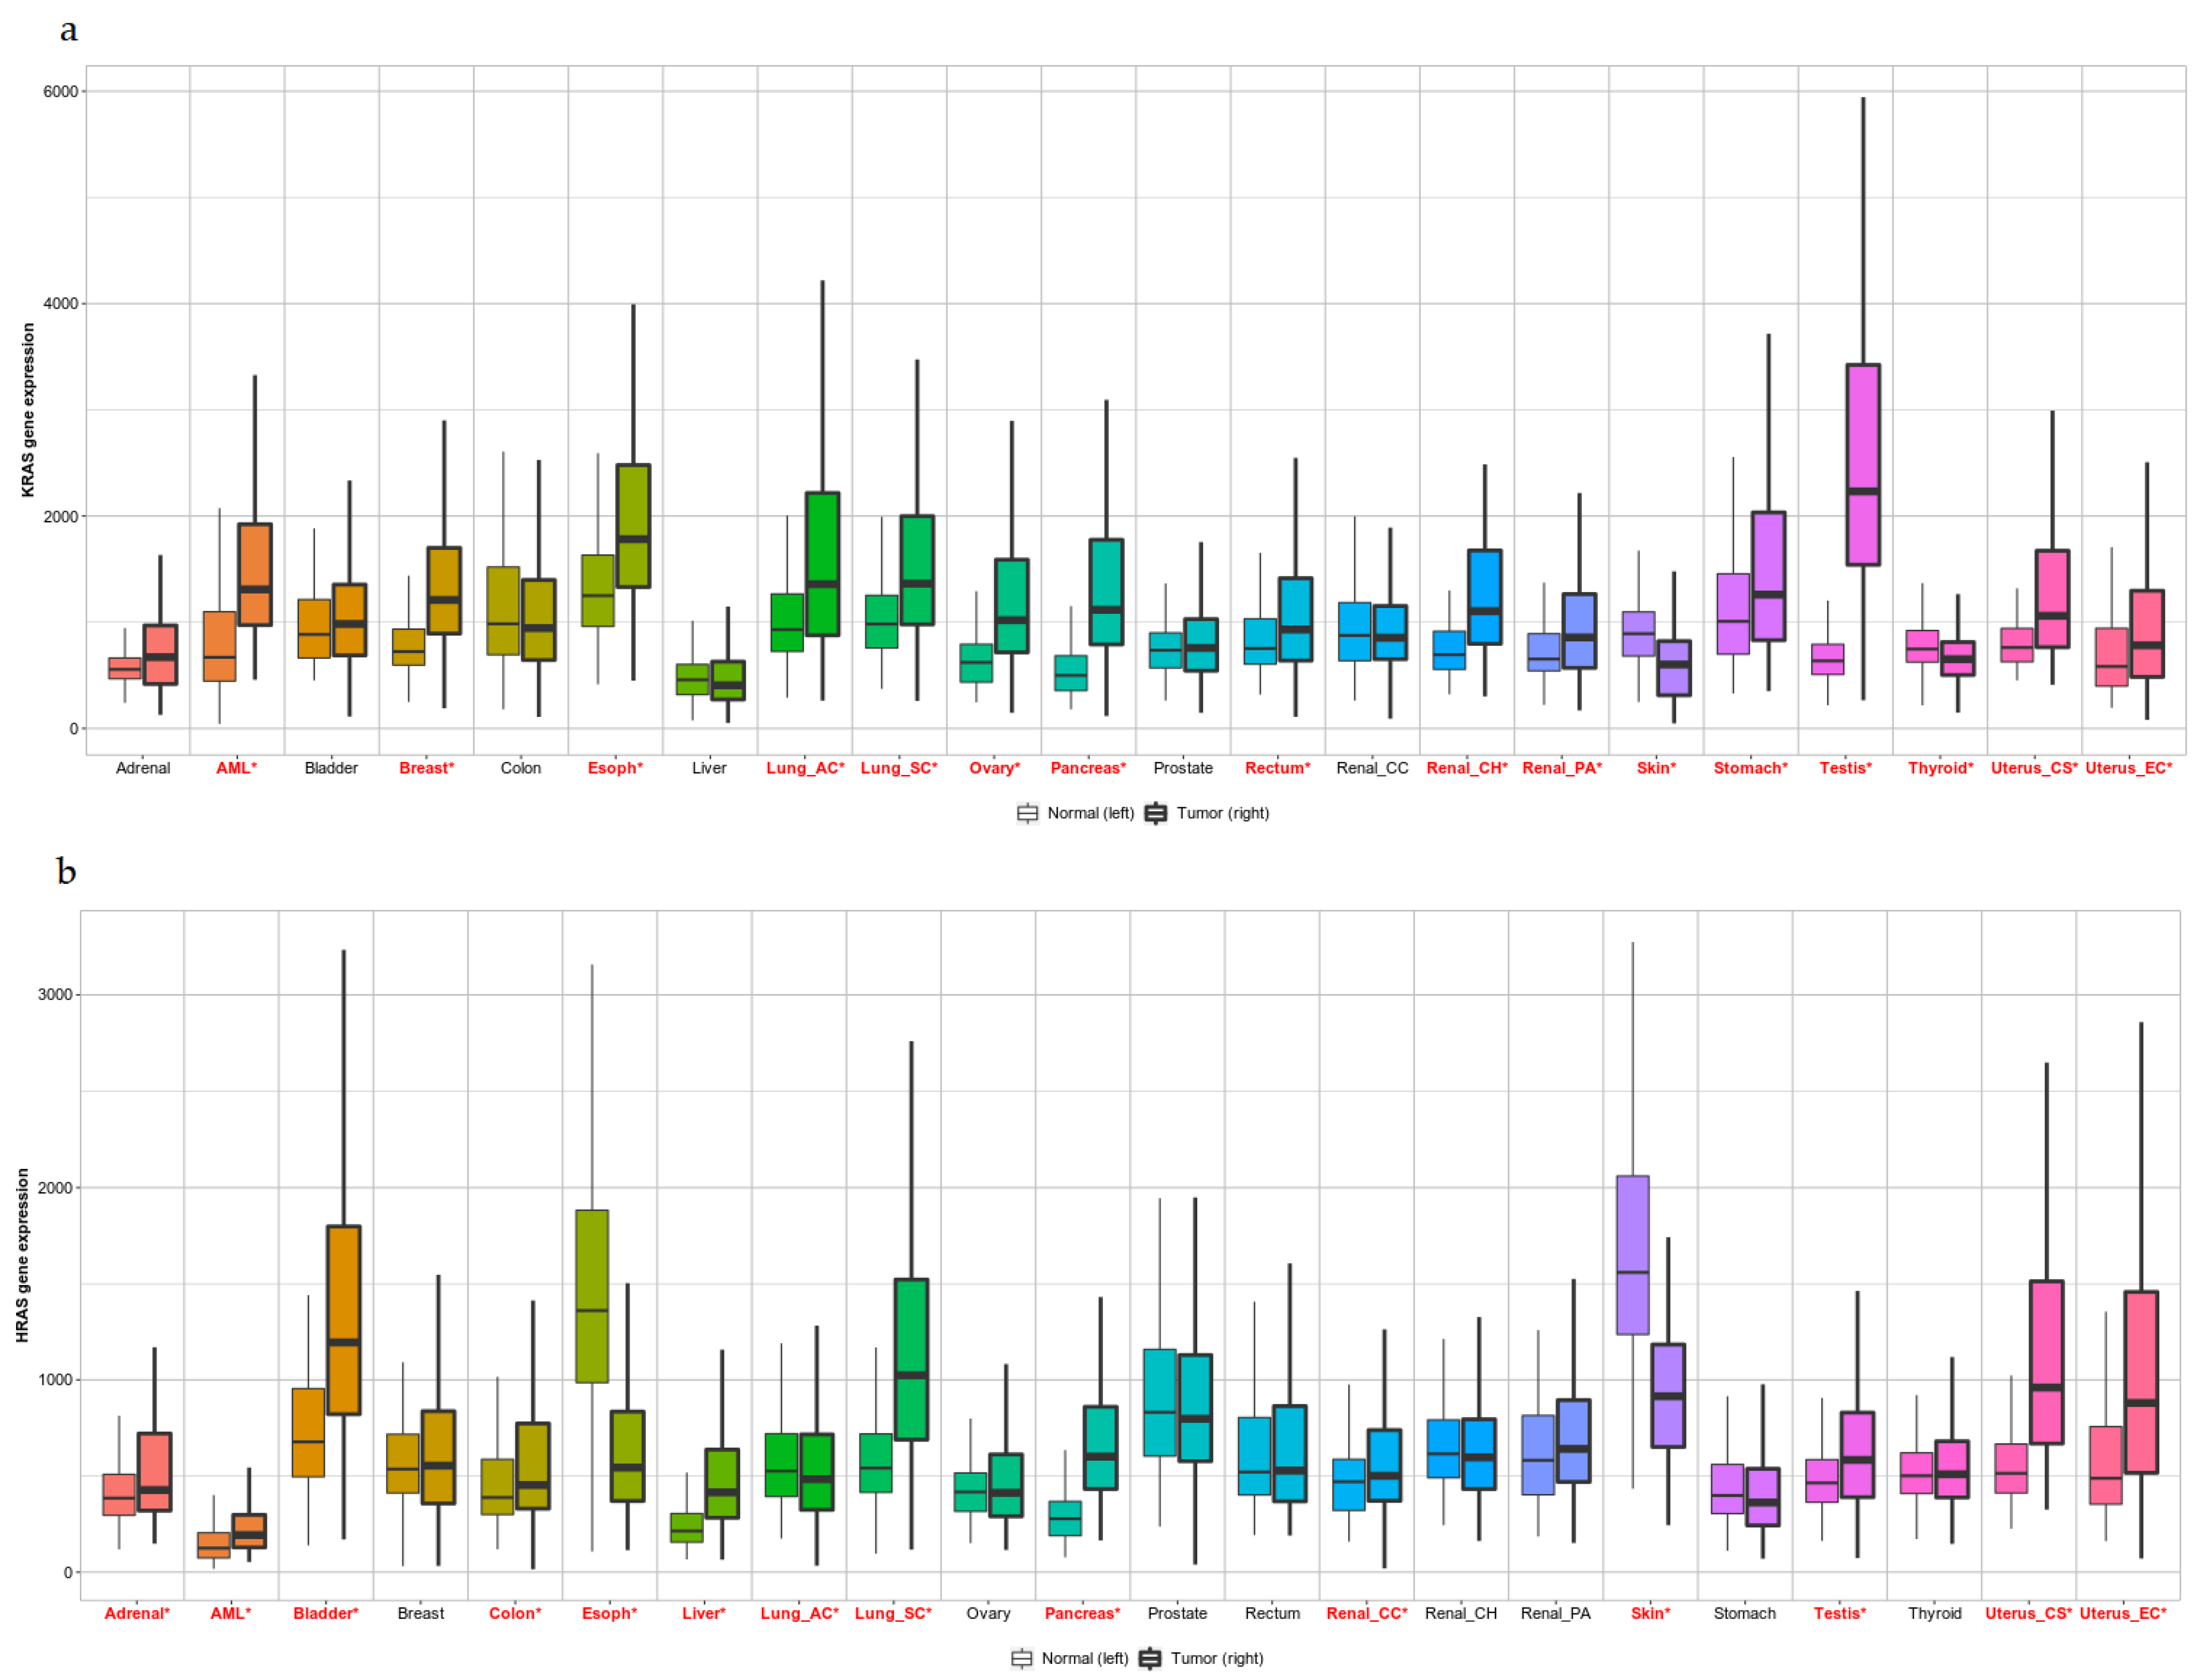
3.1. Pan-Cancer View of KRAS and HRAS Expression Levels

The differences of KRAS and HRAS expression in tumor and normal samples were presented in Figure 1. The results indicated that KRAS and HRAS expression levels in tumor tissues varied between human tumors. In most of the tumors, KRAS and HRAS were overexpressed compared to normal tissue. However, in some cases (i.e., esophagus, skin and lung adenocarcinoma), HRAS expression was significantly lower than in normal, whereas KRAS was downregulated, for example, in skin and thyroid cancers.

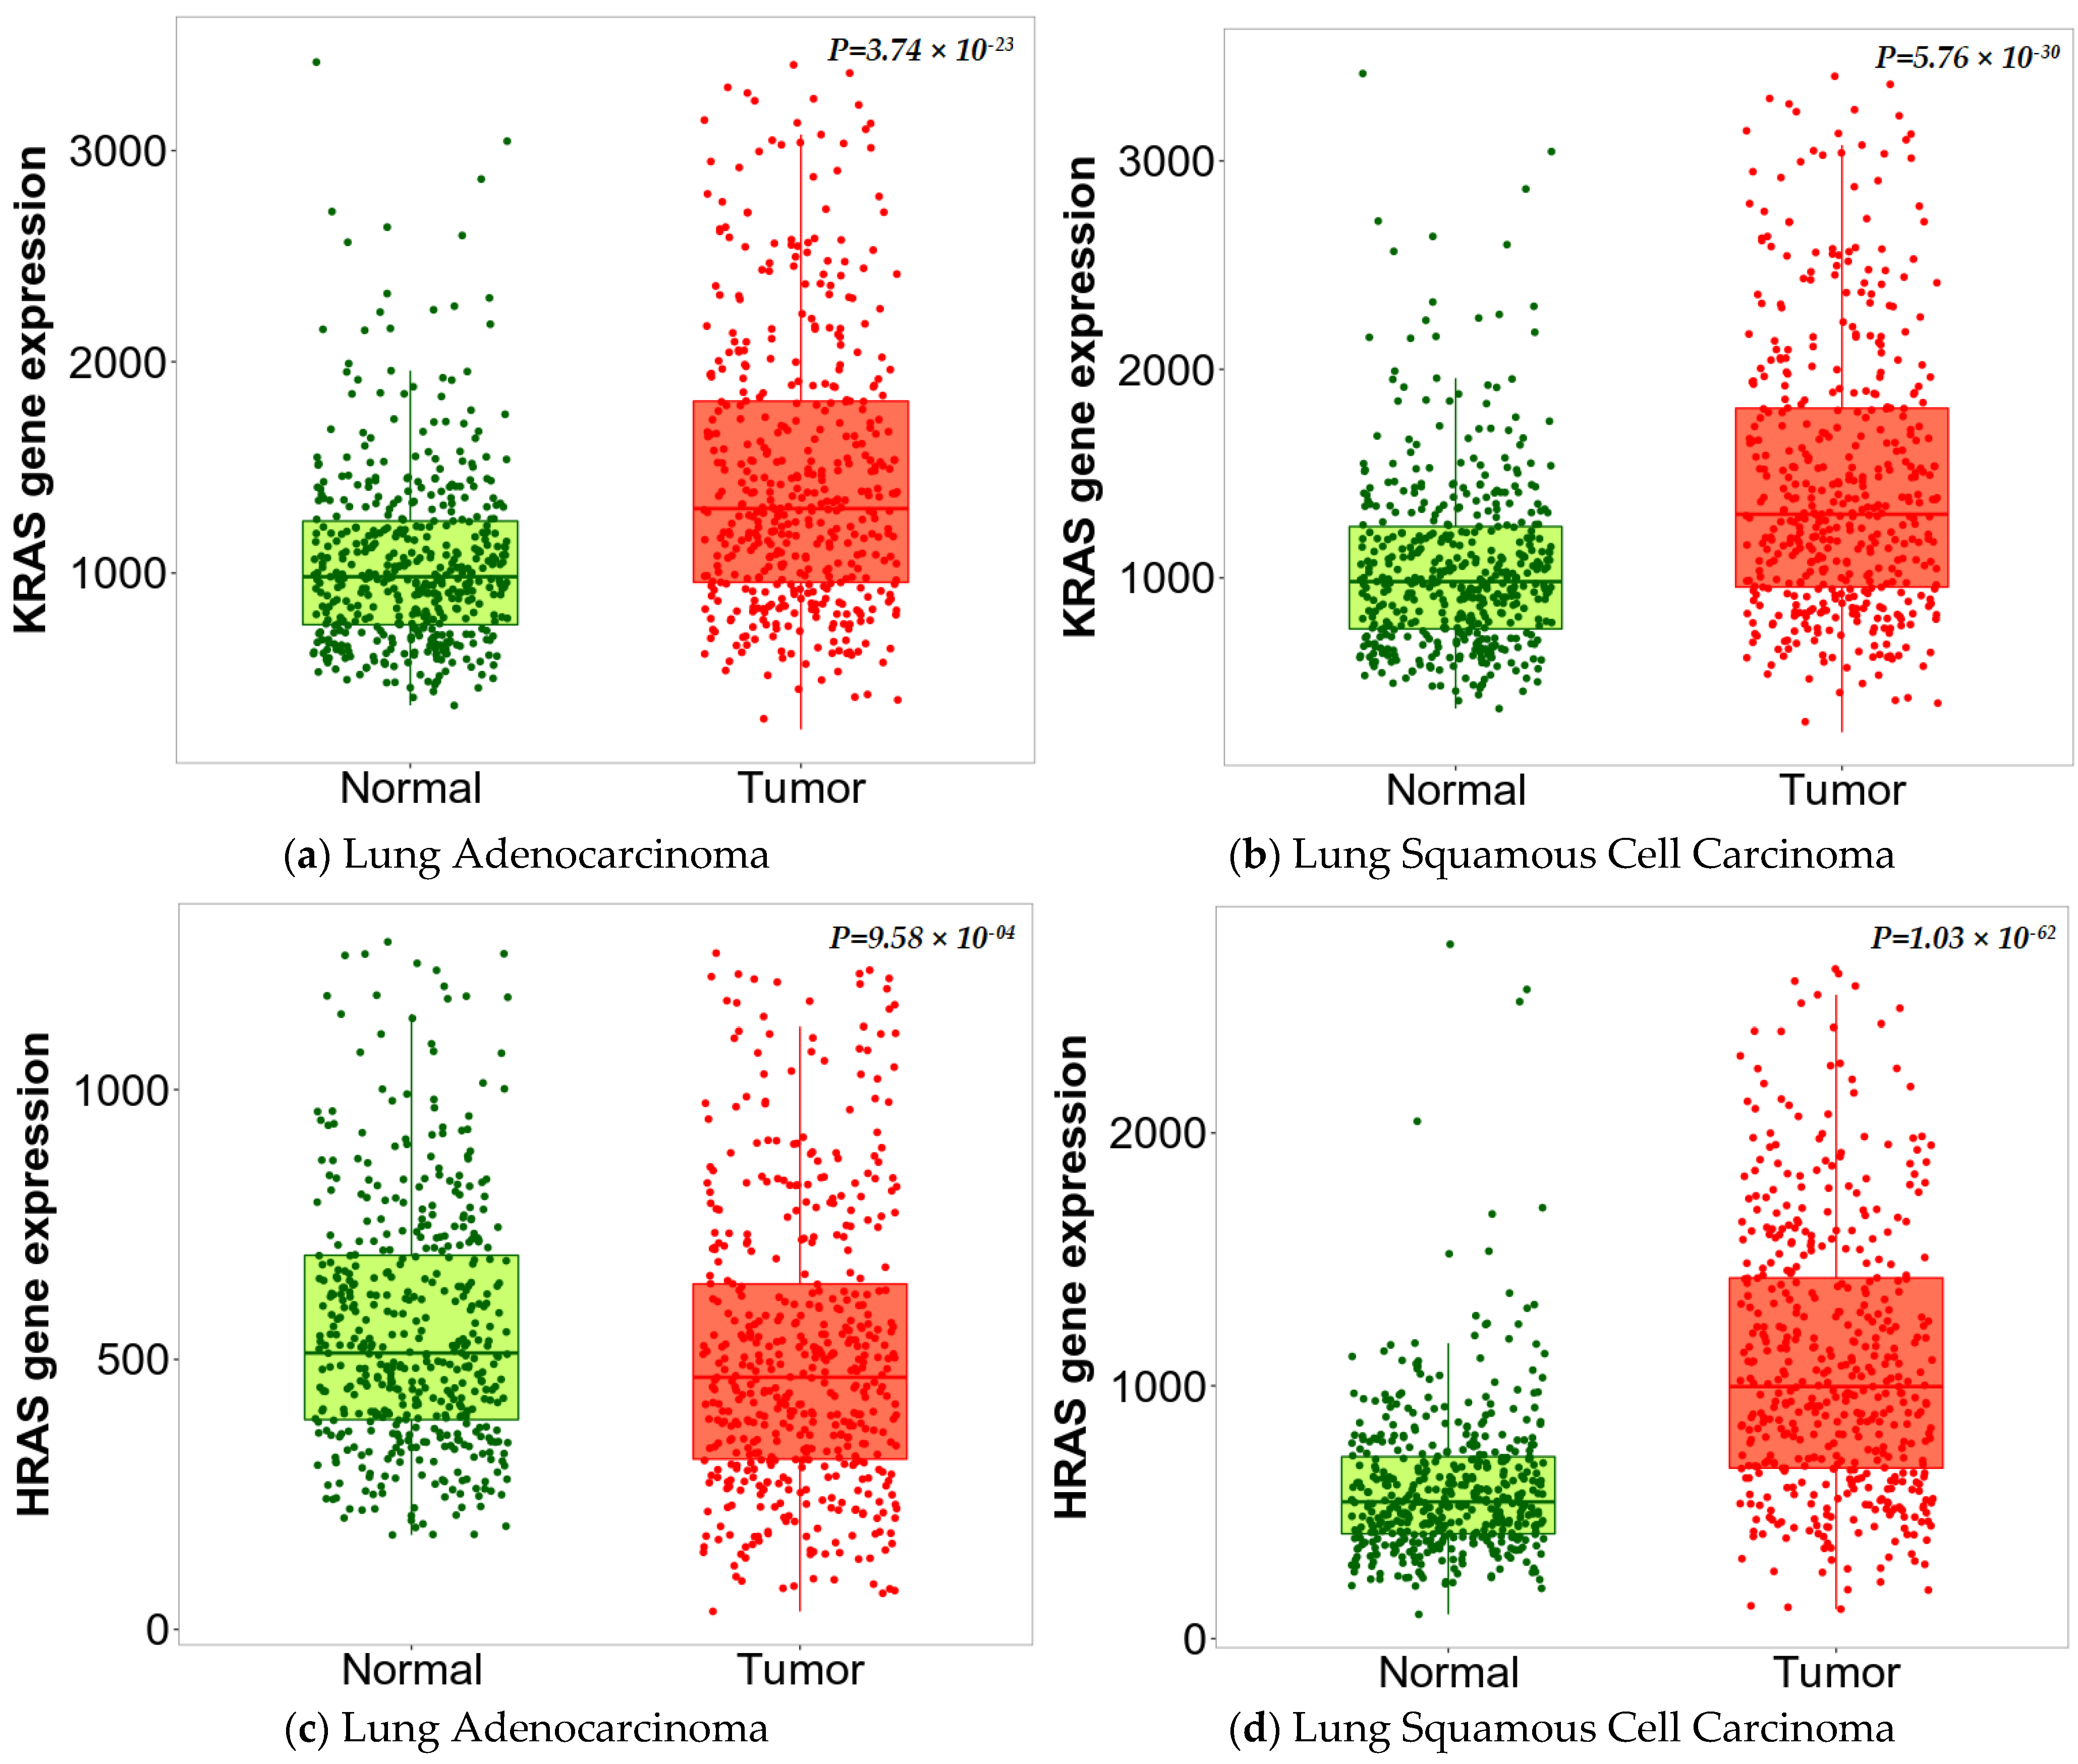
3.2. Expression of KRAS and HRAS Genes in NSCLC

Statistical analysis in the TNMplot database revealed that KRAS was highly expressed in lung adenocarcinoma in comparison with the normal samples from non-cancerous patients (tumor n = 524, normal n = 486) and the difference was statistically significant (p < 0.05), as presented in Figure 2a. The KRAS gene was also overexpressed in lung squamous cell carcinoma on the basis of analysis 476 normal and 501 tumor samples (p < 0.05) (Figure 2b).
As it was shown in Figure 2c, the HRAS gene expression level in LUAD samples (n = 524) was lower than in normal tissue (n = 486), with a statistical significance of p < 0.05. On the contrary, HRAS in LUSC was overexpressed compared to non-cancerous patients (tumor n = 501, normal n = 476) and this difference was statistically significant (p < 0.05) (Figure 2d). Detailed statistical values of the above-mentioned analyses are contained in Supplementary Table S1.

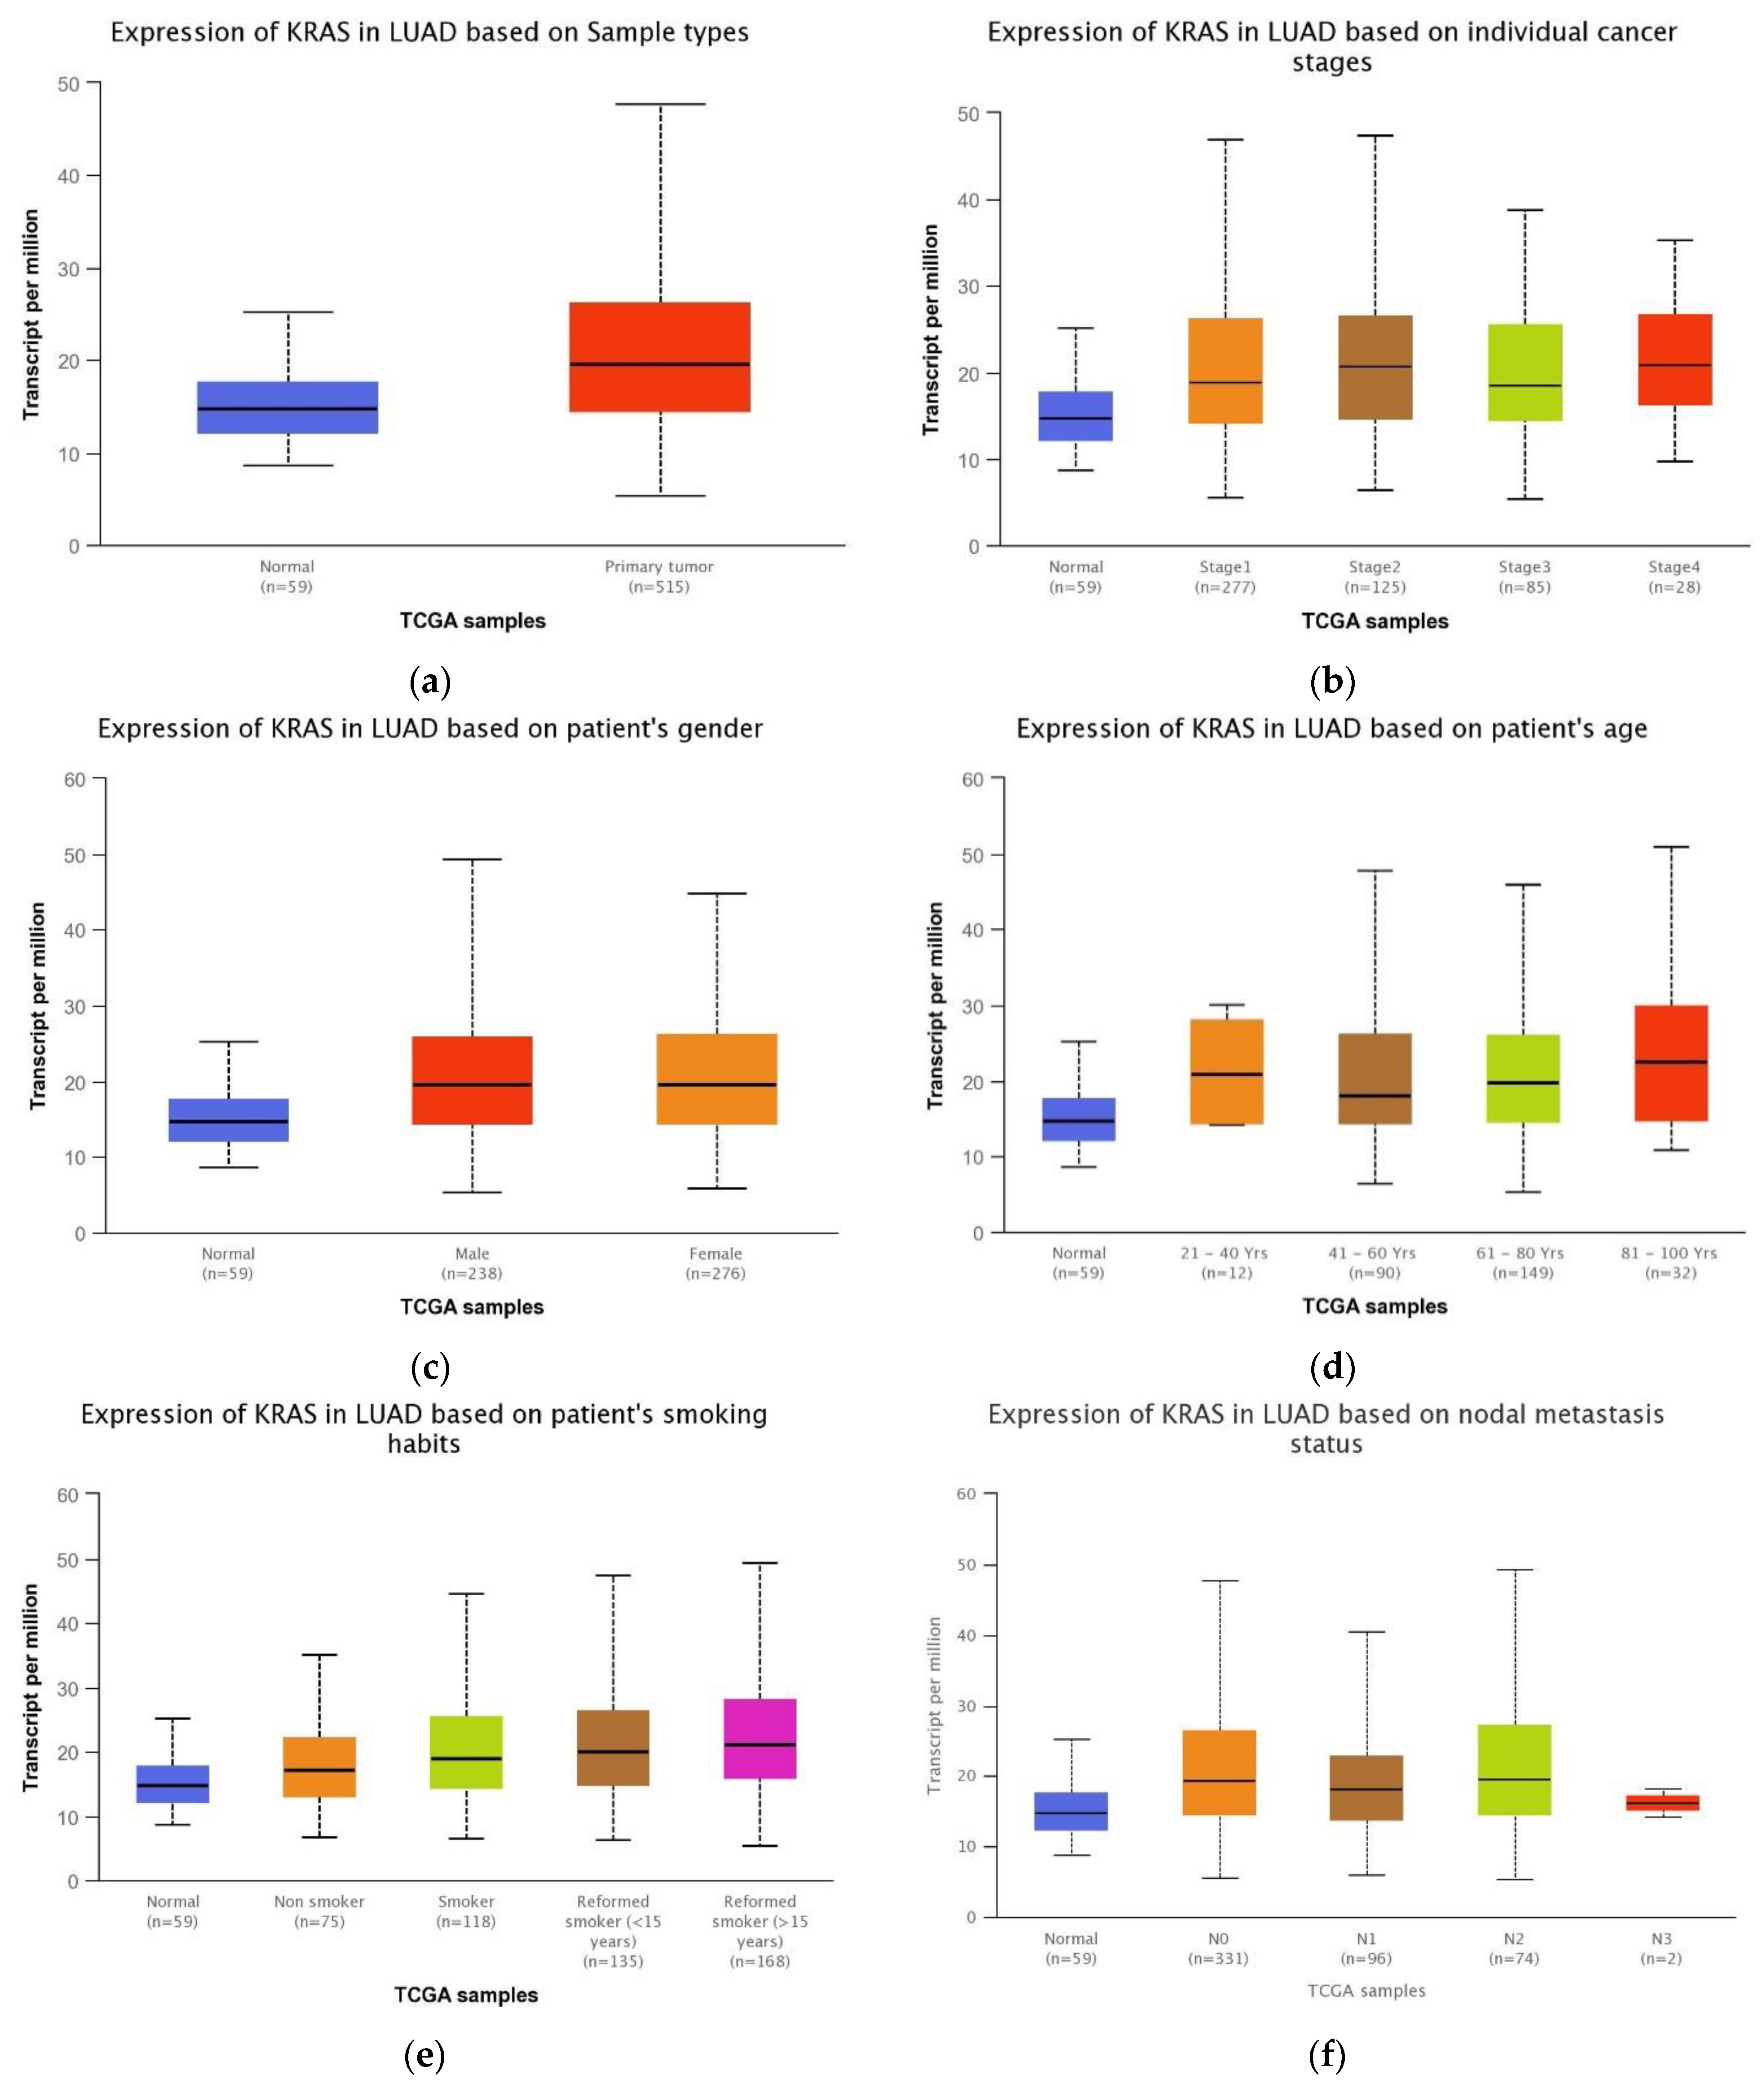
3.3. Association between the KRAS Expression and LUAD Patient Clinical Features

The relationships between KRAS gene expression and the clinical characteristics and demographic status LUAD patients were determined from the UALCAN database (Figure 3). Firstly, expression of KRAS was found to be higher in tumor samples (n = 515) than in normal tissue (n = 59) (p = 7.88 × 10⁻¹³). KRAS expression level was also found to be significantly higher in all cancer stages than in normal samples (p < 0.05). KRAS was overexpressed in both men and women compared to non-cancerous samples (p < 0.05). Moreover, significantly higher KRAS expression was noted among all age groups except for 21–40 years in LUAD samples. Figure 3e shows KRAS expression for current smokers, reformed smokers, and non-smoker.
KRAS expression was also strongly associated with smoking status, regardless of the time that they had stopped smoking before the diagnosis or of whether they were active smokers. Significant differences in expression levels were found between normal vs. non-smoker, normal vs. smoker, normal vs. reformed (according to their duration of abstinence and time of diagnosis of cancer >15 and ≤15 years). Differences were also found between non-smokers vs. the above-mentioned subgroups (p < 0.05). Regarding metastatic potential, KRAS showed overexpression in N0 to N2 of the nodal metastasis status group in LUAD patients (p < 0.05). However, the association between the expression level of KRAS and N3 lymph node metastatic groups was not statistically significant (p = 0.79). The statistical analyses are presented in Supplementary Table S1.

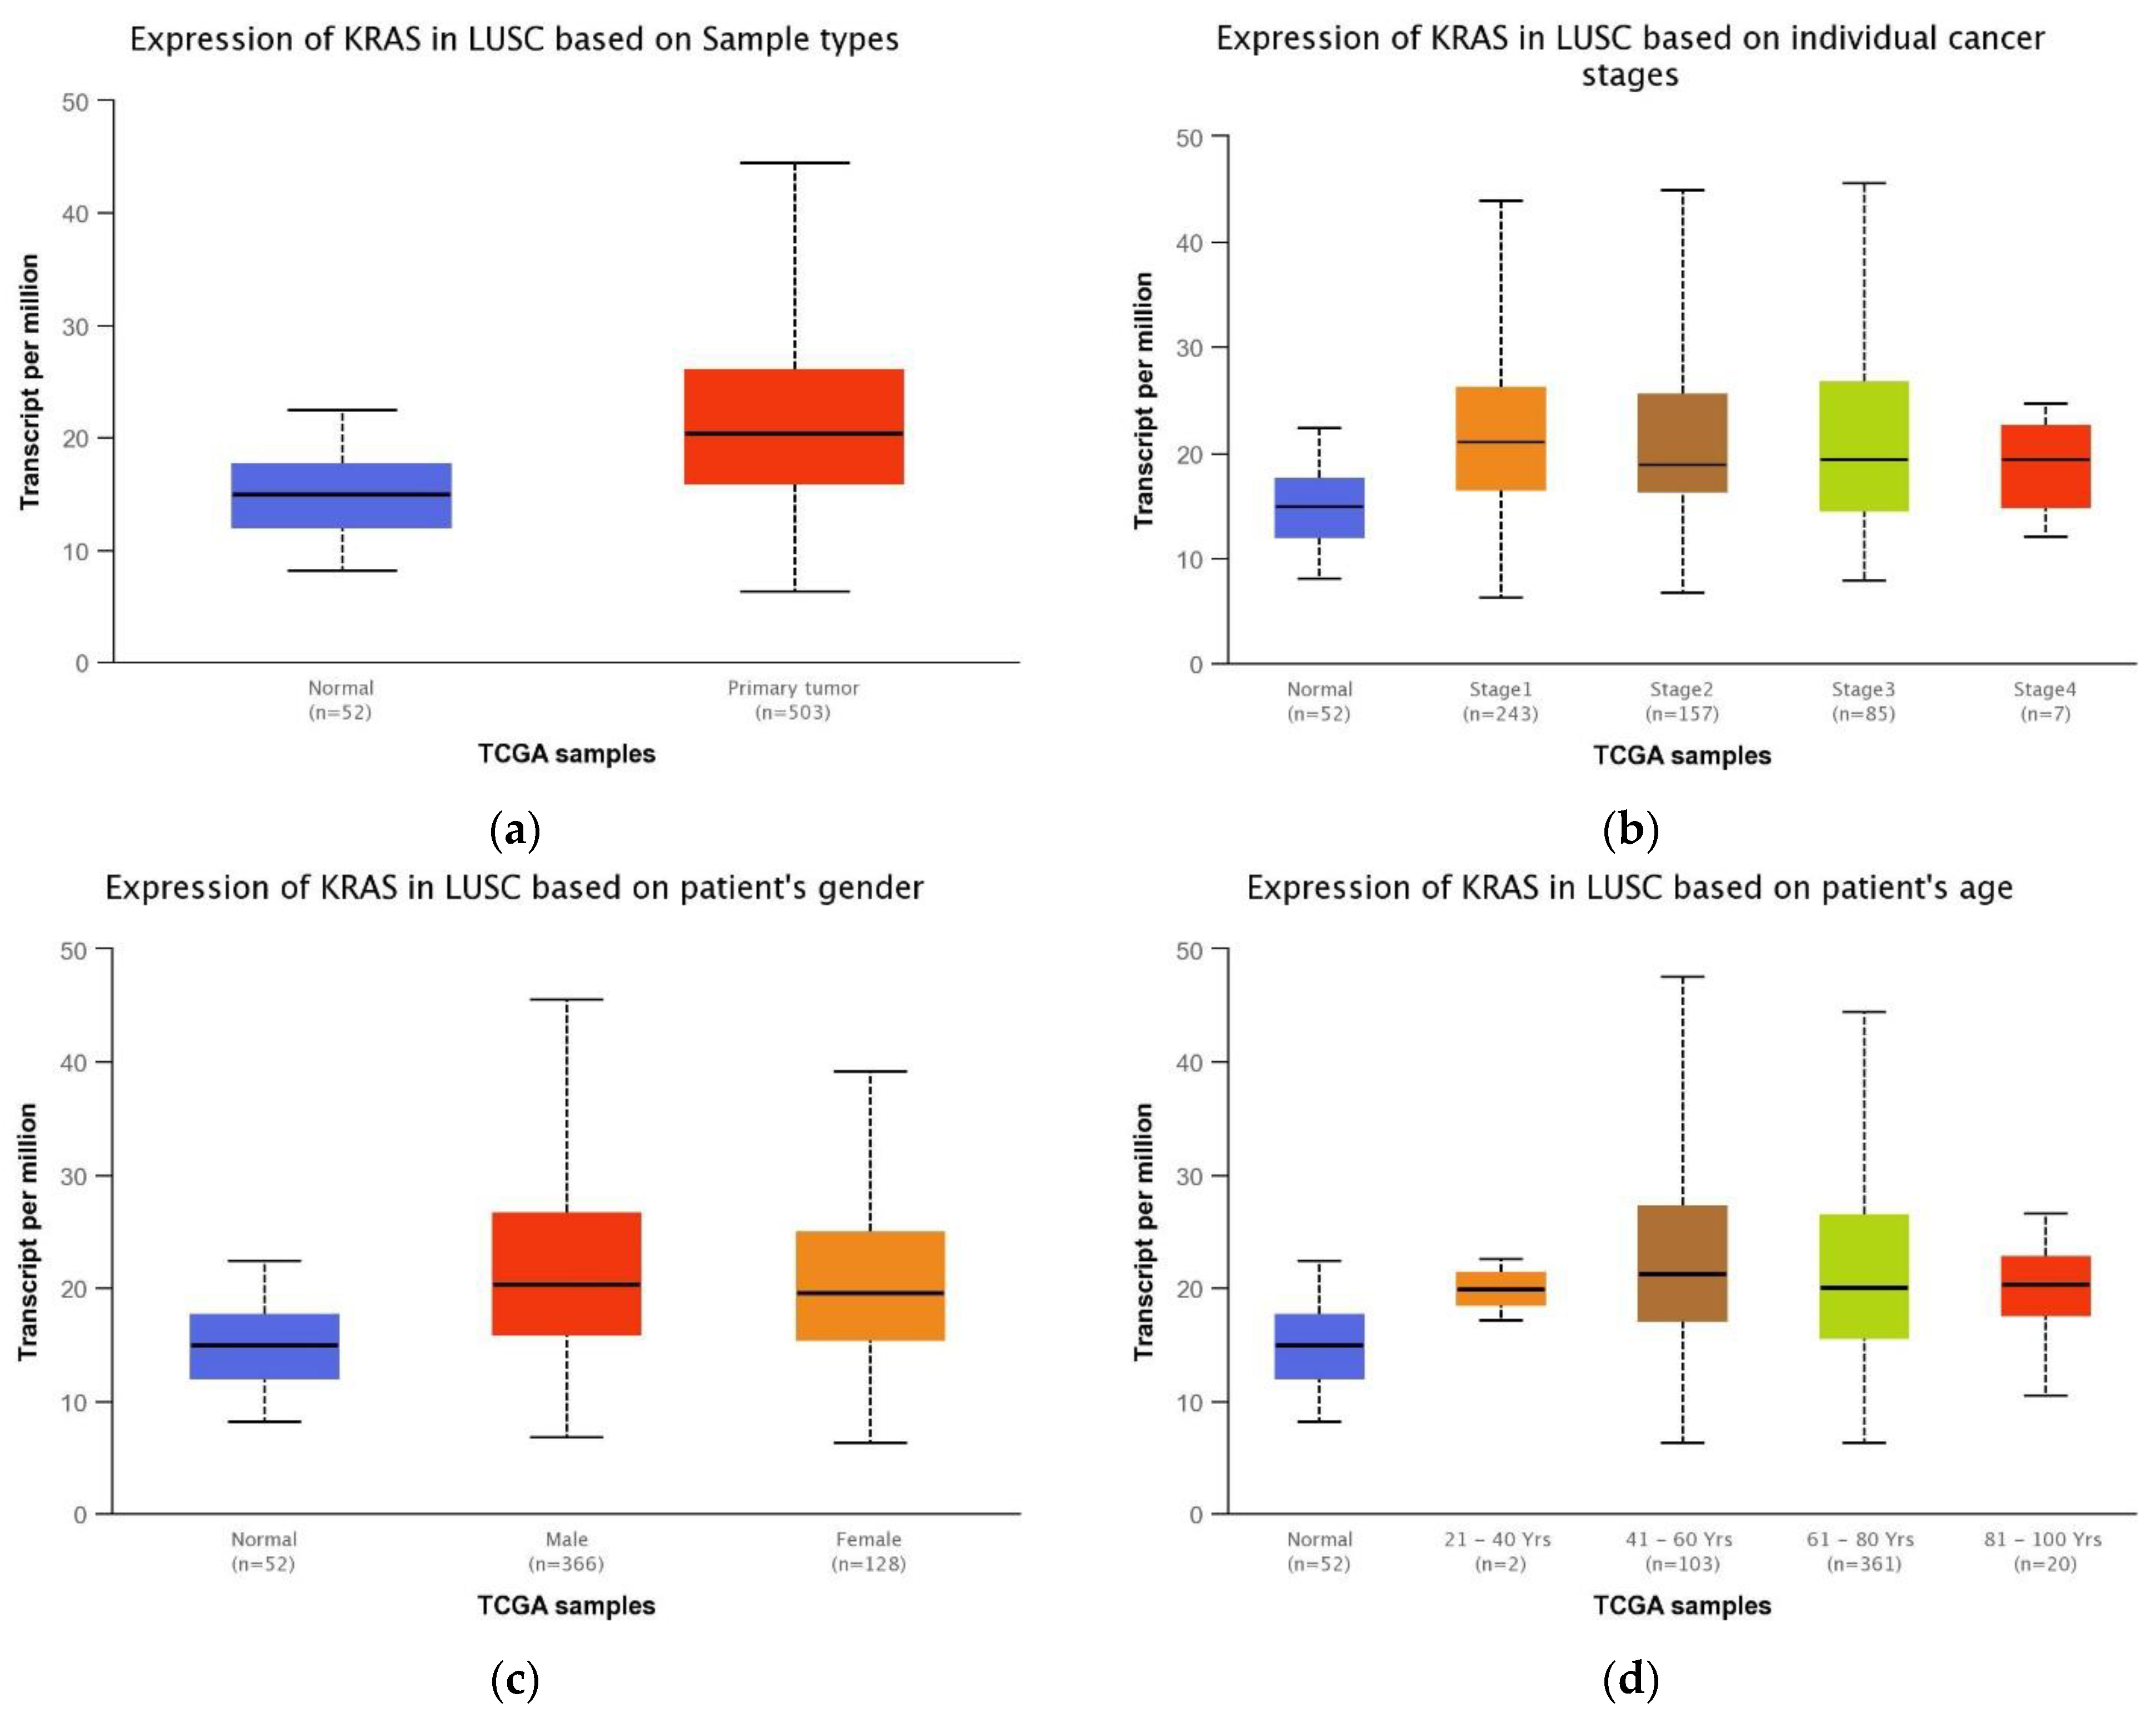
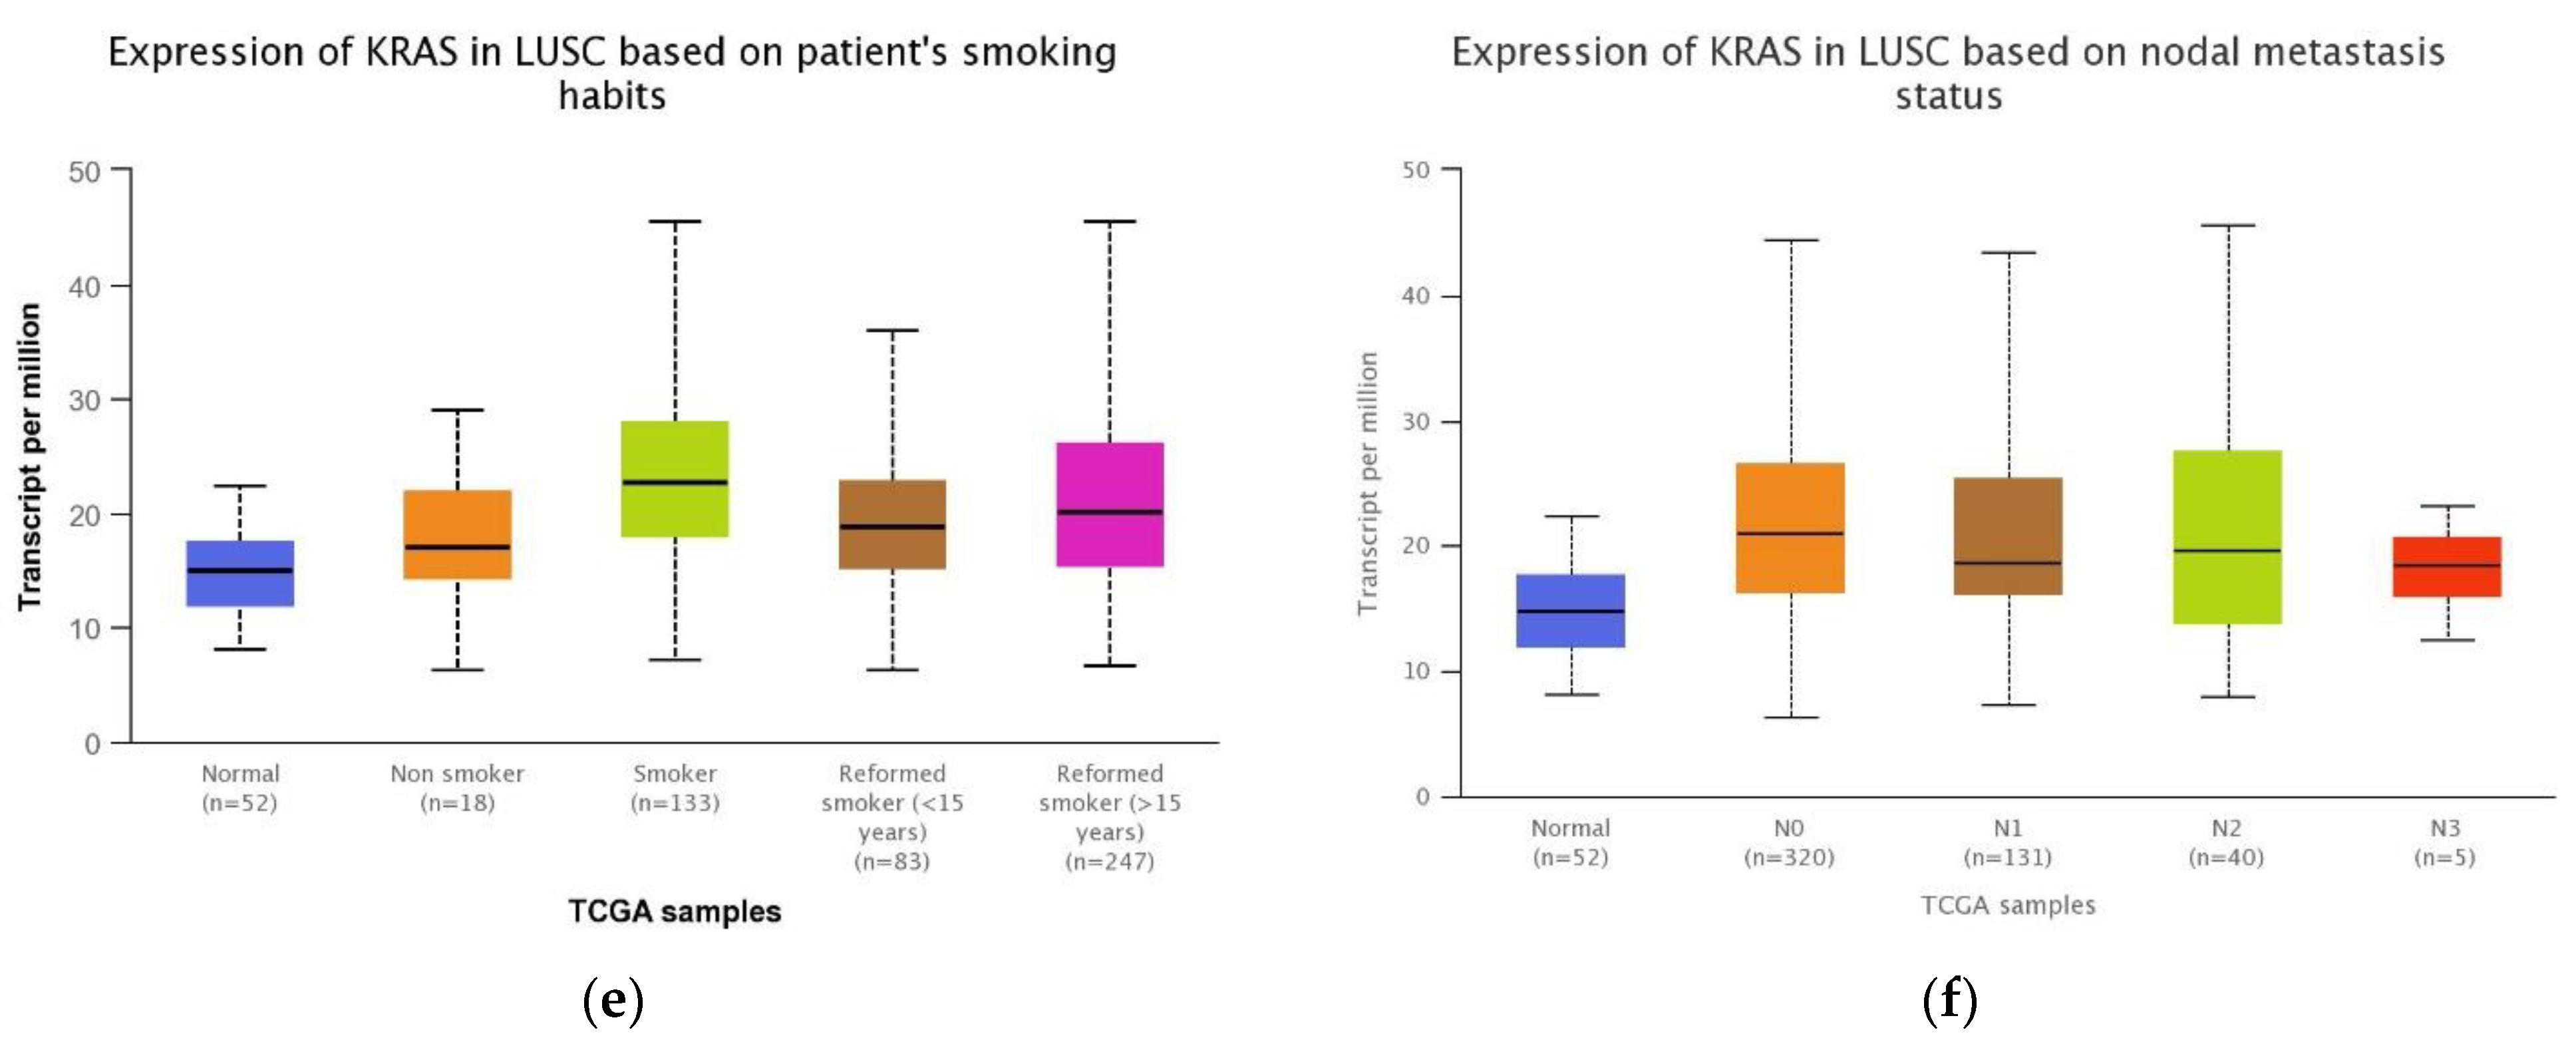
3.4. Association between the KRAS Gene Expression and Clinical Features in LUSC Patients

The statistical significance of KRAS gene expression in LUSC patients with regard to clinical characteristics and demographic status was evaluated on the basis of the UALCAN database (Figure 4). KRAS gene expression was markedly increased in tumor tissues (n = 503) compared to normal tissues (n = 52) (p < 1 × 10⁻¹²). The same trends in KRAS expression were obtained as in LUAD patients. It was found that KRAS was overexpressed in all cancer stages, in patients older than 40 years, in smokers and in N0 to N2 of the nodal metastasis status group (p < 0.05). Moreover, KRAS was significantly higher in men than women (p = 0.0012). These findings are shown in Figure 4 and Supplementary Table S1.

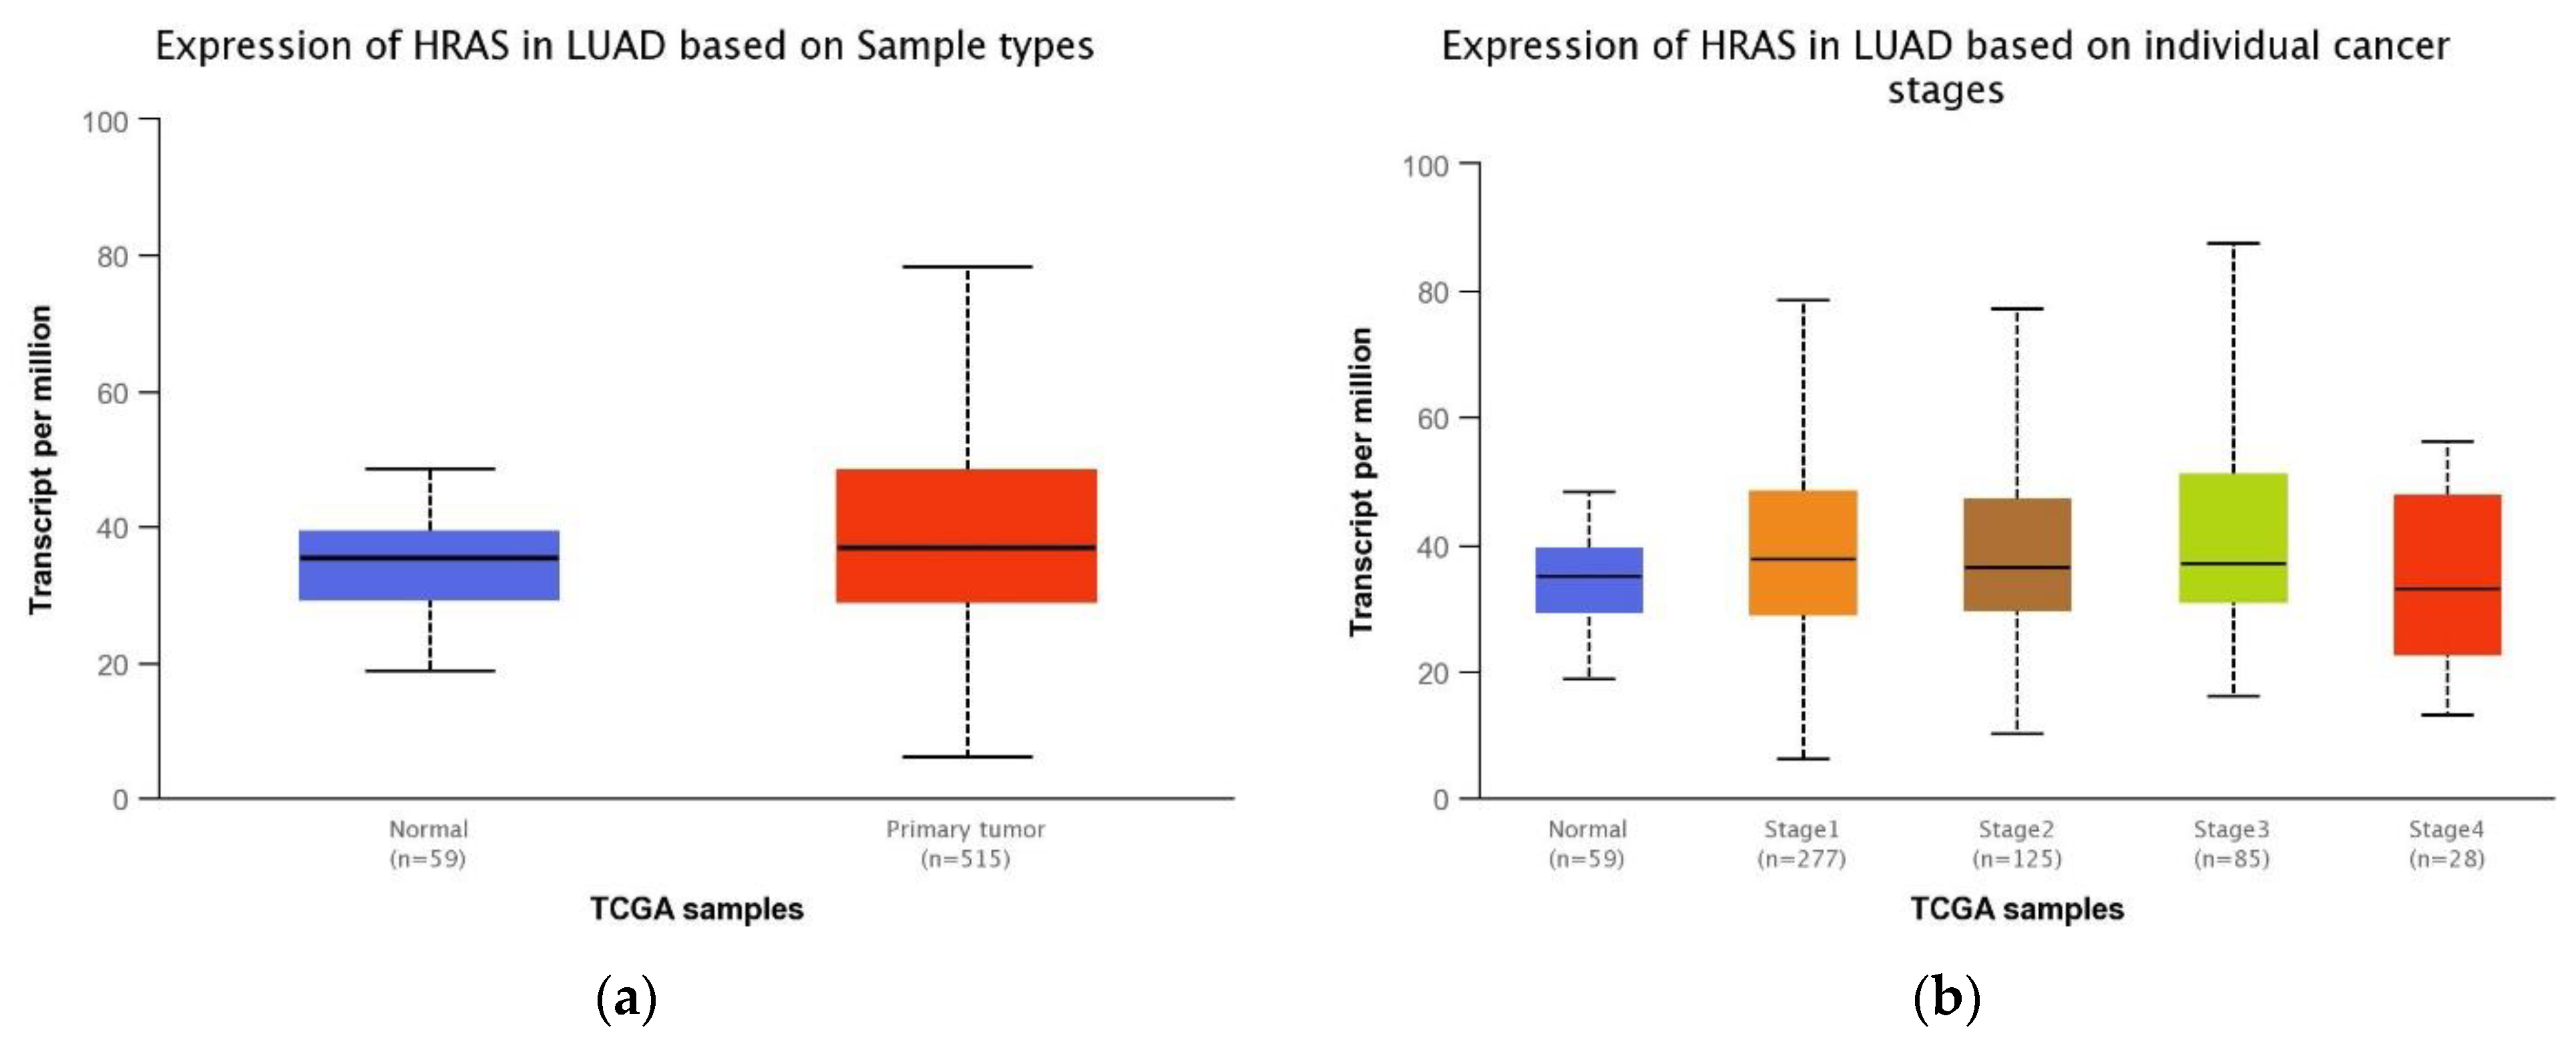
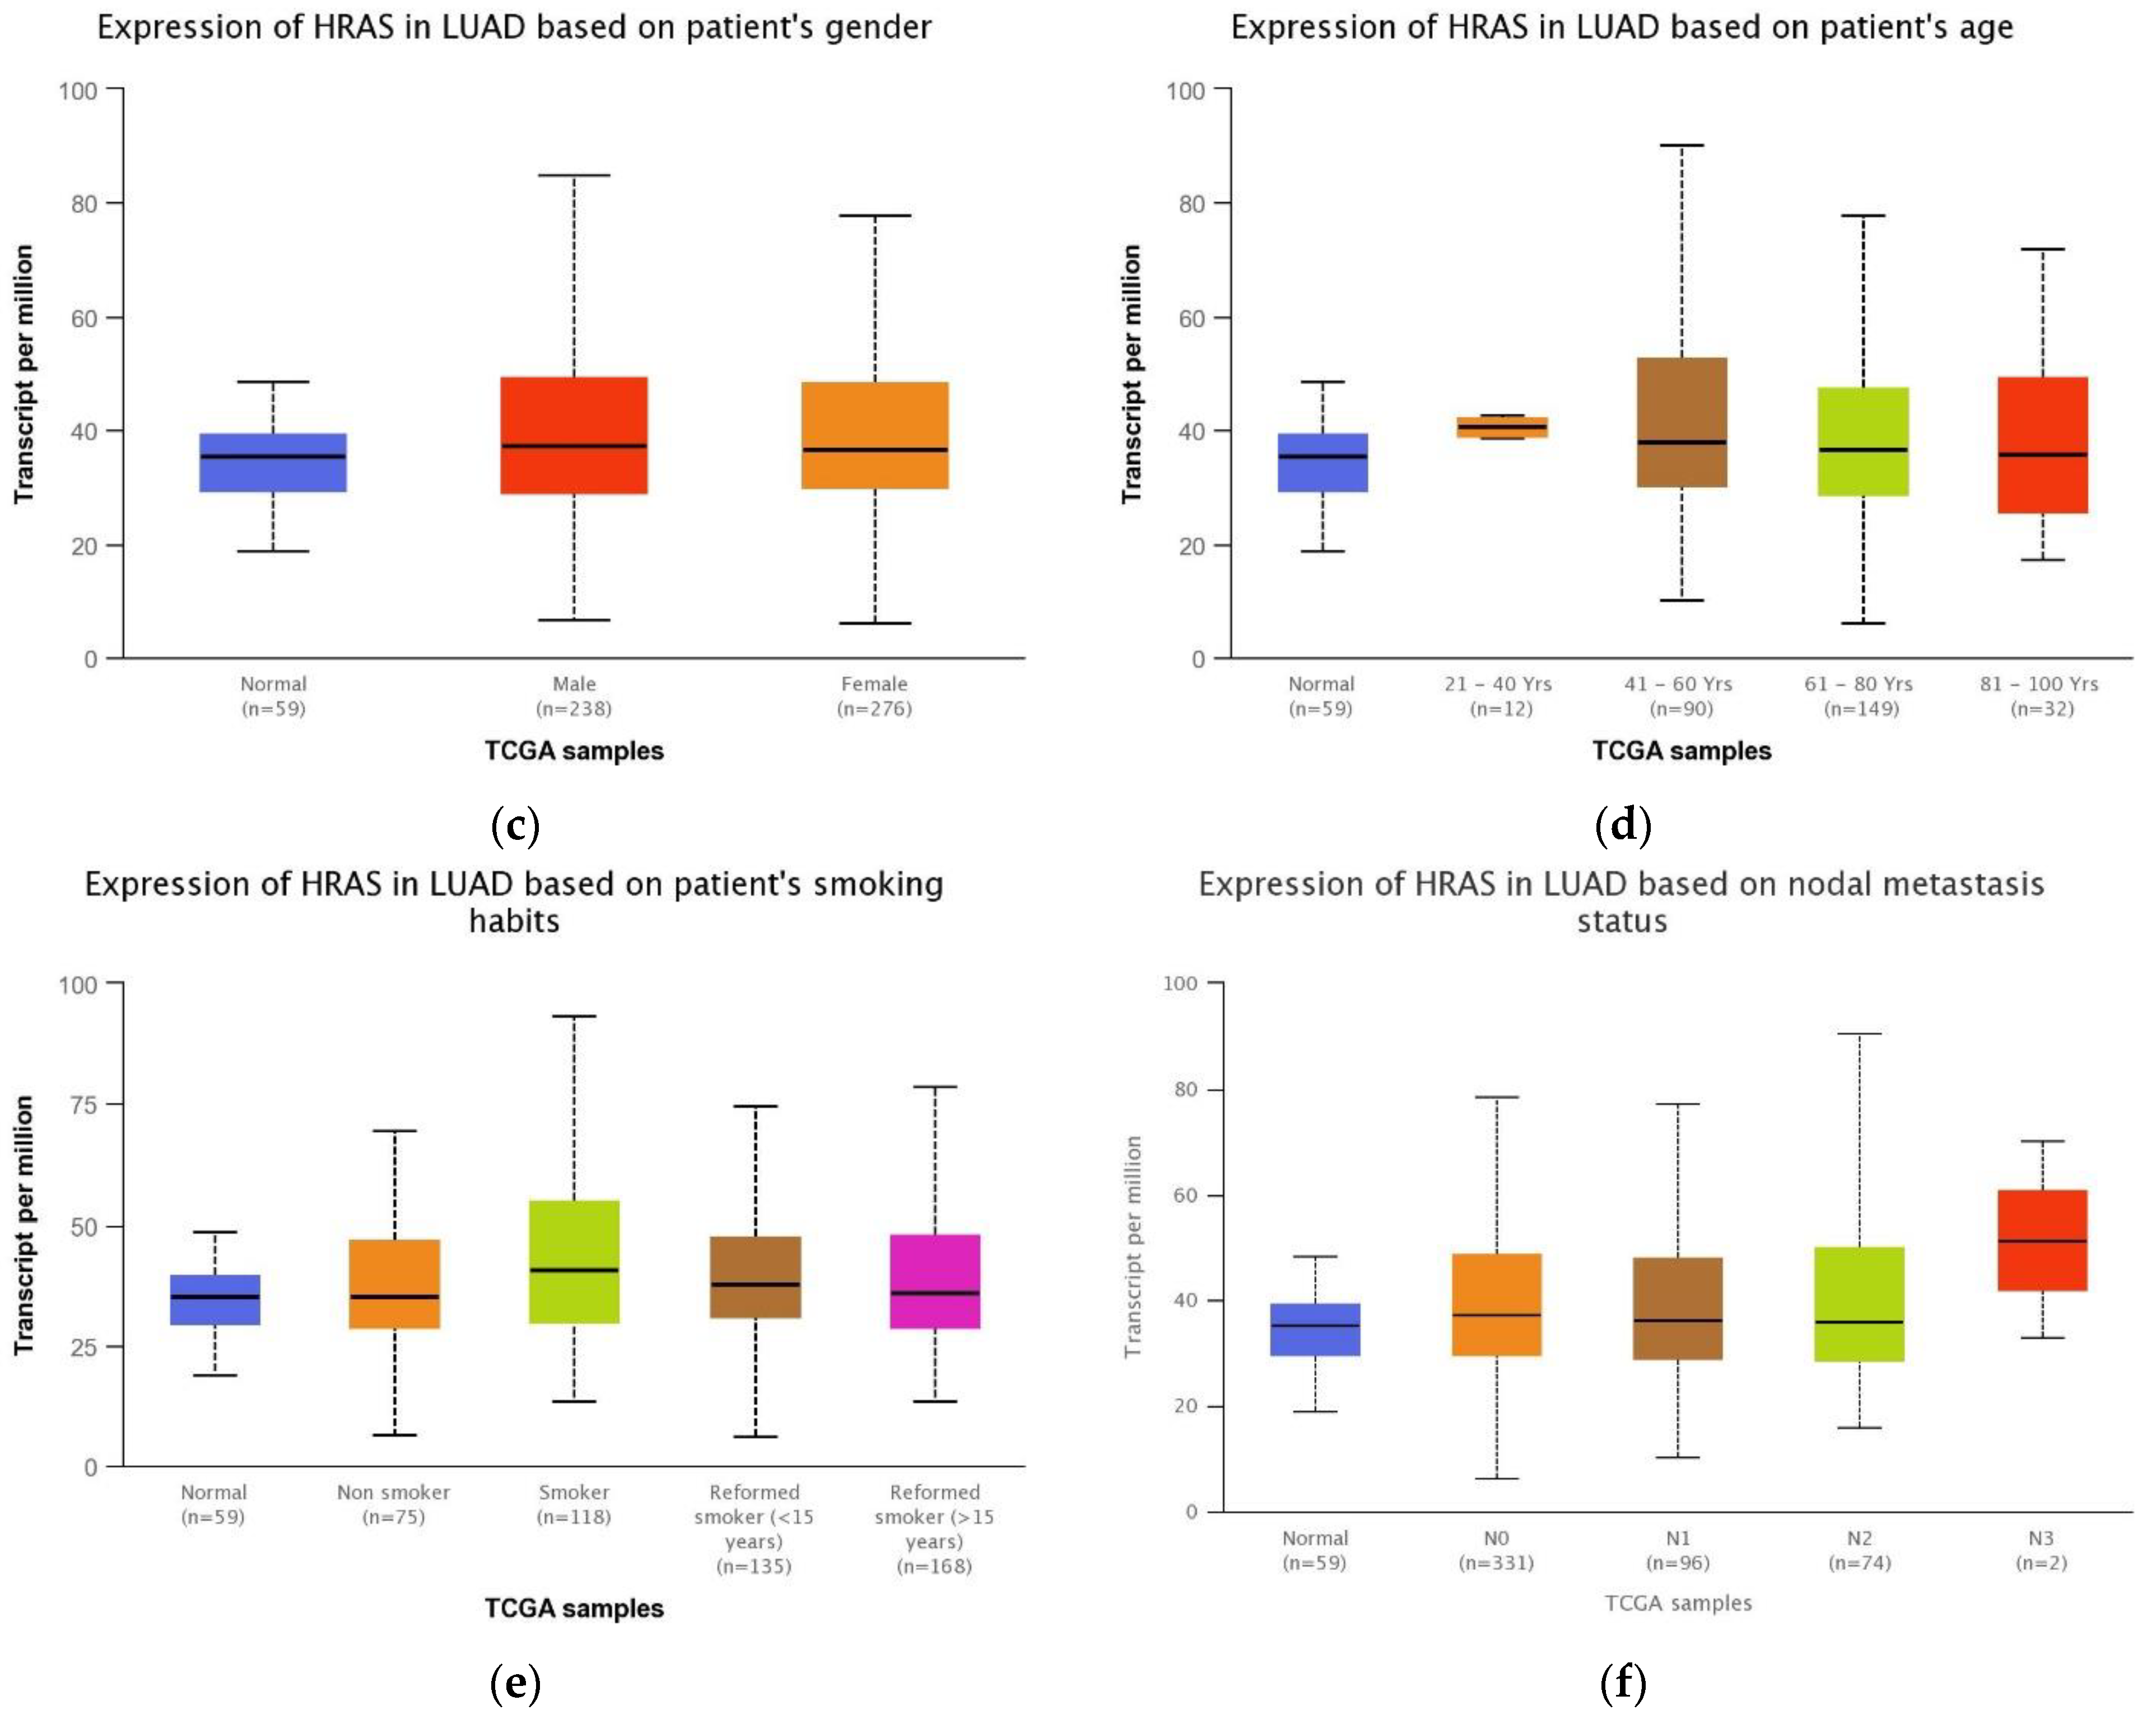
3.5. Association between HRAS Gene Expression and Clinical Features of LUAD Patients

Differences in HRAS expression between LUAD (n = 515) and non-tumor tissues (n = 59) were compared using the UALCAN server. HRAS expression was found to be slightly higher in tumors than in normal samples (p = 6.32 × 10⁻⁹). HRAS was significantly overexpressed at stages 1–3 of LUAD but not at the most advanced stage compared to non-cancerous patients (p < 0.05 and p = 0.2, respectively). The up-regulation of HRAS mRNA in lung adenocarcinoma was associated with sex and smoking habits (p < 0.05). Moreover, HRAS showed a significant increase in expression in LUAD tissues at age 41–80 years (p < 0.05); however, it was not found to be significant in groups aged <40 and >81 years, although the level remained above that of normal lung tissue (p = 0.09 and 0.2, respectively). Statistically significant differences were observed in N0 to N2 lymph node metastatic groups but not for the most advanced lymph node metastatic subgroup (Figure 5 and Supplementary Table S1).

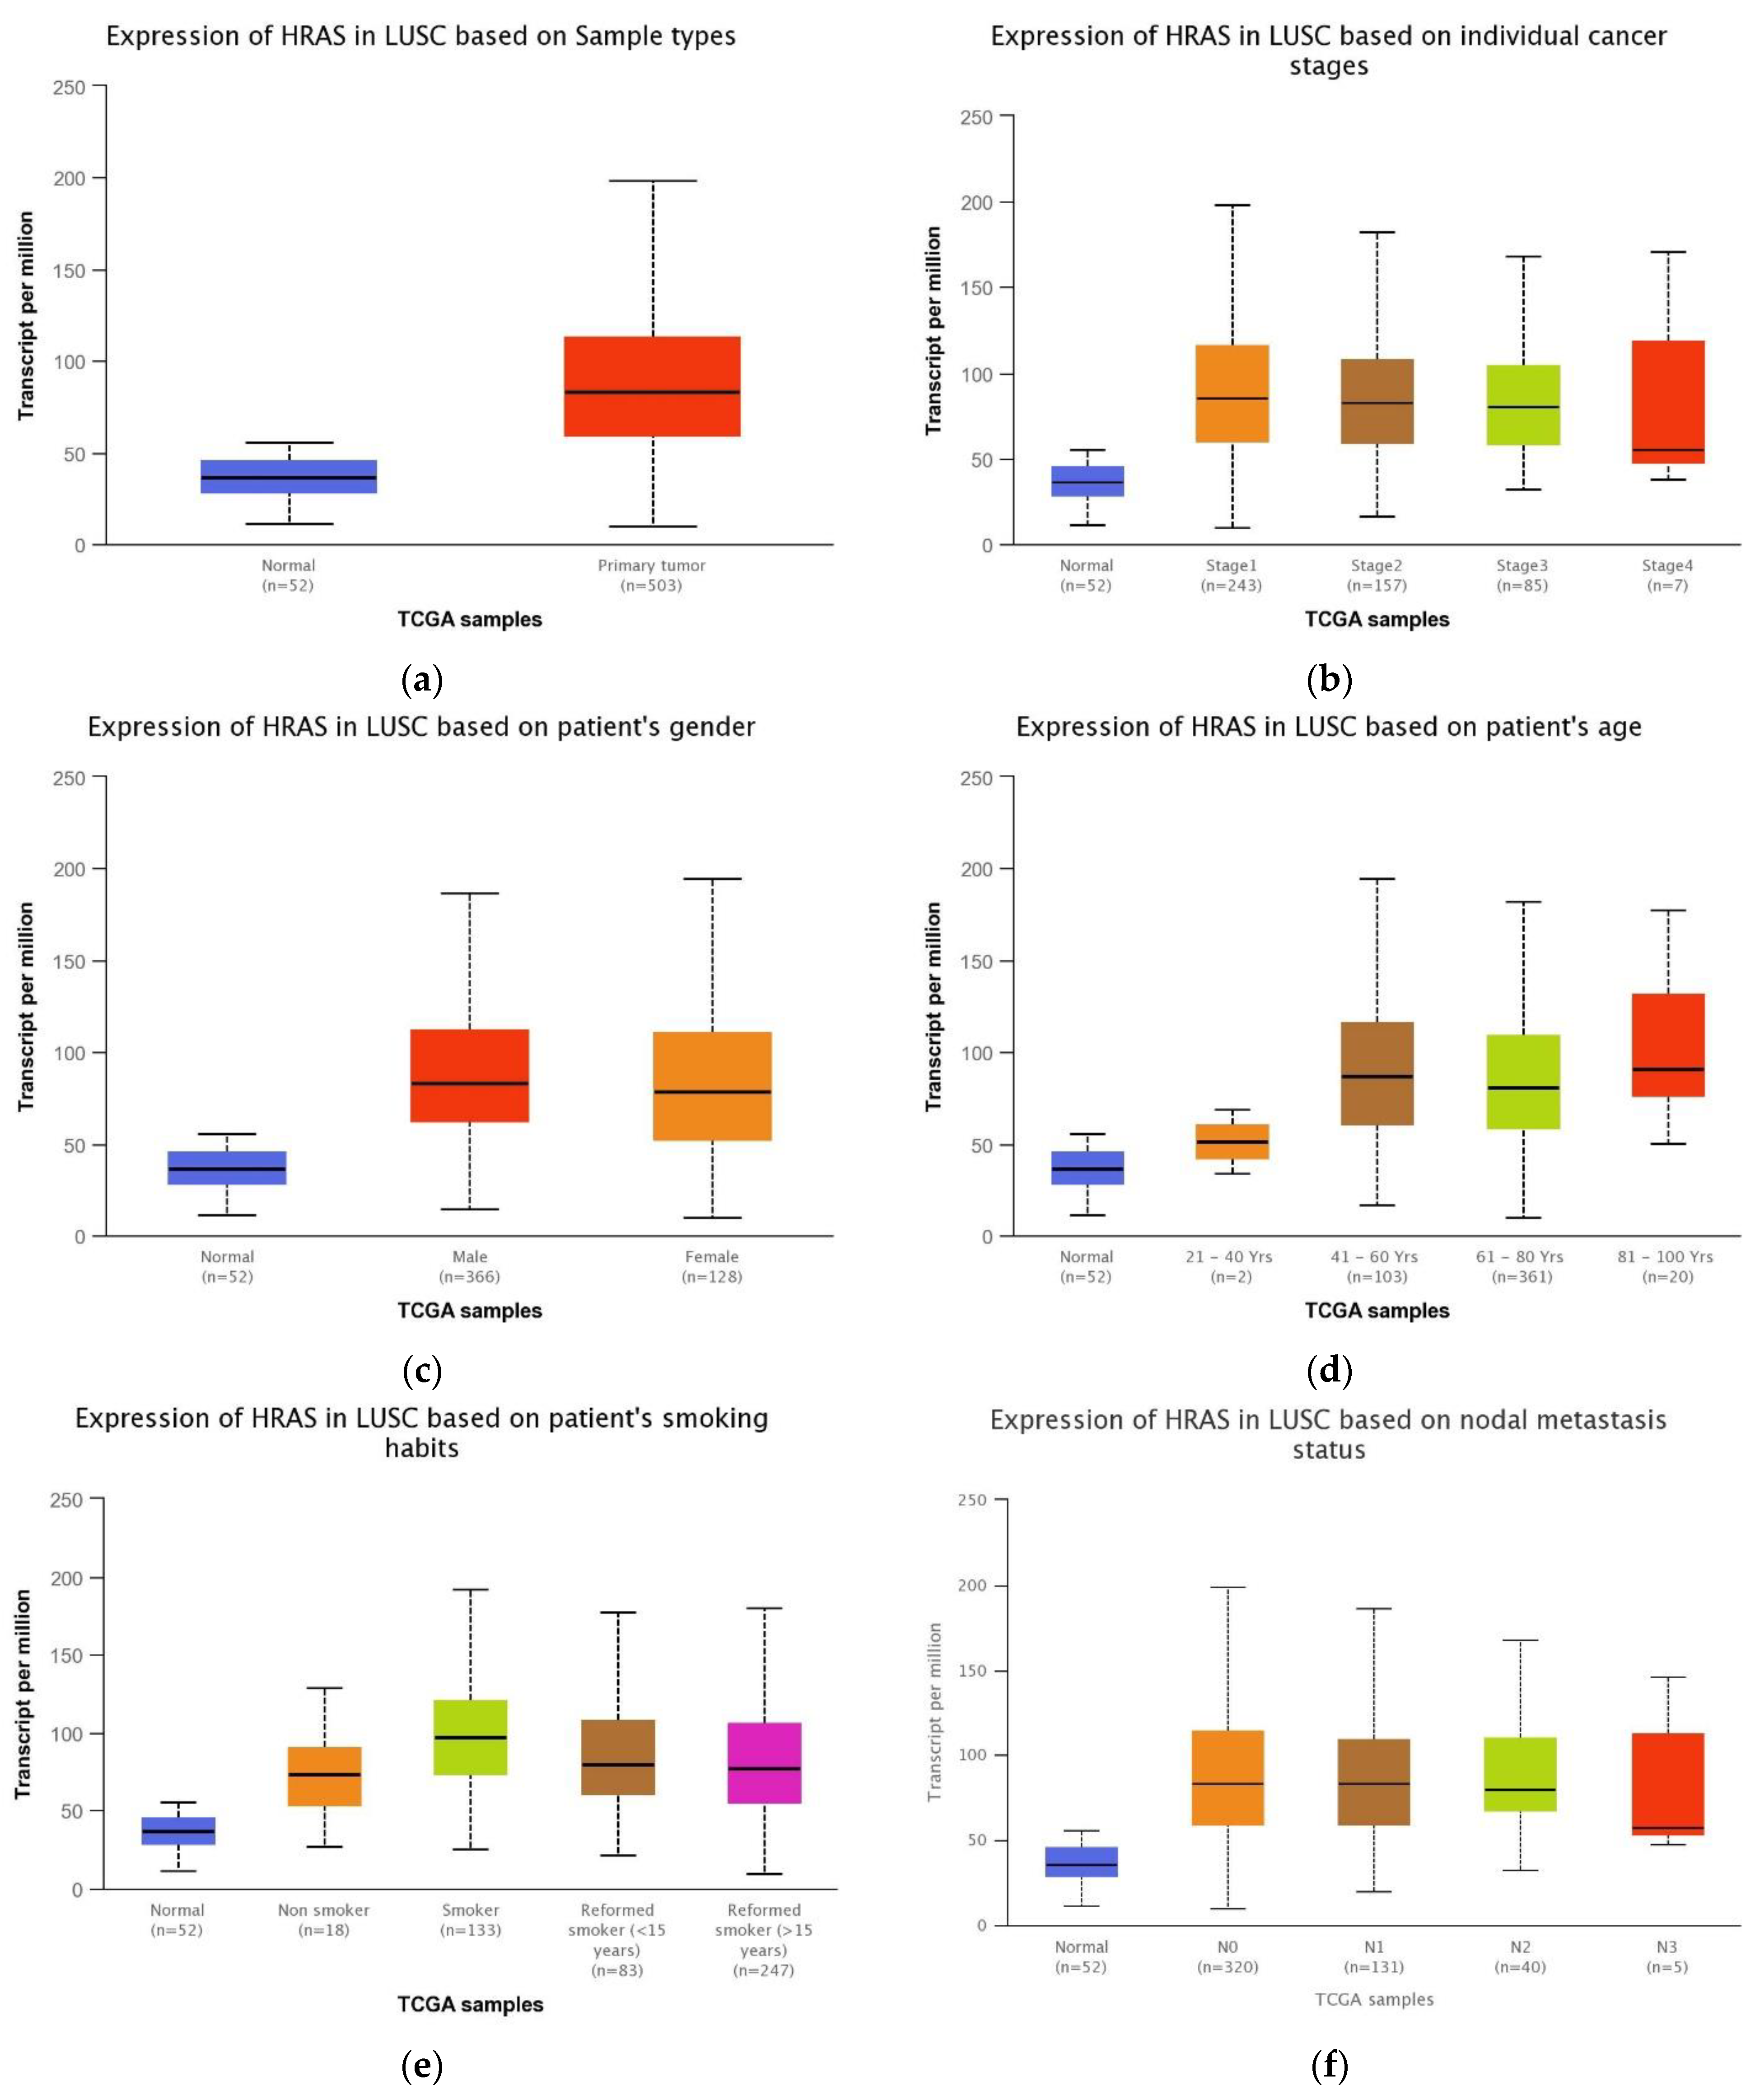
3.6. Association between the HRAS Gene Expression and LUSC Patients’ Clinical Features

According to the UALCAN database, HRAS mRNA expression was upregulated in LUSC. A series of clinical data was obtained and summarized in Figure 6 and Supplementary Table S1. HRAS mRNA expression was higher in squamous cell tumors (n = 503) than in normal tissue (n = 52) (p < 1 × 10⁻¹²). Overexpression of HRAS was associated with cancer stage, sex, age over 41 years and smoking status (p < 0.05). Moreover, it was found that HRAS levels were increased in LUSC patients in lymph node metastatic groups N0 to N2, but not N3.

3.7. Assessment of the Growth Inhibitory Effects of FTS, Kobe0065 and Deltarasin in A549 NSCLC Cell Line

The cell viability of A549 line was assessed by MTT assay. A549 cells were treated with deltarasin, FTS and Kobe0065 at different concentrations and observed for 24 and 48 h. As shown in Table 2, as the concentrations of farnesythiosalicylic acid increased, cell viability after 48 h was significantly decreased in A549 cells compared with the untreated cells, with an IC50 value 138.3 μM The 1.25–5 μM concentrations of deltarasin did not inhibit the growth of A549 cancer cells and the calculated IC50 was 25.7 μM. Kobe0065 did not inhibit the proliferation of NSCLC cancer cells in vitro at any concentration.

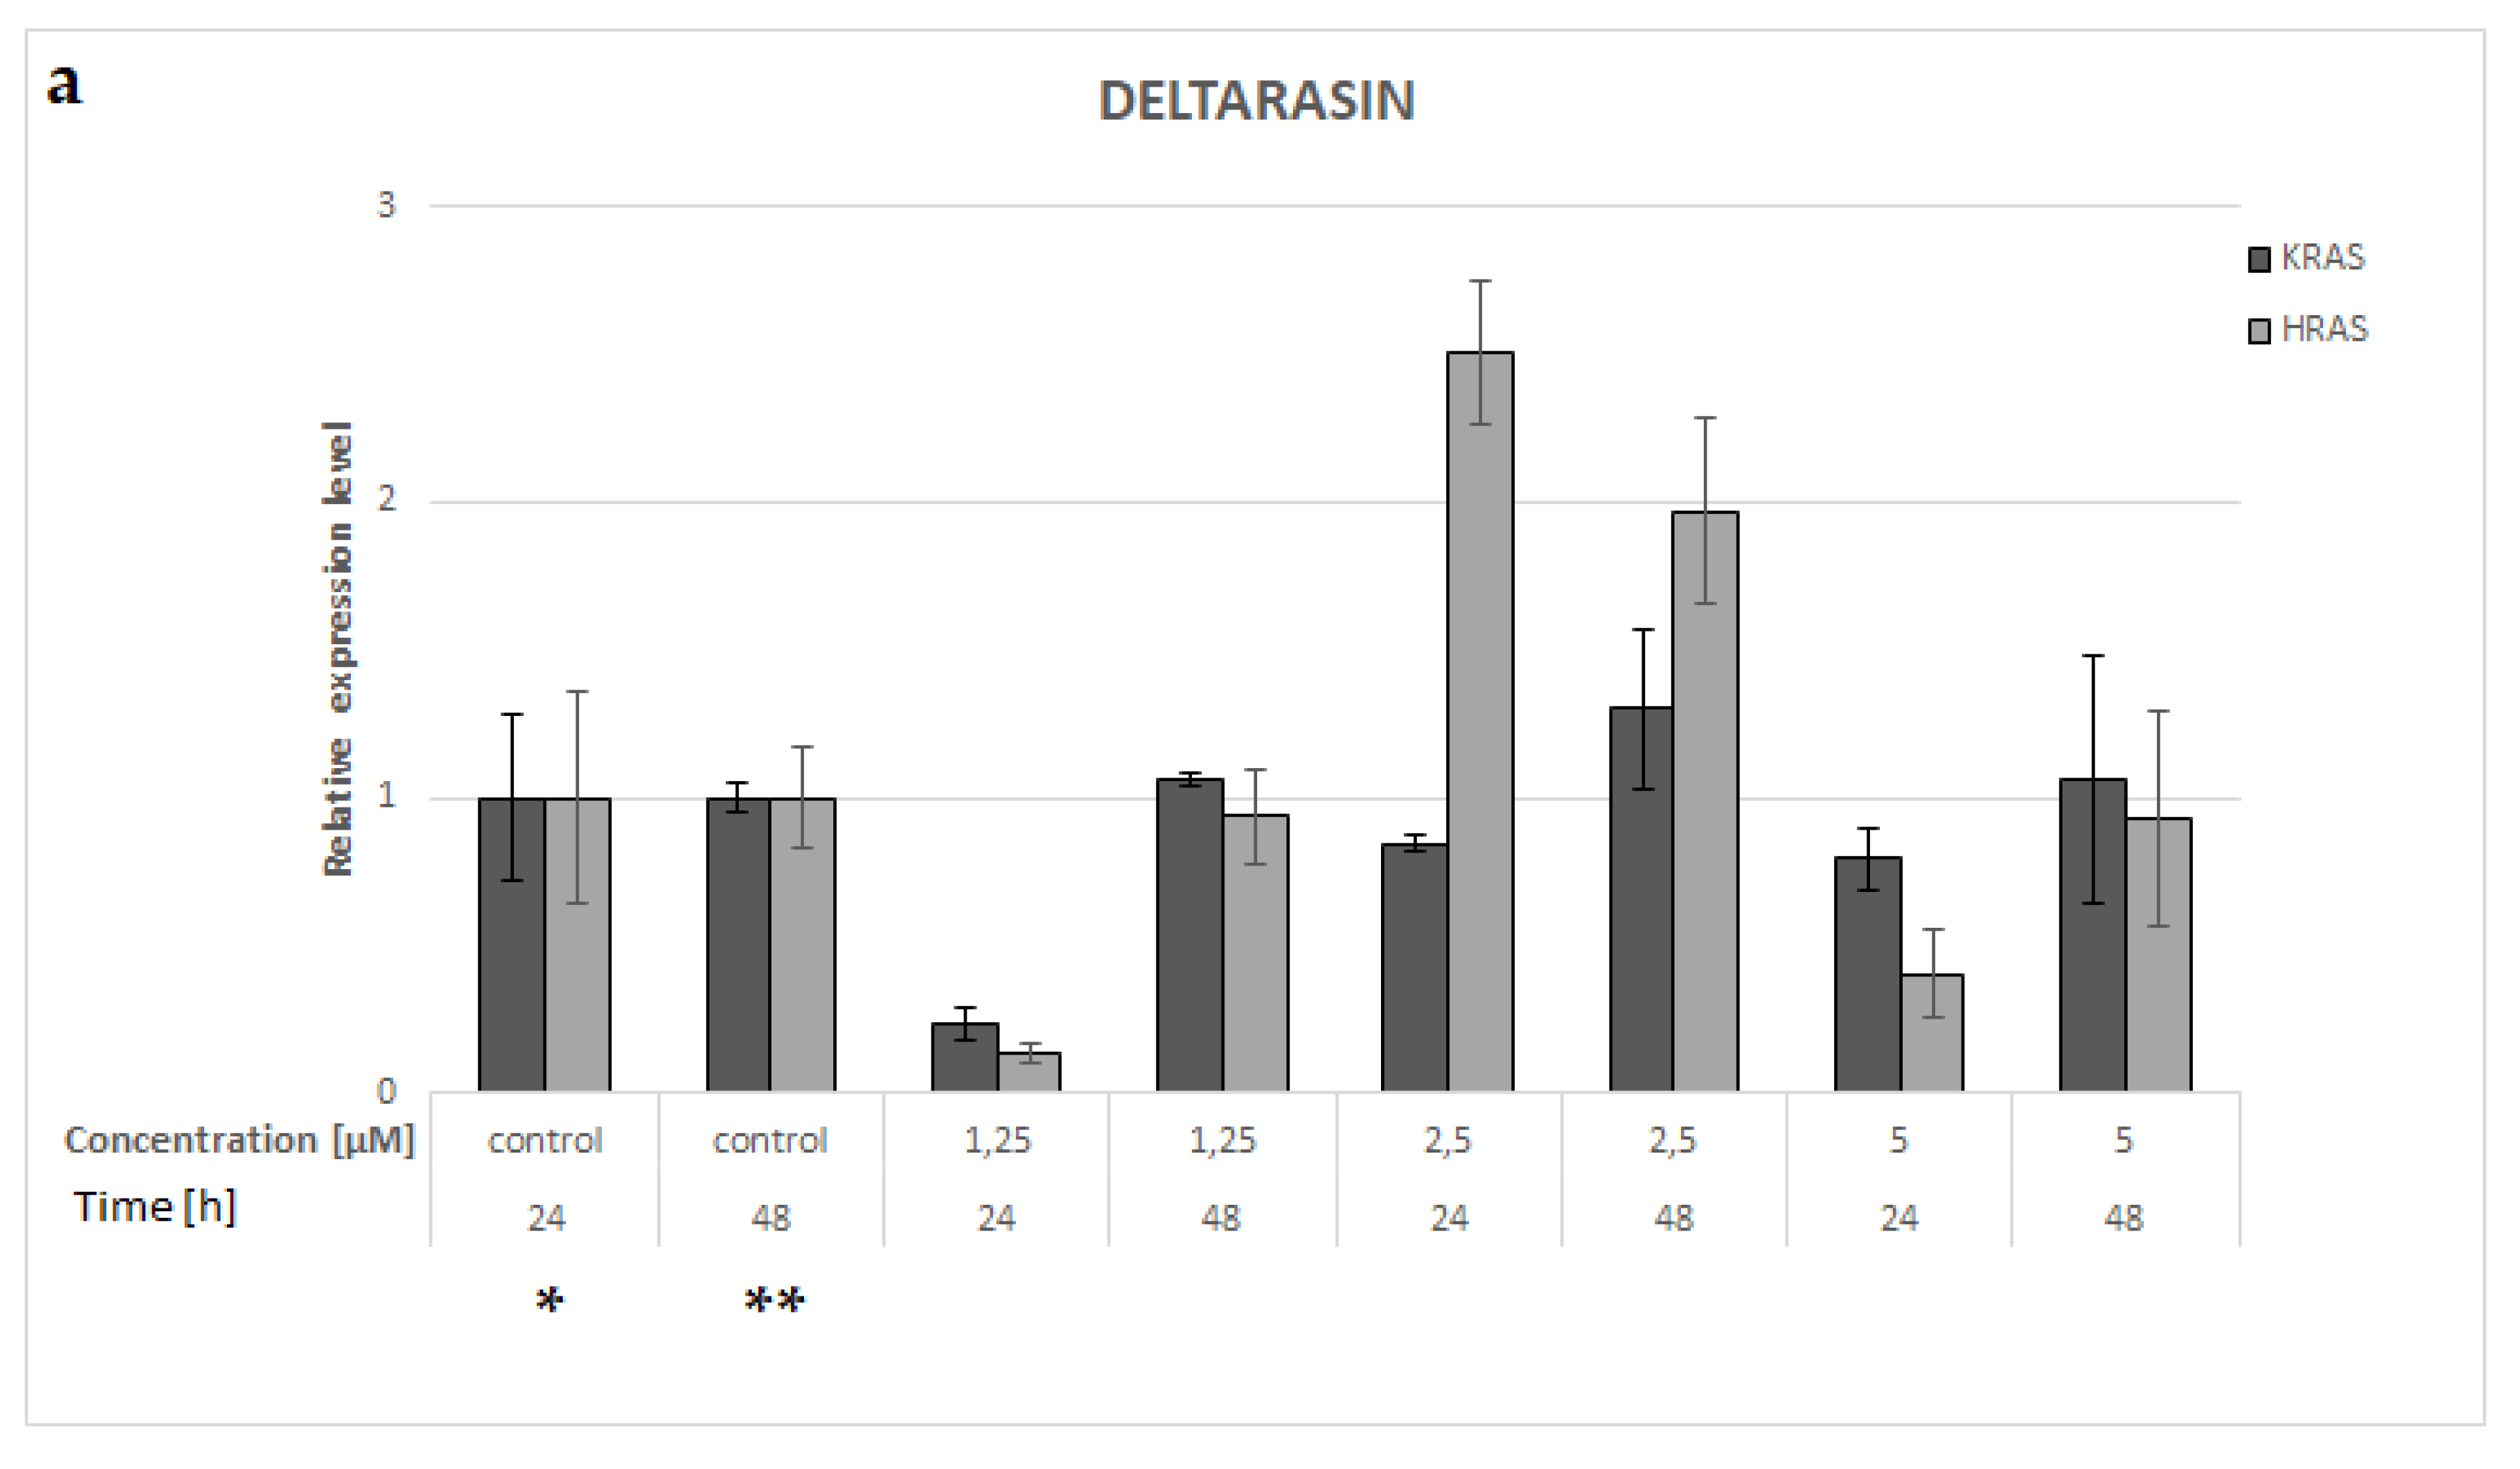
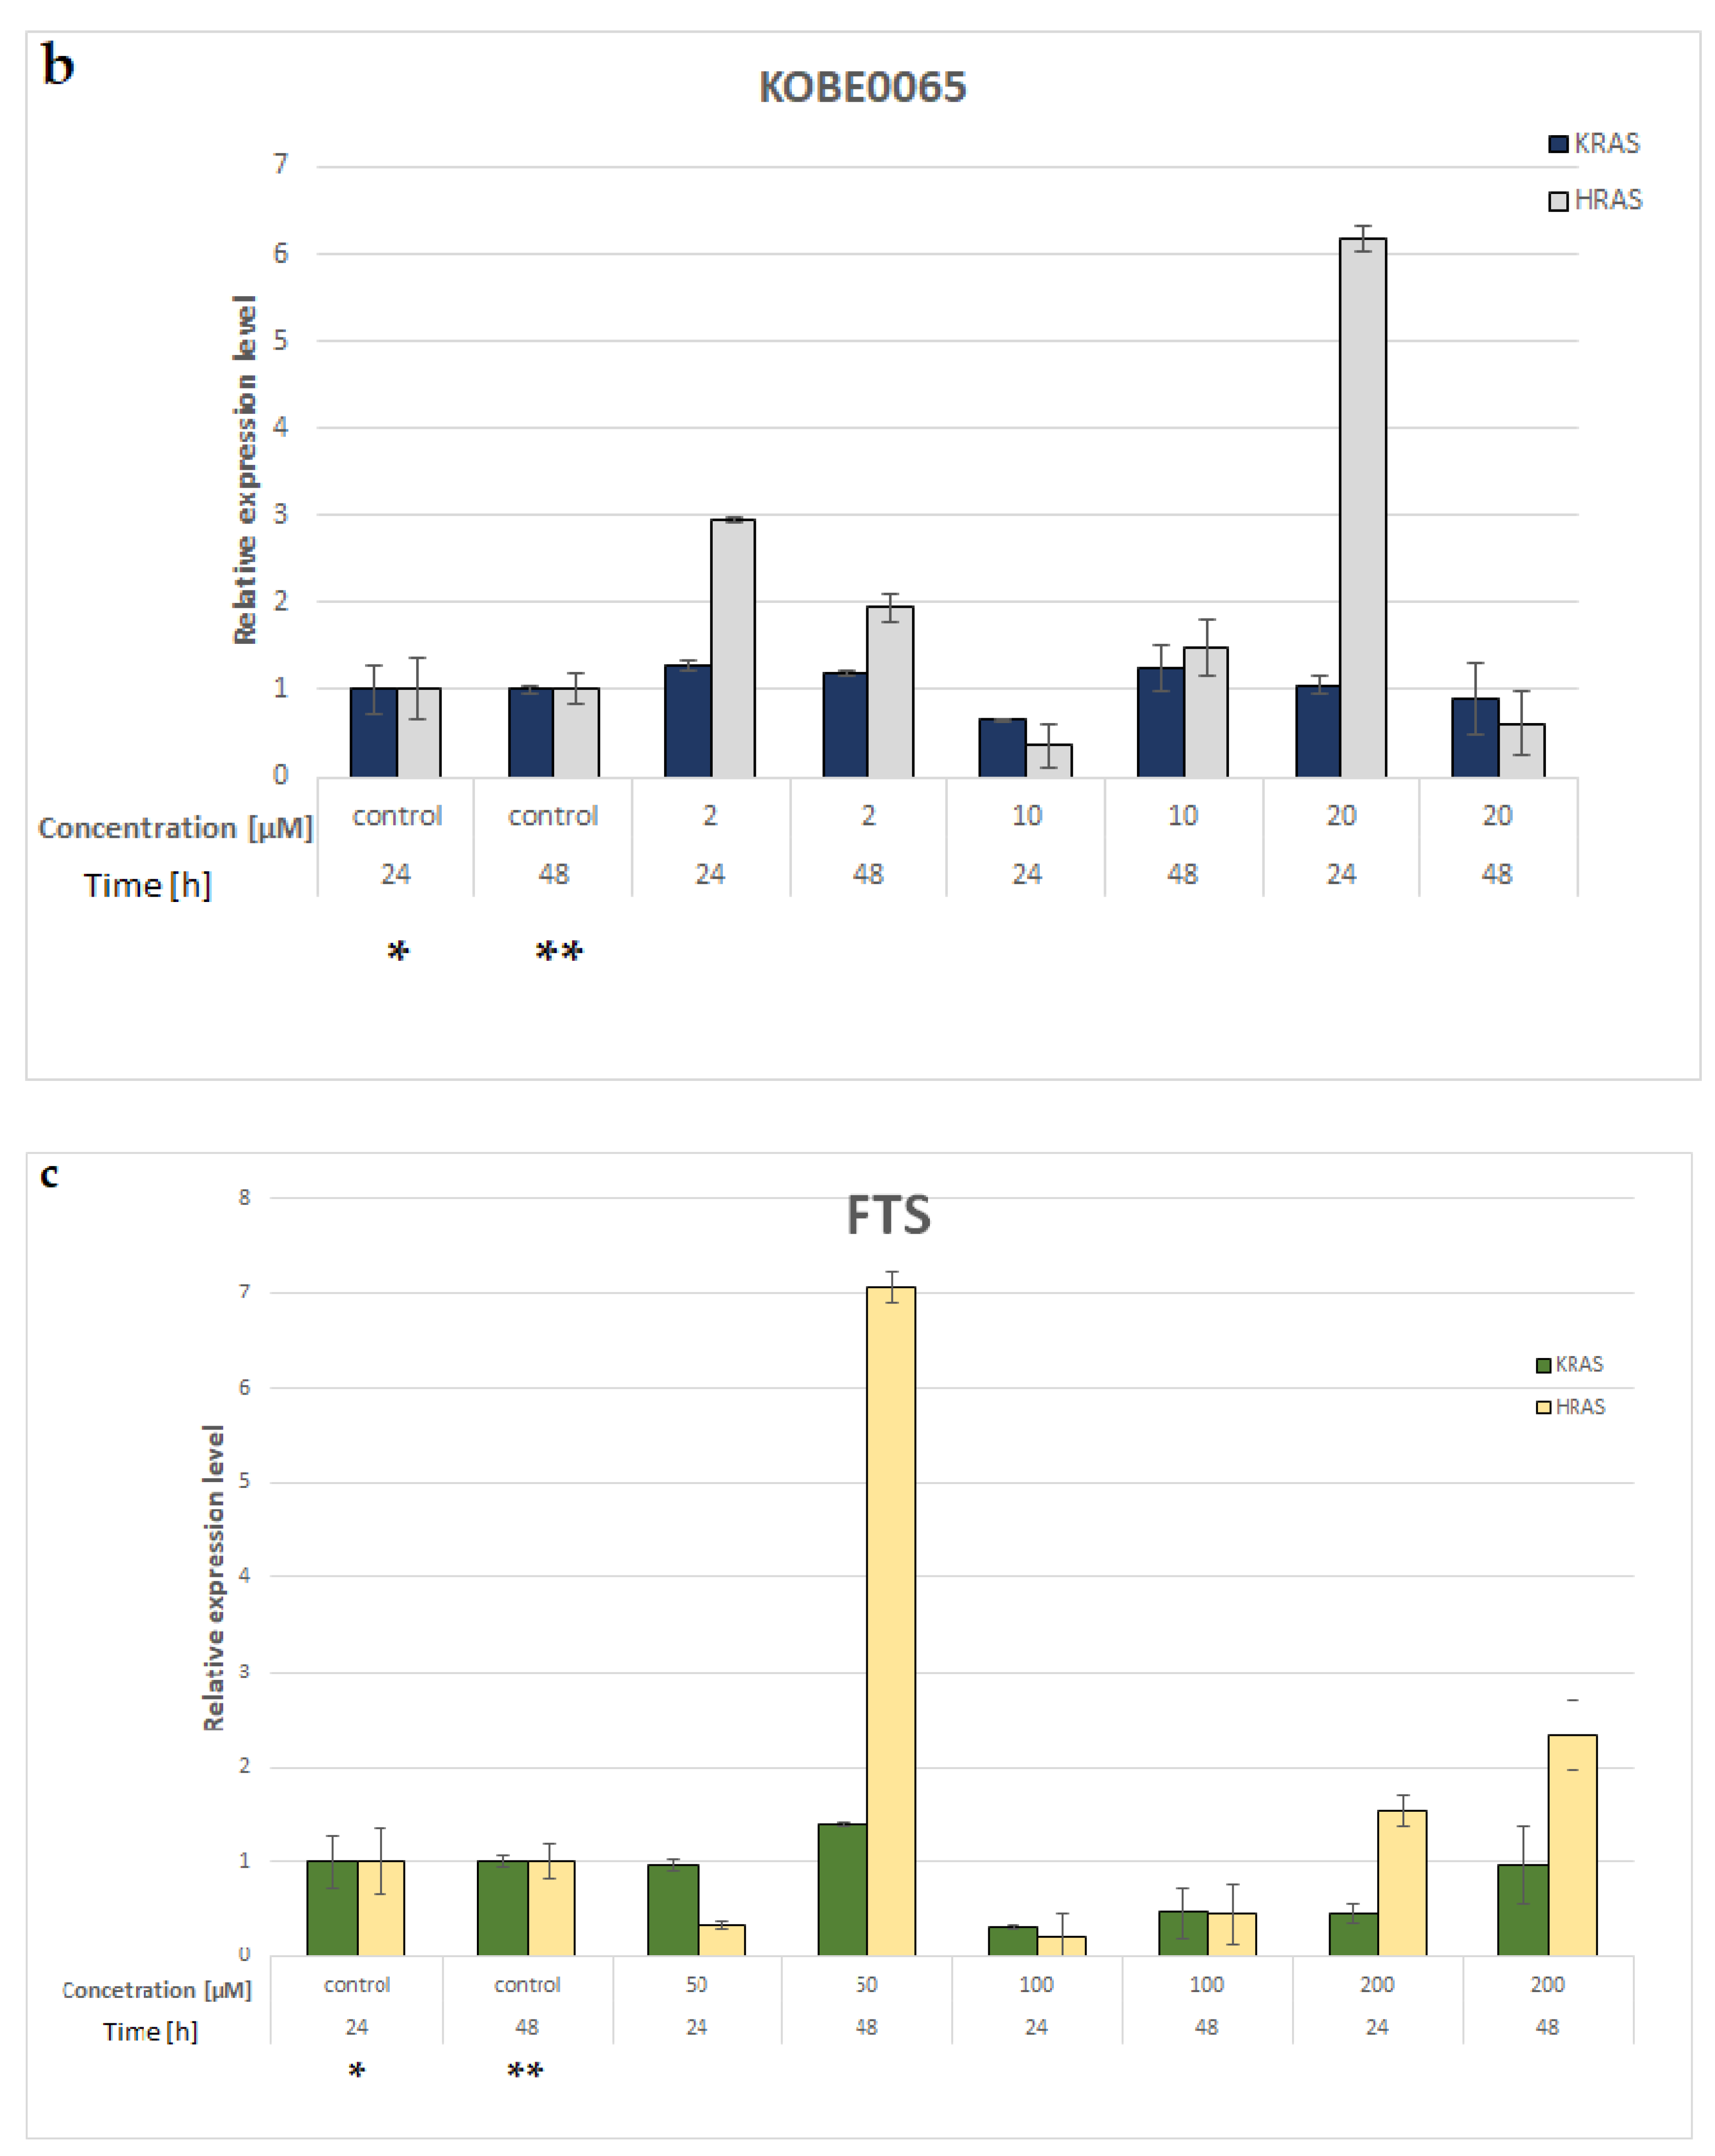
3.8. KRAS and HRAS mRNA Expression in A549 NSCLC Cell Line

In all of the experiments, the negative control (cells without added chemical compounds after 24 and 48 h of incubation) for both genes HRAS and KRAS were treated as calibrator; so, their mRNA expression levels were 1.
In all experimental concentrations, deltarasin slightly increased KRAS expression after 48 h compared to cells incubated for 24 h (Figure 7a). Deltarasin 2.5 μM treatment reduced HRAS mRNA expression levels in NSCLC cell line A549 after 48 h incubation in comparison with 24 h. In all samples, KRAS mRNA expression levels were higher than HRAS with the exception of 24 h and 48 h incubation with 2.5 μM deltarasin.
In the case of Kobe0065, 2 and 20 μM treatment resulted in lower KRAS and HRAS expression after 48 h than after 24 h. However, 10 μM stimulation caused an increase in expression for both studied genes (Figure 7b). The HRAS mRNA expression levels were higher than KRAS with the exception of KRAS mRNA expression after 24 h incubation with 10 μM and after 48 h incubation with 20 μM Kobe0065.
FTS treatment, at all concentrations, resulted in higher KRAS mRNA expression after 48 h than 24 h (Figure 7c). Stimulation with 50 μM FTS caused stronger HRAS mRNA expression after 48h incubation. For 200 μM treatment, HRAS expression was higher after 48-h incubation than after 24 h.

4. Discussion

This study assessed the prognostic values of KRAS and HRAS gene expression in NSCLC, compared to values in a public database, and evaluated the impact of different concentrations of deltarasin, FTS and Kobe065 (RAS-dependent signaling inhibitors) on the viability of the NSCLC A549 cell line, as well as its KRAS and HRAS genes expression levels. Initially, bioinformatic analysis was used to determine the differential expression patterns of KRAS and HRAS genes in all types of human cancers and normal tissues. Our findings provide the first indication of changes in the expression of KRAS and HRAS mRNA in NSCLC cells following stimulation by different RAS inhibitors.
Reanalysis with the use of TNMplot’s publicly available data found that KRAS and HRAS genes are widely overexpressed in different types of human cancers. Thus far, four main independent routes downstream of KRAS have been described, viz. the PI3K/AKT, RAF/MEK/ERK/MAPK, RALGEF/TBK1 and RAF1-MAPK pathways; these influence tumorigenesis through the stimulation of cell proliferation, differentiation, survival and cell-cycle regulation. These pathways might be excessively activated in accordance with mutations in KRAS and other RAS family members (i.e., HRAS, NRAS) as well as different expression of KRAS isoforms. Although many studies have examined the role of RAS family genes in oncogenesis, there is still a need to recognize factors leading to the activation of KRAS-dependent pathways, particularly with regard to therapeutic applications based on direct or indirect inhibition of KRAS [26].
A comparison of KRAS and HRAS gene expression in normal and tumor tissues of NSCLC patients in the TNMplot database showed that the KRAS gene was significantly overexpressed in LUAD and LUSC samples. HRAS mRNA expression was significantly higher in LUSC than in normal tissue, but was downregulated in the LUAD samples. All of the tested p-values were <0.05. Moreover, analyses performed on the basis of the UALCAN database confirmed the above-mentioned results except for HRAS mRNA expression in LUAD, where it was slightly higher than in normal non-cancerous tissues. The observed disparity between HRAS mRNA expression in LUAD samples and in normal tissue could be due to the inequality in the amount of normal samples obtained from non-cancerous persons (n = 486 vs. n = 59, respectively). Both KRAS and HRAS are highly expressed in NSCLC tissues compared to the normal lung tissues at the mRNA level, which could suggest their possible function in NSCLC development and progression. There is some evidence that KRAS mutations are involved in the forming of a tumor microenvironment (TME). Overstimulation of KRAS-dependent signaling might lead to increased secretion of interleukin-6 (IL-6), thus inducing inflammation and the initiation and progression of tumors [27].
In the next step, the relative expression levels of KRAS and HRAS genes in both tumor and normal samples in various NSCLC subgroups were related to clinicopathologic features. Our findings indicate some correlation between KRAS and HRAS expression and cancer stage, smoking habits, age, and sex, as well as the nodal metastasis status of lung cancer patients. KRAS and HRAS overexpression was strongly associated with smoking status, which corroborates data from the literature that smoking is the major cause of lung cancer [28]. Aran et al. showed that expression of K-RAS4B protein in adenocarcinoma subtype of NSCLC was associated with age; however, they did not report any associations between the mRNA expression of KRAS isoforms and clinicopathological parameters [29].
Significant associations have been found between higher HRAS mRNA expression in blood and smoking status. Interestingly, HRAS overexpression was noticed in tumor tissues in LUAD, but in blood in LUSC. In addition, relative KRAS expression level in tissue was only significantly higher in patients older than 67 years [30]. The discrepancies between our findings regarding HRAS mRNA expression depending on NSCLC subtype and calculations based on TNMplot data could be explained by differences in group size.
Liang et al. report that the KRAS gene was overexpressed in NSCLC compared to normal tissues, while overexpression of KRAS protein correlated with tumor stage, smoking status and lymph node metastasis of NSCLC [31]. In the present study, KRAS and HRAS expression levels were significantly associated with sex. Moreover, higher KRAS expression was noted among men for lung squamous cell carcinoma. The sex-specific clinicopathological features of NSCLC have been described previously [29]. This might suggest that lung cancer in men and women are dissimilar units, probably on the grounds of differences in hormonal factors and genetic alterations.
Promising associations have been found between KRAS and HRAS gene expression in NSCLC and various clinical factors. Many studies have examined the possibility of targeting RAS family genes as a goal for therapy. The main aim of the treatment is inhibition of cell proliferation and tumor growth. Many strategies directly aimed at KRAS mutations and indirectly targeting KRAS have been developed, for instance, targeting other KRAS mutations, reducing the expression of KRAS, interrupting membrane localization of KRAS protein or inhibiting KRAS-mediated signal transmission. So far, only two small molecule specific inhibitors for KRAS (G12C)—sotorasib and adagrasib—have been approved by the FDA. Sotorasib binds to Cys12 in the inducible S-IIP and thus inactivates the KRAS-mutated protein. Adagrasib is the RAS GTPase family inhibitor indicated for the treatment of adult patients with KRAS G12C-mutated locally advanced or metastatic NSCLC who previously received at least one prior systemic therapy. Other specific inhibitors for KRAS (G12C) are currently still in the research clinical phase. An interesting approach seems to be reducing KRAS mRNA expression. For example, Kamerkar et al. found that iExosomes (with siRNA or shRNA targeting KRAS G12D) suppressed KRAS G12D mRNA levels and phosphorylated-ERK protein levels in a pancreatic cell line [32,33,34].
The current study examined the effects of three compounds with different effects on the RAS signaling pathway, viz. FTS, deltarasin and Kobe0065, on cell viability, KRAS and HRAS mRNA expression in the A549 NSCLC cell line. There have been only a few reports on the anti-cancer activity of FTS, deltarasin and Kobe0065 on NSCLC cells [15,35,36,37]. In the present study, only 2.5 µM dose of deltarasin decreased the expression of HRAS. FTS is a strong RAS inhibitor that acts on the active, GTP-bound forms of RAS family proteins. Through competition with the active RAS form, FTS inhibits cell growth dependent on RAS and transforming activities [35]. In the current study, incubation with FTS resulted in decreased cell viability in a dose-dependent manner with IC50 138.3 μM. Zundelevich et al. found FTS to significantly inhibit A549 cells proliferation with a decrease of 50% at 40 μmol/L FTS [35]. Blum et al. obtained IC50 40 μmol/L for growth inhibition of A549 cell line 72 h after treatment with FTS. In another study, human colon adenoma-carcinoma cell lines SW480 were treated with FTS that contributed to a decrease in cell viability as well as a reduction in KRAS protein expression [16,38].
Our results are similar to Charette et al., while they observed a 50% reduction in cell growth in human hepatoma cell lines at a dose of 150 μM [39]. Moreover, they found FTS to have an inhibitory effect on whether tumor cell lines harbor mutated RAS genes or not [35]. Likewise, Biran et al. showed that treatment with FTS alone, as well as in combination with valproic acid, reduced proliferation in non-small cell lung, thyroid and colon cancer cell lines by downregulating RAS [40]. In another study, FTS had a tumor suppressive effect in vitro in bladder cancer cells, but high concentrations of this compound were required [19]. FTS was also administered orally to 30 patients with KRAS mutant NSCLC in phase II clinical trial; unfortunately, no significant antitumor effect was observed [41]. This lack of FTS effectiveness in vivo might be caused by alternative resistance mechanisms (i.e., KRAS gene amplification) or off-target effects and requires further research [42].
KRAS signaling can also be suppressed by interrupting the interaction between KRAS and PDEδ. One of the molecules binding the prenyl-binding pocket of PDEδ is deltarasin, which downregulates the RAS protein [33]. In our study, deltarasin downregulated HRAS mRNA levels in the A549 cell line after 48 h of incubation and showed growth inhibitory effects on A549 cancer cells with IC50 2.5 μM after 24 h of incubation. Leung et al. indicated that deltarasin inhibits lung cancer cell lines’ A549 and H358 growth by inducing both apoptosis and autophagy. They showed deltarasin significantly reduced cell viability in A549 in a dose-dependent manner, with IC50 values of 5.29 ± 0.07 [15]. Similar results were obtained by Arendt et al., with IC50 6.90 ± 0.96 for A549 cells treated with deltarasin after 72 h incubation [20]. Moreover, incubation of A549 cells with deltarasin significantly reduced the amount of GTP-RAS observed compared to the control cells [15], which could explain the decrease in HRAS expression level in NSCLC observed in our experiment. In another study, Chen et al. confirmed that PDEδ disruption effectively disrupted KRAS protein plasma membrane localization [14]. These findings suggest that deltarasin plays a role in suppressing the RAS downstream signaling pathways in lung cancer cells and seems to be an interesting therapeutic agent.
RAS proteins were previously thought to be “undruggable” due to the absence of apparent drug-accepting pockets in their structures. However, Shima et al. found Kobe0065, a compound that inhibits the binding of HRAS GTP to c-RAF-1, to inhibit HRAS and RAF interactions, and thus inhibit the growth and induce apoptosis of HRASG12V-transformed NIH 3T3 cells [21]. Following on, Zhang et al. designed 21 analogues (TKR01–TKR21) with a structure of urea or thiourea on the basis of Kobe0065 and assessed their cytotoxic effects on A549 cell line with the aim of blocking KRAS-effector protein interactions. Among these inhibitors, 1,3-bis(4-(Trifluoromethyl)phenyl)thiourea, named TKR15, significantly inhibited A549 cell growth, inducing 30% to 80% apoptosis in comparison with controls [37]. Unfortunately, no similar results were achieved in the present study. No significant decrease in viability was observed for cells treated with different concentrations of Kobe0065, and no significant changes in KRAS expression level were found after incubation with the selected RAS-dependent signaling inhibitors in vitro. This could be explained by the fact that the A549 cell line is a human lung adenocarcinoma cell line with KRAS G12S mutation [14] and, hence, may demonstrate initially impaired KRAS expression. There is also some evidence that in vitro drug screens might not be enough for RAS inhibitor examination because full RAS inhibitor effectiveness require complete inflammatory tumor-to-host interactions and might be observed only in vivo [20]. Moreover, single agent therapy could not be effective for all RAS-dependent cancers; therefore, future studies should investigate the use of combinations of several inhibitors or modified existing compounds [36]. Our findings regarding the KRAS and HRAS genes in lung cancer are preliminary and require further research to better understand their expression and clinical significance. The authors are aware of the limitations of results presented in KRAS and HRAS mRNA expression in A549 NSCLC cell line; however, these results may contribute to further research on RAS inhibitors in non-small cell lung cancer and be a prelude to future research plans.

5. Conclusions

In conclusion, based on TNMplot and UALCAN datasets, we found that KRAS and HRAS genes were highly expressed (upregulated) at the mRNA level in lung cancer tissue. Overexpression of the studied genes in NSCLC was associated with cancer stage, smoking habits, age, sex and nodal metastasis status. FTS, as a compound competing with active RAS form, inhibited the proliferation of human NSCLC cells A549 by inhibiting cell growth dependent on the RAS signaling pathway. Admittedly, its efficacy has not been confirmed in clinical trials, but it is still worth further investigation. Moreover, deltarasin, which downregulates RAS protein activity, reduced HRAS expression level in A549. These preliminary in vitro findings need further studies on larger groups and other cell lines to better understand the molecular mechanisms of FTS and deltarasin on tumor cell activity. It may be possible that deltarasin or FTS might exert an antiproliferative effect applied in combination with other inhibitors in vitro and in vivo on lung cancer cell lines. Our findings also indicate that the RAS signaling pathway might be an attractive subject for further evaluation as a possible diagnostic or therapeutic goal in NSCLC on both the DNA and mRNA levels. To sum up, the results obtained from analyses based on bioinformatics databases indicate that the studied genes are potential risk factors for the development of lung cancer. On the other hand, studies of their expression on cell lines indicate that they may also be potentially important in the response to treatment using RAS inhibitors.

Supplementary Materials

The following supporting information can be downloaded at: https://www.mdpi.com/article/10.3390/app13010166/s1, Table S1. Statistical significance of KRAS and HRAS expression levels in patients with NSCLC for all figures from UALCAN and TNMplot databases; Figure S1. The chemical structures of the of the three RAS inhibitors: deltarasin (A), farnesylthiosalicylic acid (B), Kobe0065 (C); Figure S2. An examples of the amplification curve plots for GAPDH (A), HRAS (B) and KRAS (C) genes including NTC and the melting curves of the real-time PCR amplification products of the GAPDH (D), HRAS (E) and KRAS (F) genes expressed as—ΔRFU/ΔT vs. temperature; Figure S3. The examples of standard curve plots for GAPDH, KRAS and HRAS. (x-axis: log10 concentration of PCR product; y-axis—Ct values).

Author Contributions

Conceptualization, M.P. and E.B.; validation, M.P.; formal analysis, M.P., J.P. and M.Ż.-N.; investigation, M.P., J.P., A.W. and M.Ż.-N.; resources, E.B.; writing—original draft preparation, M.P. and A.W.; writing—review and editing M.Ż.-N., M.P. and E.B.; visualization, M.P.; supervision, E.B.; project administration, M.P. and E.B.; funding acquisition, E.B. All authors have read and agreed to the published version of the manuscript.

Funding

This research was funded by statutory funds of the Department of Pharmaceutical Biochemistry and Molecular Diagnostics, Medical University of Lodz, no: 503/3-015-02/503-31-001.

Institutional Review Board Statement

Not applicable.

Informed Consent Statement

Not applicable.

Data Availability Statement

Links to publicly archived datasets analyzed in this research: http://ualcan.path.uab.edu/, (accessed on 15 June 2022); https://tnmplot.com/analysis/ (accessed on 15 June 2022).

Conflicts of Interest

The authors declare no conflict of interest.

References

  1. Sung, H.; Ferlay, J.; Siegel, R.L.; Laversanne, M.; Soerjomataram, I.; Jemal, A.; Bray, F. Global Cancer Statistics 2020: GLOBOCAN Estimates of Incidence and Mortality Worldwide for 36 Cancers in 185 Countries. CA Cancer J. Clin. 2021, 71, 209–249. [Google Scholar] [CrossRef] [PubMed]
  2. Knight, S.B.; Phil, A.; Crosbie, P.A.; Balata, H.; Chudziak, J.; Hussell, T.; Dive, C. Progress and prospects of early detection in lung cancer. Open Biol. 2017, 7, 170070. [Google Scholar] [CrossRef] [PubMed] [Green Version]
  3. Aran, V.; Omerovic, J. Current Approaches in NSCLC Targeting K-RAS and EGFR. Int. J. Mol. Sci. 2019, 20, 5701. [Google Scholar] [CrossRef] [PubMed] [Green Version]
  4. Lim, Z.-F.; Ma, P.C. Emerging insights of tumor heterogeneity and drug resistance mechanisms in lung cancer targeted therapy. J. Hematol. Oncol. 2019, 12, 1–18. [Google Scholar] [CrossRef] [Green Version]
  5. Khan, A.Q.; Kuttikrishnan, S.; Siveen, K.S.; Prabhu, K.S.; Shanmugakonar, M.; Naemi, H.A.A.; Haris, M.; Dermime, S.; Uddin, S. RAS-mediated oncogenic signaling pathways in human malignancies. Semin. Cancer Biol. 2019, 54, 1–13. [Google Scholar] [CrossRef]
  6. Sun, J.-M.; Hwang, D.W.; Ahn, J.S.; Ahn, M.-J.; Park, K. Prognostic and Predictive Value of KRAS Mutations in Advanced Non-Small Cell Lung Cancer. PLoS ONE 2013, 8, e64816. [Google Scholar] [CrossRef] [Green Version]
  7. Cox, A.D.; Fesik, S.W.; Kimmelman, A.C.; Luo, J.; Der, C.J. Drugging the undruggable RAS: Mission Possible? Nat. Rev. Drug Discov. 2014, 13, 828–851. [Google Scholar] [CrossRef] [Green Version]
  8. Pan, W.; Yang, Y.; Zhu, H.; Zhang, Y.; Zhou, R.; Sun, X. KRAS mutation is a weak, but valid predictor for poor prognosis and treatment outcomes in NSCLC: A meta-analysis of 41 studies. Oncotarget 2016, 7, 8373–8388. [Google Scholar] [CrossRef] [Green Version]
  9. Mascaux, C.; De Iannino, N.I.; Martin, B.; Paesmans, M.; Berghmans, T.; Dusart, M.; Haller, A.A.; Lothaire, P.; Meert, A.-P.; Noel, S.E.; et al. The role of RAS oncogene in survival of patients with lung cancer: A systematic review of the literature with meta-analysis. Br. J. Cancer 2005, 92, 131–139. [Google Scholar] [CrossRef] [Green Version]
  10. Scheffler, M.; Ihle, M.A.; Hein, R.; Merkelbach-Bruse, S.; Scheel, A.H.; Siemanowski, J.; Brägelmann, J.; Kron, A.; Abedpour, N.; Ueckeroth, F.; et al. K-ras Mutation Subtypes in NSCLC and Associated Co-occuring Mutations in Other Oncogenic Pathways. J. Thorac. Oncol. 2019, 14, 606–616. [Google Scholar] [CrossRef]
  11. Zimmermann, G.; Schultz-Fademrecht, C.; Küchler, P.; Murarka, S.; Ismail, S.; Triola, G.; Nussbaumer, P.; Wittinghofer, A.; Waldmann, H. Structure Guided Design and Kinetic Analysis of Highly Potent Benzimidazole Inhibitors Targeting the PDEδ Prenyl Binding Site. J. Med. Chem. 2014, 57, 5435–5448. [Google Scholar] [CrossRef] [PubMed]
  12. Shima, F.; Yoshikawa, Y.; Matsumoto, S.; Kataoka, T. Discovery of Small-Molecule Ras Inhibitors that Display Antitumor Activity by Interfering with Ras·GTP–Effector Interaction. Enzymes 2013, 34 Pt B, 1–23. [Google Scholar] [CrossRef]
  13. Nakajima, E.C.; Drezner, N.; Li, X.; Mishra-Kalyani, P.S.; Liu, Y.; Zhao, H.; Bi, Y.; Liu, J.; Rahman, A.; Wearne, E.; et al. FDA Approval Summary: Sotorasib for KRAS G12C-Mutated Metastatic NSCLC. Clin. Cancer Res. 2022, 28, 1482–1486. [Google Scholar] [CrossRef] [PubMed]
  14. Chen, Y.-H.; Lv, H.; Shen, N.; Wang, X.-M.; Tang, S.; Xiong, B.; Ding, J.; Geng, M.-Y.; Huang, M. EPHA2 feedback activation limits the response to PDEδ inhibition in KRAS-dependent cancer cells. Acta Pharmacol. Sin. 2020, 41, 270–277. [Google Scholar] [CrossRef]
  15. Leung, E.L.H.; Luo, L.X.; Liu, Z.Q.; Wong, V.K.W.; Lu, L.; Xie, Y.; Zhang, N.; Qu, Y.; Fan, X.X.; Li, Y.; et al. Inhibition of KRAS-dependent lung cancer cell growth by deltarasin: Blockage of autophagy increases its cytotoxicity. Cell Death Dis. 2018, 9, 216. [Google Scholar] [CrossRef] [Green Version]
  16. Blum, R.; Elkon, R.; Yaari, S.; Zundelevich, A.; Jacob-Hirsch, J.; Rechavi, G.; Shamir, R.; Kloog, Y. Gene Expression Signature of Human Cancer Cell Lines Treated with the Ras Inhibitor Salirasib (S-Farnesylthiosalicylic Acid). Cancer Res. 2007, 67, 3320–3328. [Google Scholar] [CrossRef] [PubMed] [Green Version]
  17. Bartha, Á.; Győrffy, B. TNMplot.com: A Web Tool for the Comparison of Gene Expression in Normal, Tumor and Metastatic Tissues. Int. J. Mol. Sci. 2021, 22, 2622. [Google Scholar] [CrossRef]
  18. Chandrashekar, D.S.; Bashel, B.; Balasubramanya, S.A.H.; Creighton, C.J.; Ponce-Rodriguez, I.; Chakravarthi, B.V.S.K.; Varambally, S. UALCAN: A portal for facilitating tumor subgroup gene expression and survival analyses. Neoplasia 2017, 19, 649–658. [Google Scholar] [CrossRef]
  19. Sugita, S.; Enokida, H.; Yoshino, H.; Miyamoto, K.; Yonemori, M.; Sakaguchi, T.; Osako, Y.; Nakagawa, M. HRAS as a potential therapeutic target of salirasib RAS inhibitor in bladder cancer. Int. J. Oncol. 2018, 53, 725–736. [Google Scholar] [CrossRef] [Green Version]
  20. Arendt, K.A.M.; Ntaliarda, G.; Armenis, V.; Kati, D.; Henning, C.; Giotopoulou, G.A.; Pepe, M.A.A.; Klotz, L.V.; Lamort, A.-S.; Hatz, R.A.; et al. An In Vivo Inflammatory Loop Potentiates KRAS Blockade. Biomedicines 2022, 10, 592. [Google Scholar] [CrossRef]
  21. Shima, F.; Yoshikawa, Y.; Ye, M.; Araki, M.; Matsumoto, S.; Liao, J.; Hu, L.; Sugimoto, T.; Ijiri, Y.; Takeda, A.; et al. In silico discovery of small-molecule Ras inhibitors that display antitumor activity by blocking the Ras-effector interaction. Proc. Natl. Acad. Sci. USA 2013, 110, 8182–8187. [Google Scholar] [CrossRef] [PubMed] [Green Version]
  22. National Center for Biotechnology Information. “PubChem Compound Summary for CID 73292904, Deltarasin” PubChem. Available online: https://pubchem.ncbi.nlm.nih.gov/compound/Deltarasin (accessed on 14 December 2022).
  23. National Center for Biotechnology Information. “PubChem Compound Summary for CID 5469318, Salirasib” PubChem. Available online: https://pubchem.ncbi.nlm.nih.gov/compound/Salirasib (accessed on 14 December 2022).
  24. National Center for Biotechnology Information. “PubChem Compound Summary for CID 3827663” PubChem. Available online: https://pubchem.ncbi.nlm.nih.gov/compound/Kobe0065 (accessed on 14 December 2022).
  25. Livak, K.J.; Schmittgen, T.D. Analysis of relative gene expression data using real-time quantitative PCR and the 2−ΔΔCT Method. Methods 2001, 25, 402–408. [Google Scholar] [CrossRef] [PubMed]
  26. Bontoux, C.; Hofman, V.; Brest, P.; Ilié, M.; Mograbi, B.; Hofman, P. Daily Practice Assessment of KRAS Status in NSCLC Patients: A New Challenge for the Thoracic Pathologist Is Right around the Corner. Cancers 2022, 14, 1628. [Google Scholar] [CrossRef] [PubMed]
  27. Huang, L.; Guo, Z.; Wang, F.; Fu, L. KRAS mutation: From undruggable to druggable in cancer. Signal Transduct. Target. Ther. 2021, 6, 1–20. [Google Scholar] [CrossRef] [PubMed]
  28. Pesch, B.; Kendzia, B.; Gustavsson, P.; Jöckel, K.-H.; Johnen, G.; Pohlabeln, H.; Olsson, A.; Ahrens, W.; Gross, I.M.; Brüske, I.; et al. Cigarette smoking and lung cancer-relative risk estimates for the major histological types from a pooled analysis of case-control studies. Int. J. Cancer 2011, 131, 1210–1219. [Google Scholar] [CrossRef] [PubMed]
  29. Aran, V.; Domingues, P.M.; de Macedo, F.C.; de Sousa, C.A.M.; Montella, T.C.; Accioly, M.T.D.S.; Gil Ferreira, C. A cross-sectional study examining the expression of splice variants K-RAS4A and K-RAS4B in advanced non-small-cell lung cancer patients. Lung Cancer 2018, 116, 7–14. [Google Scholar] [CrossRef]
  30. Pązik, M.; Michalska, K.; Żebrowska-Nawrocka, M.; Zawadzka, I.; Łochowski, M.; Balcerczak, E. Clinical significance of HRAS and KRAS genes expression in patients with non–small-cell lung cancer—Preliminary findings. BMC Cancer 2021, 21, 130. [Google Scholar] [CrossRef]
  31. Liang, H.; Zhang, J.; Shao, C.; Zhao, L.; Xu, W.; Sutherland, L.C.; Wang, K. Differential Expression of RBM5, EGFR and KRAS mRNA and protein in non-small cell lung cancer tissues. J. Exp. Clin. Cancer Res. 2012, 31, 36–39. [Google Scholar] [CrossRef] [Green Version]
  32. Kamerkar, S.; LeBleu, V.S.; Sugimoto, H.; Yang, S.; Ruivo, C.F.; Melo, S.A.; Lee, J.J.; Kalluri, R. Exosomes facilitate therapeutic targeting of oncogenic KRAS in pancreatic cancer. Nature 2017, 546, 498–503. [Google Scholar] [CrossRef] [Green Version]
  33. Wu, J.; Lin, Z. Non-Small Cell Lung Cancer Targeted Therapy: Drugs and Mechanisms of Drug Resistance. Int. J. Mol. Sci. 2022, 23, 15056. [Google Scholar] [CrossRef]
  34. Cascetta, P.; Marinello, A.; Lazzari, C.; Gregorc, V.; Planchard, D.; Bianco, R.; Normanno, N.; Morabito, A. KRAS in NSCLC: State of the Art and Future Perspectives. Cancers 2022, 14, 5430. [Google Scholar] [CrossRef] [PubMed]
  35. Zundelevich, A.; Elad-Sfadia, G.; Haklai, R.; Kloog, Y. Suppression of lung cancer tumor growth in a nude mouse model by the Ras inhibitor salirasib (farnesylthiosalicylic acid). Mol. Cancer Ther. 2007, 6, 1765–1773. [Google Scholar] [CrossRef] [PubMed] [Green Version]
  36. Chen, K.; Zhang, Y.; Qian, L.; Wang, P. Emerging strategies to target RAS signaling in human cancer therapy. J. Hematol. Oncol. 2021, 14, 116. [Google Scholar] [CrossRef] [PubMed]
  37. Zhang, Y.; Meng, X.; Tang, H.; Cheng, M.; Yang, F.; Xu, W. Design, synthesis, and biological evaluation of novel substituted thiourea derivatives as potential anticancer agents for NSCLC by blocking K-Ras protein-effectors interactions. J. Enzym. Inhib. Med. Chem. 2020, 35, 344–353. [Google Scholar] [CrossRef]
  38. Eng, S.-K.; Imtiaz, I.; Goh, B.-H.; Ming, L.; Lim, Y.-C.; Lee, W.-L. Does KRAS Play a Role in the Regulation of Colon Cancer Cells-Derived Exosomes? Biology 2021, 10, 58. [Google Scholar] [CrossRef]
  39. Charette, N.; De Saeger, C.; Lannoy, V.; Horsmans, Y.; Leclercq, I.; Stärkel, P. Salirasib inhibits the growth of hepatocarcinoma cell lines in vitro and tumor growth in vivo through ras and mTOR inhibition. Mol. Cancer 2010, 9, 256. [Google Scholar] [CrossRef] [Green Version]
  40. Biran, A.; Brownstein, M.; Haklai, R.; Kloog, Y. Downregulation of survivin and aurora A by histone deacetylase and RAS inhibitors: A new drug combination for cancer therapy. Int. J. Cancer 2011, 128, 691–701. [Google Scholar] [CrossRef]
  41. Riely, G.J.; Johnson, M.L.; Medina, C.; Rizvi, N.A.; Miller, V.A.; Kris, M.G.; Pietanza, M.C.; Azzoli, C.G.; Krug, L.M.; Pao, W.; et al. A Phase II Trial of Salirasib in Patients with Lung Adenocarcinomas with KRAS Mutations. J. Thorac. Oncol. 2011, 6, 1435–1437. [Google Scholar] [CrossRef] [Green Version]
  42. Uras, I.Z.; Moll, H.P.; Casanova, E. Targeting KRAS Mutant Non-Small-Cell Lung Cancer: Past, Present and Future. Int. J. Mol. Sci. 2020, 21, 4325. [Google Scholar] [CrossRef]
Figure 1. KRAS (a) and HRAS (b) pan-cancer expression (significant differences are marked with red).
Applsci 13 00166 g001
Figure 2. A comparison of KRAS and HRAS expression between normal and tumor tissues of NSCLC patients in the TNMplot database (https://www.tnmplot.com/ (accessed on 15 June 2022)). KRAS gene in LUAD and LUSC samples was significantly overexpressed in tumor compared to normal (a,b). HRAS mRNA expression was lower in LUAD than in normal tissue (c), but higher in LUSC (d).
Applsci 13 00166 g002
Figure 3. KRAS expression profile in lung adenocarcinoma. Box-whisker plots show the expression of KRAS in normal and tumor samples (a), tumor subgroups based on individual cancer stages (b), patient sex (c), age (d), smoking status (e), nodal metastasis (f) (Data derived from the UALCAN server (http://ualcan.path.uab.edu/ (accessed on 15 June 2022))).
Applsci 13 00166 g003
Figure 4. KRAS expression profile in lung squamous cell carcinoma. Box-whisker plots showing the expression of KRAS in normal and tumor samples (a), tumor subgroups based on individual cancer stages (b), patient sex (c), age (d), smoking status (e), nodal metastasis (f). (Data derived from the UALCAN server (http://ualcan.path.uab.edu/ (accessed on 15 June 2022))).
Applsci 13 00166 g004aApplsci 13 00166 g004b
Figure 5. HRAS expression profile in lung adenocarcinoma. Box-whisker plots show the expression of KRAS in normal and tumor samples (a), tumor subgroups based on individual cancer stages (b), patient sex (c), age (d), smoking status (e), nodal metastasis (f) (Data derived from the UALCAN server (http://ualcan.path.uab.edu/ (accessed on 15 June 2022))).
Applsci 13 00166 g005aApplsci 13 00166 g005b
Figure 6. HRAS expression profile in lung squamous cell carcinoma. Box-whisker plots show the expression of KRAS in normal and tumor samples (a), tumor subgroups based on individual cancer stages (b), patient sex (c), age (d), smoking status (e), nodal metastasis (f) (Data derived from the UALCAN server (http://ualcan.path.uab.edu/ (accessed on 15 June 2022))).
Applsci 13 00166 g006
Figure 7. The relative mRNA expression levels of HRAS and KRAS genes in A549 cell line after incubation with different concentrations of deltarasin (a), Kobe0065 (b) and FTS (c) (*—calibrator for samples after 24-h of incubation; **—calibrator for samples after 48 h of incubation).
Applsci 13 00166 g007aApplsci 13 00166 g007b
Table 1. Sequences of primers used in the study.
Gene NameGeneBank Accesion NumberSequenceProduct Length (bp)
GAPDHNM_001289745Reverse: 5′-ATGCCAGTGAGCTTCCCGTTCAGC-3’145
Forward: 5′-TGGTATCGTGGAAGGACTCATGAC-3’
HRASNM_176795Reverse: 5′-GCCTGGCCCCACCTGTG-3’276
Forward: 5′-CACGGAAGGTCCTGAGGGG-3’
KRASNM_004985Reverse: 5′-TCCTGTAGGAATCCTCTATTG-3’134
Forward: 5′-GCCTGCTGAAAATGACTG-3’
Table 2. The effects of FTS, Kobe0065 and deltarasin on A549 lung cancer cell viability incubated with the indicated concentrations of compounds for 24 and 48 h, assessed by MTT assay.
CompoundConcentration [µM]Cell Viability 24 h [%]Cell Viability 48 h [%]
Deltarasin1.2588.56100
2.598.98100
596.8792.7
Kobe0065284.67100
1090.53100
2095.1100
FTS5093.29100
10095.877
20098.1211.8
Disclaimer/Publisher’s Note: The statements, opinions and data contained in all publications are solely those of the individual author(s) and contributor(s) and not of MDPI and/or the editor(s). MDPI and/or the editor(s) disclaim responsibility for any injury to people or property resulting from any ideas, methods, instructions or products referred to in the content.

