Article

Study on Dynamic Performance Parameters of Laser Tracker Based on Self-Developed Circular Trajectory Generator System

1
Chengdu Normal University, Chengdu 611130, China
2
National Institute of Measurement and Testing Technology, Chengdu 610021, China
3
University of Chinese Academy of Sciences, Beijing 100049, China
*
Author to whom correspondence should be addressed.
Appl. Sci. 2023, 13(1), 167; https://doi.org/10.3390/app13010167
Submission received: 29 November 2022 / Revised: 17 December 2022 / Accepted: 21 December 2022 / Published: 23 December 2022
(This article belongs to the Topic Manufacturing Metrology)

Abstract

:
The laser tracker has characteristics of high measurement accuracy and wide measurement range. Laser tracker technology, as an effectively large-scale measuring approach, plays a critical role in dynamic measurement. Currently, the static performance of laser trackers has been well studied. However, the dynamic characteristics of the laser tracker remain unclear in terms of evaluating its dynamic performance. The circular trajectory generator measurement system can quantify the dynamic performance of the laser tracker. We developed a standard circular trajectory generator using a stable servo system and then conducted an in-depth study on the dynamic performance of the laser tracker through statistical analysis. Numerous experiments have shown that if the laser tracker is set at equal spacing, the dynamic indication error is smallest when the measurement distance is 3 m, indicating that the fitted diameter at a distance of 3 m is closest to the diameter of the circular trajectory generator. If the laser tracker is set with equal sampling frequency, the dynamic indication error is smallest when the measurement distance is 5 m. When the circular trajectory generator is at low speed, the measurement spacing of sampling points of the laser tracker is fixed proportional to the number of measurement points, while at low or high speed the sampling frequency of the laser tracker is fixed proportionally to the number of measurement points. These conclusions will facilitate the application of the laser tracker in dynamic measurement.

1. Introduction

The static measurement technology has matured after decades of development, and the demand for change in industrial engineering measurement has gradually triggered an increase in the research of dynamic measurement technology. Moreover, we have witnessed a booming development in the research on dynamic mechanics, dynamic flow, dynamic temperature, dynamic humidity, dynamic pressure, dynamic geometric measurement, and so forth. The United States and the former Soviet Union performed successful dynamic measurements in the 1960s and 1970s. European countries conducted a host of studies on dynamic measurement tracing in the 1990s [1]. Over the past two decades, China has developed some devices for dynamic measurement, but it still lags behind Western developed countries.
The current dynamic measurement systems are mainly classified into the total station measurement system, digital photogrammetry system, indoor GPS measurement system, laser tracker measurement system, and laser interference tracker measurement system. In the past 10 years, Chinese scholars have made some progress in developing dynamic measurement technology. Gan Xiaochuan et al. [2] explored the calibration of target measurement capabilities of large-size measurement systems. In the literature [3], the calibration method of static performance parameters of the laser tracker, a representative dynamic measurement instrument, was introduced. Wang Weinong et al. [4,5] examined the dynamic performance parameters of laser trackers for the first time in China. However, at that time, the performance of their measurement devices could not satisfy the requirements of laser trackers at high speed. Gan Xiaochuan et al. [6] investigated the lateral tracking speed of the laser tracker, but the diameter of the dynamic performance calibration device of the tracker was too narrow. Bi Shanyong [7] studied the solution of the locus equation, the analytical calculation of locus parameters, and the expression of the coordinate sequence of the laser tracker. Ma Yixin et al. [8] carried out a positional study on the dynamic speed and frequency of several laser trackers under a priori constraint of the object space. Based on the dynamic tracking of rotary clubs, Pan Tingyao et al. [9] explored the dynamic performance of the laser tracker. Stephan Spiess et al. [10] applied the laser tracker for the dynamic detection of robots. Brecher C et al. [11] proposed use of a tracking interferometer for modal analysis and explored the application of laser tracking interference in dynamic measurement. The study by Mohamed Slamani et al. [12] employed laser trackers, laser interferometers, and telescopic bats to analyze the positioning performance of the six-axis robot. Morse E et al. [13] investigated the performance parameters of the laser tracker using the planar, linear, and circular approaches. Yang Juqing et al. [14] developed a servo tracking system for the laser tracker. Lianbi Yao et al. [15] applied laser trackers into engineering measurement and proposed a solution to detect the static law of tracks by integrating static and dynamic methods. Budzyn G et al. [16] adopted the laser interferometer and differential position sensor for the dynamic detection of machine tools. Wang Tenghui et al. [17] established a mathematical model to evaluate dynamic measurement uncertainty for on-machine measurement and performed transfer synthesis of uncertainty based on the adaptive Monte Carlo method. Lu Yinhua et al. [18] developed a field programmable gate array based dynamic angle measurement circuit verification system, which simulates the grating dynamic angle measurement process by the signal source generated by the function signal generator. In addition, Huo Zhiwang [19] proposed a 3D measurement technique based on the structured light method and the principle of binocular stereo vision, without disturbing the motion state of the measured object or calibrating the rotation axis. Yong Shenghui [20] studied the multi-sensor technology for dynamic measurement and positioning, expanding the function of Assisted GPS in dynamic measurement and positioning tasks. Fu Yu et al. [21] discussed the merits and demerits of the practical application of interference dynamic measurement in steady-state vibration and transient vibration.
Dynamic measurement means that there is a change in the measured object or its associated quantity, which significantly affects the measurement results and their uncertainty. There is less research on the dynamic performance of the laser tracker, and its dynamic applications are increasing. At present, research on the dynamic performance of the laser tracker is urgent. In this study we developed a circular trajectory generator measurement system and comprehensively analyzed and explored the dynamic performance of the laser tracker under equal spacing at different measurement distances, equal sampling frequency at different measurement distances, and different rotational velocities at the same measurement distance.

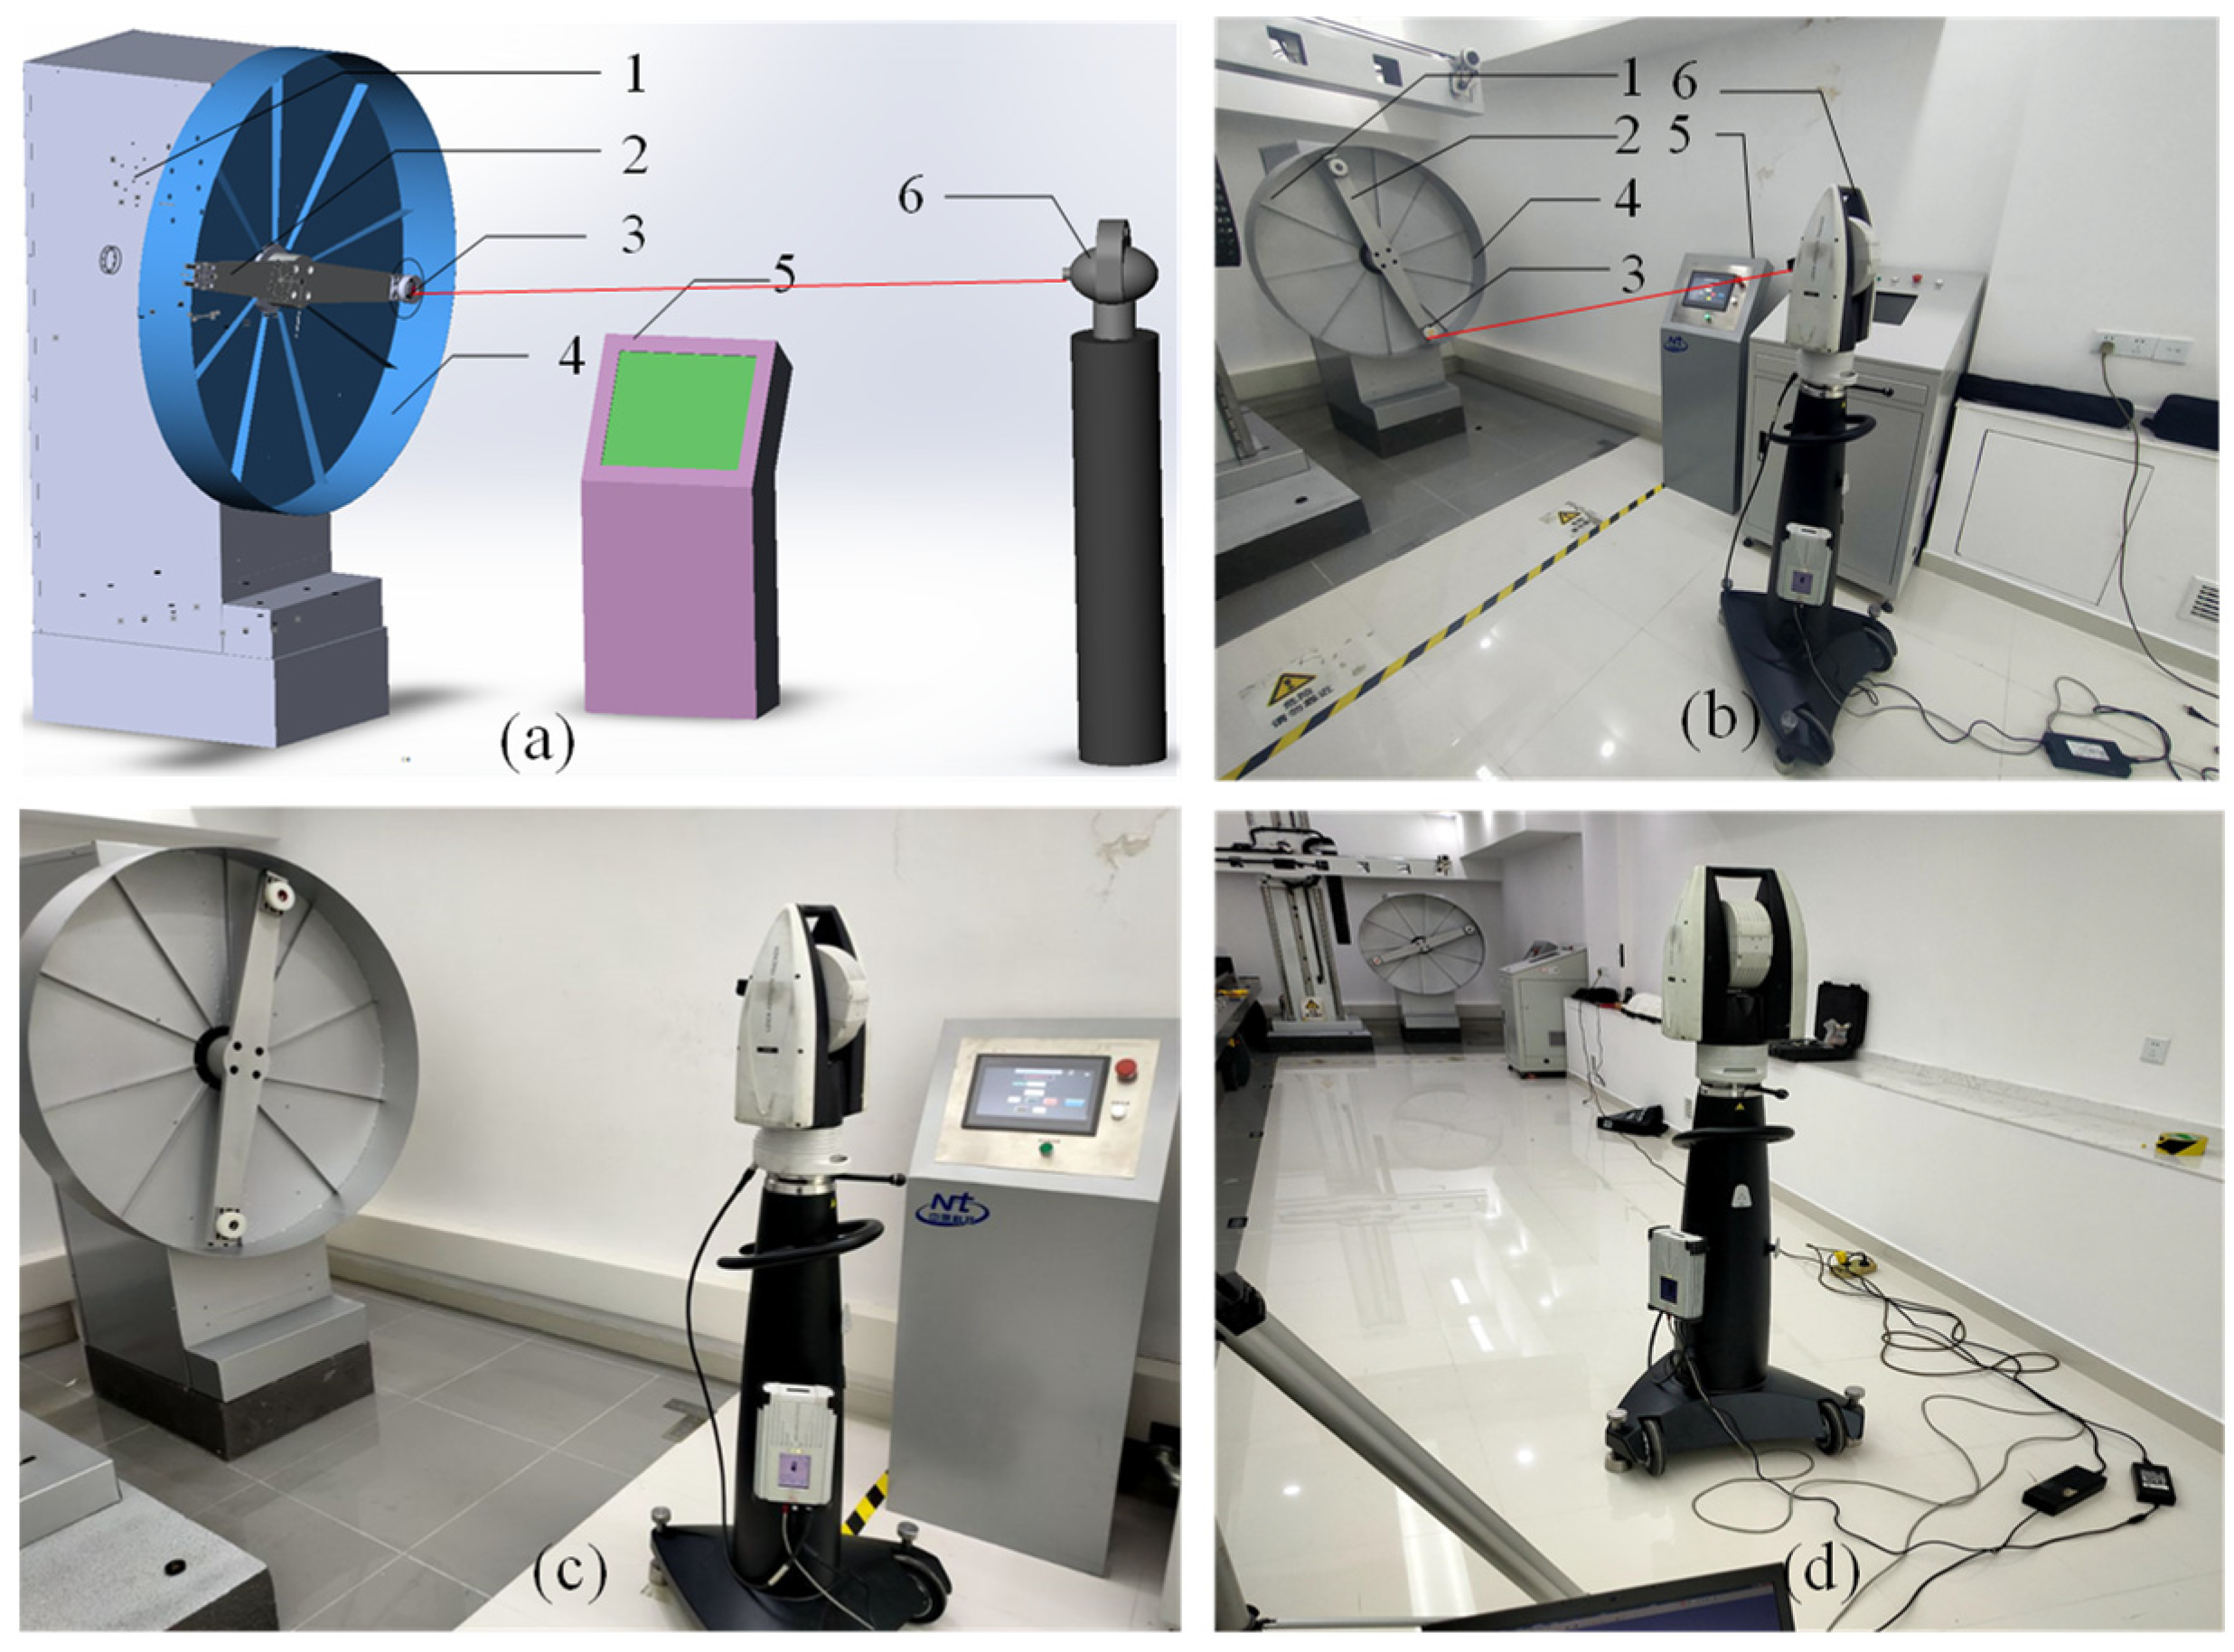
2. Circular Trajectory Generator Measurement System

The circular trajectory generator measurement system mainly adopts a man–machine interface to realize operation, and the principle is servo system to realize speed control. PLC through the control sent pulse control servo motor, Servo motor and reducer are connected by flange, the reducer through a certain reduction ratio control mechanical parts. The circular trajectory generator measurement system consists of a mechanical system and an electronic control system. The former is composed of the main body of the standard circular trajectory generator, a rotating arm, and a microsphere holder, while the latter is mainly a rotational velocity control system. The main body of the standard circular trajectory generator is made up of a high-precision spindle motor, a motor holder, and a transmission system. The dynamic measurement system based on the circular trajectory generator is shown in Figure 1, where Figure 1a is the CAD simulation diagram and Figure 1b is the on-site measurement diagram. Figure 1c,d are schematic diagrams at different measuring distances.
The control system of this study is divided into two subsystems for motion control and data acquisition. The motion control subsystem includes the rotating servo of the rotating arm, with a speed ranging from 0 to 5 r/s, where r represents the number of revolutions. The speed is steplessly adjustable to satisfy the requirements of different measurements. The data acquisition subsystem samples and saves the data installed in the servo motor encoder.
Supposing the linear velocity of the laser tracker is v, we have the equation
v = R × w
where R denotes the radius (unit: m) of the circular trajectory generator, and w denotes the angular velocity (unit: rad/s) of the circular trajectory generator (1r/s = 2π rad/s). After measurement, the radius of the circular trajectory generator is 0.5013 m.

3. Definition of Performance Test

3.1. Static Measurement

The radius of the circular trajectory generator can be measured by the three high-precision coordinates, or the position of the mounting aperture. Or, we can install the microsphere on the laser tracker, and fit the radius of the circular trajectory generator and the measurement points collected by the laser tracker in a static state.

3.2. Dynamic Measurement

The dynamic measurement results of the laser tracker are described as dynamic limit rotational velocity, dynamic indication error (dynamic diameter error), and dynamic indication variable (standard deviation of dynamic measurement radius).

3.2.1. Dynamic Limit Rotational Velocity

The microsphere of the laser tracker is installed on the microsphere holder of the circular trajectory generator, and the laser tracker is installed in the direction perpendicular to the circular trajectory generator. As the rotational velocity of the circular trajectory generator increases, the laser tracker misses the target at a certain speed. The rotational velocity of the standard circular trajectory when missing the target is Vm, and the unit is m/s. The dynamic limit speed of the laser tracker is VL, and the relevant formula is as follows:
V L = 0.9 V m

3.2.2. Dynamic Indication Error

The dynamic indication error is also known as the dynamic diameter error. We employed the laser tracker to collimate the microsphere and increased the speed until it reached 0.7 VL, then took the cloud data of the measurement points of a certain circle, and finally used the measurement results to calculate the diameter of the circular trajectory generator. The dynamic indication error is the difference between the measured diameter and the reference value. Assume that the dynamic indication error is named De and the point cloud data in the measurement result with a circumference is ( x 0 , y 0 , z 0 ) , ( x 1 , y 1 , z 1 ) ( x n , y n , z n ) . According to the least square method, the measured circle can be fitted by Equation (3) and (4) with these above points, and the measured diameter D is calculated as 2d, D = 2d.
( x a 1 ) 2 + ( y b 1 ) 2 + ( z c 1 ) 2 = d 2
a 2 x + b 2 y + c 2 z = d 2
De = 2 R 2 d

3.2.3. Dynamic Indication Variable

We selected the cloud data of the same measurement points as in the measurement of dynamic indication error, calculated the measurement radius of the circular trajectory generator after fitting these points, and took the standard deviation of the measurement radius as the dynamic indication variable. In addition, the dynamic indication variable assumedly represented as S is expressed by Equation (6). The dynamic indication variable of the laser tracker is affected by the installation distance of the laser tracker and the setting of the measurement method. Under the dynamic state, the laser tracker can be set up with equal spacing measurement and equal time measurement.
S = i = 1 n ( d i d ¯ ) 2 n 1

4. Measurement Methods and Data Analysis

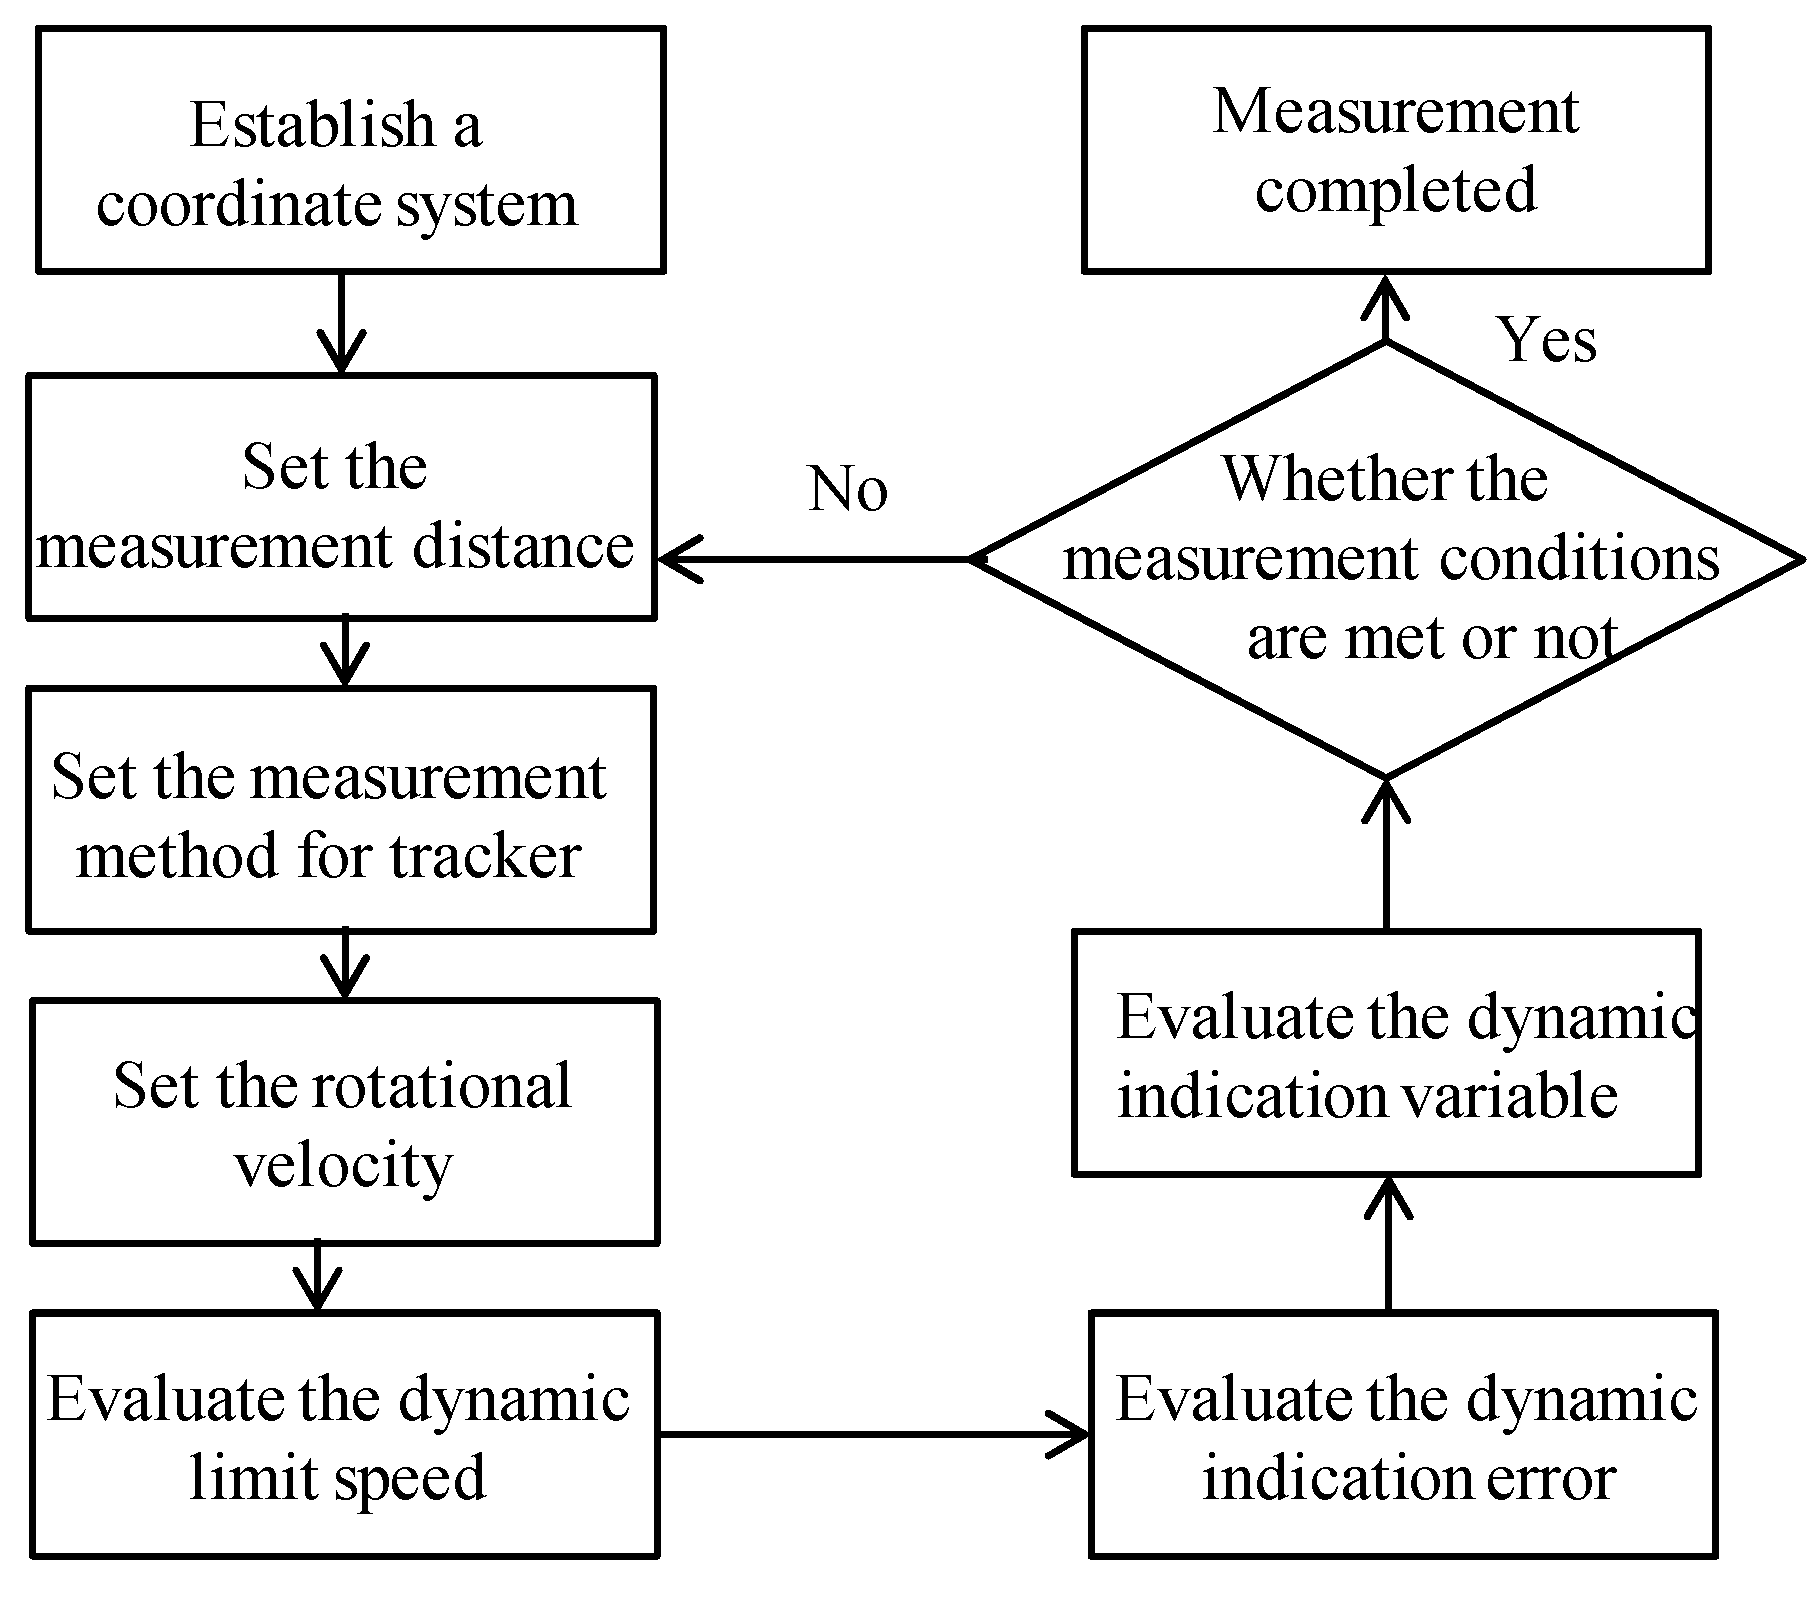
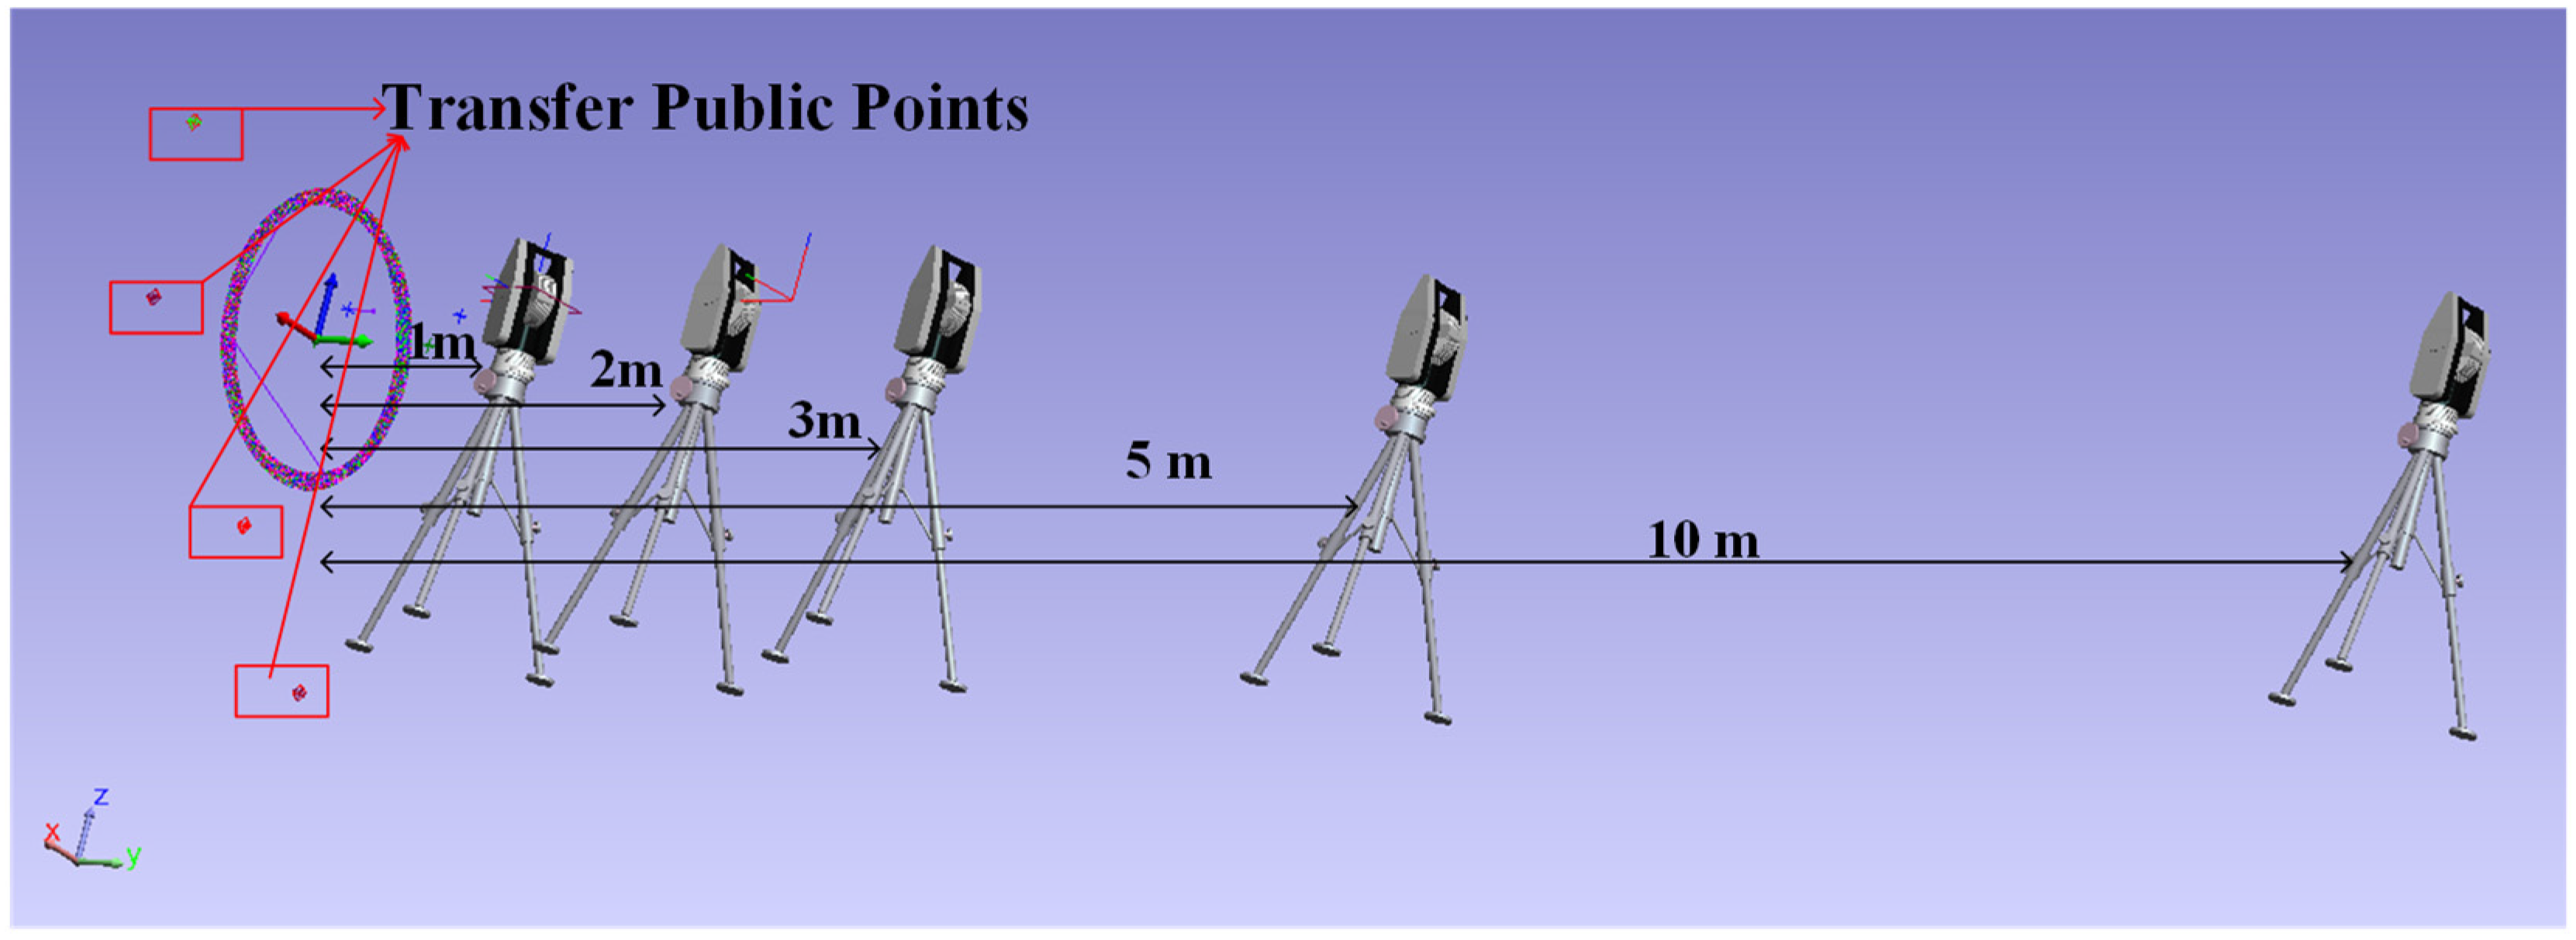
4.1. Measurement Methods

The flow chart of the measurement method is shown in Figure 2. First, we took the elevation of the circular trajectory generator as the y-plane and the center of the circular trajectory generator as the origin of the coordinates. Second, we adjusted the level of the laser tracker and took the horizontal plane of the laser tracker as the z-plane to establish a coordinate system. Meanwhile, four transfer stations were arranged near the circular trajectory generator to unify the coordinate system after adjusting the laser tracker to the specified position.
To start, we set the distance between the laser tracker and the circular trajectory generator (e.g., the measurement distance is 1 m), set the data collection method (e.g., equal spacing of 5 mm) for the laser tracker, and then performed data collection. After the microsphere of the laser tracker received light, we continuously increased the speed of the circular trajectory generator to Rm, at which the laser tracker missed the target, and calculated the dynamic limit speed (RL) of the laser tracker according to Rm. We reduced the speed of the circular trajectory generator to 0.7 RL and ran it again. After the speed of the circular trajectory generator reached a stable level, we used the laser tracker to collect data. The dynamic indication error and dynamic indication variable can be obtained by calculating the operation results. Under the same measurement spacing, we changed the data collection method and repeated the above steps to complete the measurement with the six measurement methods in sequence.

4.2. Data Analysis

In this study, under the dynamic limit speed, the dynamic performance of the laser tracker was explored at different rotational velocities with equal spacing and equal sampling frequency in different positions. During the measurement, the environment was set as 20 °C, 1013 kPa, and 50% RH.

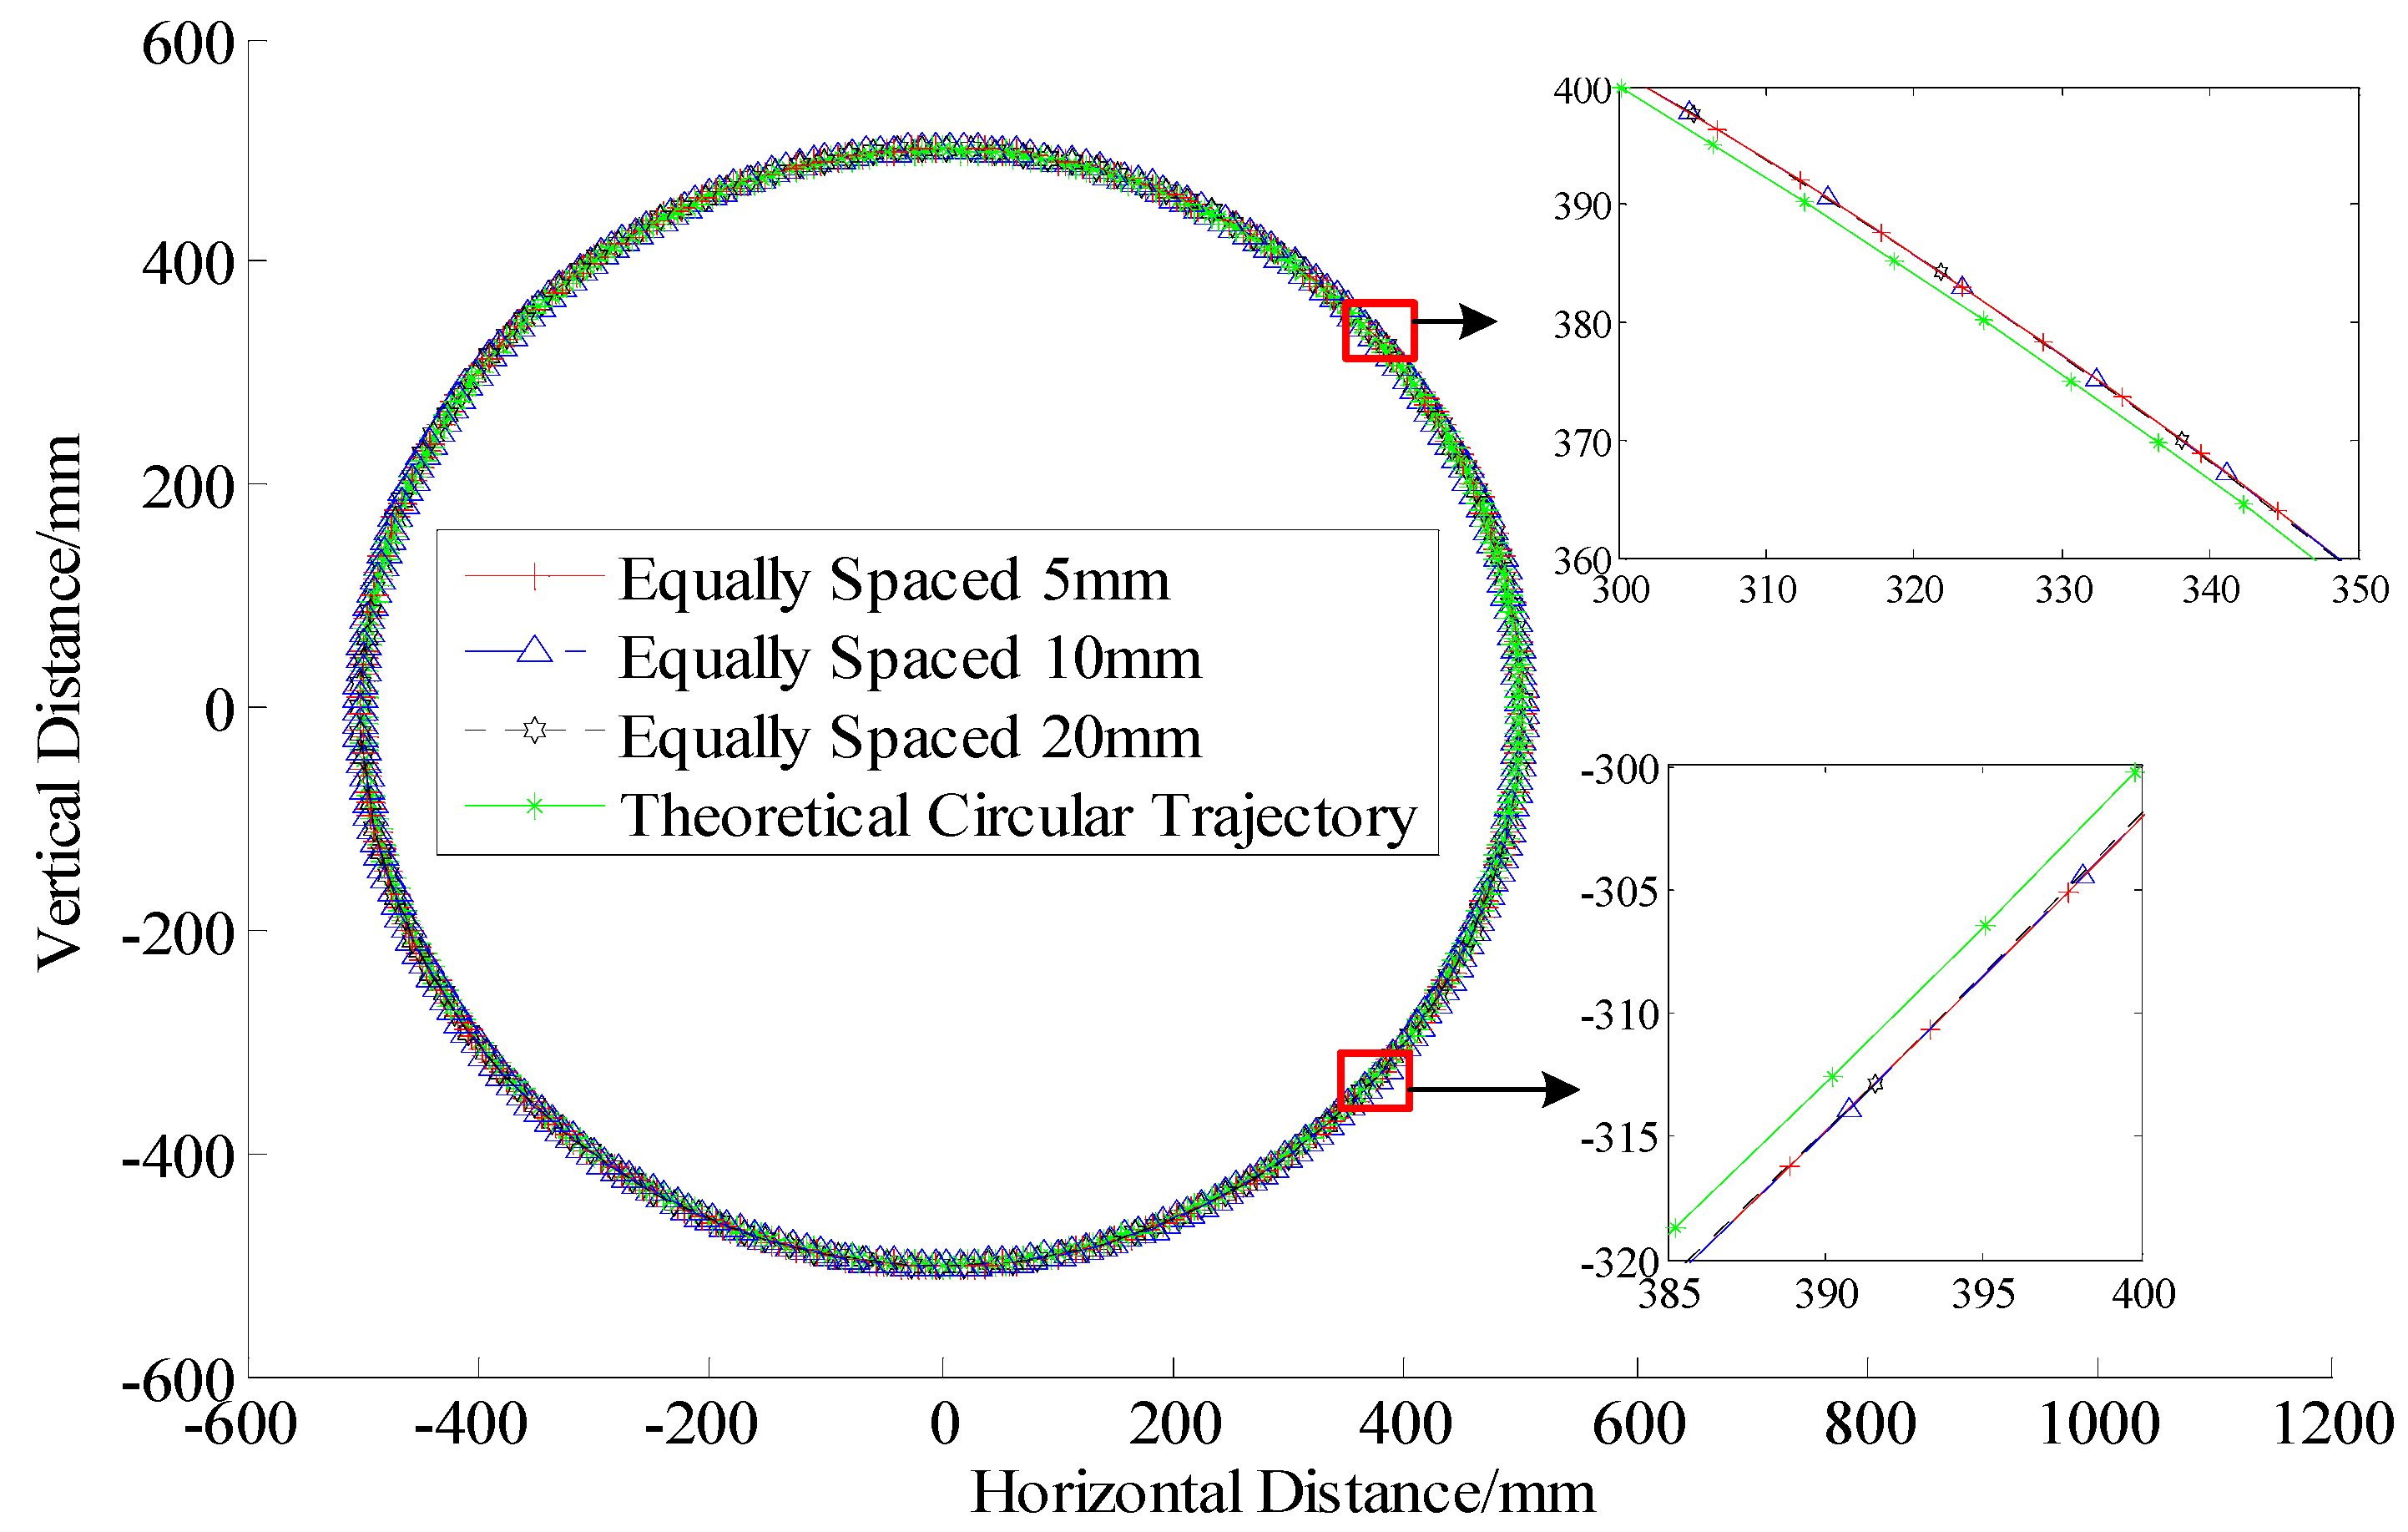
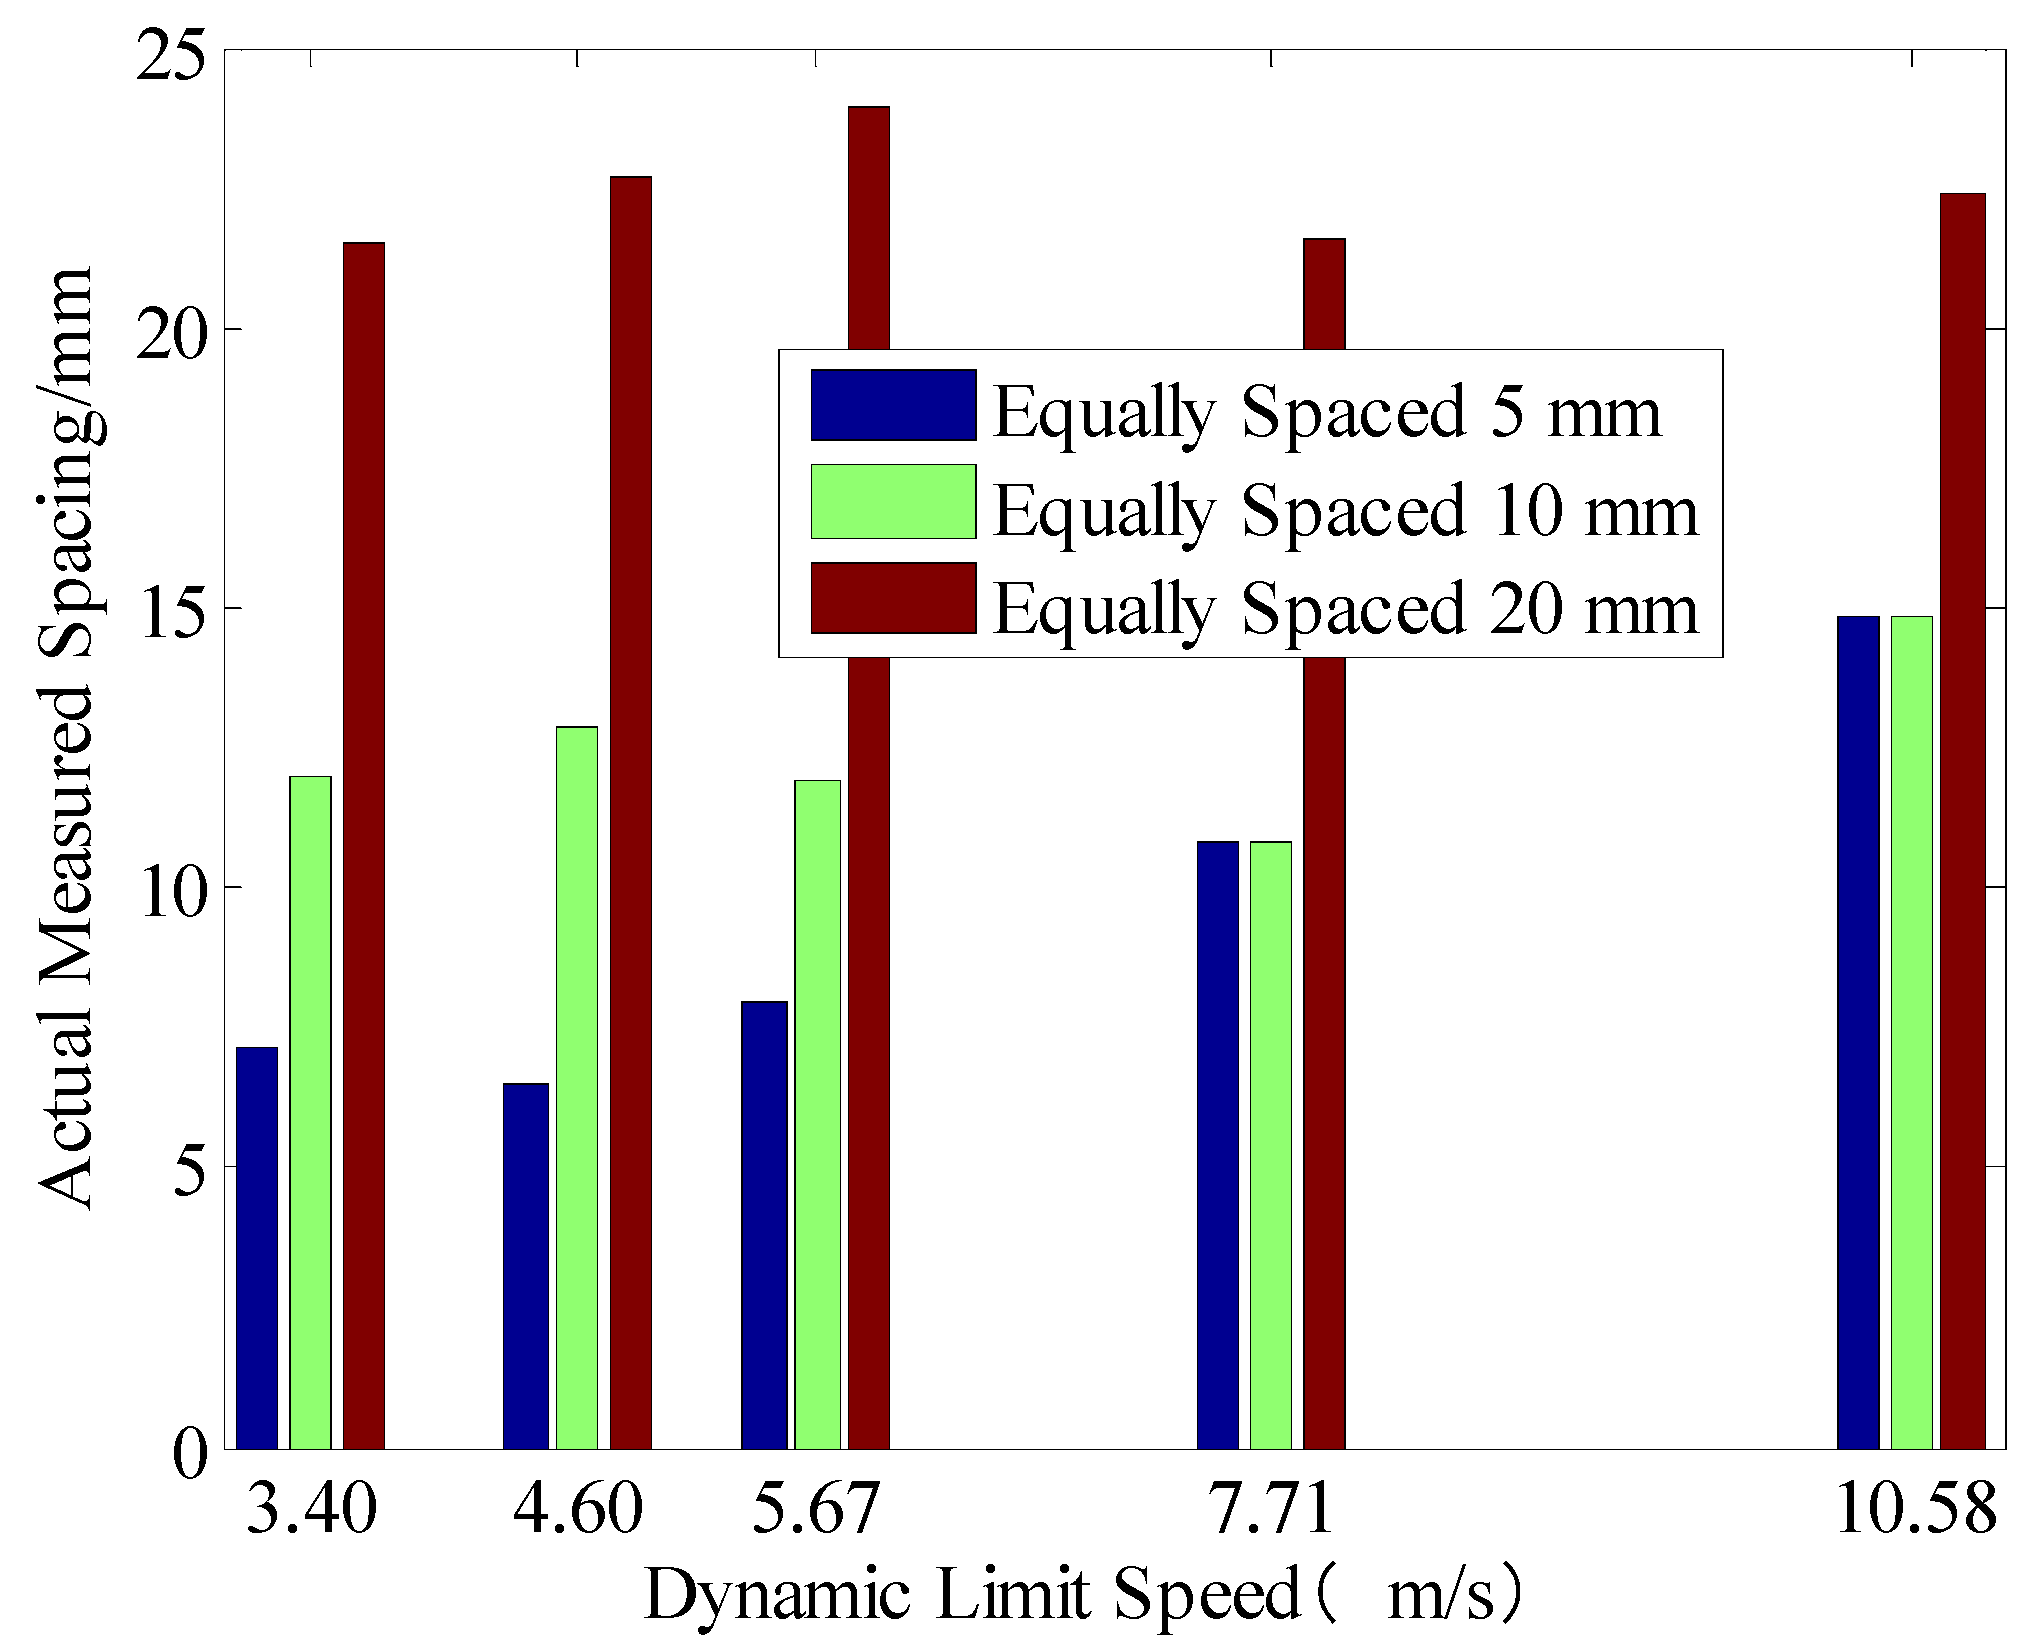
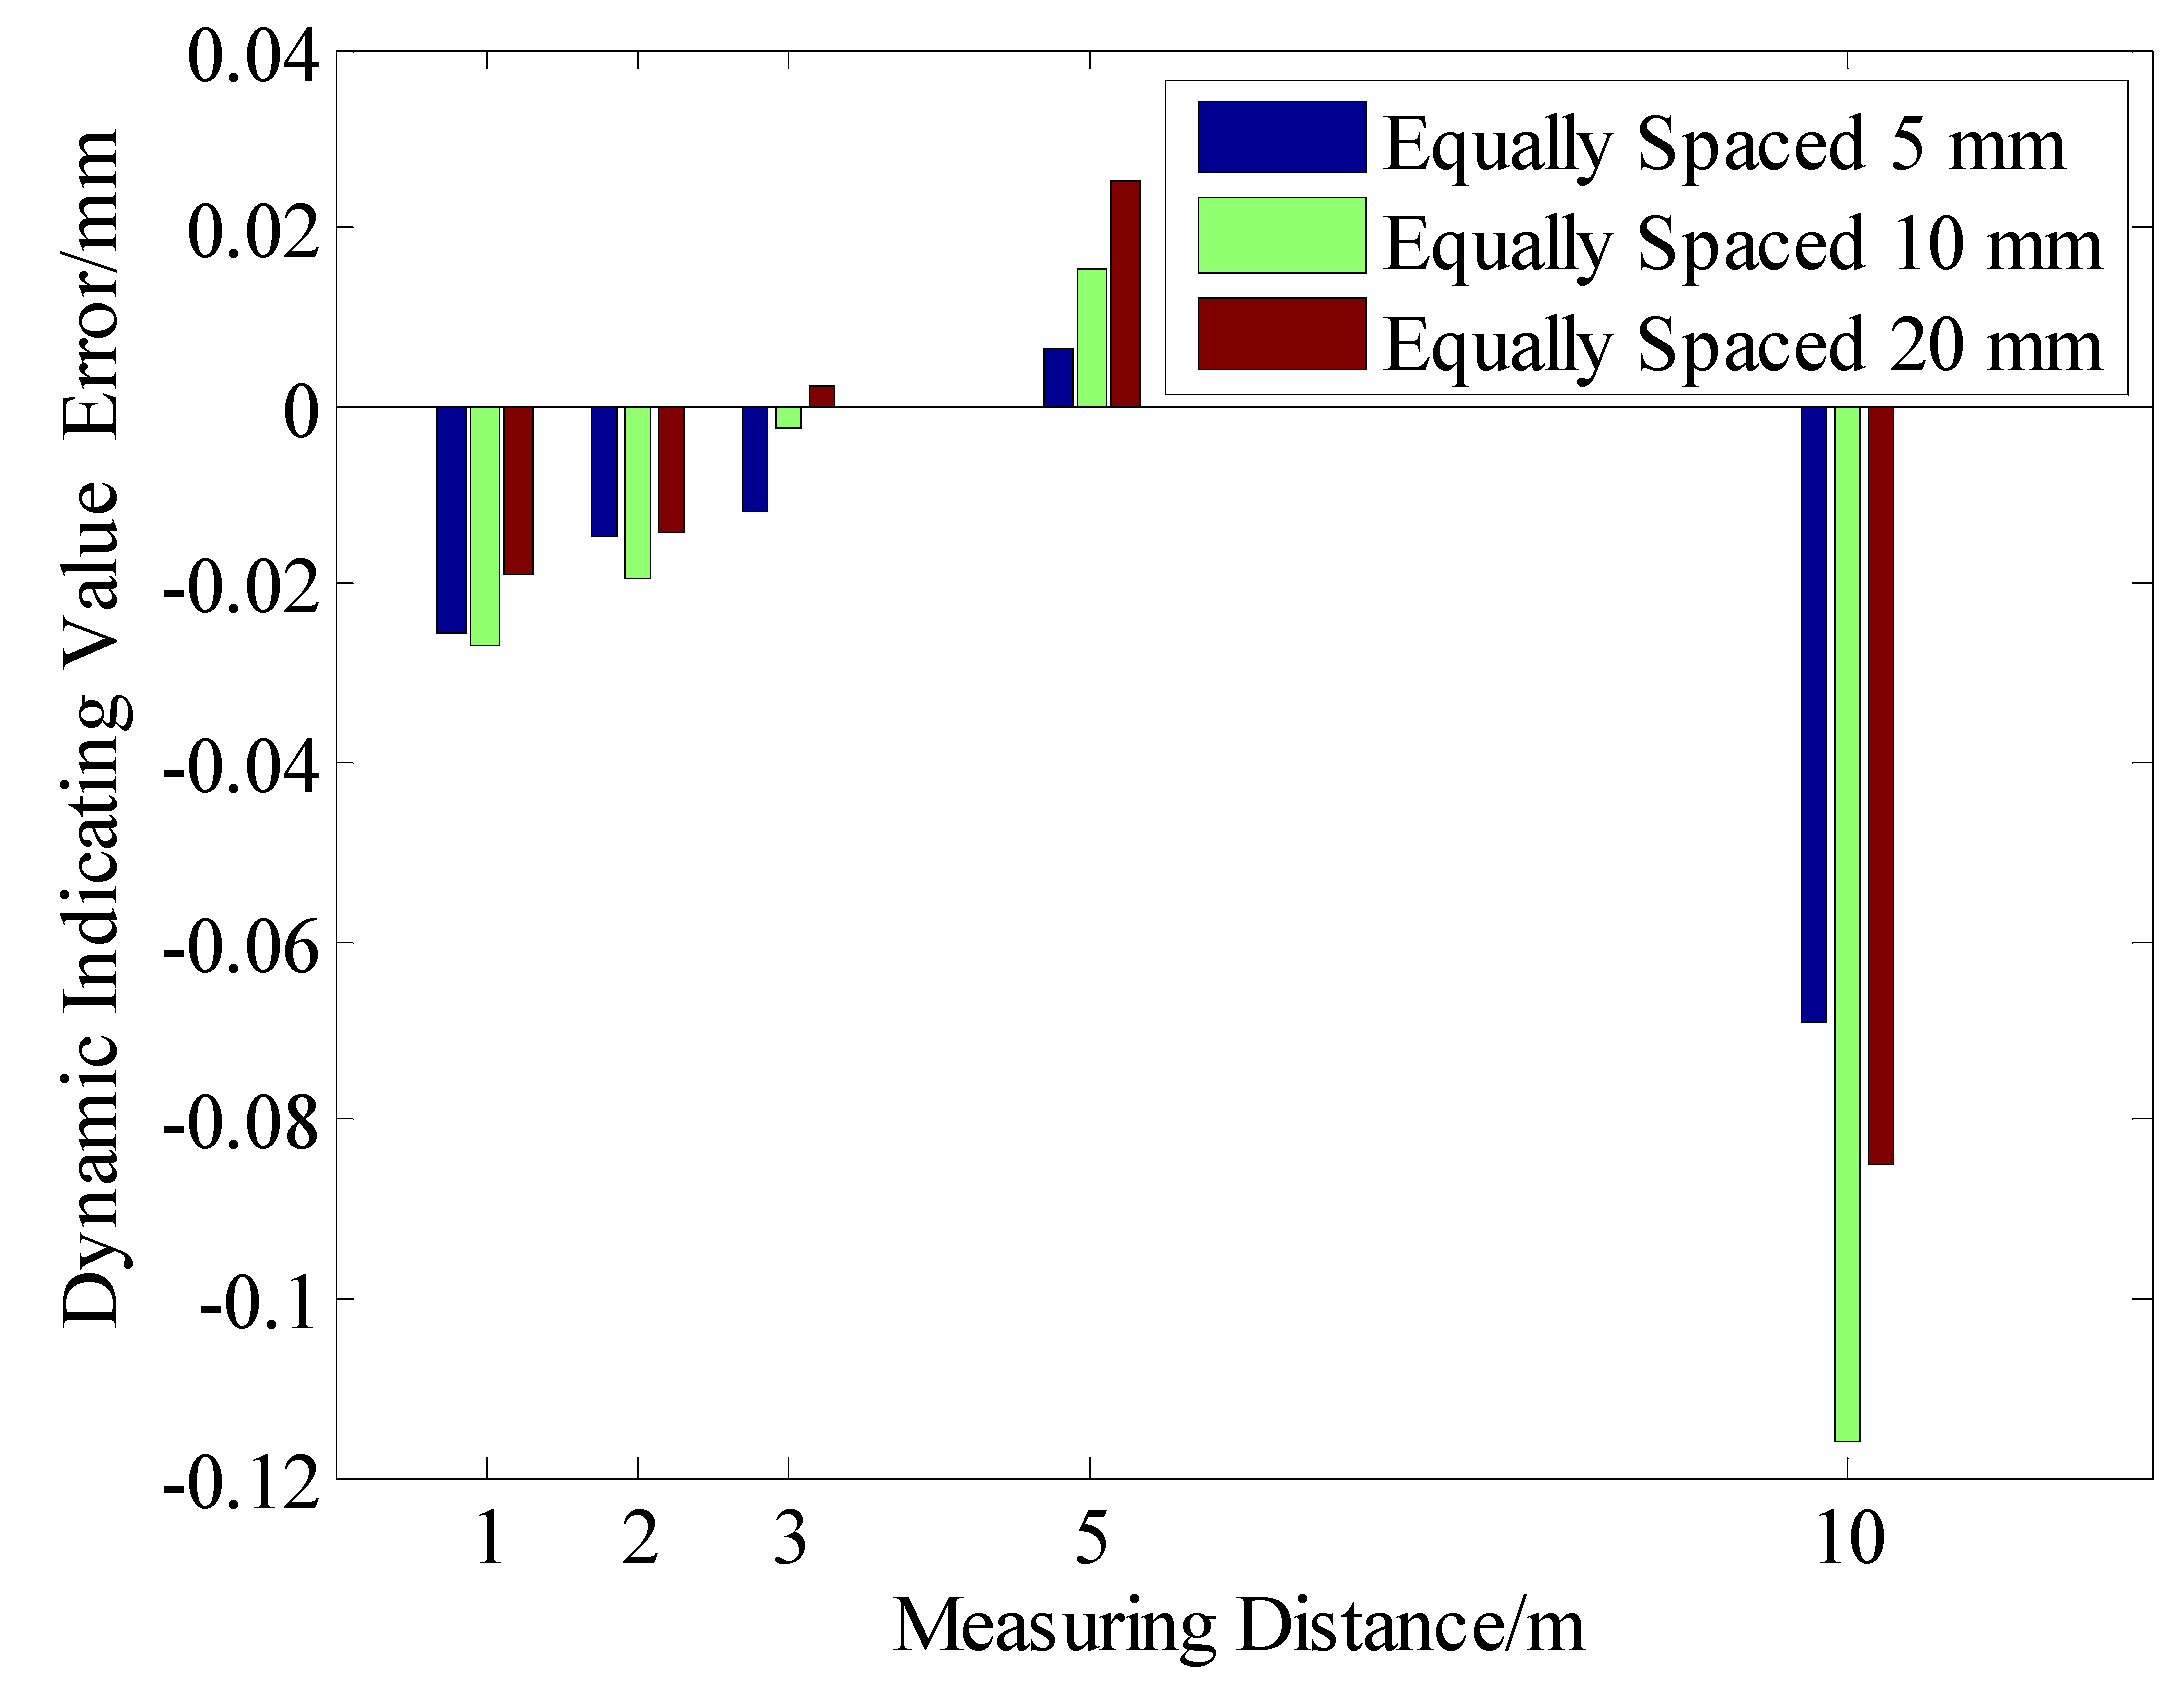
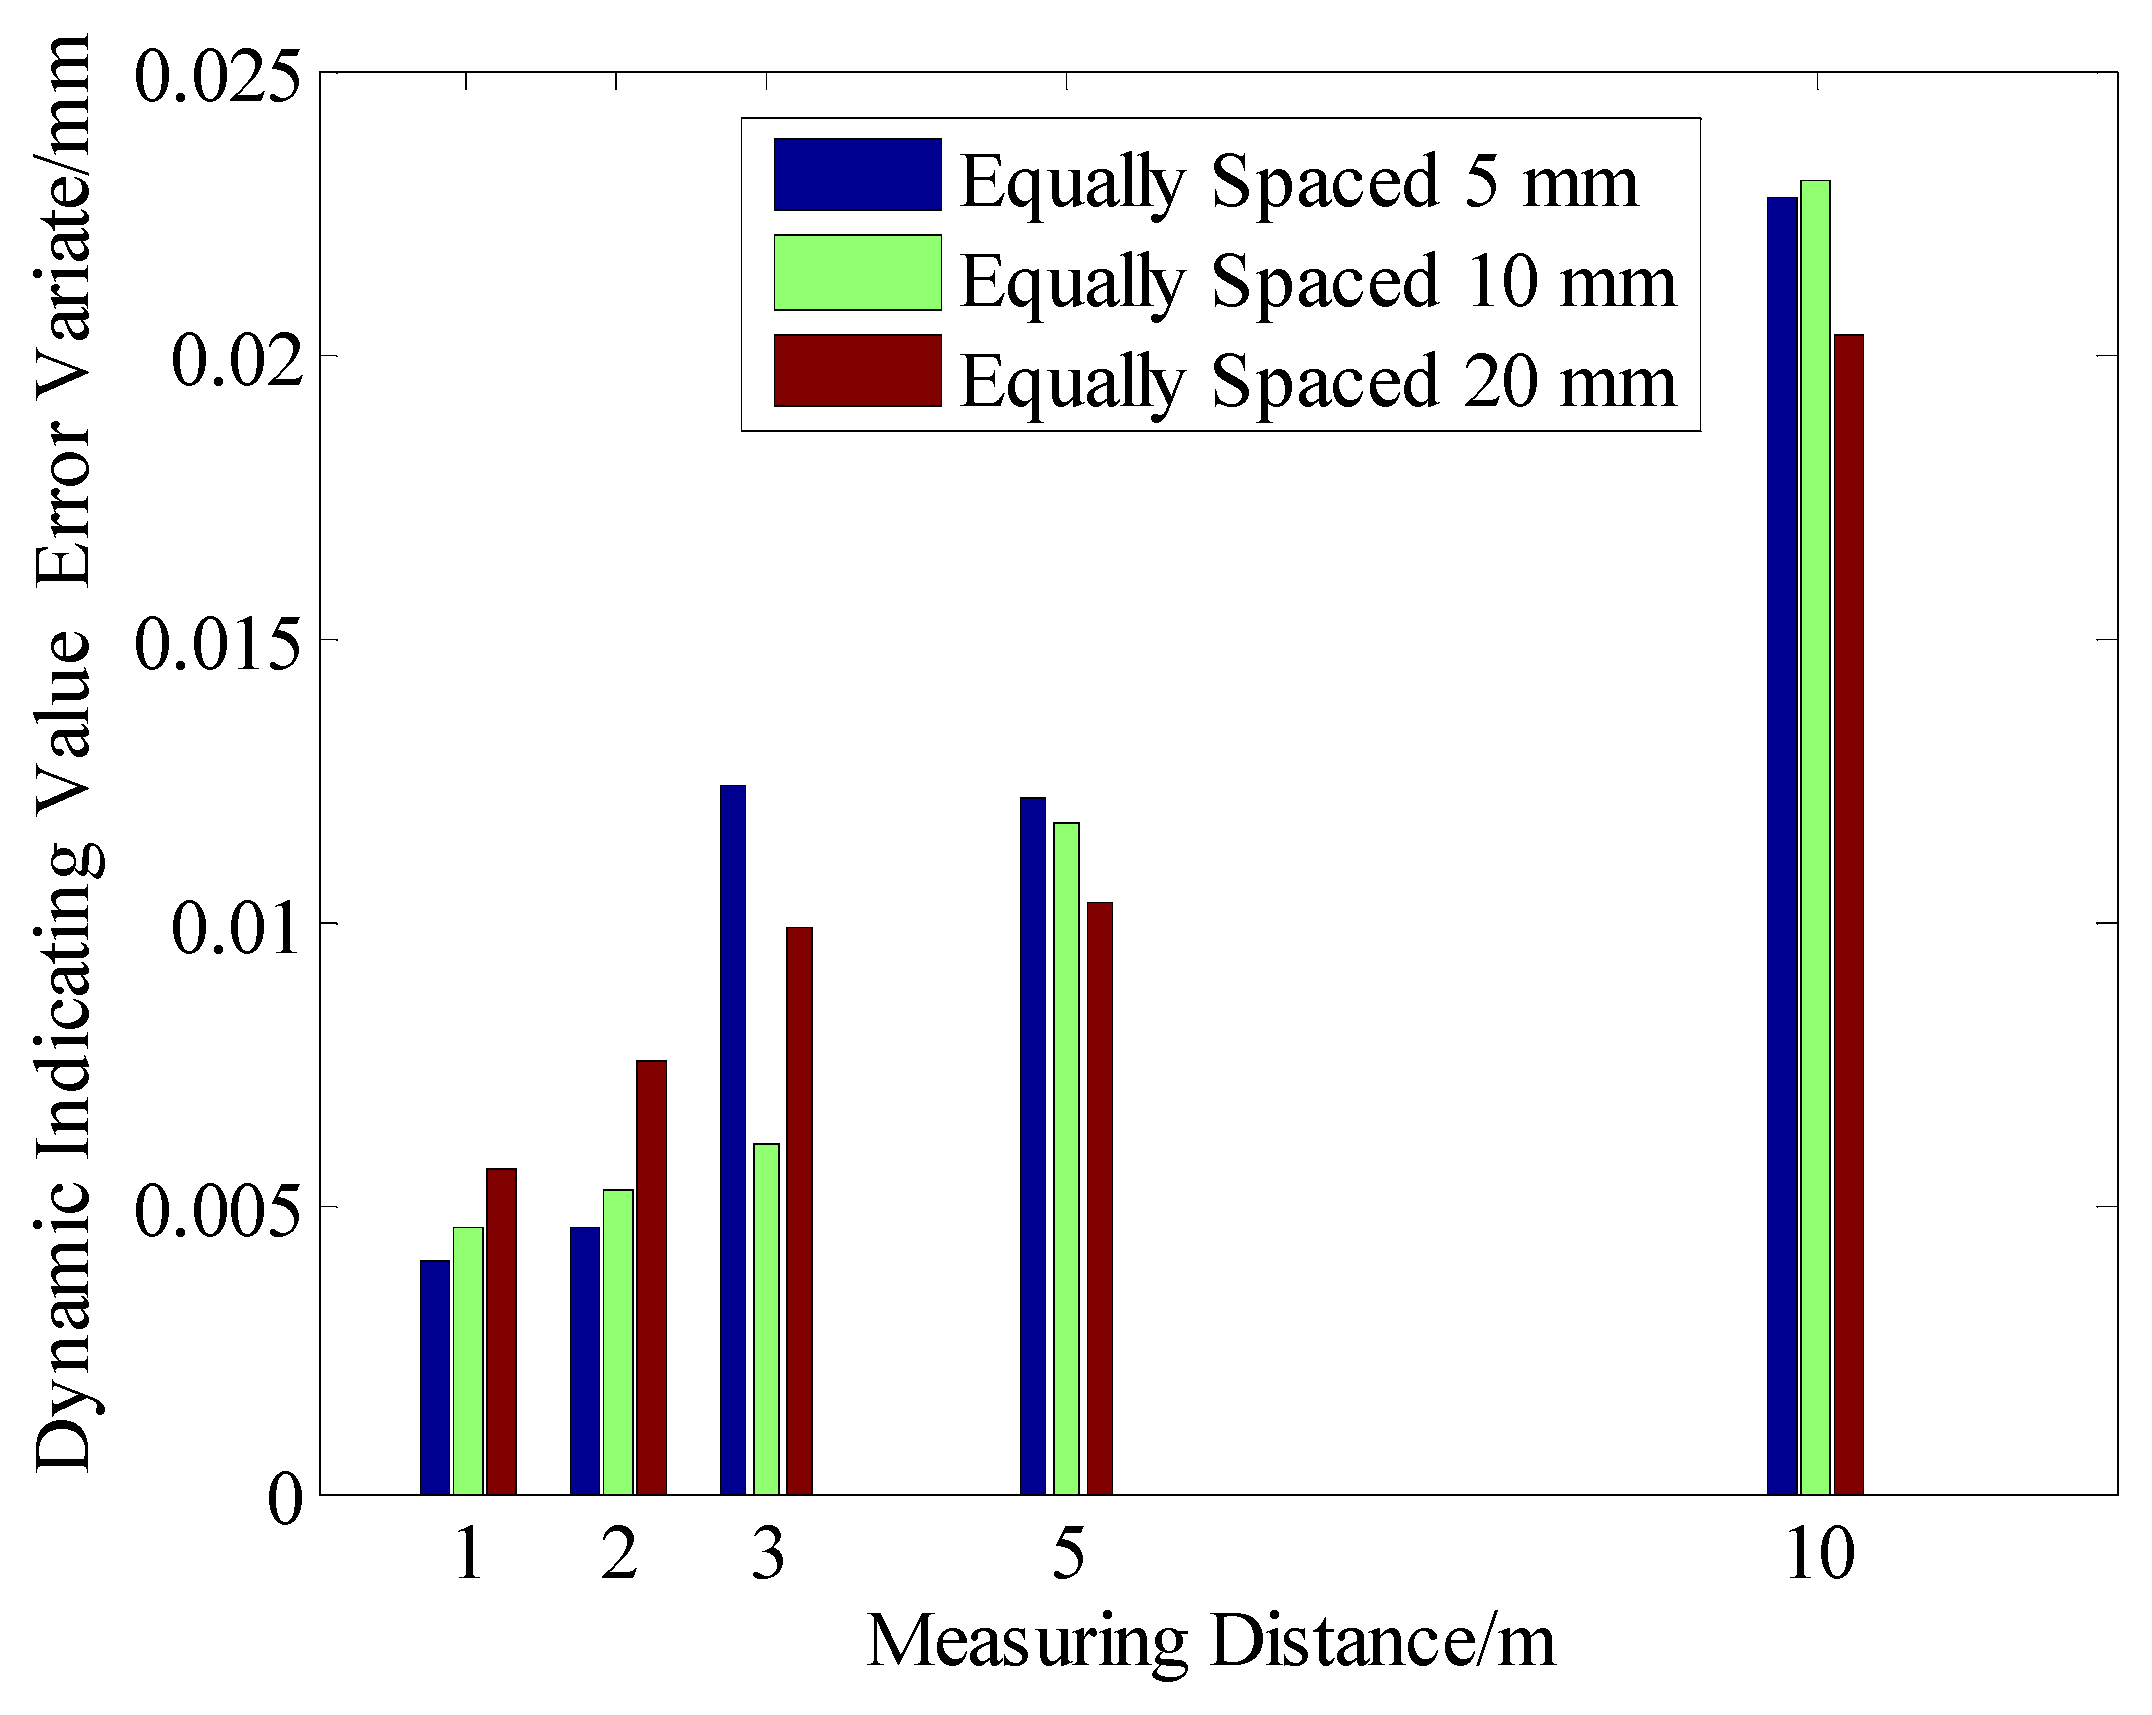
4.2.1. Analysis of the Data Collected at Different Distances with Equal Spacing

In this study, the distance of the laser tracker from the circular trajectory generator was set to 1 m, 2 m, 3 m, 5 m, and 10 m; the equal spacing of the laser tracker was set to 5 mm, 10 mm, and 20 mm; and the equal sampling frequency of the laser tracker was set to 10 Hz, 20 Hz, and 50 Hz. The performance parameters of the laser tracker under dynamic state were analyzed in different scenarios. The schematic diagram of measurement is shown in Figure 3. Four transfer stations are arranged around the circular trajectory generator, and the measurement accuracy of the transfer stations is 0.0155 mm, 0.0177 mm, 0.0199 mm, and 0.0264 mm, respectively.
Table 1 shows the dynamic performance of the laser tracker when measuring at equal spacing. The projection position of sampling points for different measurement intervals is shown in Figure 4. It means that the measurement points were projected in the Y-axis direction for the measurement distance of 1 m. And it is obvious that there is a large amount of data for the measurement intervals of 5 mm and 10 mm. Through data analysis, we drew the following four conclusions:
Within 10 m, the dynamic limit speed increases with the increase of the measurement distance. Figure 5 shows the relationship between dynamic limit speed and measured distance. As the measurement distance increases, the swing amplitude of the measuring head of the laser tracker decreases. When the measurement distance is 10 m, the maximum rotational velocity of the circular trajectory generator is 23.42 rad/s. At this time, the dynamic limit rotational velocity VL of the laser tracker reaches 10.57 m/s. With the increase of measurement distance, the maximum rotational velocity of the circular trajectory generator rises, but it may cause safety issues.
Under the dynamic state, after setting the equal spacing for the laser tracker, the actual spacing is greater than the set one. Figure 6 shows the relationship between the dynamic limit speed and the actual measured interval. When the circular trajectory generator is at low speed, the difference between the two is insignificant, but the difference becomes great with the speed increase. The larger the actual measurement spacing, the fewer the measurement points. It can be seen in Table 1 that the equal spacing of the laser tracker is 5 mm. The actual spacing is 7.17 mm at the dynamic limit speed of 3.40 m/s. When the speed is set to 4.60 m/s, the actual spacing is 6.47 mm.
The dynamic indication error is smallest when the measurement distance is 3 m, indicating that the fitted diameter at a distance of 3 m is closest to the diameter of the circular trajectory generator. Figure 7 shows the relationship between measurement distance and dynamic indicating value error. For example, when the measurement distance is 1 m and the equal spacing of the laser tracker is set to 5 mm, 10 mm, and 20 mm, the dynamic indication error is −0.0253 mm, −0.0273 mm, and −0.0191 mm, respectively. When the measurement distance is 2 m and the equal spacing of the laser tracker is set to 5 mm, 10 mm, and 20 mm, the dynamic indication error is −0.0146 mm, −0.0194 mm, and −0.0143 mm, respectively. When the measurement distance is 3 m, the dynamic indication error is −0.0117 mm, −0.0026 mm, and 0.0020 mm, respectively.
The value of the dynamic indication variable increases with the increase of the measurement spacing. Figure 8 shows the relationship between measured distance and dynamic indicating value error variate. Under the same distance, the dynamic indication variable is irregular when the measurement spacing set by the laser tracker increases. For instance, when the measurement distance is 1 m, and the equal spacing of the laser tracker is set to 5 mm, the dynamic indication variable is 0.00409 mm, and when the measurement distance is 2 m, the dynamic indication variable is 0.00462 mm. When the measurement distance is set to 3 m and the equal spacing of the laser tracker is 5 mm, 10 mm, and 20 mm, the dynamic indication variable is 0.01240 mm, 0.00615 mm, and 0.00995 mm, respectively.

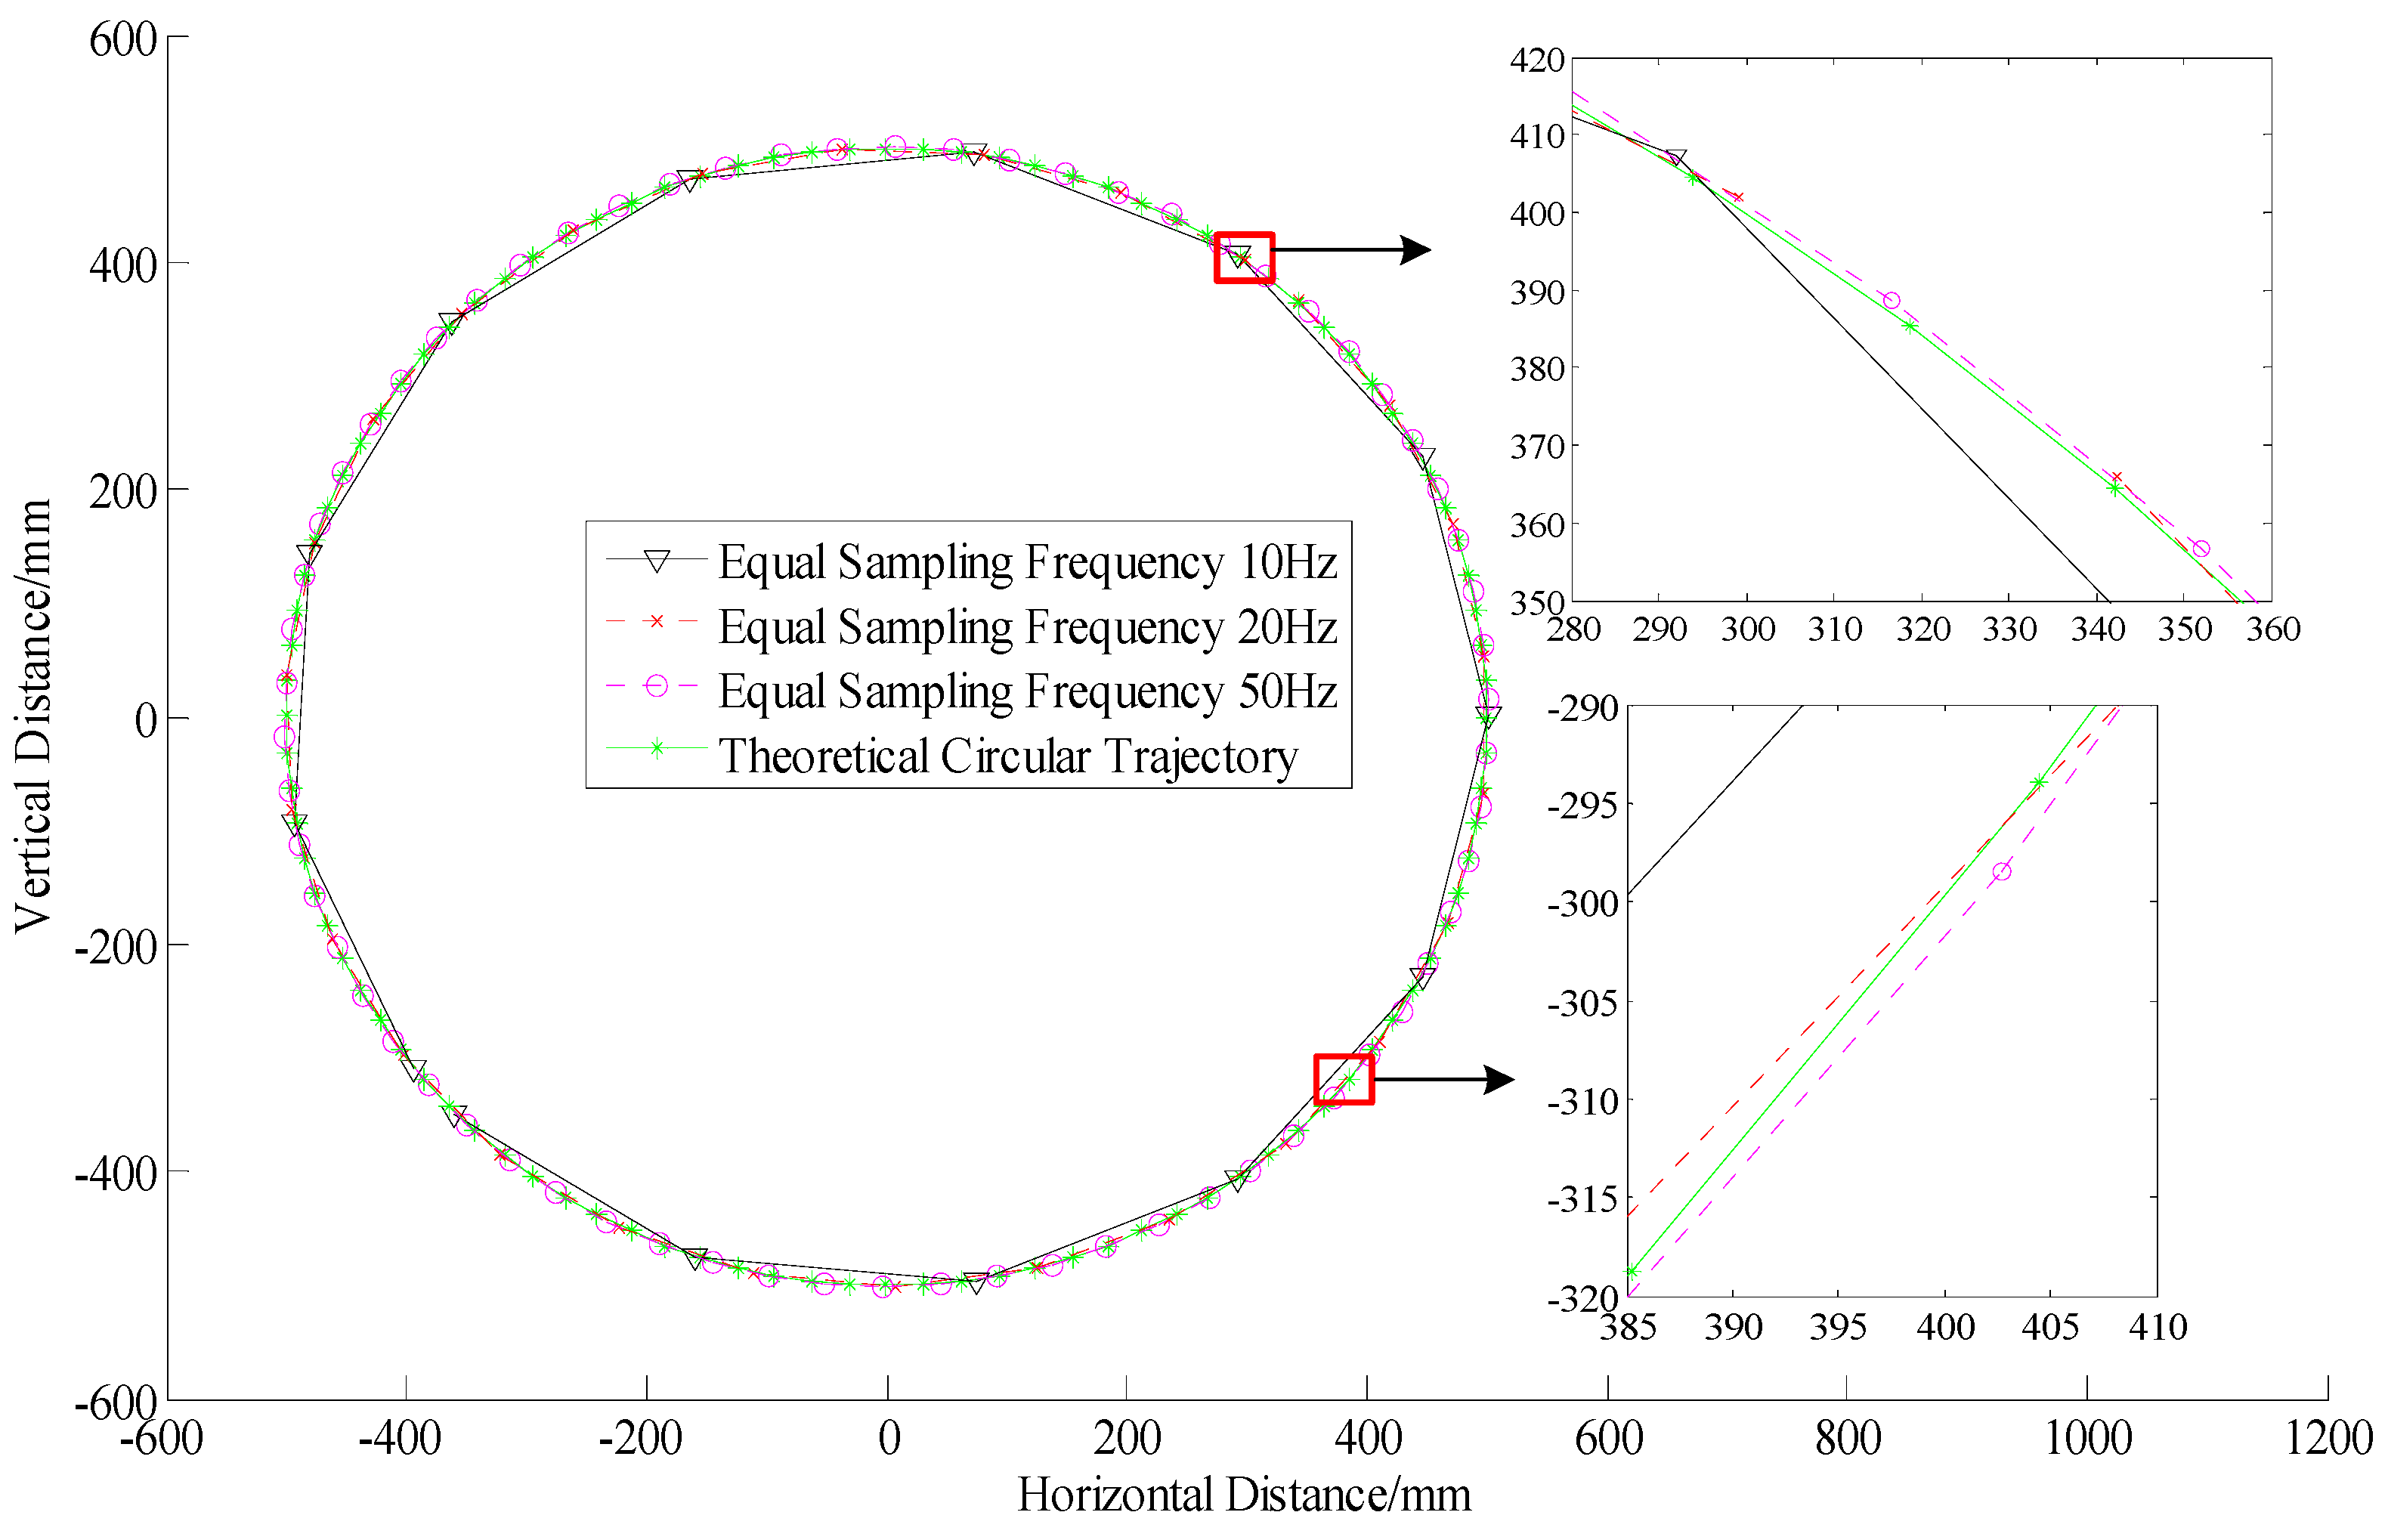
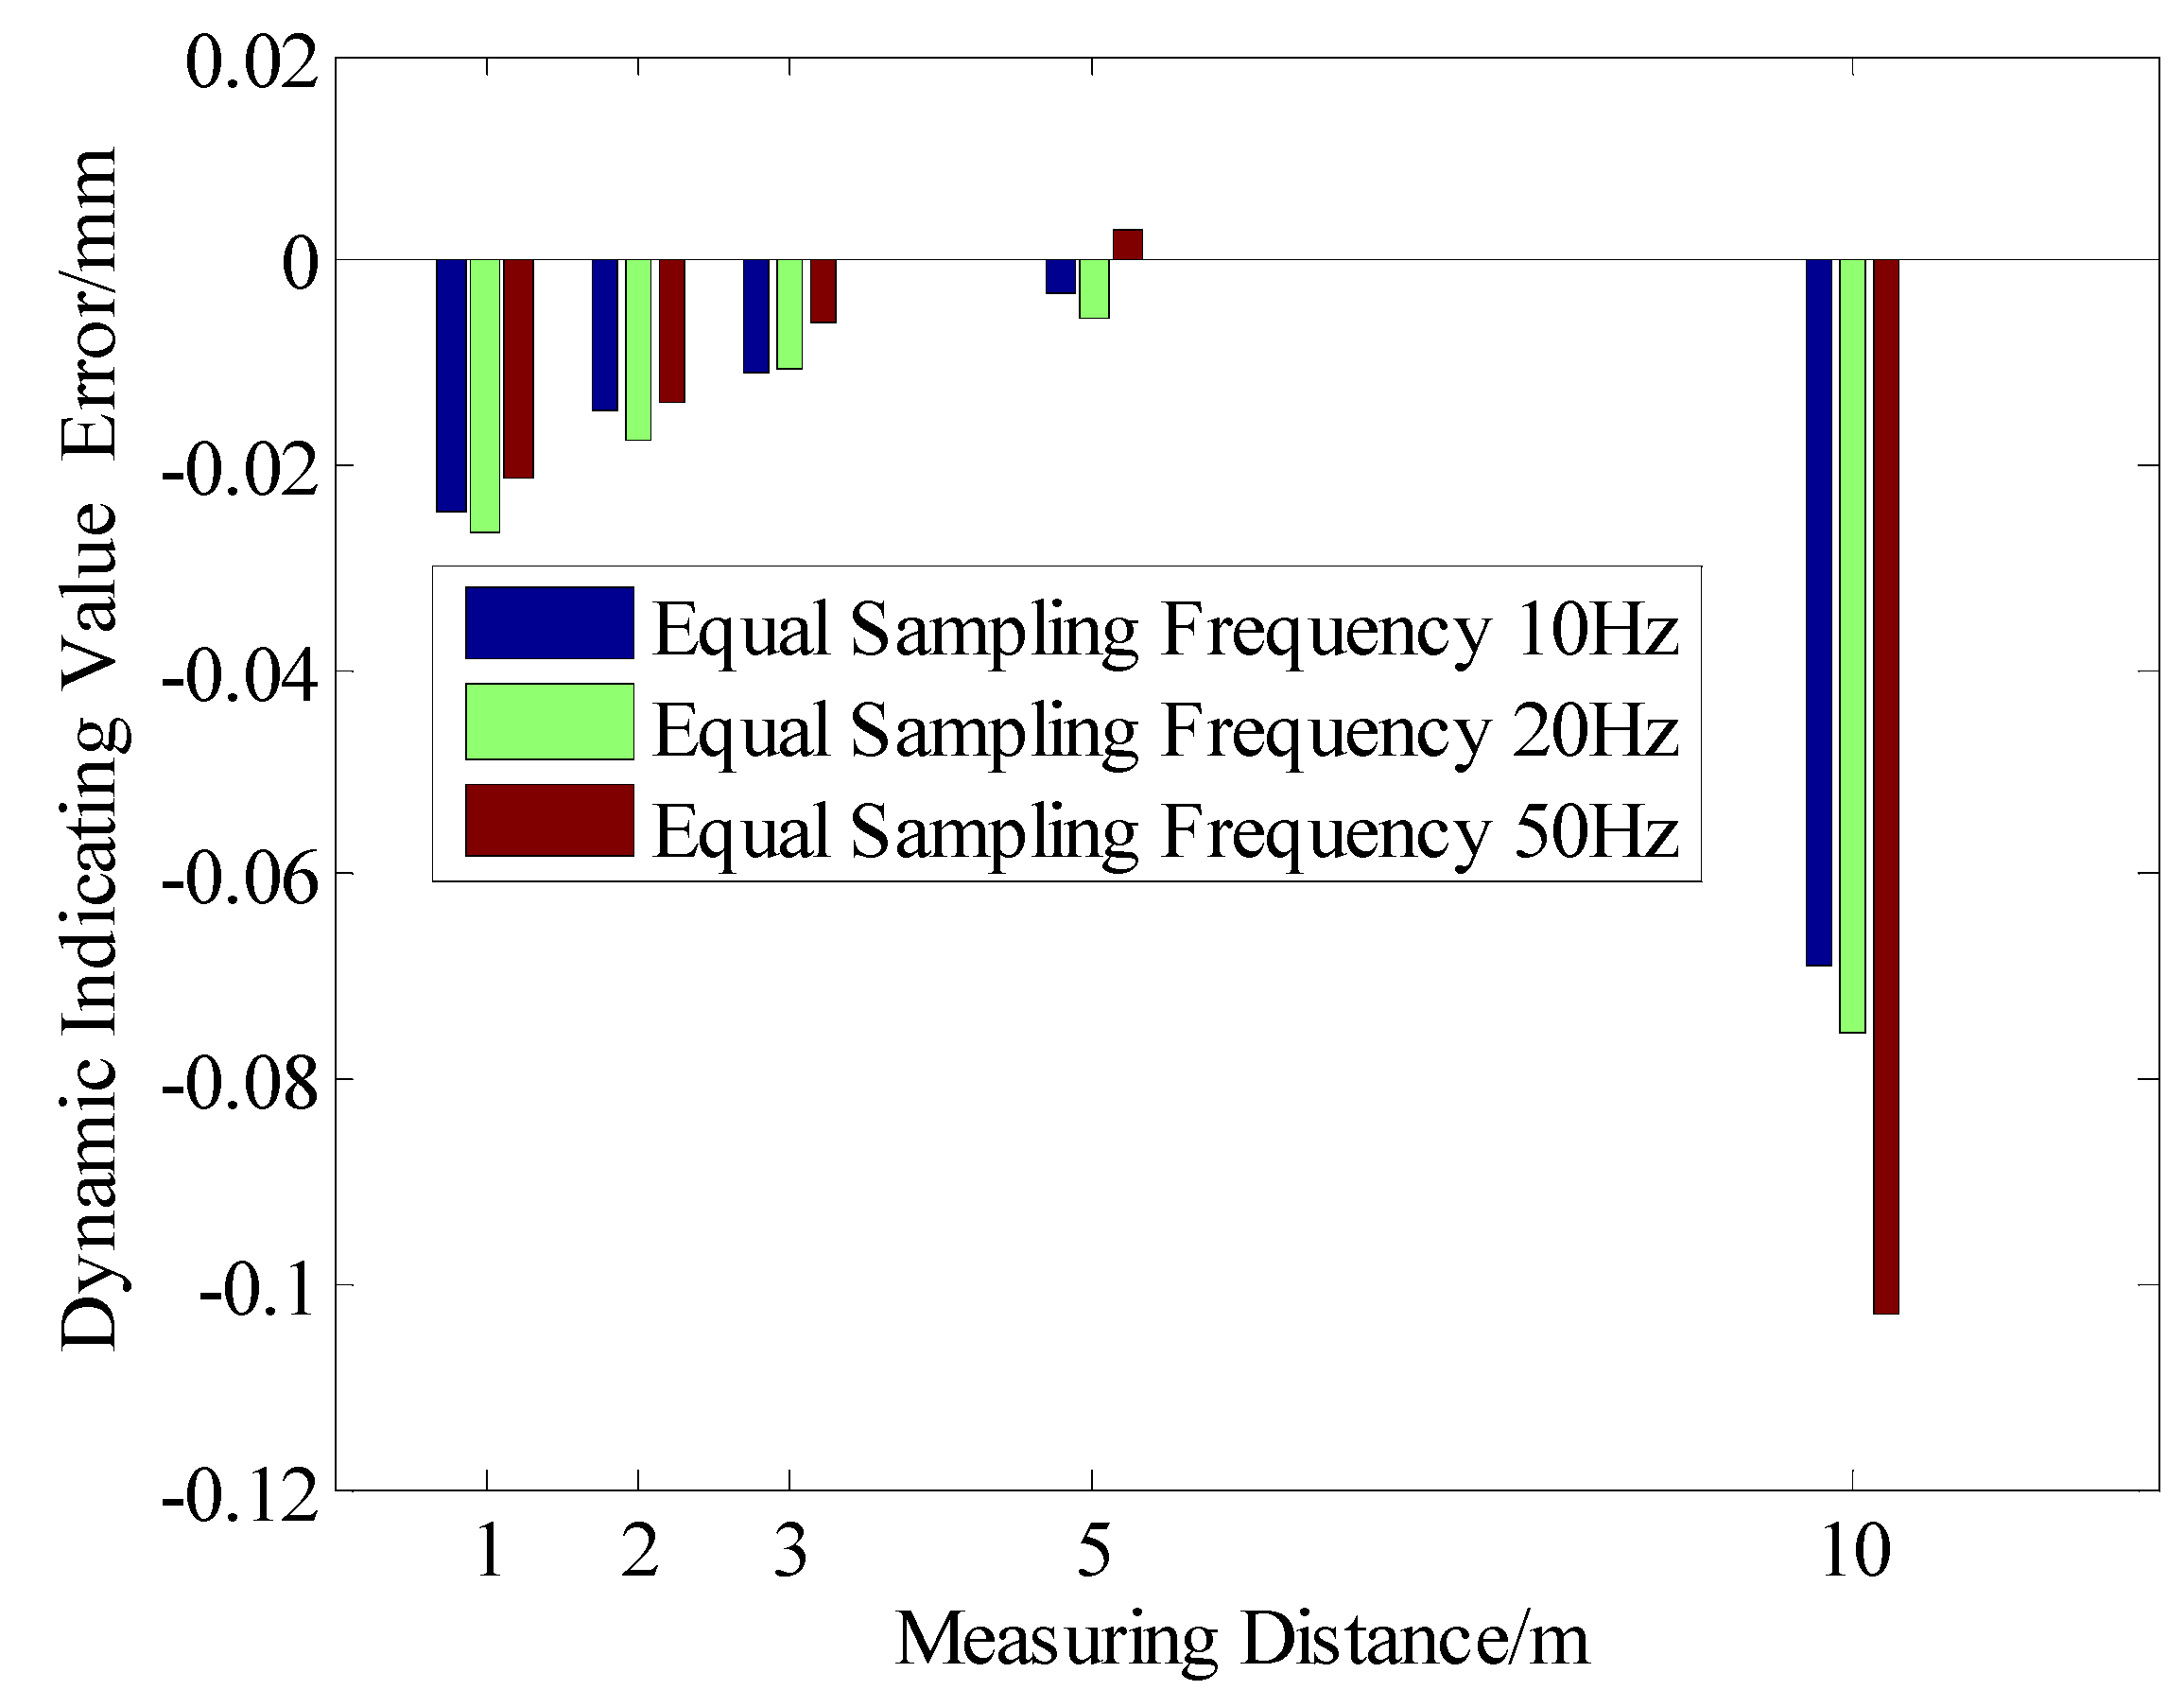
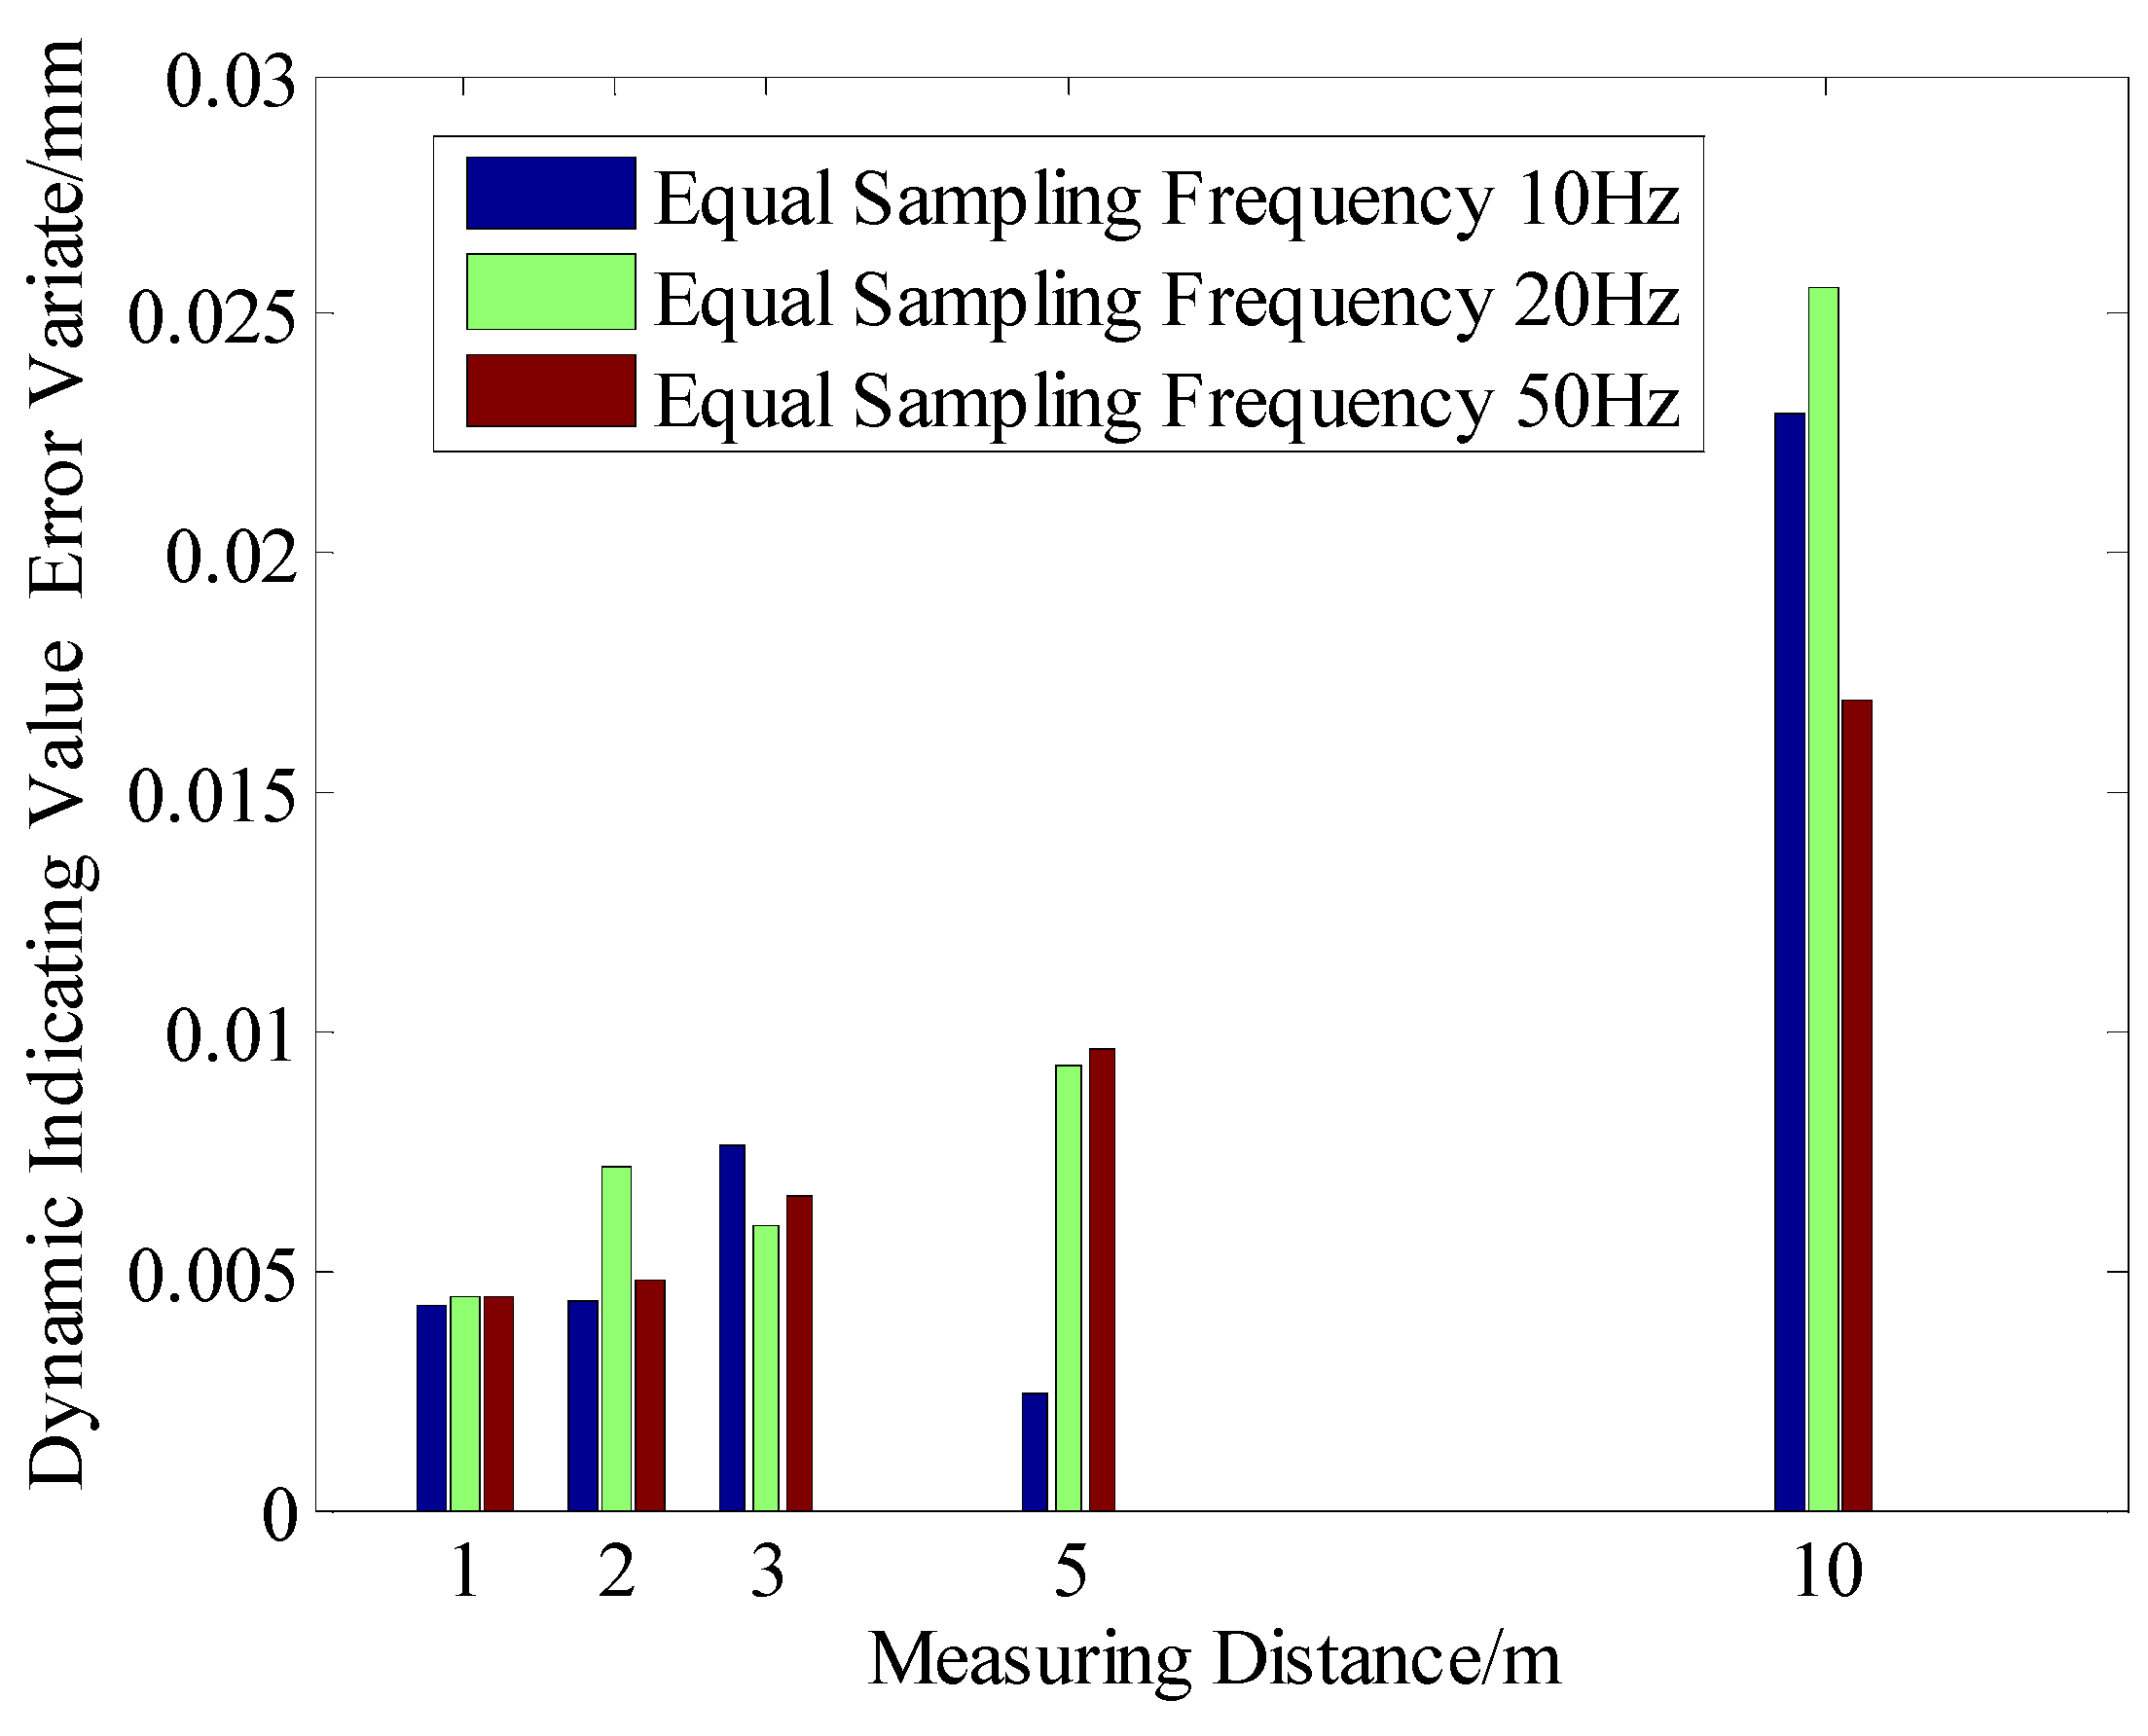
4.2.2. Data Analysis of Equal Sampling Frequency at Different Measurement Distances

Table 2 shows the dynamic performance of the laser tracker when measuring at an equal sampling frequency. Under the same measurement distance, the dynamic limit speed of the laser tracker is a fixed value, so Table 2 does not list the dynamic limit speed of the laser tracker. For the different measurement frequencies, which were respectively 10 Hz, 20 Hz, and 50 Hz, the measurement position of sampling points shown in Figure 9 was described by the projection. We can obviously see that the measured data deviate significantly when the measurement frequency is 10 Hz. The following three conclusions can be drawn from the data analysis in Table 2.
The dynamic indication error is smallest when the measurement distance is 5 m, indicating that the fitted diameter at a distance of 5 m is closest to the diameter of the circular trajectory generator. Figure 10 shows the relationship between measurement distance and dynamic indicating value error. For instance, when the measurement distance is 3 m, and the equal sampling frequency is set to 10 Hz, 20 Hz, and 50 Hz, the dynamic indication error is −0.0110 mm, −0.0107 mm, and −0.0060 mm, respectively. When the measurement distance is 5 m, and the equal sampling frequency is set to 10 Hz, 20 Hz, and 50 Hz, the dynamic indication error is −0.0034 mm, −0.0056 mm, and 0.0029 mm, respectively.
The dynamic indication variable increases as the distance increases. Under the same measurement distance, when the sampling frequency changes, the dynamic indication variable changes irregularly. For instance, when the equal sampling frequency is 50 Hz and the measuring distance increases, the dynamic indication variable is 0.00440 mm, 0.00477 mm, 0.00659 mm, 0.00960 mm, and 0.01694 mm, with an increasing trend in general. When the measurement spacing is 1 m, and the sampling frequency is 10 Hz, 20 Hz, and 50 Hz, the dynamic indication variable is 0.00428 mm, 0.00448 mm, and 0.00440 mm, showing an irregular change. Figure 11 shows the relationship between measured distance and dynamic indicating value error variate.
Under the same sampling frequency, the number of measurement points decreases when the measurement spacing increases. At the same measurement distance, the frequency of sampling points has a fixed relationship with the number of measurement points. For example, when the sampling frequency is set to 20 Hz and the measurement distance is 1 m, 2 m, 3 m, 5 m, and 10 m, the number of measurement points is 27, 20, 16, 12, and 9, respectively, with a decreasing trend. When the measurement spacing is 1 m, and the frequency of the measurement points is set to 10 Hz, 20 Hz, and 50 Hz, the number of measurement points is 14, 27, and 66, respectively, indicating that the sampling frequency has a fixed relationship with the number of measurement points under the fixed measurement spacing.

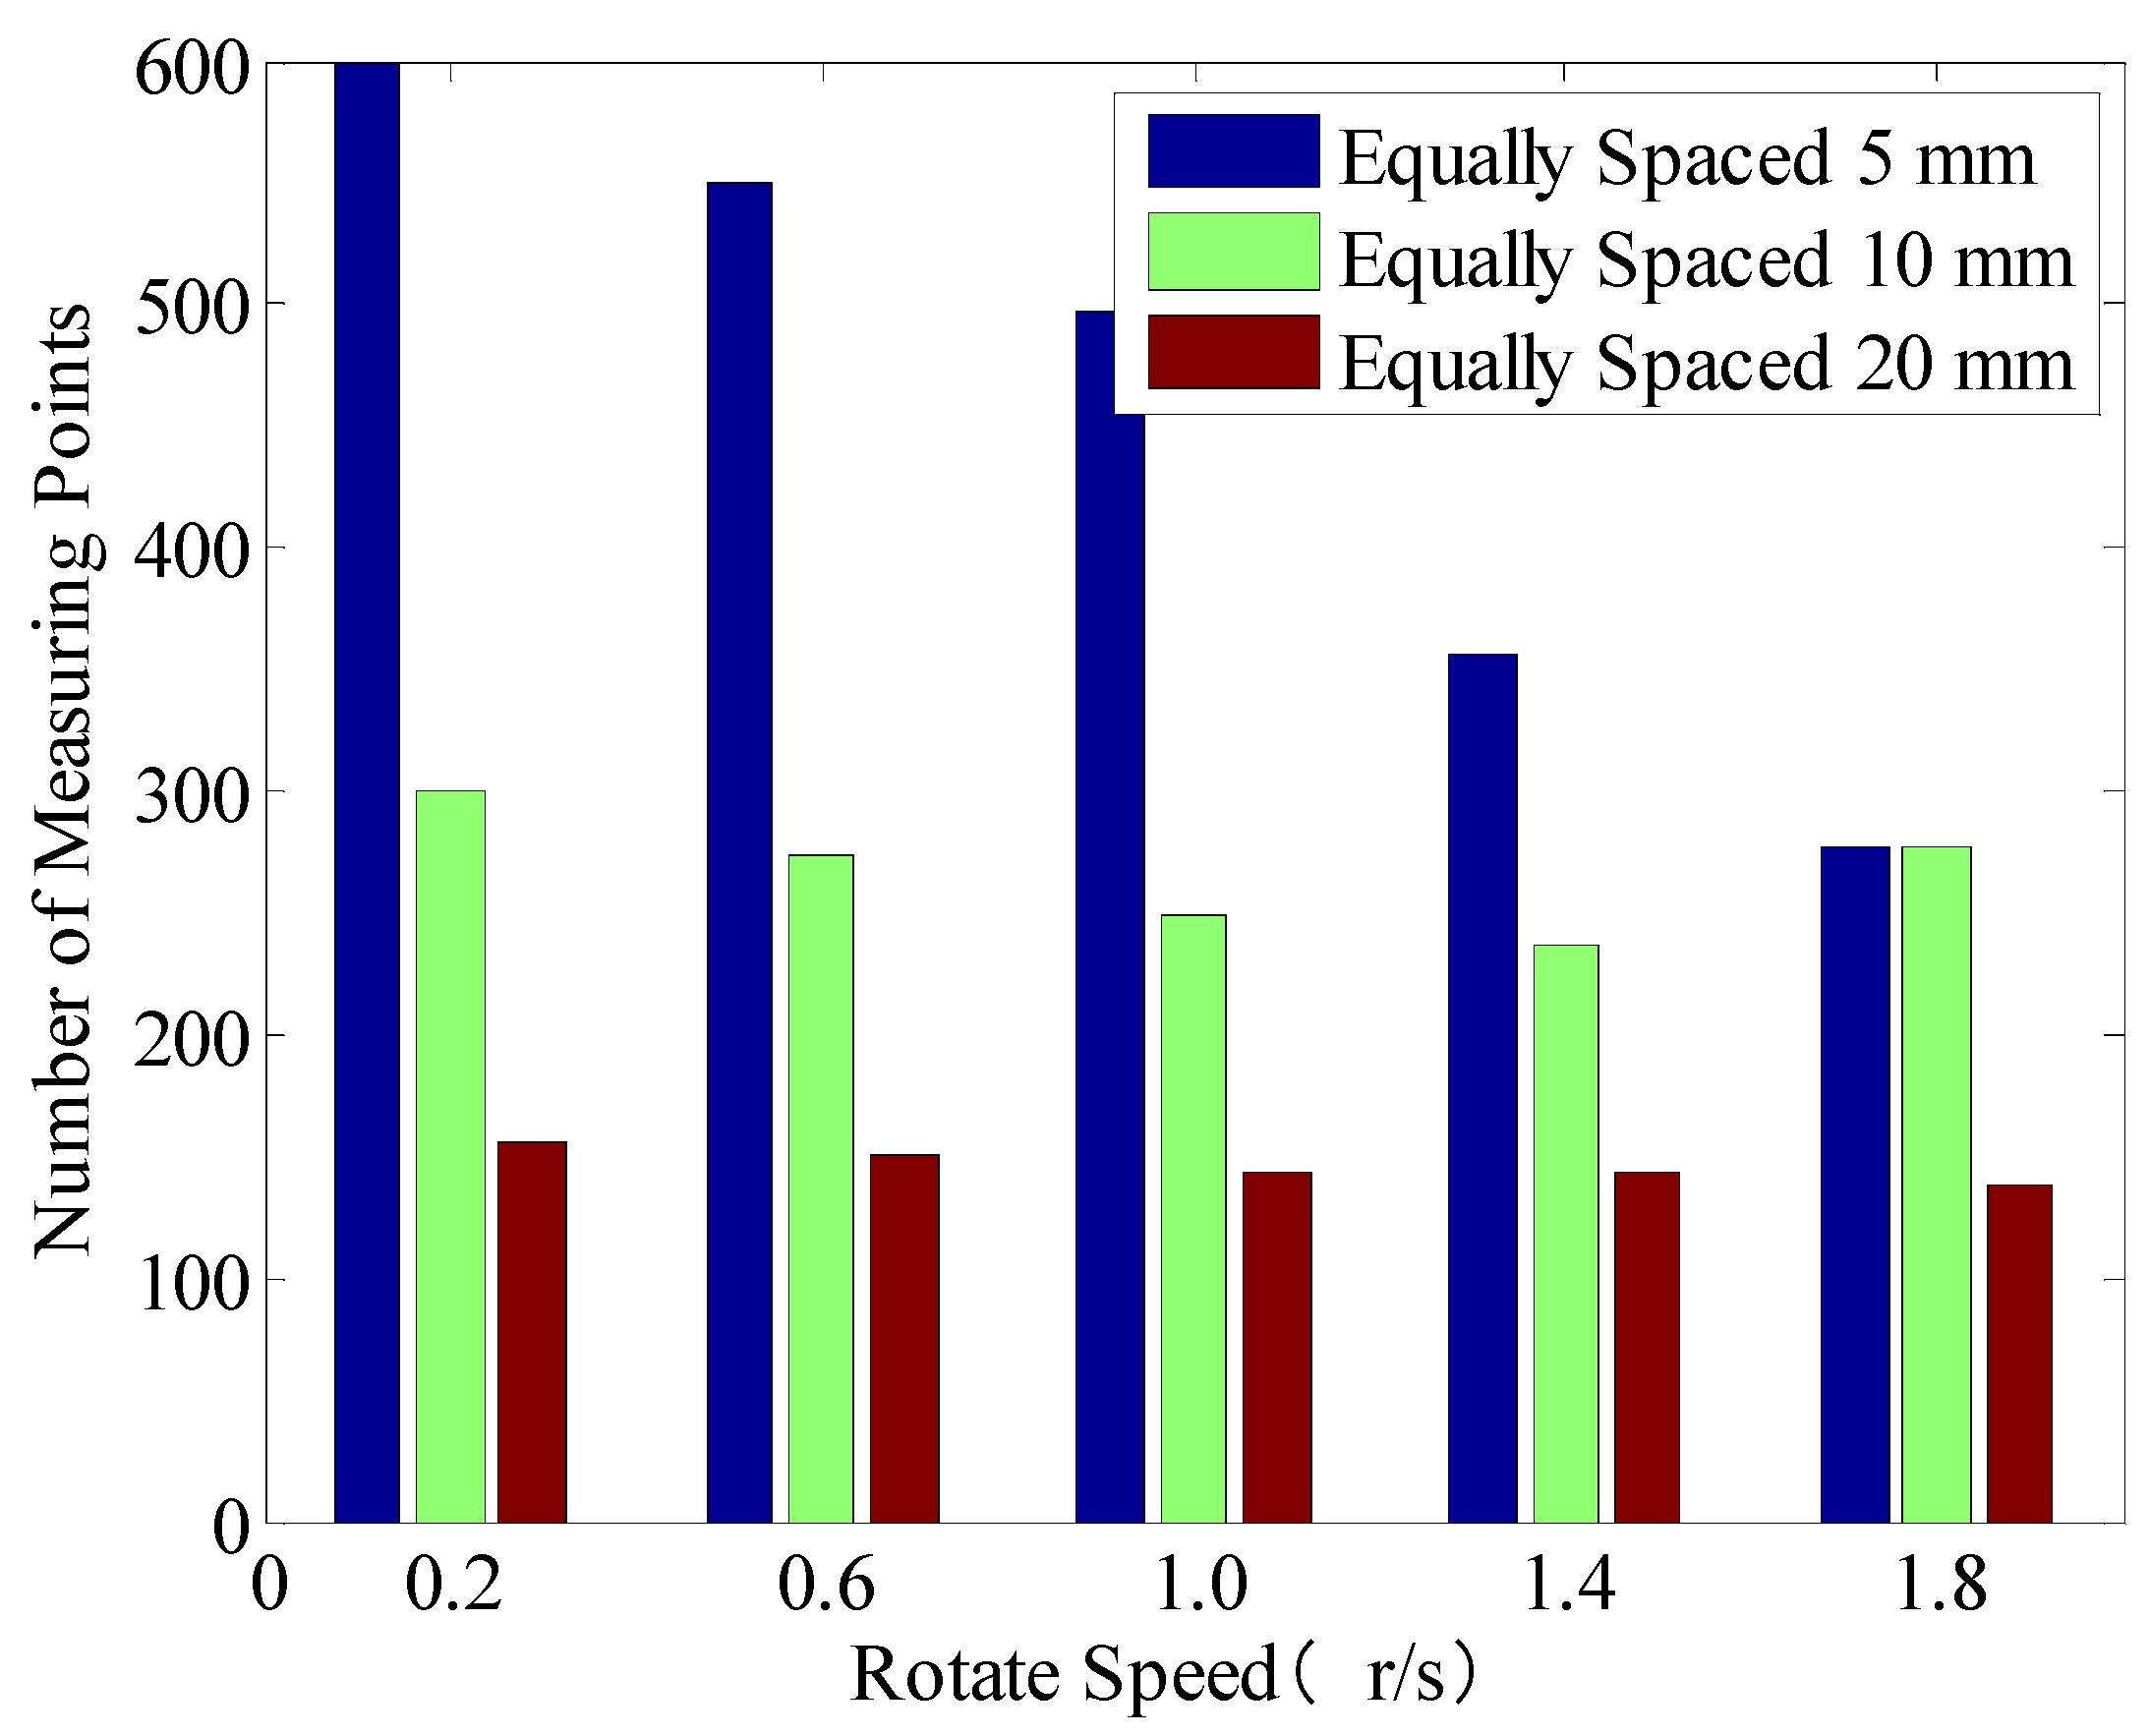
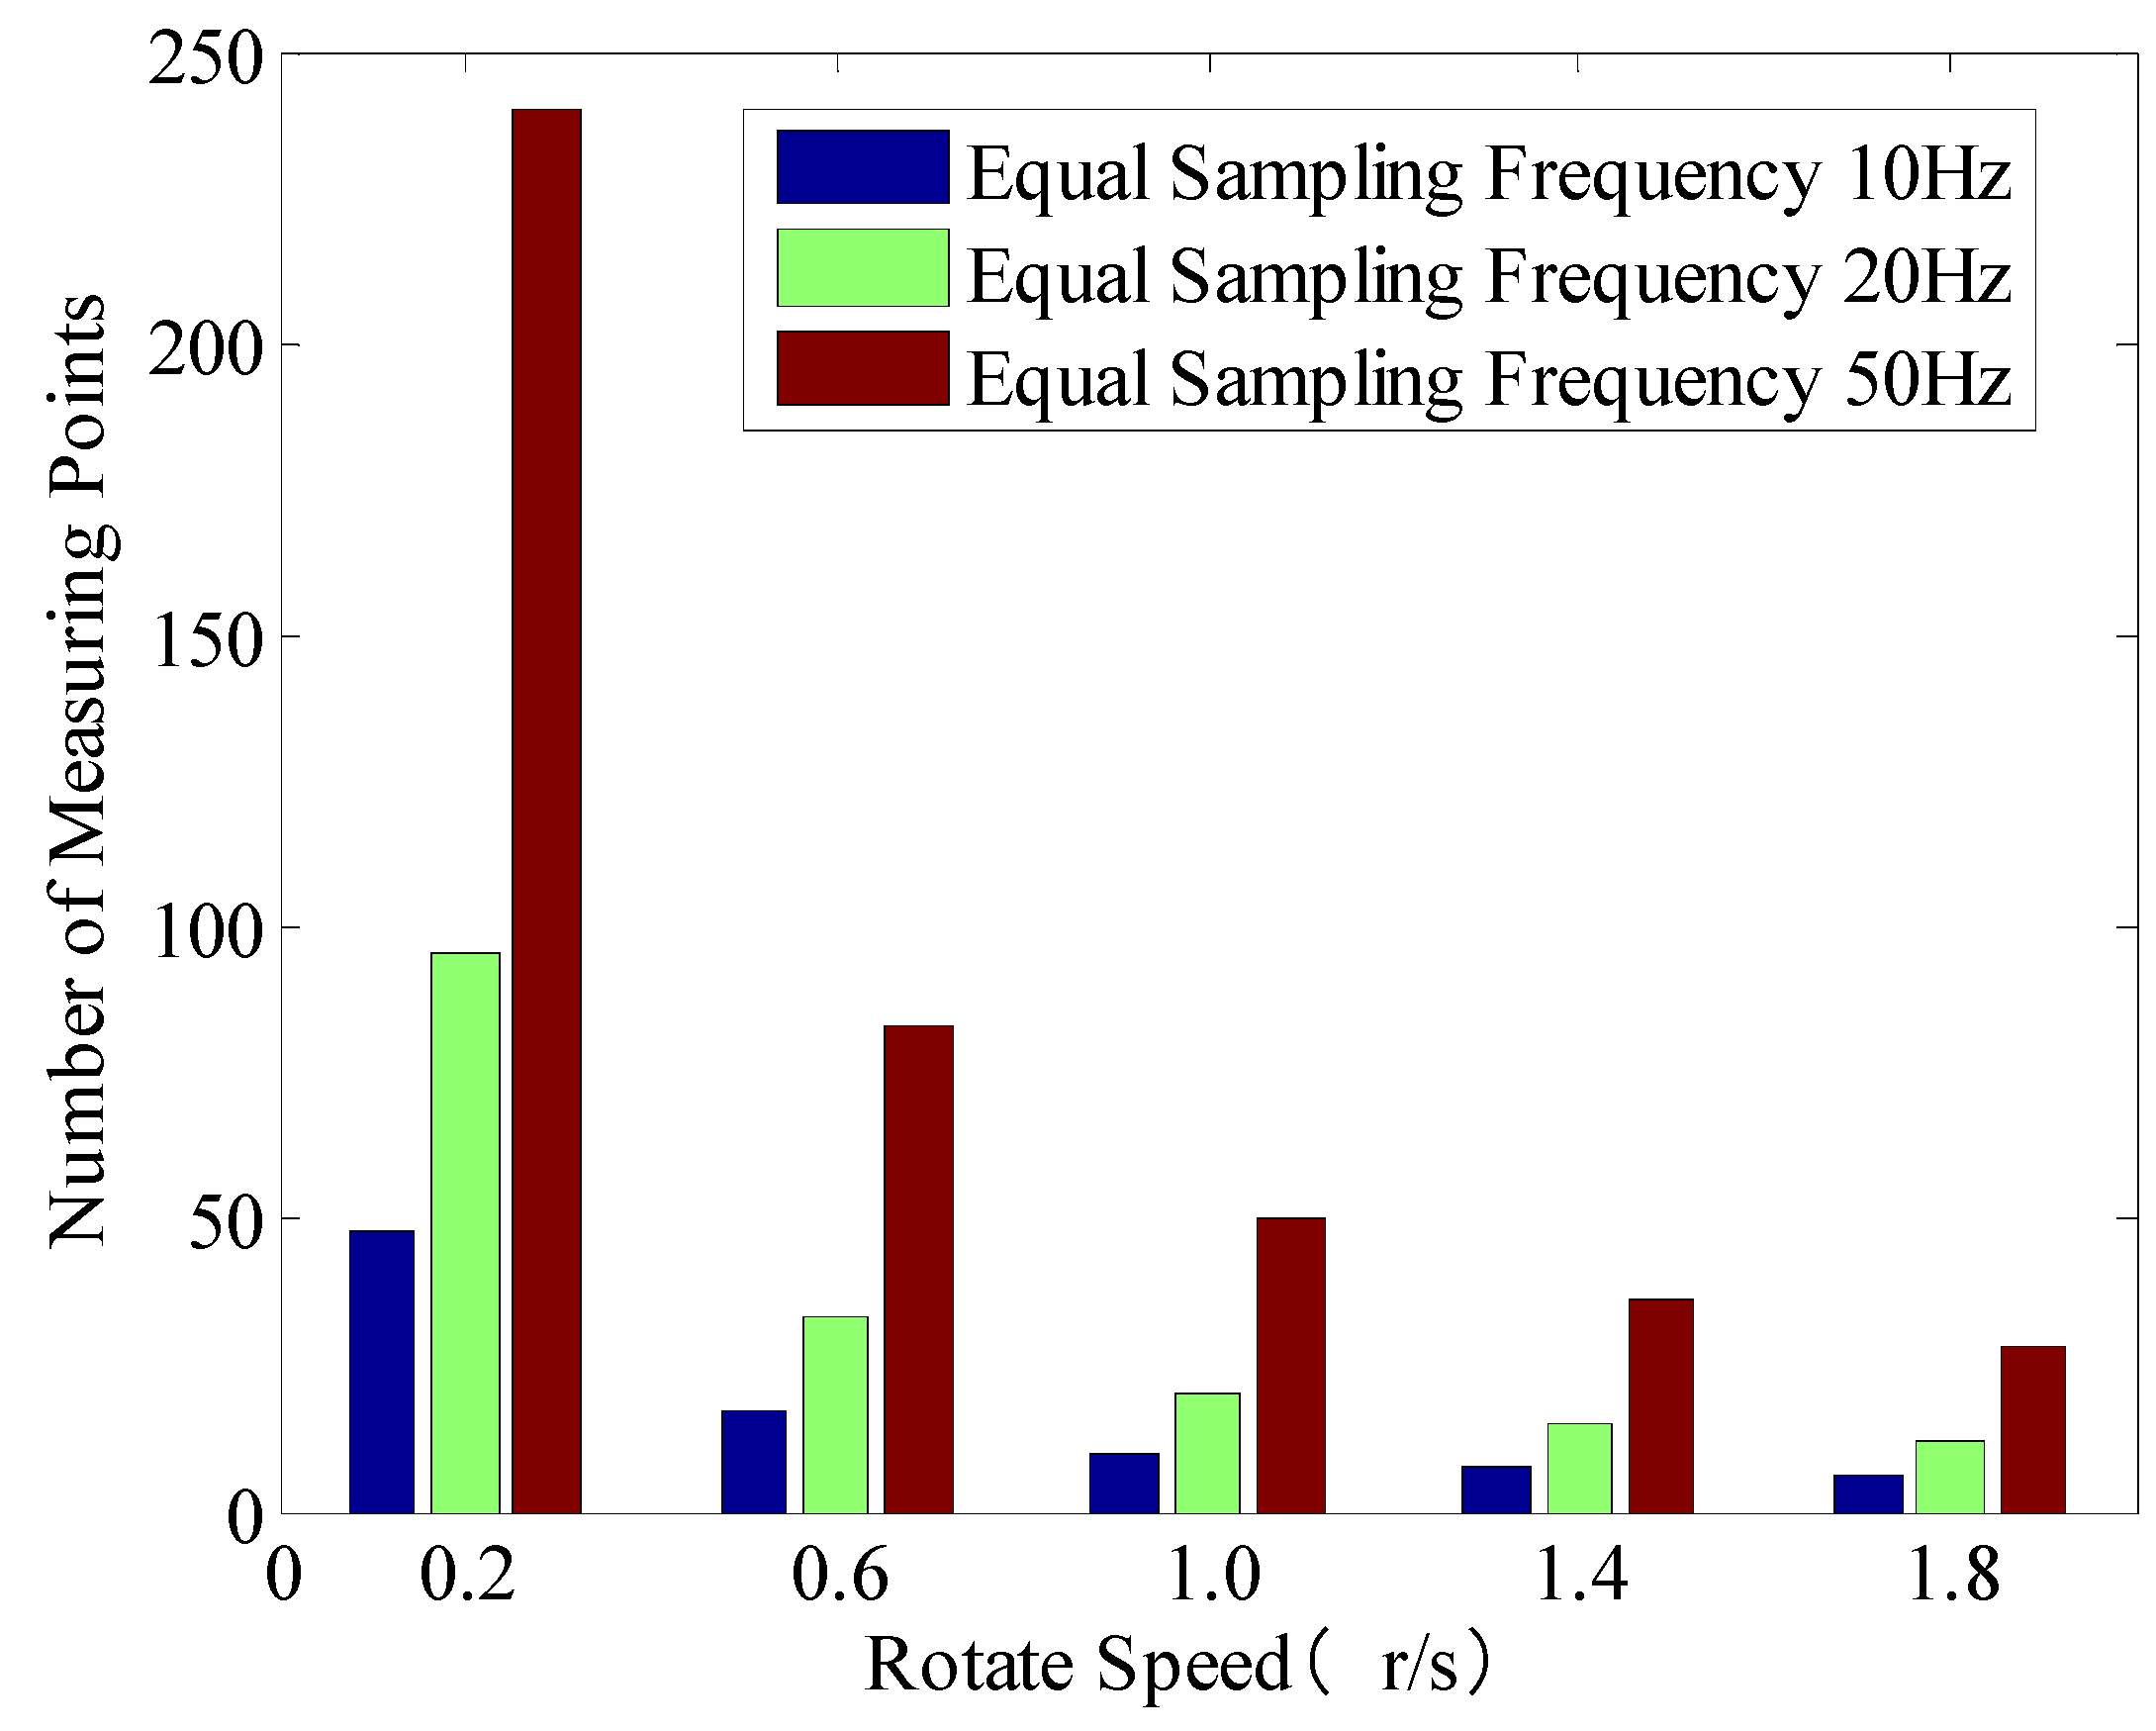
4.2.3. Data Analysis at the Same Measurement Distance and Different Rotational Velocities

When the measurement spacing is 3 m, we set different rotational velocities to calculate the dynamic indication error. Table 3 and Table 4 shows the dynamic performance of the laser tracker at different rotational velocities, equal sampling frequency, and equal spacing when the measurement distance is 3 m. The dynamic indication error here is not the measurement result of the laser tracker at the dynamic limit rotational velocity of RL. The following three conclusions can be drawn from the data analysis in Table 3 and Table 4.
(1) At low speed, the measurement spacing of sampling points is fixed proportionally to the number of measurement points. However, at high speed, the measurement spacing of sampling points is not proportional to the number of measurement points. Figure 12 shows the relationship between the rotation speed of the circular trajectory generator and the number of measuring points. With the increase in the rotational velocity of the circular trajectory generator, the gap between the actual value of the measurement spacing of the laser tracker and the theoretical value of the measurement spacing shows an increase. For example, if the rotational velocity of the circular trajectory generator is 0.2 r/s when the equal spacing is 5 mm, the number of measurement points of the laser tracker is 600, and when the equal spacing is 10 mm, the number of measurement points is 300. If the rotational velocity is 0.06 r/s when the equal spacing is 5 mm, the number of measurement points is 549, and when the equal spacing is 10 mm, the number of measurement points is 274. When the rotational velocity of the circular trajectory generator is set to 1.0 r/s, the measurement spacing of sampling points is still fixed proportionally to the number of measurement points. But this rule does not hold anymore when the rotational velocity is set to 1.4 r/s and 1.8 r/s. When the rotational velocity is 0.2 r/s, the distance between the actual measurement points is 5.21 mm and 10.47 mm if the equal spacing of the laser tracker is set to 5 mm and 10 mm. When the rotational velocity is 1.8 r/s, the distance between the actual measurement points is 11.33 mm and 11.39 mm if the equal spacing of the laser tracker is set to 5 mm and 10 mm.
(2) Whether at low speed or high speed, the sampling frequency is fixed proportionally to the number of measurement points at the fixed speed. Conclusion (3) in Section 4.2.2 indicates that the sampling frequency has a fixed relationship with the number of measurement points at the fixed measurement distance and rotational velocity. The data analysis in Section 4.2.2 explores the experiment of the tracker at the dynamic limit speed, and this part examines the experiment at different rotational velocities. When the rotational velocity is set to 0.2 r/s, and the measurement frequency is set to 10 Hz, 20 Hz, and 50 Hz, the measurement points are 48, 96, and 240, respectively. Figure 13 shows the relationship between the rotation speed of the circular trajectory generator and the number of measuring points when the tracker is set at equal sampling frequency.

5. Discussion

In this section, the repeatability and stability of the measurement with different conditions, including the measurement distance and velocity, were analyzed according to the measurement relation of circular track generator and laser tracker.
For the dynamic limit speed, the fluctuation of the measurement result can be induced, which is related to the resolution of speed of the circular track generator and the dynamic tracking performance of the laser tracker. Because the resolution of the circular track generator is 0.01 r/s, the variation of dynamic limit speed is approximately 0.03 m/s. With the increase in measurement distance, the increasing trend of this variation is linear.
When the measurement distance is 1 m and the measurement distance is equal (5 mm), the dynamic display value variables are respectively 0.00493 mm, 0.00442 mm, 0.00394 mm, 0.00419 mm, and 0.00372 mm in the multiple identical experiments. According to six measurement results, the steady variate of dynamic display value can be calculated by subtracting the maximum from the minimum, which is 0.00121 mm. For evaluating the repeatability, the range method is employed, and the coefficient of range is 2.53. Hence, the repeatability of the dynamic display value is approximately 0.0005 mm. For the dynamic display value error represented by the difference between the measured radius and the nominal radius of the circle track generator, the stability and the repeatability were respectively 0.003 mm and 0.001 mm after multiple measurements. Therefore, the proposed method has the superior performance.
By analyzing the results of multiple measurements, the continuous working of the laser tracker was required for executing the dynamic measurement. However, the smallest dynamic indication error was generated when the measurement distance was 3 m. The dynamic indication error using the equal sampling frequency was smallest when the measurement distance was 5 m; hence, the range of 3–5 m was quite reliable for the dynamic measurement of the laser tracker.

6. Conclusions

With the constant advancement of the manufacturing industry, static measurement can no longer satisfy the needs, and the application of a dynamic measurement is increasingly in demand. The quantitative analysis of the dynamic measurement performance of the laser tracker as a large-size measurement tool is conducive to the development of dynamic measurement techniques. In this study, a standard circular trajectory generator was applied to explore and analyze the dynamic performance parameters of the laser tracker under different measurement spacings and measurement methods. The conclusions are as follows:
When measuring at different measurement distances and equal spacing, the dynamic limit speed increases with an increase in the measurement distance. Under the dynamic state, after setting the equal spacing for the laser tracker, the actual spacing is greater than the set one. At low speed, the difference between the two is not significant, but the difference becomes great as the speed increases. The dynamic indication error is slightest when the measurement distance is 3 m, indicating that the fitted diameter at a distance of 3 m is closest to the diameter of the circular trajectory generator. The value of the dynamic indication variable increases with an increase in the measurement distance.
When measuring at different distances and equal sampling frequency, the dynamic indication error is smallest when the measurement distance is 5 m, indicating that the fitted diameter at a distance of 5 m is closest to the diameter of the circular trajectory generator. The value of the dynamic indication variable increases with an increase in the measurement distance. Under the same measurement distance, the number of measurement points of the laser tracker varies proportionally with the change of the sampling frequency.
When the circular trajectory generator is at low speed, the spacing of the sampling points of the laser tracker is fixed proportionally to the number of measurement points. Whether the circular trajectory generator is at low speed or high speed, the sampling frequency of the laser tracker is fixed proportionally to the number of measurement points at the fixed rotational velocity.
In this study we have invested much effort in analyzing the dynamic performance of the laser tracker and data processing. In the future we will develop a straight lead rail device that can directly measure the dynamic performance of the laser tracker in a fast way.

Author Contributions

F.L. and C.H. designed the experiments, W.L. helped to perform measurements; F.L. wrote the paper, H.S. revised the paper, C.H. applied for the funding and managed the project. All authors have read and agreed to the published version of the manuscript.

Funding

The research was funded by the National Natural Science Foundation of China (62005287).

Institutional Review Board Statement

Not applicable.

Informed Consent Statement

Not applicable.

Data Availability Statement

Data are contained within the article.

Conflicts of Interest

The authors declare no conflict of interest.

References

  1. Yang, J.; Zhang, L.; Li, X. Several Primary Problems in the Development of Dynamic Metrology. Metrol. Meas. Technol. 2021, 41, 14. [Google Scholar]
  2. Gan, X.; Zhao, Z.; Ma, L. Calibration Status Analysis of Large Scale Measurement System Measurement Capability for Moving Target. Metrol. Meas. Technol. 2021, 38, 33–38. [Google Scholar]
  3. ASME B89.4.19; Performance Evaluation of Laser-Based Spherical Coordinate Measurement Systems. The American Society of Mechanical Engineers: New York, NY, USA, 2006.
  4. Wang, W.; Su, Y.; Ren, G.Y. A Study on Dynamic Character of Laser Tracker. Acta Metrol. Sin. 2007, 28, 36–38. [Google Scholar]
  5. State Administration for Market Regulation. JJF 1242-2010, Calibration Specification for Laser Tracker 3-Dimensional Measuring System; China Metrology Press: Beijing, China, 2010. [Google Scholar]
  6. Gan, X.-c.; Sun, A.-b.; Wang, J.-h.; Cao, T.-z.; Ma, L.-q. Calibration Method for Lateral Tracking Speed of Laser Tracker. Acta Metrol. Sin. 2014, 35, 39–44. [Google Scholar]
  7. Bi, S. Research on the Measurement Method of Target Motion Track Based on Laser Tracker; Shandong University of Science and Technology: Taian, China, 2020. [Google Scholar]
  8. Ma, Y.; Fan, B.; Huang, J. Research on the evaluation method of the accuracy of combined dynamic position and attitude measurement of multiple laser trackers. Eng. Surv. Map. 2021, 30, 55–59. [Google Scholar]
  9. Pan, T.; Fan, B.; Yi, W. Research on Evaluation Method of Laser Tracker Dynamic Accuracy. Bull. Surv. Map. 2016, 5, 54–56. [Google Scholar]
  10. Spiess, S.; Vincze, M. On the calibration of a 6-D laser tracking system for dynamic robot measurements. IEEE Trans. Instrum. Meas. 1998, 47, 270–274. [Google Scholar] [CrossRef]
  11. Brecher, C.; Ayromiou, M.; Guralnik, A.; Bäumler, S. Measurement of structure dynamics using a tracking-interferometer. Prod. Eng. 2012, 6, 89–96. [Google Scholar] [CrossRef]
  12. Slamani, M.; Nubiola, A.; Bonev, I. Assessment of the positioning performance of an industrial robot. Ind. Robot 2012, 39, 57–68. [Google Scholar] [CrossRef]
  13. Morse, E.; Welty, V. Dynamic testing of laser trackers. CIRP Ann. 2015, 64, 475–478. [Google Scholar] [CrossRef]
  14. Yang, J.; Wang, D.; Zhou, W. Precision laser tracking servo control system for moving target position measurement. Optik 2016, 131, 994–1002. [Google Scholar]
  15. Yao, L.; Sun, H.; Wang, X.; Zhou, Y. Detection of Track Static Regularities Based on a Laser Tracker. J. Surv. Eng. 2017, 143, 04016026. [Google Scholar] [CrossRef]
  16. Budzyn, G.; Rzepka, J.; Kaluza, P. Laser interferometer based instrument for 3D dynamic measurements of CNC machines geometry. Opt. Lasers Eng. 2021, 142, 106594. [Google Scholar] [CrossRef]
  17. Wang, T.; Xi, M.; Liu, H. Research on Evaluation and Experiment of Dynamic Measurement Uncertainty for On-machine Measurement. Modul. Mach. Tool Autom. Manuf. Tech. 2021, 1, 13–18. [Google Scholar]
  18. Lu, Y.; Zhu, W.; Huang, Y. Development of Dynamic Measuring Circuit of Circular Grating Angle Based on FPGA. Instrum. Tech. Sens. 2021, 3, 35–39. [Google Scholar]
  19. Huo, Z. Dynamic 3D Measurement Method of Rotating Object Based on Line Structured Light; Xi’an University of Technology: Xi’an, China, 2021. [Google Scholar]
  20. Yong, S. Research on Dynamic Measuring and Positioning Technology of Accurate Laser Positioning System (ALPS) in Large-scale Space; Xi’an University of Technology: Xi’an, China, 2021. [Google Scholar]
  21. Fu, Y.; Chen, B.; Yan, K.; Miao, H.; Yu, Q. Engineering-oriented laser interferometric dynamic measurement: A review. J. Exp. Mech. 2021, 36, 1–16. [Google Scholar]
Figure 1. (a) The CAD simulation diagram of dynamic measurement: 1—Main body of circular trajectory generator (high-precision spindle motor, motor holder, transmission system), 2—Rotating arm, 3—Microsphere holder, 4—Protective cover, 5—Rotational velocity control system, 6—Laser tracker. (b) The actual measurement diagram of dynamic measurement: 1—Main body of circular trajectory generator (high-precision spindle motor, motor holder, transmission system), 2—Rotating arm, 3—Microsphere holder, 4—Protective cover, 5—Rotational velocity control system, 6—Laser tracker. (c) The measurement with the distance of 2 m and (d) the measurement with the distance of 10 m.
Applsci 13 00167 g001
Figure 2. Flow chart of the measurement.
Applsci 13 00167 g002
Figure 3. Schematic diagram of the measurement.
Applsci 13 00167 g003
Figure 4. Projection position of sampling points with different measurement intervals—(D = 1 m).
Applsci 13 00167 g004
Figure 5. The measurement relationship between dynamic limit speed and distance.
Applsci 13 00167 g005
Figure 6. The relation between dynamic limit speed and actual measured interval.
Applsci 13 00167 g006
Figure 7. Measurement distance and dynamic display error diagram—(equally spaced).
Applsci 13 00167 g007
Figure 8. Measurement distance and dynamic display value variable relationship diagram—(equally spaced).
Applsci 13 00167 g008
Figure 9. Projection position of the sampling points with different measurement frequencies—(D = 1 m).
Applsci 13 00167 g009
Figure 10. Measurement distance and dynamic display error diagram—(equal sampling frequency).
Applsci 13 00167 g010
Figure 11. Measurement distance and dynamic display value variable relationship diagram—(equal sampling frequency).
Applsci 13 00167 g011
Figure 12. Relationship between speed and number of measurement points—(equally spaced).
Applsci 13 00167 g012
Figure 13. Relationship between speed and number of measurement points—(equal sampling frequency).
Applsci 13 00167 g013
Table 1. The dynamic performance of the laser tracker when measuring at different distances and equal spacing.
Measurement DistanceDynamic limit Rotational Velocity (m/s)Equal Spacing Measurement (5 mm)Equal Spacing Measurement (10 mm)Equal Spacing Measurement (20 mm)
Dynamic Indication Error (mm)Dynamic Indication Variable (mm)Actual Spacing (mm)Number of Measurement PointsDynamic Indication Error (mm)Dynamic Indication Variable (mm)Actual Spacing (mm)Number of Measurement PointsDynamic Indication Error (mm)Dynamic Indication Variable (mm)Actual Spacing (mm)Number of Measurement Points
1 m3.40−0.02530.004097.17440−0.02730.0046811.96265−0.01910.0057121.49147
2 m4.60−0.01460.004626.47489−0.01940.0053512.84244−0.01430.0076222.67140
3 m5.67−0.01170.012407.96396−0.00260.0061511.942640.00200.0099523.93133
5 m7.710.00640.0122410.832920.01560.0117610.832920.02510.0103721.56147
10 m10.58−0.06890.0227514.81213−0.11580.0230914.82212−0.08520.0203522.37142
Table 2. The dynamic performance of the laser tracker when measuring at different measurement distances and equal sampling frequency.
Measurement SpacingEqual Sampling Frequency (10 Hz)Equal Sampling Frequency (20 Hz)Equal Sampling Frequency (50 Hz)
Dynamic Indication Error (mm)Dynamic Indication Variable (mm)Number of Measurement PointsDynamic Indication Error (mm)Dynamic Indication Variable (mm)Number of Measurement PointsDynamic Indication Error (mm)Dynamic Indication Variable (mm)Number of Measurement Points
1 m−0.02440.0042814−0.02660.0044827−0.02140.0044066
2 m−0.01450.0043610−0.01760.0071920−0.01370.0047749
3 m−0.01100.007968−0.01070.0059616−0.00600.0065940
5 m−0.00340.002416−0.00560.00930120.00290.0096030
10 m−0.06900.022965−0.07530.025539−0.10310.0169422
Table 3. Dynamic performance of laser tracker at equal sampling frequency and different speeds (D = 3 m).
Rotational Velocity (r/s)Equal Sampling Frequency (10 Hz)Equal Sampling Frequency (20 Hz)Equal Sampling Frequency (50 Hz)
Dynamic Indication Error (mm)Number of Measurement PointsDynamic Indication Error (mm)Number of Measurement PointsDynamic Indication Error (mm)Number of Measurement Points
0.2−0.011848−0.009796−0.0109240
0.6−0.008517−0.007933−0.004783
1.0−0.004710−0.0117200.005850
1.4−0.00808−0.014815−0.001736
1.8−0.03356−0.012112−0.040328
Table 4. Dynamic performance of laser tracker at evenly spaced and different speeds (D = 3 m).
Rotational Velocity (r/s)Equal Spacing Measurement (5 mm)Equal Spacing Measurement (10 mm)Equal Spacing Measurement (5 mm)
Dynamic Indication Error (mm)Actual Spacing (mm)Number of Measurement PointsDynamic Indication Error (mm)Actual Spacing (mm)Number of Measurement PointsDynamic Indication Error (mm)Actual Spacing (mm)Number of Measurement Points
0.2−0.00815.21600−0.006710.47300−0.007620.27155
0.6−0.00665.75549−0.014211.51274−0.006421.05150
1.0−0.00336.35497−0.012112.61249−0.006522.12143
1.4−0.02608.87356−0.017913.28237−0.003722.12143
1.8−0.031011.33278−0.043611.39278−0.012622.66139
Disclaimer/Publisher’s Note: The statements, opinions and data contained in all publications are solely those of the individual author(s) and contributor(s) and not of MDPI and/or the editor(s). MDPI and/or the editor(s) disclaim responsibility for any injury to people or property resulting from any ideas, methods, instructions or products referred to in the content.

