

A Snapshot on the Occurrence and Risk Assessment of Organic Pollutants in an Urban River


Abstract
:1. Introduction
2. Materials and Methods
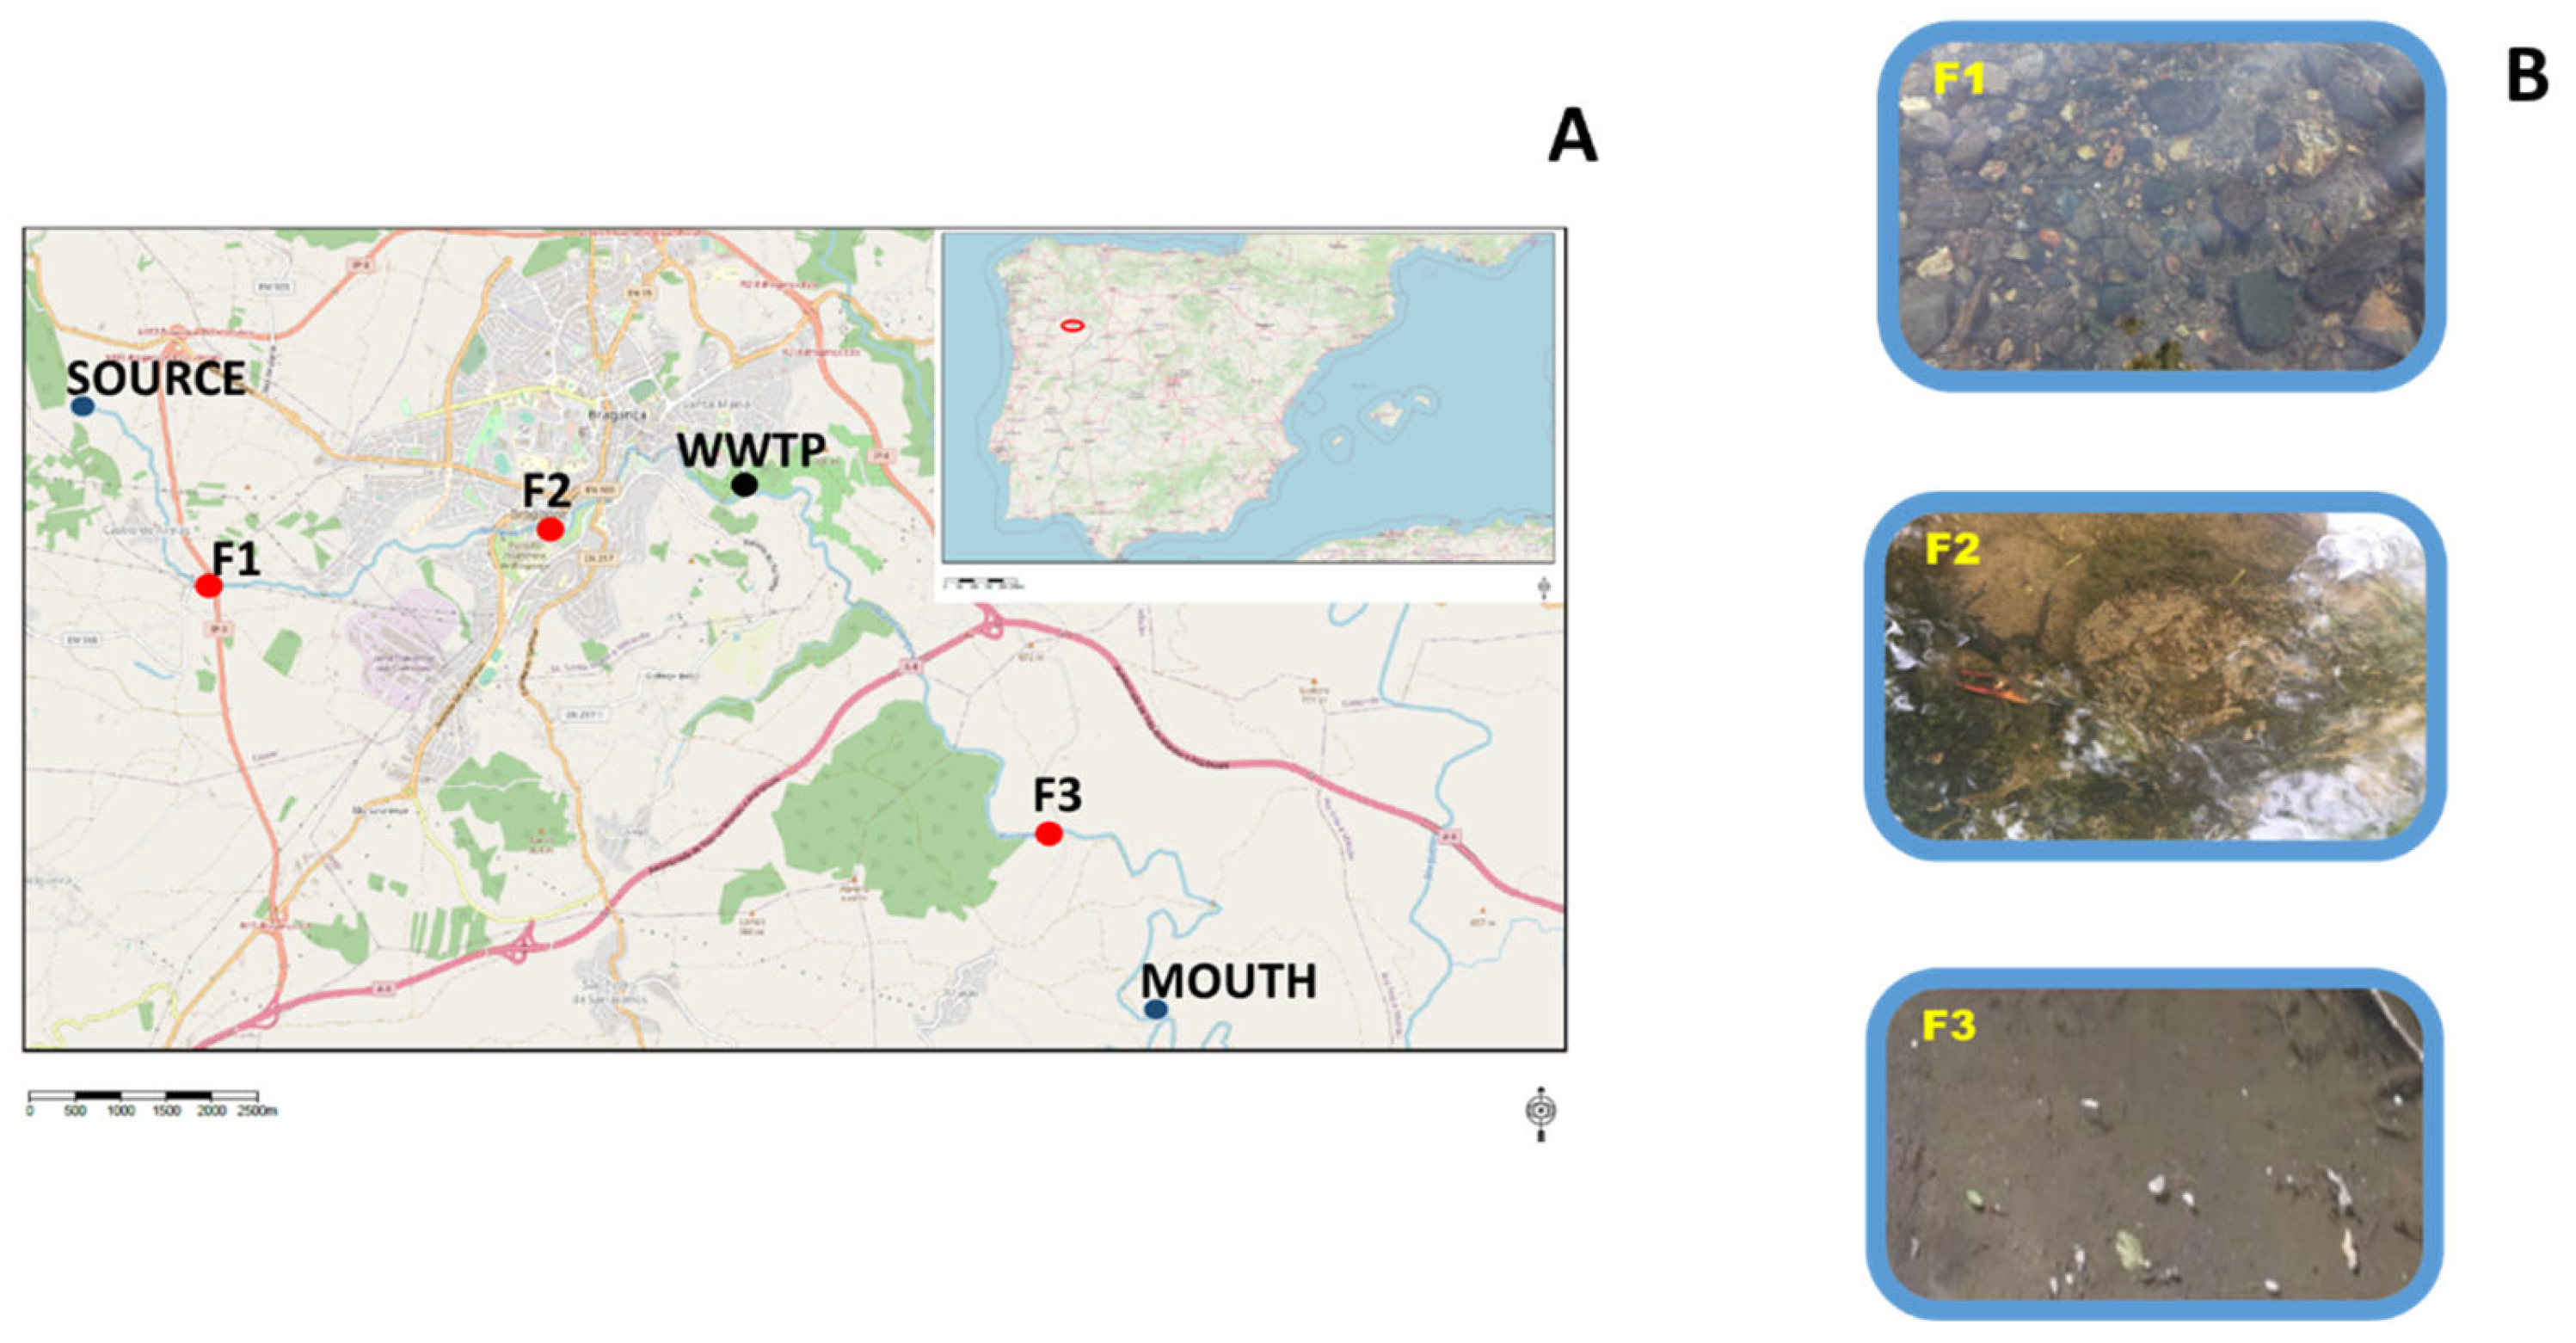
2.1. Study Site
2.2. Water and Sediment Samples and Contaminant Determination
2.3. Quality Assurance/Quality Control
2.4. Environmental Risk Assessment
3. Results and Discussion
3.1. Physicochemical Parameters
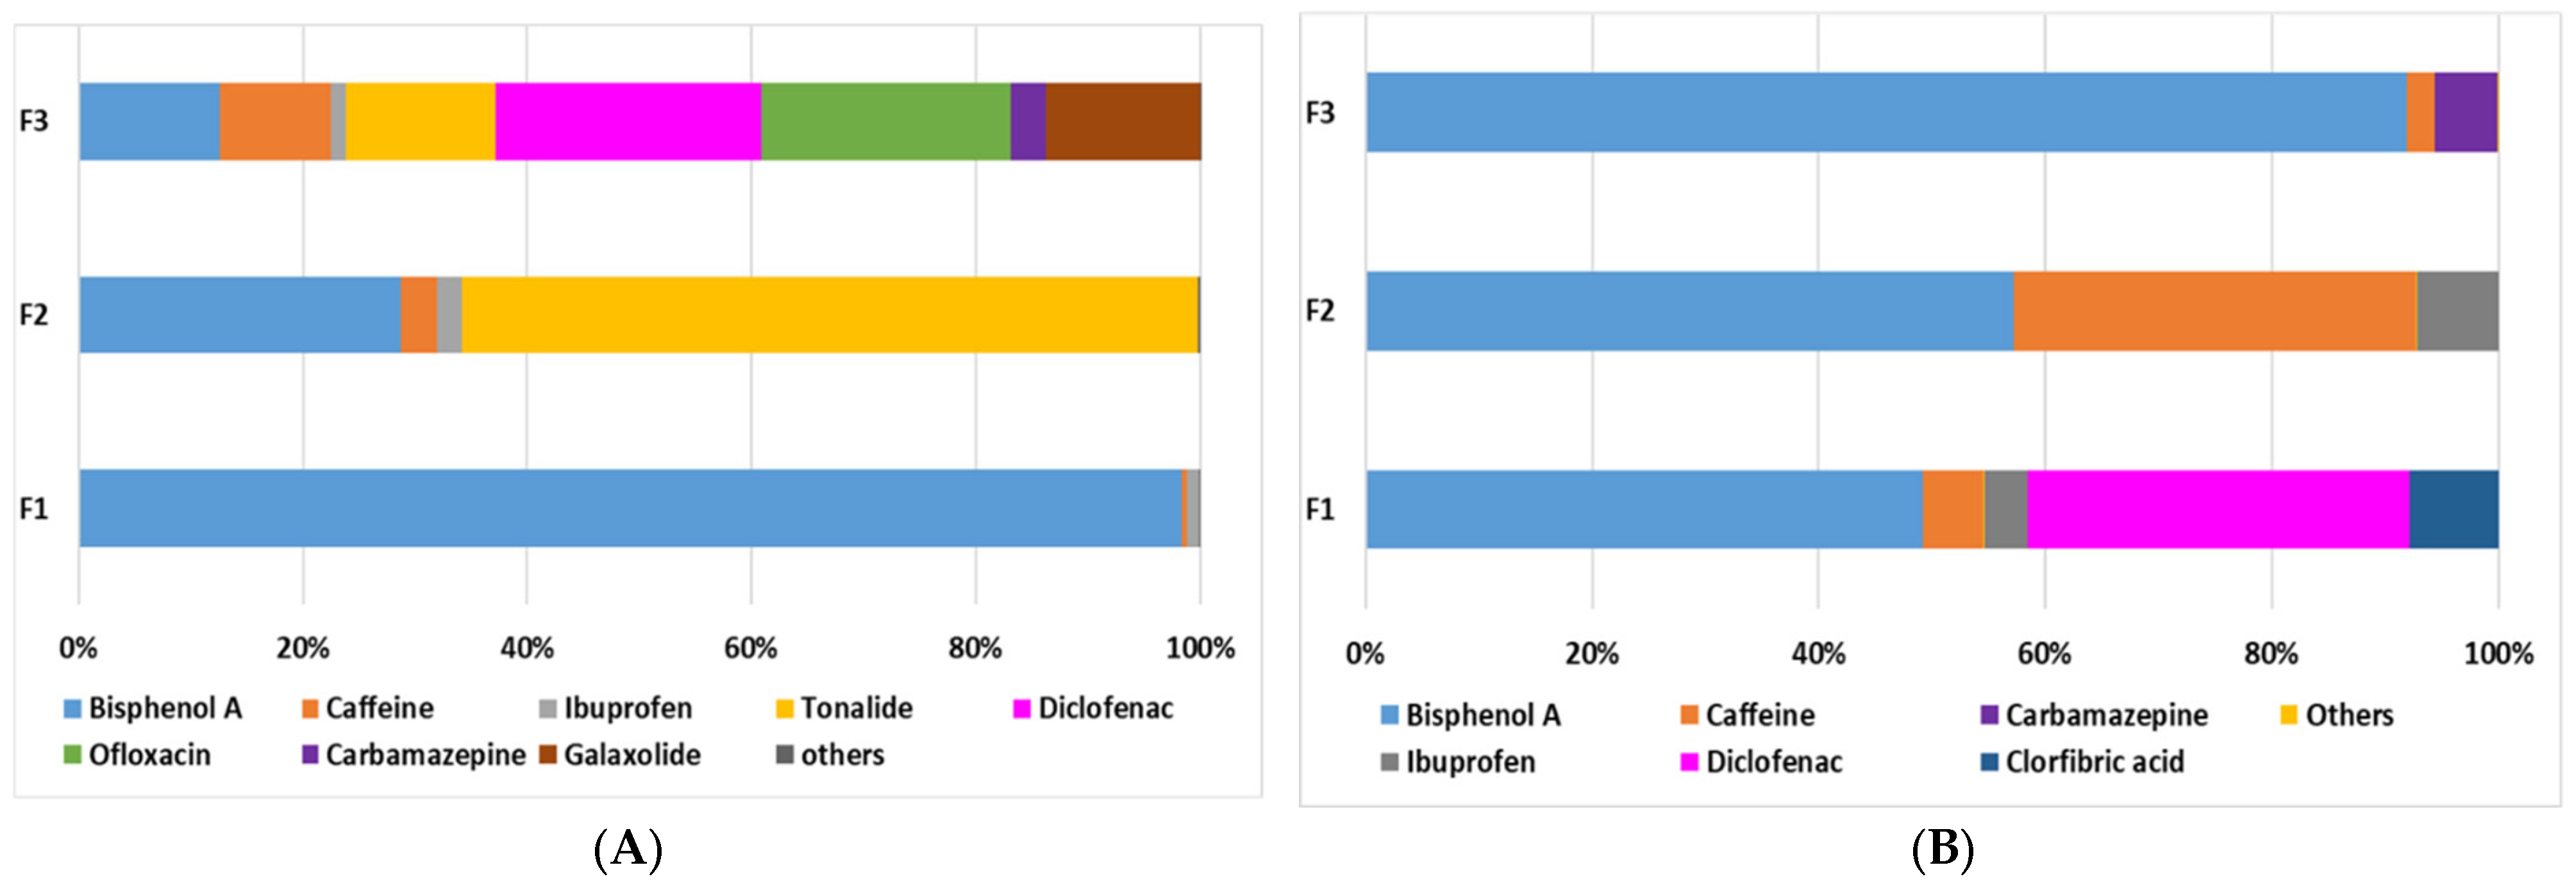
3.2. CECs Monitoring in Water
3.3. CECs Monitoring in Sediment Lixiviates
3.4. Comparative Analysis of CECs in Relation to Previously Available Data
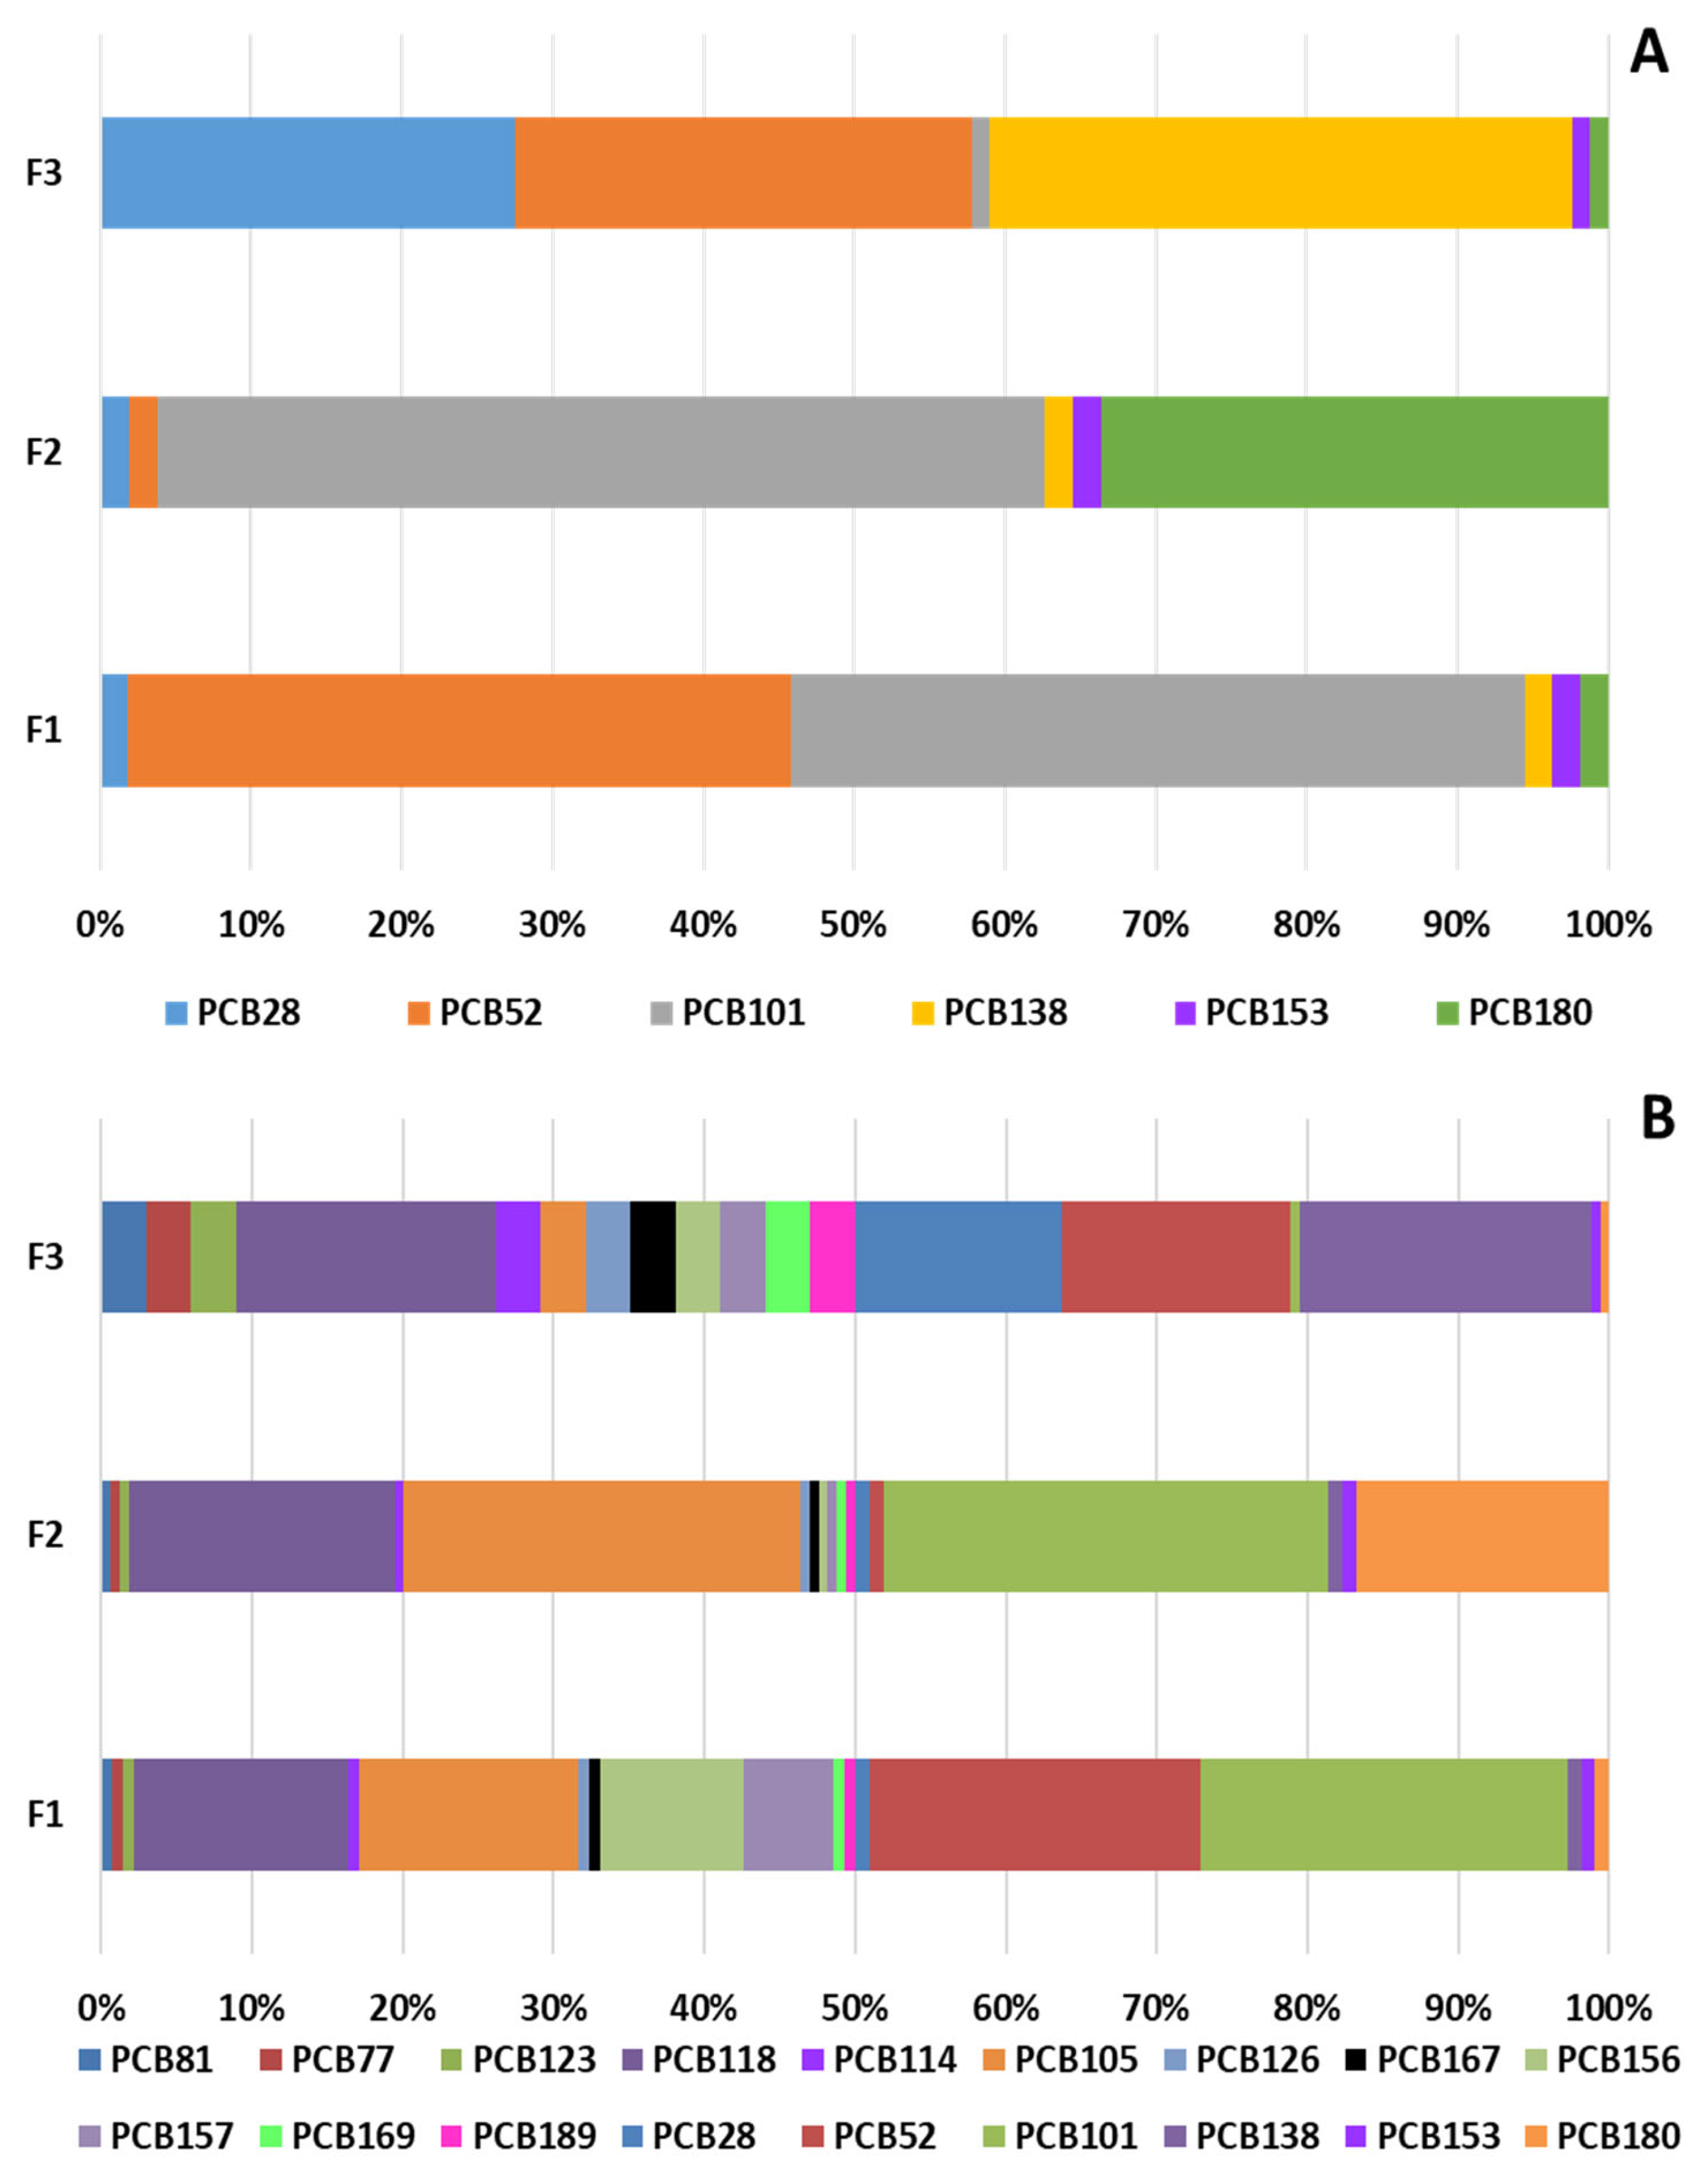
3.5. PAHs and PCBs Presence in Surface Sediments
3.6. Environmental Risk Assessment
4. Conclusions
Supplementary Materials
Author Contributions
Funding
Institutional Review Board Statement
Informed Consent Statement
Data Availability Statement
Acknowledgments
Conflicts of Interest
References
- MEA—Millennium Ecosystem Assessment. Ecosystems and Human Well-Being: Synthesis; Island Press: Washington, DC, USA, 2005. [Google Scholar]
- Sousa, J.C.G.; Ribeiro, A.R.; Barbosa, M.O.; Pereira, M.F.R.; Silva, A.M.T. A Review on Environmental Monitoring of Water Organic Pollutants Identified by EU Guidelines. J. Hazard. Mater. 2018, 344, 146–162. [Google Scholar] [CrossRef] [PubMed]
- Gogoi, A.; Mazumder, P.; Tyagi, V.K.; Tushara Chaminda, G.G.; An, A.K.; Kumar, M. Occurrence and Fate of Emerging Contaminants in Water Environment: A Review. Groundw. Sustain. Dev. 2018, 6, 169–180. [Google Scholar] [CrossRef]
- Peralta-Maraver, I.; Posselt, M.; Perkins, D.M.; Robertson, A.L. Mapping Micro-Pollutants and Their Impacts on the Size Structure of Streambed Communities. Water 2019, 11, 2610. [Google Scholar] [CrossRef] [Green Version]
- González-Alonso, S.; Merino, L.M.; Esteban, S.; López de Alda, M.; Barceló, D.; Durán, J.J.; López-Martínez, J.; Aceña, J.; Pérez, S.; Mastroianni, N.; et al. Occurrence of Pharmaceutical, Recreational and Psychotropic Drug Residues in Surface Water on the Northern Antarctic Peninsula Region. Environ. Pollut. 2017, 229, 241–254. [Google Scholar] [CrossRef]
- García-Solorio, L.; Muro, C.; De La Rosa, I.; Amador-Muñoz, O.; Ponce-Vélez, G. Organochlorine Pesticides and Polychlorinated Biphenyls in High Mountain Lakes, Mexico. Environ. Sci. Pollut. Res. 2022, 29, 49291–49308. [Google Scholar] [CrossRef]
- Komori, K.; Suzuki, Y.; Minamiyama, M.; Harada, A. Occurrence of Selected Pharmaceuticals in River Water in Japan and Assessment of Their Environmental Risk. Environ. Monit. Assess. 2013, 185, 4529–4536. [Google Scholar] [CrossRef]
- Selvaraj, K.K.; Shanmugam, G.; Sampath, S.; Joakim Larsson, D.G.; Ramaswamy, B.R. GC–MS Determination of Bisphenol A and Alkylphenol Ethoxylates in River Water from India and Their Ecotoxicological Risk Assessment. Ecotoxicol. Environ. Saf. 2014, 99, 13–20. [Google Scholar] [CrossRef]
- Rodríguez-Gil, J.L.; Cáceres, N.; Dafouz, R.; Valcárcel, Y. Caffeine and Paraxanthine in Aquatic Systems: Global Exposure Distributions and Probabilistic Risk Assessment. Sci. Total Environ. 2018, 612, 1058–1071. [Google Scholar] [CrossRef]
- Zarrelli, A.; DellaGreca, M.; Iesce, M.R.; Lavorgna, M.; Temussi, F.; Schiavone, L.; Criscuolo, E.; Parrella, A.; Previtera, L.; Isidori, M. Ecotoxicological Evaluation of Caffeine and Its Derivatives from a Simulated Chlorination Step. Sci. Total Environ. 2014, 470, 453–458. [Google Scholar] [CrossRef] [Green Version]
- Geissen, V.; Mol, H.; Klumpp, E.; Umlauf, G.; Nadal, M.; van der Ploeg, M.; van de Zee, S.E.A.T.M.; Ritsema, C.J. Emerging Pollutants in the Environment: A Challenge for Water Resource Management. Int. Soil Water Conserv. Res. 2015, 3, 57–65. [Google Scholar] [CrossRef]
- Fan, B.; Wang, X.; Li, J.; Gao, X.; Li, W.; Huang, Y.; Liu, Z. Deriving Aquatic Life Criteria for Galaxolide (HHCB) and Ecological Risk Assessment. Sci. Total Environ. 2019, 681, 488–496. [Google Scholar] [CrossRef] [PubMed]
- Mendoza, A.; Aceña, J.; Pérez, S.; López de Alda, M.; Barceló, D.; Gil, A.; Valcárcel, Y. Pharmaceuticals and Iodinated Contrast Media in a Hospital Wastewater: A Case Study to Analyse Their Presence and Characterise Their Environmental Risk and Hazard. Environ. Res. 2015, 140, 225–241. [Google Scholar] [CrossRef]
- Yan, Z.; Liu, Y.; Yan, K.; Wu, S.; Han, Z.; Guo, R.; Chen, M.; Yang, Q.; Zhang, S.; Chen, J. Bisphenol Analogues in Surface Water and Sediment from the Shallow Chinese Freshwater Lakes: Occurrence, Distribution, Source Apportionment, and Ecological and Human Health Risk. Chemosphere 2017, 184, 318–328. [Google Scholar] [CrossRef] [PubMed]
- Dafouz, R.; Cáceres, N.; Rodriguez-Gil, J.L.; Mastroianni, N.; Lopez de Alda, M.; Barcelo, D.; Gil-de-Miguel, A.; Valcarcel, Y. Does the Presence of Caffeine in the Marine Environment Represent an Environmental Risk? A Regional and Global Study. Sci. Total Environ. 2017, 615, 632–642. [Google Scholar] [CrossRef]
- Antić, I.; Škrbić, B.D.; Matamoros, V.; Bayona, J.M. Does the Application of Human Waste as a Fertilization Material in Agricultural Production Pose Adverse Effects on Human Health Attributable to Contaminants of Emerging Concern? Environ. Res. 2020, 182, 109132. [Google Scholar] [CrossRef] [PubMed]
- Škrbić, B.; Cvejanov, J.; Durišić-Mladenović, N. Polycyclic Aromatic Hydrocarbons in Surface Soils of Novi Sad and Bank Sediment of the Danube River. J. Environ. Sci. Health Part A 2005, 40, 29–42. [Google Scholar] [CrossRef]
- Škrbić, B.D.; Kadokami, K.; Antić, I. Survey on the Micro-Pollutants Presence in Surface Water System of Northern Serbia and Environmental and Health Risk Assessment. Environ. Res. 2018, 166, 130–140. [Google Scholar] [CrossRef]
- Jesus, F.; Pereira, J.L.; Campos, I.; Santos, M.; Ré, A.; Keizer, J.; Nogueira, A.; Gonçalves, F.J.M.; Abrantes, N.; Serpa, D. A Review on Polycyclic Aromatic Hydrocarbons Distribution in Freshwater Ecosystems and Their Toxicity to Benthic Fauna. Sci. Total Environ. 2022, 820, 153282. [Google Scholar] [CrossRef]
- Soclo, H.H.; Garrigues, P.; Ewald, M. Origin of Polycyclic Aromatic Hydrocarbons (PAHs) in Coastal Marine Sediments: Case Studies in Cotonou (Benin) and Aquitaine (France) Areas. Mar. Pollut. Bull. 2000, 40, 387–396. [Google Scholar] [CrossRef]
- Guo, G.; Wu, F.; He, H.; Zhang, R.; Feng, C.; Li, H.; Chang, M. Characterizing Ecological Risk for Polycyclic Aromatic Hydrocarbons in Water from Lake Taihu, China. Environ. Monit. Assess. 2012, 184, 6815–6825. [Google Scholar] [CrossRef]
- Raeisi, A.; Arfaeinia, H.; Seifi, M.; Shirzad-Siboni, M.; Keshtkar, M.; Dobaradaran, S. Polycyclic Aromatic Hydrocarbons (PAHs) in Coastal Sediments from Urban and Industrial Areas of Asaluyeh Harbor, Iran: Distribution, Potential Source and Ecological Risk Assessment. Water Sci. Technol. J. Int. Assoc. Water Pollut. Res. 2016, 74, 957–973. [Google Scholar] [CrossRef] [PubMed]
- Wang, Y.; Wang, J.; Mu, J.; Wang, Z.; Cong, Y.; Yao, Z.; Lin, Z. Aquatic Predicted No-Effect Concentrations of 16 Polycyclic Aromatic Hydrocarbons and Their Ecological Risks in Surface Seawater of Liaodong Bay, China. Environ. Toxicol. Chem. 2016, 35, 1587–1593. [Google Scholar] [CrossRef] [PubMed]
- Mitra, S.; Corsolini, S.; Pozo, K.; Audy, O.; Sarkar, S.K.; Biswas, J.K. Characterization, Source Identification and Risk Associated with Polyaromatic and Chlorinated Organic Contaminants (PAHs, PCBs, PCBzs and OCPs) in the Surface Sediments of Hooghly Estuary, India. Chemosphere 2019, 221, 154–165. [Google Scholar] [CrossRef] [PubMed]
- Škrbić, B.; Cvejanov, J.; Durišić-Mladenović, N. Organochlorine Pesticides and Polychlorinated Biphenyls in Surface Soils of Novi Sad and Bank Sediment of the Danube River. J. Environ. Sci. Health Part B 2007, 42, 311–319. [Google Scholar] [CrossRef] [PubMed]
- Giesy, J.P.; Kannan, K. Dioxin-Like and Non-Dioxin-Like Toxic Effects of Polychlorinated Biphenyls (PCBs): Implications For Risk Assessment. Crit. Rev. Toxicol. 1998, 28, 511–569. [Google Scholar] [CrossRef]
- Zhao, L.; Hou, H.; Zhou, Y.; Xue, N.; Li, H.; Li, F. Distribution and Ecological Risk of Polychlorinated Biphenyls and Organochlorine Pesticides in Surficial Sediments from Haihe River and Haihe Estuary Area, China. Chemosphere 2010, 78, 1285–1293. [Google Scholar] [CrossRef]
- Zhang, Y.; Wang, C.; Du, L. Distribution, Source and Potential Risk Assessment of Polychlorinated Biphenyls (PCBs) in Sediments from the Liaohe River Protected Area, China. Sustainability 2021, 13, 10750. [Google Scholar] [CrossRef]
- Baqar, M.; Sadef, Y.; Ahmad, S.R.; Mahmood, A.; Qadir, A.; Aslam, I.; Li, J.; Zhang, G. Occurrence, Ecological Risk Assessment, and Spatio-Temporal Variation of Polychlorinated Biphenyls (PCBs) in Water and Sediments along River Ravi and Its Northern Tributaries, Pakistan. Environ. Sci. Pollut. Res. Int. 2017, 24, 27913–27930. [Google Scholar] [CrossRef]
- Škrbić, B.D.; Kadokami, K.; Antić, I.; Jovanović, G. Micro-Pollutants in Sediment Samples in the Middle Danube Region, Serbia: Occurrence and Risk Assessment. Environ. Sci. Pollut. Res. 2018, 25, 260–273. [Google Scholar] [CrossRef]
- Habibullah-Al-Mamun, M.; Ahmed, M.K.; Islam, M.S.; Tokumura, M.; Masunaga, S. Seasonal-Spatial Distributions, Congener Profile, and Risk Assessment of Polychlorinated Biphenyls (PCBS) in the Surficial Sediments from the Coastal Area of Bangladesh. Soil Sediment Contam. Int. J. 2019, 28, 28–50. [Google Scholar] [CrossRef]
- Ranjbar Jafarabadi, A.; Riyahi Bakhtiari, A.; Mitra, S.; Maisano, M.; Cappello, T.; Jadot, C. First Polychlorinated Biphenyls (PCBs) Monitoring in Seawater, Surface Sediments and Marine Fish Communities of the Persian Gulf: Distribution, Levels, Congener Profile and Health Risk Assessment. Environ. Pollut. 2019, 253, 78–88. [Google Scholar] [CrossRef] [PubMed]
- NORMAN Ecotoxicology Database. Available online: https://www.norman-network.com/nds/ecotox/ (accessed on 19 March 2022).
- Amoatey, P.; Baawain, M.S. Effects of Pollution on Freshwater Aquatic Organisms. Water Environ. Res. 2019, 91, 1272–1287. [Google Scholar] [CrossRef] [PubMed] [Green Version]
- Feio, M.J.; Hughes, R.M.; Callisto, M.; Nichols, S.J.; Odume, O.N.; Quintella, B.R.; Kuemmerlen, M.; Aguiar, F.C.; Almeida, S.F.P.; Alonso-EguíaLis, P.; et al. The Biological Assessment and Rehabilitation of the World’s Rivers: An Overview. Water 2021, 13, 371. [Google Scholar] [CrossRef] [PubMed]
- Barbosa, M.O.; Ribeiro, A.R.; Ratola, N.; Hain, E.; Homem, V.; Pereira, M.F.R.; Blaney, L.; Silva, A.M.T. Spatial and Seasonal Occurrence of Micropollutants in Four Portuguese Rivers and a Case Study for Fluorescence Excitation-Emission Matrices. Sci. Total Environ. 2018, 644, 1128–1140. [Google Scholar] [CrossRef] [PubMed]
- Paíga, P.; Santos, L.H.M.L.M.; Amorim, C.G.; Araújo, A.N.; Montenegro, M.C.B.S.M.; Pena, A.; Delerue-Matos, C. Pilot Monitoring Study of Ibuprofen in Surface Waters of North of Portugal. Environ. Sci. Pollut. Res. 2013, 20, 2410–2420. [Google Scholar] [CrossRef] [PubMed] [Green Version]
- Paíga, P.; Santos, L.H.M.L.M.; Ramos, S.; Jorge, S.; Silva, J.G.; Delerue-Matos, C. Presence of Pharmaceuticals in the Lis River (Portugal): Sources, Fate and Seasonal Variation. Sci. Total Environ. 2016, 573, 164–177. [Google Scholar] [CrossRef] [PubMed]
- Pereira, A.M.P.T.; Silva, L.J.G.; Meisel, L.M.; Lino, C.M.; Pena, A. Environmental Impact of Pharmaceuticals from Portuguese Wastewaters: Geographical and Seasonal Occurrence, Removal and Risk Assessment. Environ. Res. 2015, 136, 108–119. [Google Scholar] [CrossRef] [Green Version]
- Pereira, A.M.P.T.; Silva, L.J.G.; Lino, C.M.; Meisel, L.M.; Pena, A. Assessing Environmental Risk of Pharmaceuticals in Portugal: An Approach for the Selection of the Portuguese Monitoring Stations in Line with Directive 2013/39/EU. Chemosphere 2016, 144, 2507–2515. [Google Scholar] [CrossRef]
- Pereira, A.M.P.T.; Silva, L.J.G.; Laranjeiro, C.S.M.; Meisel, L.M.; Lino, C.M.; Pena, A. Human Pharmaceuticals in Portuguese Rivers: The Impact of Water Scarcity in the Environmental Risk. Sci. Total Environ. 2017, 609, 1182–1191. [Google Scholar] [CrossRef]
- Paíga, P.; Correia, M.; Fernandes, M.J.; Silva, A.; Carvalho, M.; Vieira, J.; Jorge, S.; Silva, J.G.; Freire, C.; Delerue-Matos, C. Assessment of 83 Pharmaceuticals in WWTP Influent and Effluent Samples by UHPLC-MS/MS: Hourly Variation. Sci. Total Environ. 2019, 648, 582–600. [Google Scholar] [CrossRef]
- Paíga, P.; Ramos, S.; Jorge, S.; Silva, J.G.; Delerue-Matos, C. Monitoring Survey of Caffeine in Surface Waters (Lis River) and Wastewaters Located at Leiria Town in Portugal. Environ. Sci. Pollut. Res. Int. 2019, 26, 33440–33450. [Google Scholar] [CrossRef] [PubMed]
- Rocha, M.; Cruzeiro, C.; Rocha, E. Quantification of 17 Endocrine Disruptor Compounds and Their Spatial and Seasonal Distribution in the Iberian Ave River and Its Coastline. Toxicol. Environ. Chem. 2013, 95, 386–399. [Google Scholar] [CrossRef]
- Homem, V.; Llompart, M.; Vila, M.; Ribeiro, A.R.L.; Garcia-Jares, C.; Ratola, N.; Celeiro, M. Gone with the Flow—Assessment of Personal Care Products in Portuguese Rivers. Chemosphere 2022, 293, 133552. [Google Scholar] [CrossRef]
- Fernandes, M.J.; Paíga, P.; Silva, A.; Llaguno, C.P.; Carvalho, M.; Vázquez, F.M.; Delerue-Matos, C. Antibiotics and Antidepressants Occurrence in Surface Waters and Sediments Collected in the North of Portugal. Chemosphere 2020, 239, 124729. [Google Scholar] [CrossRef] [PubMed]
- Ribeiro, C.; Ribeiro, A.R.; Tiritan, M.E. Occurrence of Persistent Organic Pollutants in Sediments and Biota from Portugal versus European Incidence: A Critical Overview. J. Environ. Sci. Health B 2016, 51, 143–153. [Google Scholar] [CrossRef] [PubMed]
- Nunes, M.; Marchand, P.; Vernisseau, A.; Bizec, B.L.; Ramos, F.; Pardal, M.A. PCDD/Fs and Dioxin-like PCBs in Sediment and Biota from the Mondego Estuary (Portugal). Chemosphere 2011, 83, 1345–1352. [Google Scholar] [CrossRef] [PubMed]
- Nunes, M.; Vernisseau, A.; Marchand, P.; Le Bizec, B.; Ramos, F.; Pardal, M.A. Occurrence of PCDD/Fs and Dioxin-like PCBs in Superficial Sediment of Portuguese Estuaries. Environ. Sci. Pollut. Res. Int. 2014, 21, 9396–9407. [Google Scholar] [CrossRef]
- Gonçalves, C.; Teixeira, C.; Basto, M.C.P.; Almeida, C.M.R. PAHs Levels in Portuguese Estuaries and Lagoons: Salt Marsh Plants as Potential Agents for the Containment of PAHs Contamination in Sediments. Reg. Stud. Mar. Sci. 2016, 7, 211–221. [Google Scholar] [CrossRef]
- Dias-Ferreira, C.; Pato, R.L.; Varejão, J.B.; Tavares, A.O.; Ferreira, A.J.D. Heavy Metal and PCB Spatial Distribution Pattern in Sediments within an Urban Catchment—Contribution of Historical Pollution Sources. J. Soils Sediments 2016, 16, 2594–2605. [Google Scholar] [CrossRef]
- Censos. 2021. Available online: https://censos.ine.pt/xportal/xmain?xpgid=censos21_dados&xpid=CENSOS21&xlang=pt (accessed on 19 March 2022).
- Geraldes, A.M.; Boavida, M.J. Distinct Age and Landscape Influence on Two Reservoirs under the Same Climate. Hydrobiologia 2003, 504, 277–288. [Google Scholar] [CrossRef]
- Munns, W.R.; Berry, W.J.; Dewitt, T.H. Toxicity Testing, Risk Assessment, and Options for Dredged Material Management. Mar. Pollut. Bull. 2002, 44, 294–302. [Google Scholar] [CrossRef] [PubMed]
- ECHA—European Chemicals Agency. Guidance on Information Requirements and Chemical Safety Assessment, Chapter R.16: Environmental Exposure Assessment. ECHA-16-G-03-EN. 2016. Available online: https://Echa.Europa.Eu/Documents/10162/13632/Information_requirements_r16_en.Pdf/B9f0f406-Ff5f-4315-908e-E5f83115d6af (accessed on 19 March 2022).
- ECHA—European Chemicals Agency. Guidance on Information Requirements and Chemical Safety Assessment, Chapter R.7b: Endpoint Specific Guidance. ECHA-17-G-10-EN. 2017. Available online: https://Echa.Europa.Eu/Documents/10162/13632/Information_requirements_r7b_en.Pdf/1a551efc-Bd6a-4d1f-B719-16e0d3a01919-+ (accessed on 19 March 2022).
- Van Leeuwen, K.V.L. Technical Guidance Document on Risk Assessment in Support of Commission Directive 93/67/EEC on Risk Assessment for New Notified Substances and Commission Regulation (EC) No1488/94 on Risk Assessment for Existing Substances Part II; European Chemicals Bureau: Helsinki, Finland, 1996; pp. 1–337. [Google Scholar]
- Commission Directive 2009/90/EC of the European Parliament and the Council, Technical Specifications for Chemical Analysis and Monitoring of Water Status. Off. J. Eur. Union 201 OJL 2009, 36–38.
- EMEA. Guideline on the Environmental Risk Assessment of Medicinal Products for Human Use; EMEA/CHMP/SWP/4447/00; The European Agency for the Evaluation of Medicinal Products, Committee for Medical Products for Human Use: Amsterdam, The Netherlands, 2006. [Google Scholar]
- Köck-Schulmeyer, M.; Ginebreda, A.; Petrovic, M.; Giulivo, M.; Aznar-Alemany, Ò.; Eljarrat, E.; Valle-Sistac, J.; Molins-Delgado, D.; Diaz-Cruz, M.S.; Monllor-Alcaraz, L.S.; et al. Priority and Emerging Organic Microcontaminants in Three Mediterranean River Basins: Occurrence, Spatial Distribution, and Identification of River Basin Specific Pollutants. Sci. Total Environ. 2021, 754, 142344. [Google Scholar] [CrossRef] [PubMed]
- ECETOC. Soil and Sediment Risk Assessment of Organic Chemicals Technical Report No. 92. Brussels. 2004. Available online: https://www.ecetoc.org/wp-content/uploads/2014/08/ECETOC-TR-092.pdf (accessed on 19 March 2022).
- Baumard, P.; Budzinski, H.; Garrigues, P. Polycyclic Aromatic Hydrocarbons in Sediments and Mussels of the Western Mediterranean Sea. Environ. Toxicol. Chem. 1998, 17, 765–776. [Google Scholar] [CrossRef]
- Tobiszewski, M.; Namieśnik, J. PAH Diagnostic Ratios for the Identification of Pollution Emission Sources. Environ. Pollut. 2012, 162, 110–119. [Google Scholar] [CrossRef]
- Kanzari, F.; Syakti, A.D.; Asia, L.; Malleret, L.; Piram, A.; Mille, G.; Doumenq, P. Distributions and Sources of Persistent Organic Pollutants (Aliphatic Hydrocarbons, PAHs, PCBs and Pesticides) in Surface Sediments of an Industrialized Urban River (Huveaune), France. Sci. Total Environ. 2014, 478, 141–151. [Google Scholar] [CrossRef]
- Kanzari, F.; Asia, L.; Syakti, A.D.; Piram, A.; Malleret, L.; Mille, G.; Doumenq, P. Distribution and Risk Assessment of Hydrocarbons (Aliphatic and PAHs), Polychlorinated Biphenyls (PCBs), and Pesticides in Surface Sediments from an Agricultural River (Durance) and an Industrialized Urban Lagoon (Berre Lagoon), France. Environ. Monit. Assess. 2015, 187, 591. [Google Scholar] [CrossRef]
- Škrbić, B.; Marinković, V.; Spaić, S.; Milanko, V.; Branovački, S. Profiles of Polycyclic Aromatic Hydrocarbons in Smoke from Combustion and Thermal Decomposition of Poplar Wood Pellets and Sawdust. Microchem. J. 2018, 139, 9–17. [Google Scholar] [CrossRef]
- Barreca, S.; Bastone, S.; Caponetti, E.; Martino, D.F.C.; Orecchio, S. Determination of Selected Polyaromatic Hydrocarbons by Gas Chromatography–Mass Spectrometry for the Analysis of Wood to Establish the Cause of Sinking of an Old Vessel (Scauri Wreck) by Fire. Microchem. J. 2014, 117, 116–121. [Google Scholar] [CrossRef]
- INERIS. Implementation of Requirements on Priority Substances within the Context of the Water Framework Directive. Prioritisation Process: Monitoring-Based Ranking. Annex Xv: Pnec Values and Hazard Information for Highly Ranked Substances. 2009. Available online: https://Circabc.Europa.eu (accessed on 19 March 2022).
- Baars, A.J.; Bakker, M.I.; Baumann, R.A.; Boon, P.E.; Freijer, J.I.; Hoogenboom, L.A.P.; Hoogerbrugge, R.; van Klaveren, J.D.; Liem, A.K.D.; Traag, W.A.; et al. Dioxins, Dioxin-like PCBs and Non-Dioxin-like PCBs in Foodstuffs: Occurrence and Dietary Intake in The Netherlands. Toxicol. Lett. 2004, 151, 51–61. [Google Scholar] [CrossRef] [PubMed]
- Lai, Z.; Li, X.; Li, H.; Zhao, L.; Zeng, Y.; Wang, C.; Gao, Y.; Liu, Q. Residual Distribution and Risk Assessment of Polychlorinated Biphenyls in Surface Sediments of the Pearl River Delta, South China. Bull. Environ. Contam. Toxicol. 2015, 95, 37–44. [Google Scholar] [CrossRef] [PubMed]
- Van den Berg, M.; Birnbaum, L.S.; Denison, M.; De Vito, M.; Farland, W.; Feeley, M.; Fiedler, H.; Hakansson, H.; Hanberg, A.; Haws, L.; et al. The 2005 World Health Organization Re-Evaluation of Human and Mammalian Toxic Equivalency Factors for Dioxins and Dioxin-like Compounds. Toxicol. Sci. Off. J. Soc. Toxicol. 2006, 93, 223–241. [Google Scholar] [CrossRef] [PubMed] [Green Version]
- Canadian Council of Ministers of the Environment|Le Conseil Canadien Des Ministres de L’environment. Available online: https://ccme.ca/en/current-activities/canadian-environmental-quality-guidelines (accessed on 19 March 2022).
- Crispim, M.C.; Antão-Geraldes, A.M.; de Oliveira, F.F.; Marinho, R.; Morais, M.M. Potencialidades da implementação de biorremediação na reabilitação de rios: Dados iniciais e considerações. Saindo Zona Conforto Interdiscip. Zonas Costeiras 2019, 8, 278–295. [Google Scholar]
- Salgado, R.; Noronha, J.; Oehmen, A.; Carvalho, G.; Reis, M. Analysis of 65 Pharmaceuticals and Personal Care Products in 5 Wastewater Treatment Plants in Portugal Using a Simplified Analytical Methodology. Water Sci. Technol. J. Int. Assoc. Water Pollut. Res. 2010, 62, 2862–2871. [Google Scholar] [CrossRef]
- Bouissou-Schurtz, C.; Houeto, P.; Guerbet, M.; Bachelot, M.; Casellas, C.; Mauclaire, A.-C.; Panetier, P.; Delval, C.; Masset, D. Ecological Risk Assessment of the Presence of Pharmaceutical Residues in a French National Water Survey. Regul. Toxicol. Pharmacol. 2014, 69, 296–303. [Google Scholar] [CrossRef]
- Pedrazzani, R.; Bertanza, G.; Brnardić, I.; Cetecioglu, Z.; Dries, J.; Dvarionienė, J.; García-Fernández, A.J.; Langenhoff, A.; Libralato, G.; Lofrano, G.; et al. Opinion Paper about Organic Trace Pollutants in Wastewater: Toxicity Assessment in a European Perspective. Sci. Total Environ. 2019, 651, 3202–3221. [Google Scholar] [CrossRef]
- Čelić, M.; Škrbić, B.D.; Insa, S.; Živančev, J.; Gros, M.; Petrović, M. Occurrence and Assessment of Environmental Risks of Endocrine Disrupting Compounds in Drinking, Surface and Wastewaters in Serbia. Environ. Pollut. 2020, 262, 114344. [Google Scholar] [CrossRef]
- Kondor, A.C.; Molnár, É.; Jakab, G.; Vancsik, A.; Filep, T.; Szeberényi, J.; Szabó, L.; Maász, G.; Pirger, Z.; Weiperth, A.; et al. Pharmaceuticals in Water and Sediment of Small Streams under the Pressure of Urbanization: Concentrations, Interactions, and Risks. Sci. Total Environ. 2022, 808, 152160. [Google Scholar] [CrossRef]
- Fairbairn, D.J.; Karpuzcu, M.E.; Arnold, W.A.; Barber, B.L.; Kaufenberg, E.F.; Koskinen, W.C.; Novak, P.J.; Rice, P.J.; Swackhamer, D.L. Sediment–Water Distribution of Contaminants of Emerging Concern in a Mixed Use Watershed. Sci. Total Environ. 2015, 505, 896–904. [Google Scholar] [CrossRef]
- Scheytt, T.; Mersmann, P.; Lindstädt, R.; Heberer, T. Determination of Sorption Coefficients of Pharmaceutically Active Substances Carbamazepine, Diclofenac, and Ibuprofen, in Sandy Sediments. Chemosphere 2005, 60, 245–253. [Google Scholar] [CrossRef] [PubMed]
- Krascsenits, Z.; Hiller, E.; Bartaľ, M. Distribution of Four Human Pharmaceuticals, Carbamazepine, Diclofenac, Gemfibrozil, and Ibuprofen Between Sediment and Water. J. Hydrol. Hydromech. 2008, 56, 237–246. [Google Scholar]
- Peteffi, G.P.; Fleck, J.D.; Kael, I.M.; Rosa, D.C.; Antunes, M.V.; Linden, R. Ecotoxicological Risk Assessment Due to the Presence of Bisphenol A and Caffeine in Surface Waters in the Sinos River Basin—Rio Grande Do Sul—Brazil. Braz. J. Biol. 2018, 79, 712. [Google Scholar] [CrossRef] [PubMed]
- López-Doval, J.C.; Montagner, C.C.; de Alburquerque, A.F.; Moschini-Carlos, V.; Umbuzeiro, G.; Pompêo, M. Nutrients, Emerging Pollutants and Pesticides in a Tropical Urban Reservoir: Spatial Distributions and Risk Assessment. Sci. Total Environ. 2017, 575, 1307–1324. [Google Scholar] [CrossRef] [PubMed]
- Anđelić, I.; Roje-Busatto, R.; Ujević, I.; Vuletić, N.; Matijević, S. Distribution of Bisphenol A in Sediment and Suspended Matter and Its Possible Impact on Marine Life in Kaštela Bay, Adriatic Sea, Croatia. J. Mar. Sci. Eng. 2020, 8, 480. [Google Scholar] [CrossRef]
- Shi, J.; Liu, X.; Chen, Q.; Zhang, H. Spatial and Seasonal Distributions of Estrogens and Bisphenol A in the Yangtze River Estuary and the Adjacent East China Sea. Chemosphere 2014, 111, 336–343. [Google Scholar] [CrossRef]
- Korekar, G.; Kumar, A.; Ugale, C. Occurrence, Fate, Persistence and Remediation of Caffeine: A Review. Environ. Sci. Pollut. Res. 2020, 27, 34715–34733. [Google Scholar] [CrossRef]
- Yang, Y.-Y.; Toor, G.S.; Williams, C.F. Pharmaceuticals and Organochlorine Pesticides in Sediments of an Urban River in Florida, USA. J. Soils Sediments 2015, 15, 993–1004. [Google Scholar] [CrossRef]
- Milan, D.J. Sediment Routing Hypothesis for Pool-Riffle Maintenance. Earth Surf. Process. Landf. 2013, 38, 1623–1641. [Google Scholar] [CrossRef]
- Fuentes-Aguilera, P.; Caamaño, D.; Alcayaga, H.; Tranmer, A. The Influence of Pool-Riffle Morphological Features on River Mixing. Water 2020, 12, 1145. [Google Scholar] [CrossRef]
- Ghermandi, A.; Vandenberghe, V.; Benedetti, L.; Bauwens, W.; Vanrolleghem, P.A. Model-Based Assessment of Shading Effect by Riparian Vegetation on River Water Quality. Ecol. Eng. 2009, 35, 92–104. [Google Scholar] [CrossRef]
- Carena, L.; Vione, D. Mapping the Photochemistry of European Mid-Latitudes Rivers: An Assessment of Their Ability to Photodegrade Contaminants. Molecules 2020, 25, 424. [Google Scholar] [CrossRef] [Green Version]
- Srivastava, J.K.; Chandra, H.; Kalra, S.J.S.; Mishra, P.; Khan, H.; Yadav, P. Plant–Microbe Interaction in Aquatic System and Their Role in the Management of Water Quality: A Review. Appl. Water Sci. 2017, 7, 1079–1090. [Google Scholar] [CrossRef] [Green Version]
- Peralta-Maraver, I.; Reiss, J.; Robertson, A.L. Interplay of Hydrology, Community Ecology and Pollutant Attenuation in the Hyporheic Zone. Sci. Total Environ. 2018, 610, 267–275. [Google Scholar] [CrossRef]
- Coll, C.; Bier, R.; Li, Z.; Langenheder, S.; Gorokhova, E.; Sobek, A. Association between Aquatic Micropollutant Dissipation and River Sediment Bacterial Communities. Environ. Sci. Technol. 2020, 54, 14380–14392. [Google Scholar] [CrossRef] [PubMed]
- Petrović, M.; Škrbić, B.; Živančev, J.; Ferrando-Climent, L.; Barcelo, D. Determination of 81 Pharmaceutical Drugs by High Performance Liquid Chromatography Coupled to Mass Spectrometry with Hybrid Triple Quadrupole–Linear Ion Trap in Different Types of Water in Serbia. Sci. Total Environ. 2014, 468, 415–428. [Google Scholar] [CrossRef]
- Brillas, E. A Critical Review on Ibuprofen Removal from Synthetic Waters, Natural Waters, and Real Wastewaters by Advanced Oxidation Processes. Chemosphere 2022, 286, 131849. [Google Scholar] [CrossRef]
- Batucan, N.S.P.; Tremblay, L.A.; Northcott, G.L.; Matthaei, C.D. Medicating the Environment? A Critical Review on the Risks of Carbamazepine, Diclofenac and Ibuprofen to Aquatic Organisms. Environ. Adv. 2022, 7, 100164. [Google Scholar] [CrossRef]
- Sousa, J.C.G.; Ribeiro, A.R.; Barbosa, M.O.; Ribeiro, C.; Tiritan, M.E.; Pereira, M.F.R.; Silva, A.M.T. Monitoring of the 17 EU Watch List Contaminants of Emerging Concern in the Ave and the Sousa Rivers. Sci. Total Environ. 2019, 649, 1083–1095. [Google Scholar] [CrossRef]
- Wong, F.; Robson, M.; Melymuk, L.; Shunthirasingham, C.; Alexandrou, N.; Shoeib, M.; Luk, E.; Helm, P.; Diamond, M.L.; Hung, H. Urban Sources of Synthetic Musk Compounds to the Environment. Environ. Sci. Process. Impacts 2019, 21, 74–88. [Google Scholar] [CrossRef] [Green Version]
- Buerge, I.J.; Buser, H.-R.; Müller, M.D.; Poiger, T. Behavior of the Polycyclic Musks HHCB and AHTN in Lakes, Two Potential Anthropogenic Markers for Domestic Wastewater in Surface Waters. Environ. Sci. Technol. 2003, 37, 5636–5644. [Google Scholar] [CrossRef]
- Gonçalves, C.; Alves, C.; Pio, C. Inventory of Fine Particulate Organic Compound Emissions from Residential Wood Combustion in Portugal. Atmos. Environ. 2012, 50, 297–306. [Google Scholar] [CrossRef]
- Škrbić, B.; Đurišić-Mladenović, N.; Živančev, J.; Tadić, Đ. Seasonal Occurrence and Cancer Risk Assessment of Polycyclic Aromatic Hydrocarbons in Street Dust from the Novi Sad City, Serbia. Sci. Total Environ. 2019, 647, 191–203. [Google Scholar] [CrossRef]
- Barbosa, A.E.; Fernandes, J.N.; David, L.M. Key Issues for Sustainable Urban Stormwater Management. Water Res. 2012, 46, 6787–6798. [Google Scholar] [CrossRef]
- Lundy, L.; Ellis, J.B.; Revitt, D.M. Risk Prioritisation of Stormwater Pollutant Sources. Water Res. 2012, 46, 6589–6600. [Google Scholar] [CrossRef] [PubMed]
- Ferreira, A.; Martins, M.; Vale, C. Influence of Diffuse Sources on Levels and Distribution of Polychlorinated Biphenyls in the Guadiana River Estuary, Portugal. Mar. Chem. 2003, 83, 175–184. [Google Scholar] [CrossRef]
- Urbaniak, M.; Zieliński, M.; Kaczkowski, Z.; Zalewski, M. Spatial Distribution of PCDDs, PCDFs and Dl-PCBs along the Cascade of Urban Reservoirs. Hydrol. Res. 2012, 44, 614–630. [Google Scholar] [CrossRef] [Green Version]
- Megson, D.; Benoit, N.B.; Sandau, C.D.; Chaudhuri, S.R.; Long, T.; Coulthard, E.; Johnson, G.W. Evaluation of the Effectiveness of Different Indicator PCBs to Estimating Total PCB Concentrations in Environmental Investigations. Chemosphere 2019, 237, 124429. [Google Scholar] [CrossRef]
- Boix, C.; Ibáñez, M.; Sancho, J.V.; Parsons, J.R.; de Voogt, P.; Hernández, F. Biotransformation of Pharmaceuticals in Surface Water and during Waste Water Treatment: Identification and Occurrence of Transformation Products. J. Hazard. Mater. 2016, 302, 175–187. [Google Scholar] [CrossRef] [PubMed]
- Backhaus, T.; Faust, M. Predictive Environmental Risk Assessment of Chemical Mixtures: A Conceptual Framework. Environ. Sci. Technol. 2012, 46, 2564–2573. [Google Scholar] [CrossRef]
- Forrest, J.A.; Clements, J.A.; Prescott, L.F. Clinical Pharmacokinetics of Paracetamol. Clin. Pharmacokinet. 1982, 7, 93–107. [Google Scholar] [CrossRef]
- Bahlmann, A.; Brack, W.; Schneider, R.J.; Krauss, M. Carbamazepine and Its Metabolites in Wastewater: Analytical Pitfalls and Occurrence in Germany and Portugal. Water Res. 2014, 57, 104–114. [Google Scholar] [CrossRef] [PubMed]
- Mazaleuskaya, L.L.; Sangkuhl, K.; Thorn, C.F.; FitzGerald, G.A.; Altman, R.B.; Klein, T.E. PharmGKB Summary: Pathways of Acetaminophen Metabolism at the Therapeutic versus Toxic Doses. Pharmacogenet. Genom. 2015, 25, 416–426. [Google Scholar] [CrossRef] [Green Version]
- Altman, R.; Bosch, B.; Brune, K.; Patrignani, P.; Young, C. Advances in NSAID Development: Evolution of Diclofenac Products Using Pharmaceutical Technology. Drugs 2015, 75, 859–877. [Google Scholar] [CrossRef] [PubMed]
- Naber, C.K.; Hammer, M.; Kinzig-Schippers, M.; Sauber, C.; Sörgel, F.; Bygate, E.A.; Fairless, A.J.; Machka, K.; Naber, K.G. Urinary Excretion and Bactericidal Activities of Gemifloxacin and Ofloxacin after a Single Oral Dose in Healthy Volunteers. Antimicrob. Agents Chemother. 2001, 45, 3524–3530. [Google Scholar] [CrossRef] [Green Version]
- Törneman, N.; Johansson, M. Temporal variation of WFD priority substances. SWECO Environ. Screen. Rep. 2008, 37, 1–53. [Google Scholar]
- Vlach, V.; Ledvinka, O.; Matouskova, M. Changing Low Flow and Streamflow Drought Seasonality in Central European Headwaters. Water 2020, 12, 3575. [Google Scholar] [CrossRef]
- Wilkinson, J.L.; Hooda, P.S.; Swinden, J.; Barker, J.; Barton, S. Spatial Distribution of Organic Contaminants in Three Rivers of Southern England Bound to Suspended Particulate Material and Dissolved in Water. Sci. Total Environ. 2017, 593, 487–497. [Google Scholar] [CrossRef]
- White, D.; Lapworth, D.J.; Civil, W.; Williams, P. Tracking Changes in the Occurrence and Source of Pharmaceuticals within the River Thames, UK; from Source to Sea. Environ. Pollut. 2019, 249, 257–266. [Google Scholar] [CrossRef]
- Nannou, C.I.; Kosma, C.I.; Albanis, T.A. Occurrence of Pharmaceuticals in Surface Waters: Analytical Method Development and Environmental Risk Assessment. Int. J. Environ. Anal. Chem. 2015, 95, 1242–1262. [Google Scholar] [CrossRef]
- Niemi, L.; Landová, P.; Taggart, M.; Boyd, K.; Zhang, Z.; Gibb, S. Spatiotemporal Trends and Annual Fluxes of Pharmaceuticals in a Scottish Priority Catchment. Environ. Pollut. 2022, 292, 118295. [Google Scholar] [CrossRef] [PubMed]
- González-Gaya, B.; Lopez-Herguedas, N.; Santamaria, A.; Mijangos, F.; Etxebarria, N.; Olivares, M.; Prieto, A.; Zuloaga, O. Suspect Screening Workflow Comparison for the Analysis of Organic Xenobiotics in Environmental Water Samples. Chemosphere 2021, 274, 129964. [Google Scholar] [CrossRef] [PubMed]
- Llamas-Dios, M.I.; Vadillo, I.; Jiménez-Gavilán, P.; Candela, L.; Corada-Fernández, C. Assessment of a Wide Array of Contaminants of Emerging Concern in a Mediterranean Water Basin (Guadalhorce River, Spain): Motivations for an Improvement of Water Management and Pollutants Surveillance. Sci. Total Environ. 2021, 788, 147822. [Google Scholar] [CrossRef] [PubMed]
- Ginebreda, A.; Muñoz, I.; de Alda, M.L.; Brix, R.; López-Doval, J.; Barceló, D. Environmental Risk Assessment of Pharmaceuticals in Rivers: Relationships between Hazard Indexes and Aquatic Macroinvertebrate Diversity Indexes in the Llobregat River (NE Spain). Environ. Int. 2010, 36, 153–162. [Google Scholar] [CrossRef]
- Gracia-Lor, E.; Sancho, J.V.; Hernández, F. Multi-Class Determination of around 50 Pharmaceuticals, Including 26 Antibiotics, in Environmental and Wastewater Samples by Ultra-High Performance Liquid Chromatography–Tandem Mass Spectrometry. J. Chromatogr. A 2011, 1218, 2264–2275. [Google Scholar] [CrossRef]
- Osorio, V.; Marcé, R.; Pérez, S.; Ginebreda, A.; Cortina, J.L.; Barceló, D. Occurrence and Modeling of Pharmaceuticals on a Sewage-Impacted Mediterranean River and Their Dynamics under Different Hydrological Conditions. Sci. Total Environ. 2012, 440, 3–13. [Google Scholar] [CrossRef] [PubMed]
- Fonseca, E.; Hernández, F.; Ibáñez, M.; Rico, A.; Pitarch, E.; Bijlsma, L. Occurrence and Ecological Risks of Pharmaceuticals in a Mediterranean River in Eastern Spain. Environ. Int. 2020, 144, 106004. [Google Scholar] [CrossRef] [PubMed]
- Malnes, D.; Ahrens, L.; Köhler, S.; Forsberg, M.; Golovko, O. Occurrence and Mass Flows of Contaminants of Emerging Concern (CECs) in Sweden’s Three Largest Lakes and Associated Rivers. Chemosphere 2022, 294, 133825. [Google Scholar] [CrossRef]
- Marsik, P.; Rezek, J.; Židková, M.; Kramulová, B.; Tauchen, J.; Vaněk, T. Non-Steroidal Anti-Inflammatory Drugs in the Watercourses of Elbe Basin in Czech Republic. Chemosphere 2017, 171, 97–105. [Google Scholar] [CrossRef]
- Lindholm-Lehto, P.C.; Ahkola, H.S.J.; Knuutinen, J.S.; Herve, S.H. Widespread Occurrence and Seasonal Variation of Pharmaceuticals in Surface Waters and Municipal Wastewater Treatment Plants in Central Finland. Environ. Sci. Pollut. Res. 2016, 23, 7985–7997. [Google Scholar] [CrossRef]
- Milić, N.; Milanović, M.; Radonić, J.; Turk Sekulić, M.; Mandić, A.; Orčić, D.; Mišan, A.; Milovanović, I.; Grujić Letić, N.; Vojinović Miloradov, M. The Occurrence of Selected Xenobiotics in the Danube River via LC-MS/MS. Environ. Sci. Pollut. Res. 2018, 25, 11074–11083. [Google Scholar] [CrossRef]
- López-Roldán, R.; de Alda, M.L.; Gros, M.; Petrovic, M.; Martín-Alonso, J.; Barceló, D. Advanced Monitoring of Pharmaceuticals and Estrogens in the Llobregat River Basin (Spain) by Liquid Chromatography–Triple Quadrupole-Tandem Mass Spectrometry in Combination with Ultra Performance Liquid Chromatography–Time of Flight-Mass Spectrometry. Chemosphere 2010, 80, 1337–1344. [Google Scholar] [CrossRef] [PubMed]
- Meyer, W.; Reich, M.; Beier, S.; Behrendt, J.; Gulyas, H.; Otterpohl, R. Measured and Predicted Environmental Concentrations of Carbamazepine, Diclofenac, and Metoprolol in Small and Medium Rivers in Northern Germany. Environ. Monit. Assess. 2016, 188, 487. [Google Scholar] [CrossRef] [PubMed]
- Chitescu, C.L.; Kaklamanos, G.; Nicolau, A.I.; Stolker, A.A.M.L. High Sensitive Multiresidue Analysis of Pharmaceuticals and Antifungals in Surface Water Using U-HPLC-Q-Exactive Orbitrap HRMS. Application to the Danube River Basin on the Romanian Territory. Sci. Total Environ. 2015, 532, 501–511. [Google Scholar] [CrossRef] [PubMed]
- Moldovan, Z.; Marincas, O.; Povar, I.; Lupascu, T.; Longree, P.; Rota, J.S.; Singer, H.; Alder, A.C. Environmental Exposure of Anthropogenic Micropollutants in the Prut River at the Romanian-Moldavian Border: A Snapshot in the Lower Danube River Basin. Environ. Sci. Pollut. Res. Int. 2018, 25, 31040–31050. [Google Scholar] [CrossRef] [PubMed]
- Česen, M.; Ahel, M.; Terzić, S.; Heath, D.J.; Heath, E. The Occurrence of Contaminants of Emerging Concern in Slovenian and Croatian Wastewaters and Receiving Sava River. Sci. Total Environ. 2019, 650, 2446–2453. [Google Scholar] [CrossRef]
- Iglesias, A.; Nebot, C.; Vázquez, B.I.; Coronel-Olivares, C.; Abuín, C.M.F.; Cepeda, A. Monitoring the Presence of 13 Active Compounds in Surface Water Collected from Rural Areas in Northwestern Spain. Int. J. Environ. Res. Public Health 2014, 11, 5251–5272. [Google Scholar] [CrossRef] [Green Version]
- Carmona, E.; Andreu, V.; Picó, Y. Occurrence of Acidic Pharmaceuticals and Personal Care Products in Turia River Basin: From Waste to Drinking Water. Sci. Total Environ. 2014, 484, 53–63. [Google Scholar] [CrossRef]
- Golovko, O.; Rehrl, A.-L.; Köhler, S.; Ahrens, L. Organic Micropollutants in Water and Sediment from Lake Mälaren, Sweden. Chemosphere 2020, 258, 127293. [Google Scholar] [CrossRef]
- Fernández, C.; González-Doncel, M.; Pro, J.; Carbonell, G.; Tarazona, J.V. Occurrence of Pharmaceutically Active Compounds in Surface Waters of the Henares-Jarama-Tajo River System (Madrid, Spain) and a Potential Risk Characterization. Sci. Total Environ. 2010, 408, 543–551. [Google Scholar] [CrossRef]
- Grujić, S.; Vasiljević, T.; Laušević, M. Determination of Multiple Pharmaceutical Classes in Surface and Ground Waters by Liquid Chromatography-Ion Trap-Tandem Mass Spectrometry. J. Chromatogr. A 2009, 1216, 4989–5000. [Google Scholar] [CrossRef]
- Burns, E.E.; Carter, L.J.; Kolpin, D.W.; Thomas-Oates, J.; Boxall, A.B.A. Temporal and Spatial Variation in Pharmaceutical Concentrations in an Urban River System. Water Res. 2018, 137, 72–85. [Google Scholar] [CrossRef]
- Gonzalez-Rey, M.; Tapie, N.; Le Menach, K.; Dévier, M.H.; Budzinski, H.; Bebianno, M.J. Occurrence of Pharmaceutical Compounds and Pesticides in Aquatic Systems. Mar. Pollut. Bull. 2015, 96, 384–400. [Google Scholar] [CrossRef] [PubMed]
- Schwanen, C.A.; Schwarzbauer, J. Structural Diversity of Organic Contaminants in a Meso-Scaled River System. Water Air Soil Pollut. 2022, 233, 33. [Google Scholar] [CrossRef]
- Nikolopoulou, V.; Alygizakis, N.A.; Nika, M.-C.; Oswaldova, M.; Oswald, P.; Kostakis, M.; Koupa, A.; Thomaidis, N.S.; Slobodnik, J. Screening of Legacy and Emerging Substances in Surface Water, Sediment, Biota and Groundwater Samples Collected in the Siverskyi Donets River Basin Employing Wide-Scope Target and Suspect Screening. Sci. Total Environ. 2022, 805, 150253. [Google Scholar] [CrossRef] [PubMed]
- Castiglioni, S.; Pomati, F.; Miller, K.; Burns, B.P.; Zuccato, E.; Calamari, D.; Neilan, B.A. Novel Homologs of the Multiple Resistance Regulator MarA in Antibiotic-Contaminated Environments. Water Res. 2008, 42, 4271–4280. [Google Scholar] [CrossRef] [PubMed]
- Riva, F.; Zuccato, E.; Davoli, E.; Fattore, E.; Castiglioni, S. Risk Assessment of a Mixture of Emerging Contaminants in Surface Water in a Highly Urbanized Area in Italy. J. Hazard. Mater. 2019, 361, 103–110. [Google Scholar] [CrossRef]
- Robles-Molina, J.; Gilbert-López, B.; García-Reyes, J.F.; Molina-Díaz, A. Monitoring of Selected Priority and Emerging Contaminants in the Guadalquivir River and Other Related Surface Waters in the Province of Jaén, South East Spain. Sci. Total Environ. 2014, 479, 247–257. [Google Scholar] [CrossRef]
- Gheorghe, S.; Petre, J.; Lucaciu, I.; Stoica, C.; Nita-Lazar, M. Risk Screening of Pharmaceutical Compounds in Romanian Aquatic Environment. Environ. Monit. Assess. 2016, 188, 379. [Google Scholar] [CrossRef]
- Villa, S.; Assi, L.; Ippolito, A.; Bonfanti, P.; Finizio, A. First Evidences of the Occurrence of Polycyclic Synthetic Musk Fragrances in Surface Water Systems in Italy: Spatial and Temporal Trends in the Molgora River (Lombardia Region, Northern Italy). Sci. Total Environ. 2012, 416, 137–141. [Google Scholar] [CrossRef] [PubMed]
- Gorga, M.; Insa, S.; Petrovic, M.; Barceló, D. Occurrence and Spatial Distribution of EDCs and Related Compounds in Waters and Sediments of Iberian Rivers. Sci. Total Environ. 2015, 503, 69–86. [Google Scholar] [CrossRef] [PubMed]
- Matějíček, D.; Grycová, A.; Vlček, J. The Use of Molecularly Imprinted Polymers for the Multicomponent Determination of Endocrine-Disrupting Compounds in Water and Sediment. J. Sep. Sci. 2013, 36, 1097–1103. [Google Scholar] [CrossRef] [PubMed]
- Bolívar-Subirats, G.; Rivetti, C.; Cortina-Puig, M.; Barata, C.; Lacorte, S. Occurrence, Toxicity and Risk Assessment of Plastic Additives in Besos River, Spain. Chemosphere 2021, 263, 128022. [Google Scholar] [CrossRef] [PubMed]
- Cladière, M.; Gasperi, J.; Lorgeoux, C.; Bonhomme, C.; Rocher, V.; Tassin, B. Alkylphenolic Compounds and Bisphenol A Contamination within a Heavily Urbanized Area: Case Study of Paris. Environ. Sci. Pollut. Res. 2013, 20, 2973–2983. [Google Scholar] [CrossRef] [PubMed] [Green Version]
- Vulliet, E.; Berlioz-Barbier, A.; Lafay, F.; Baudot, R.; Wiest, L.; Vauchez, A.; Lestremau, F.; Botta, F.; Cren-Olivé, C. A National Reconnaissance for Selected Organic Micropollutants in Sediments on French Territory. Environ. Sci. Pollut. Res. 2014, 21, 11370–11379. [Google Scholar] [CrossRef] [PubMed]
- Stasinakis, A.S.; Mermigka, S.; Samaras, V.G.; Farmaki, E.; Thomaidis, N.S. Occurrence of Endocrine Disrupters and Selected Pharmaceuticals in Aisonas River (Greece) and Environmental Risk Assessment Using Hazard Indexes. Environ. Sci. Pollut. Res. 2012, 19, 1574–1583. [Google Scholar] [CrossRef] [PubMed]
- Marziali, L.; Guzzella, L.; Salerno, F.; Marchetto, A.; Valsecchi, L.; Tasselli, S.; Roscioli, C.; Schiavon, A. Twenty-Year Sediment Contamination Trends in Some Tributaries of Lake Maggiore (Northern Italy): Relation with Anthropogenic Factors. Environ. Sci. Pollut. Res. 2021, 28, 38193–38208. [Google Scholar] [CrossRef] [PubMed]
- Barhoumi, B.; Beldean-Galea, M.S.; Al-Rawabdeh, A.M.; Roba, C.; Martonos, I.M.; Bălc, R.; Kahlaoui, M.; Touil, S.; Tedetti, M.; Driss, M.R.; et al. Occurrence, Distribution and Ecological Risk of Trace Metals and Organic Pollutants in Surface Sediments from a Southeastern European River (Someşu Mic River, Romania). Sci. Total Environ. 2019, 660, 660–676. [Google Scholar] [CrossRef] [PubMed]
- Rabodonirina, S.; Net, S.; Ouddane, B.; Merhaby, D.; Dumoulin, D.; Popescu, T.; Ravelonandro, P. Distribution of Persistent Organic Pollutants (PAHs, Me-PAHs, PCBs) in Dissolved, Particulate and Sedimentary Phases in Freshwater Systems. Environ. Pollut. 2015, 206, 38–48. [Google Scholar] [CrossRef] [PubMed]
- Nagy, A.S.; Szabó, J.; Vass, I. Occurrence and Distribution of Polycyclic Aromatic Hydrocarbons in Surface Water and Sediments of the Danube River and Its Tributaries, Hungary. J. Environ. Sci. Health Part A Toxic Hazard. Subst. Environ. Eng. 2014, 49, 1134–1141. [Google Scholar] [CrossRef]
- Gardes, T.; Portet-Koltalo, F.; Debret, M.; Humbert, K.; Levaillant, R.; Simon, M.; Copard, Y. Temporal Trends, Sources, and Relationships between Sediment Characteristics and Polycyclic Aromatic Hydrocarbons (PAHs) and Polychlorinated Biphenyls (PCBs) in Sediment Cores from the Major Seine Estuary Tributary, France. Appl. Geochem. 2020, 122, 104749. [Google Scholar] [CrossRef]
- Metelkova, L.; Zhakovskaya, Z.; Kukhareva, G.; Rybalko, A.; Nikiforov, V. Occurrence of PCDD/PCDFs, Dioxin-like PCBs, and PBDEs in Surface Sediments from the Neva River and the Eastern Gulf of Finland (Russia). Environ. Sci. Pollut. Res. 2019, 26, 7375–7389. [Google Scholar] [CrossRef] [PubMed]
- Schertzinger, G.; Itzel, F.; Kerstein, J.; Tuerk, J.; Schmidt, T.C.; Sures, B. Accumulation Pattern and Possible Adverse Effects of Organic Pollutants in Sediments Downstream of Combined Sewer Overflows. Sci. Total Environ. 2019, 675, 295–304. [Google Scholar] [CrossRef] [PubMed]
- Belháčová-Minaříková, M.; Allan, I.; Vrana, B. Comparing Total and Accessible Concentrations of Hydrophobic Organic Contaminants in Sediments and Suspended Particulate Matter in the Danube River. Environ. Sci. Pollut. Res. Int. 2022, 29, 40954–40963. [Google Scholar] [CrossRef] [PubMed]
- Montuori, P.; Aurino, S.; Garzonio, F.; Triassi, M. Polychlorinated Biphenyls and Organochlorine Pesticides in Tiber River and Estuary: Occurrence, Distribution and Ecological Risk. Sci. Total Environ. 2016, 571, 1001–1016. [Google Scholar] [CrossRef] [PubMed]
- Instituto Português Do Mar e Da Atmosfera. Available online: https://www.ipma.pt/pt/publicacoes/boletins.jsp?cmbDep=cli&cmbTema=pcl&cmbAno=2018&idDep=cli&idTema=pcl&curAno=2018 (accessed on 25 March 2022).
- Kim, Y.; Choi, K.; Jung, J.; Park, S.; Kim, P.-G.; Park, J. Aquatic Toxicity of Acetaminophen, Carbamazepine, Cimetidine, Diltiazem and Six Major Sulfonamides, and Their Potential Ecological Risks in Korea. Environ. Int. 2007, 33, 370–375. [Google Scholar] [CrossRef]
- Han, S.; Choi, K.; Kim, J.; Ji, K.; Kim, S.; Ahn, B.; Yun, J.; Choi, K.; Khim, J.S.; Zhang, X.; et al. Endocrine Disruption and Consequences of Chronic Exposure to Ibuprofen in Japanese Medaka (Oryzias Latipes) and Freshwater Cladocerans Daphnia Magna and Moina Macrocopa. Aquat. Toxicol. 2010, 98, 256–264. [Google Scholar] [CrossRef]
- Nunes, B.; Carvalho, F.; Guilhermino, L. Acute and Chronic Effects of Clofibrate and Clofibric Acid on the Enzymes Acetylcholinesterase, Lactate Dehydrogenase and Catalase of the Mosquitofish, Gambusia Holbrooki. Chemosphere 2004, 57, 1581–1589. [Google Scholar] [CrossRef]
- Han, G.H.; Hur, H.G.; Kim, S.D. Ecotoxicological Risk of Pharmaceuticals from Wastewater Treatment Plants in Korea: Occurrence and Toxicity to Daphnia Magna. Environ. Toxicol. Chem. 2006, 25, 265–271. [Google Scholar] [CrossRef]
- Ferrari, B.; Paxéus, N.; Giudice, R.L.; Pollio, A.; Garric, J. Ecotoxicological Impact of Pharmaceuticals Found in Treated Wastewaters: Study of Carbamazepine, Clofibric Acid, and Diclofenac. Ecotoxicol. Environ. Saf. 2003, 55, 359–370. [Google Scholar] [CrossRef]
- Pires, A.; Almeida, Â.; Correia, J.; Calisto, V.; Schneider, R.J.; Esteves, V.I.; Soares, A.M.V.M.; Figueira, E.; Freitas, R. Long-Term Exposure to Caffeine and Carbamazepine: Impacts on the Regenerative Capacity of the Polychaete Diopatra Neapolitana. Chemosphere 2016, 146, 565–573. [Google Scholar] [CrossRef] [PubMed]
- Cosmetic Ingredient Database. Available online: https://ec.europa.eu/growth/sectors/cosmetics/cosmetic-ingredient-database_pt (accessed on 25 March 2022).
- Balk, F.; Ford, R.A. Environmental Risk Assessment for the Polycyclic Musks, AHTN and HHCB. II. Effect Assessment and Risk Characterisation. Toxicol. Lett. 1999, 111, 81–94. [Google Scholar] [CrossRef] [PubMed]
- Establishment of a List of Predicted No Effect Concentrations (PNECs) for Naturally Occurring Substances in Produced Water (OSPAR Agreement 2014-05)—European Environment Agency. Available online: https://www.eea.europa.eu/data-and-maps/indicators/emission-intensity-of-manufacturing-industries-1/establishment-of-a-list-of (accessed on 25 March 2022).
- Technical Background Document Part 5: Chemical-Specific Parameters. Available online: https://semspub.epa.gov/work/HQ/175235.pdf (accessed on 25 March 2022).
- PubChem. Available online: https://pubchem.ncbi.nlm.nih.gov/ (accessed on 25 March 2022).


| Parameters | F1 | F2 | F3 |
|---|---|---|---|
| Location and height over sea level | 41.79454 N −6.8008 W 692.9 m | 41.7985 N −6.7645 W 668.7 m | 41.7716 N −6.7136 W 497.8 m |
| Temperature (°C) | 7.04 | 6.54 | 6.68 |
| Dissolved oxygen (mg·L−1) | 9.8 (83) * | 10.3 (85) * | 9.0 (74) * 1 |
| Conductivity (µS·cm−1) | 149 | 209 | 290 |
| Total dissolved solids (mg·L−1) | 75 | 105 | 145 |
| pH | 7.0 | 6.5 | 7.2 |
| PO43− (mg·L−1) | 0.03 | 0.04 | 0.42 |
| Total phosphorus (mg·L−1) | 0.08 | 0.23 | 1.10 |
| Riparian Quality | Some disturbance Good quality | Some disturbance Good quality | Disturbance Fair quality |
| F1 MEC ng·L−1 | HQ | F2 MEC ng·L−1 | HQ | F3 MEC ng·L−1 | HQ | L-F1 MEC ng·L−1 | HQ | L-F2 MEC ng·L−1 | HQ | L-F3 MEC ng·L−1 | HQ | |
|---|---|---|---|---|---|---|---|---|---|---|---|---|
| Pharmaceuticals | ||||||||||||
| Paracetamol | 0.05 | 0.002 | 0.05 | 0.002 | 0.05 | 0.002 | 0.05 | 0.002 | 0.05 | 0.002 | 0.05 | 0.002 |
| Ibuprofen | 7.56 | 0.756 | 6.94 | 0.694 | 21.81 | 2.181 | 10.36 | 0.006 | 18.80 | 0.011 | 0.05 | 0.005 |
| Diclofenac | 0.05 | 0.001 | 0.05 | 0.001 | 398.35 | 7.967 | 92.63 | 0.142 | 0.05 | 0.001 | 0.05 | 0.001 |
| Clofibric Acid | 0.05 | 0.000 | 0.05 | 0.000 | 0.05 | 0.000 | 21.47 | 0.003 | 0.05 | 0.000 | 0.05 | 0.000 |
| Carbamazepin | 0.05 | 0.000 | 0.05 | 0.000 | 52.10 | 0.021 | 0.05 | 0.000 | 0.05 | 0.000 | 47.10 | 0.019 |
| Ofloxacin | 0.05 | 0.002 | 0.05 | 0.002 | 376.16 | 12.539 | 0.05 | 0.002 | 0.05 | 0.002 | 0.05 | 0.002 |
| Stimulant alkaloid | ||||||||||||
| Caffeine | 3.17 | 0.063 | 10.23 | 0.205 | 167.38 | 3.348 | 14.43 | 0.030 | 92.60 | 0.191 | 20.41 | 0.042 |
| Musk fragrancies | ||||||||||||
| Galaxolide (HHCB) | 0.05 | 0.000 | 0.05 | 0.000 | 224.36 | 0.051 | 0.05 | 0.000 | 0.05 | 0.000 | 0.05 | 0.000 |
| Tonalide (AHTN) | 0.05 | 0.000 | 207.92 | 0.059 | 231.45 | 0.066 | 0.05 | 0.000 | 0.05 | 0.000 | 0.05 | 0.000 |
| Plasticizers | ||||||||||||
| Bisphenol A (BPA) | 642.69 | 64.27 | 90.95 | 9.095 | 212.18 | 21.218 | 134.92 | 0.957 | 149.27 | 1.059 | 772.85 | 5.484 |
| Toxic units (without BPA) | 0.824 | 0.964 | 26.175 | 0.185 | 0.207 | 0.071 | ||||||
| Total Toxic units | 65.09 | 10.06 | 47.393 | 1.142 | 1.266 | 5.555 |
| F1 MEC ng·g−1 dw | HQ | F2 MEC ng·g−1 dw | HQ | F3 MEC ng·g−1 dw | HQ | |
|---|---|---|---|---|---|---|
| 2–3 rings | ||||||
| Naphtalene (N) | 0.05 | 0.001 | 0.05 | 0.001 | 0.05 | 0.001 |
| Acenaphthylene (Acy) | 0.05 | 0.005 | 0.05 | 0.005 | 0.05 | 0.005 |
| Acenaphthene (Ace) | 0.05 | 0.001 | 0.05 | 0.001 | 0.05 | 0.001 |
| Fluorene (F) | 2.63 | 0.035 | 1.07 | 0.014 | 0.08 | 0.001 |
| Phenanthrene (P) | 8.08 | 0.019 | 10.13 | 0.024 | 2.95 | 0.007 |
| Anthracene (Ant) | 4.89 | 0.076 | 7.53 | 0.118 | 2.07 | 0.032 |
| Σ | 15.75 | 18.88 | 5.25 | |||
| 4 rings | ||||||
| Fluoranthene (Flu) | 2.48 | 0.165 | 6.28 | 0.418 | 1.31 | 0.087 |
| Pyrene (Pyr) | 6.97 | 0.134 | 9.25 | 0.178 | 0.35 | 0.007 |
| Benz(a)anthracene (BaA) | 2.81 | 0.281 | 9.40 | 0.940 | 1.31 | 0.131 |
| Chrysene (Chr) | 2.72 | 0.045 | 3.18 | 0.053 | 0.49 | 0.008 |
| Σ | 14.98 | 28.11 | 3.46 | |||
| 5–6 rings | ||||||
| Benzo(b + j)fluoranthene (BbjF) | 2.79 | 2.70 | - | 0.69 | - | |
| Benzo(k)fluoranthene (BkF) | 4.77 | 0.954 | 1.80 | 0.359 | 0.49 | 0.099 |
| Benzo(a) pyrene (BaP) | 1.21 | 0.302 | 0.05 | 0.013 | 0.17 | 0.042 |
| Dibenz (a.h)anthracene (DBA) | 0.05 | 0.004 | 0.05 | 0.004 | 0.05 | 0.004 |
| Benzo(ghi)perylene (BghiPer) | 2.21 | 0.737 | 0.05 | 0.017 | 0.05 | 0.017 |
| Indeno(1.2.3-cd) pyrene (IcdP) | 1.79 | 0.138 | 1.28 | 0.099 | 0.23 | 0.018 |
| Σ | 12.82 | 5.93 | 1.68 | |||
| ΣTotal ≥ 4 rings | 27.80 | 34.04 | 5.14 | |||
| Toxic units | 2.897 | 2.244 | 0.460 |
| Ratios | F1 | F2 | F3 | Limit Values for Petrogenic Source | Limit Values for Pyrogenic Source |
|---|---|---|---|---|---|
| Ant/(Ant + P) | 0.38 | 0.43 | 0.59 | <0.1 | >0.1 |
| F/(F + Pyr) | 0.26 | 0.40 | 0.78 | <0.4 | >0.5 a |
| BaA/(BaA + Chr) | 0.39 | 0.75 | 0.73 | <0.2 | >0.35 b |
| IcdP/(IcdP + BghiPer) | 0.48 | 0.96 | 0.82 | <0.2 | >0.5 c |
| LMW/HMW | 0.57 | 0.55 | 1.02 | >1 | <1 |
| Total Index | 8.01 | 14.72 | 20.69 | <4 | >4 |
| F1 ng g−1 dw | HQ | ng TEQ g−1 | F2 ng g−1 dw | HQ | ng TEQ g−1 | F3 ng g−1 dw | HQ | ng TEQ g−1 | |
|---|---|---|---|---|---|---|---|---|---|
| PCBs indicators | |||||||||
| PCB28 | 0.05 | 0.581 | 0.05 | 0.581 | 1.16 | 13.488 | |||
| PCB52 | 1.19 | 74.375 | 0.05 | 3.125 | 1.28 | 80.0 | |||
| PCB101 | 1.32 | 6.471 | 1.56 | 7.647 | 0.05 | 0.245 | |||
| PCB138 | 0.05 | 1.612 | 0.05 | 1.613 | 1.63 | 52.581 | |||
| PCB153 | 0.05 | 1.852 | 0.05 | 1.852 | 0.05 | 1.852 | |||
| PCB180 | 0.05 | 1.471 | 0.89 | 26.176 | 0.05 | 31.176 | |||
| Total | 2.71 | 2.65 | 4.22 | ||||||
| PCBs “dioxin-like” | |||||||||
| PCB81 | 0.05 | 1.50 × 10⁻⁵ | 0.05 | 1.50 × 10⁻⁵ | 0.05 | 1.50 × 10⁻⁵ | |||
| PCB77 | 0.05 | 6.250 | 5.00 × 10⁻⁶ | 0.05 | 6.250 | 5.00 × 10⁻⁶ | 0.05 | 6.250 | 5.00 × 10⁻⁶ |
| PCB123 | 0.05 | 1.50 × 10⁻⁶ | 0.05 | 1.50 × 10⁻⁶ | 0.05 | 1.50 × 10⁻⁶ | |||
| PCB118 | 0.97 | 38.80 | 2.91 × 10⁻⁵ | 1.45 | 58.0 | 4.35 × 10⁻⁵ | 0.29 | 11.60 | 8.70 × 10⁻⁶ |
| PCB114 | 0.05 | 1.50 × 10⁻⁶ | 0.05 | 1.50 × 10⁻⁶ | 0.05 | 1.50 × 10⁻⁶ | |||
| PCB105 | 0.99 | 7.226 | 2.97 × 10⁻⁵ | 2.16 | 15.766 | 6.48 × 10⁻⁵ | 0.05 | 0.365 | 1.50 × 10⁻⁶ |
| PCB126 | 0.05 | 5.00 × 10⁻³ * | 0.05 | 5.00 × 10⁻³ * | 0.05 | 5.00 × 10⁻³ * | |||
| PCB167 | 0.05 | 1.50 × 10⁻⁶ | 0.05 | 1.50 × 10⁻⁶ | 0.05 | 1.50 × 10⁻⁶ | |||
| PCB156 | 0.65 | 162.50 | 1.95 × 10⁻⁵ | 0.05 | 12.50 | 1.50 × 10⁻⁶ | 0.05 | 12.50 | 1.50 × 10⁻⁶ |
| PCB157 | 0.41 | 1.23 × 10⁻⁵ | 0.05 | 1.50 × 10⁻⁶ | 0.05 | 1.50 × 10⁻⁶ | |||
| PCB169 | 0.05 | 1.50 × 10⁻³ * | 0.05 | 1.50 × 10⁻⁶ * | 0.05 | 1.50 × 10⁻³ * | |||
| PCB189 | 0.05 | 1.50 × 10⁻³ * | 0.05 | 1.50 × 10⁻³ * | 0.05 | 1.50 × 10⁻⁶ | |||
| Total | 3.42 | 4.11 | 0.84 |
Disclaimer/Publisher’s Note: The statements, opinions and data contained in all publications are solely those of the individual author(s) and contributor(s) and not of MDPI and/or the editor(s). MDPI and/or the editor(s) disclaim responsibility for any injury to people or property resulting from any ideas, methods, instructions or products referred to in the content. |
© 2022 by the authors. Licensee MDPI, Basel, Switzerland. This article is an open access article distributed under the terms and conditions of the Creative Commons Attribution (CC BY) license (https://creativecommons.org/licenses/by/4.0/).
Share and Cite
Canle, M.; Antão-Geraldes, A.M. A Snapshot on the Occurrence and Risk Assessment of Organic Pollutants in an Urban River. Appl. Sci. 2023, 13, 146. https://doi.org/10.3390/app13010146
Canle M, Antão-Geraldes AM. A Snapshot on the Occurrence and Risk Assessment of Organic Pollutants in an Urban River. Applied Sciences. 2023; 13(1):146. https://doi.org/10.3390/app13010146
Chicago/Turabian StyleCanle, Moisés, and Ana M. Antão-Geraldes. 2023. "A Snapshot on the Occurrence and Risk Assessment of Organic Pollutants in an Urban River" Applied Sciences 13, no. 1: 146. https://doi.org/10.3390/app13010146