Article

Lamb Behaviors Analysis Using a Predictive CNN Model and a Single Camera

by
Yair González-Baldizón
1,*,
Madaín Pérez-Patricio
1,*,
Jorge Luis Camas-Anzueto
1,
Oscar Mario Rodríguez-Elías
2,
Elias Neftali Escobar-Gómez
1,
Hector Daniel Vazquez-Delgado
1,
Julio Alberto Guzman-Rabasa
1 and
José Armando Fragoso-Mandujano
1
1
TecNM/IT Tuxtla Gutiérrez, Carretera Panamericana Km. 1080, Tuxtla Gutiérrez CP 29050, Chiapas, Mexico
2
TecNM/IT Hermosillo, Av. Tecnológico S/N, Hermosillo CP 83170, Sonora, Mexico
*
Authors to whom correspondence should be addressed.
Appl. Sci. 2022, 12(9), 4712; https://doi.org/10.3390/app12094712
Submission received: 11 April 2022 / Revised: 29 April 2022 / Accepted: 3 May 2022 / Published: 7 May 2022
(This article belongs to the Topic Applied Computer Vision and Pattern Recognition)

Abstract

:
Object tracking is the process of estimating in time N the location of one or more moving element through an agent (camera, sensor, or other perceptive device). An important application in object tracking is the analysis of animal behavior to estimate their health. Traditionally, experts in the field have performed this task. However, this approach requires a high level of knowledge in the area and sufficient employees to ensure monitoring quality. Another alternative is the application of sensors (inertial and thermal), which provides precise information to the user, such as location and temperature, among other data. Nevertheless, this type of analysis results in high infrastructure costs and constant maintenance. Another option to overcome these problems is to analyze an RGB image to obtain information from animal tracking. This alternative eliminates the reliance on experts and different sensors, yet it adds the challenge of interpreting image ambiguity correctly. Taking into consideration the aforementioned, this article proposes a methodology to analyze lamb behavior from an approach based on a predictive model and deep learning, using a single RGB camera. This method consists of two stages. First, an architecture for lamb tracking was designed and implemented using CNN. Second, a predictive model was designed for the recognition of animal behavior. The results obtained in this research indicate that the proposed methodology is feasible and promising. In this sense, according to the experimental results on the used dataset, the accuracy was 99.85% for detecting lamb activities with YOLO V 4 , and for the proposed predictive model, a mean accuracy was 83.52% for detecting abnormal states. These results suggest that the proposed methodology can be useful in precision agriculture in order to take preventive actions and to diagnose possible diseases or health problems.

1. Introduction

The analysis of animal behavior allows the identification, classification, and quantification of their actions. This analysis permits monitoring the animals’ status to reduce economic losses due to diseases, or in the worst case scenario, deaths. It also facilitates the quantification of the resources consumed for optimization. Moreover, it provides follow-up information during heat, pregnancy, and birth. Due to these benefits, different experts have used individual behavior analysis or group analysis with different approaches, such as detecting physical problems [1,2], behavior in climatic changes [3,4], behavior during feeding [5,6], or simply individual tracking of animals [7,8].
An alternative is the use of a methodology that evaluates the individual or group animal behavior using several sensors. On the other hand, other methodologies use learning algorithms to generalize the problems for specific applications. The approach presented in this research [9,10,11,12] analyzes animal behavior individually using in-depth information. In this research, a laser sensor to calculate the distance between the animal and the camera was used. This was implemented to perform segmentation between the objects and the environment. This approach usually has good results indoors; solar radiation affected the performance of depth sensors when implemented outdoors. This was a substantial limitation because incorrect depths affected the accurate animal analysis.
Another way to implement individual behavior analysis is by using geometric analysis techniques [13,14]. This approach used detection from object segmentation in order to extract the area of each object. Although some studies showed positive results under controlled conditions, accuracy in this project dropped dramatically in dynamic environments or multiple animals that had occlusions between them and the camera. Unfortunately, deployment in production environments was poor due to these problems.
The research presented by [1,15] showed a different approach, where performs an analysis using machine learning techniques. These projects used the detection of a previously provided set of variables. This methodology has showed good results; however, a necessary variable analysis was predefined to ensure the correct operation of these approaches; this is considered a limiting factor because an analysis of the values, which provide better results, must be carried out before its implementation. The analysis of individual behavior currently uses deep learning techniques [16,17,18,19,20,21,22]. These works performed detection with a previously labeled dataset with defined categories (color, texture, shape) to automate the detection of a state, object, or posture. These researches usually have good results in situations of individual analysis. However, applications with multiple target objects or without the necessary conditions for their implementation tend to result in worse efficiency. These approaches must be trained appropriately with the categories of objects to be detected. Otherwise, these have low levels of precision during detection.
The approach presented in the papers of [3,23,24,25,26,27], They analyze group animal behavior using sensors and linear regressions to estimate behaviors or states. These cases were differentiated by: a custom dataset, preprocessing, segmentation, and analysis using linear methods.
The methodologies addressed use important information, such as GPS position, temperature, shape size, and perspective. These are the input variables in the classification to obtain a behavior of the object in its environment that implement linear regressions. On the other hand, it was possible to detect abnormal conduct using behavior analysis.
This detection was possible if the methodology considered outliers in the measurements of the environment where it was applied. However, this extraction was limited to linear relationships. That is, the methodology was changed to adapt to new variables.
More recently were the studies presented in [5,28,29,30,31]; these used learning algorithms for behavior analysis. These works implemented deep learning algorithms to extract information from animals. The stages of automatic detection, monitoring, and analysis of animal behavior were identifiable in these cases. A convolutional neural network (CNN) performed the detection, standard methods performed tracking, and each of the authors freely approached behavior analysis. With a varied dataset with different postures and different lighting conditions, applying data augmentation techniques improved the CNN’s precision in detecting postures/objects. These detections were the input for the statistical methods to obtain a result of the behavior analysis. On the other hand, the detection of animal postures was possible with a dataset without categories. This meant that detection was possible by a predetermined evaluation by the user (right to eat, left to drink). However, this type of work involved a high number of operations. This type of system required high-performance computational hardware and a margin of error due to custom evaluation for the assignment of positions or activities. Table 1 compares the related works according to the precision obtained and the deep learning model used.
This research focused on creating a predictive model using information on animal behavior in group housing conditions. Most previous research was limited to group or individual detection under particular environmental conditions. Unlike the previous works, we performed the automatic analysis of lamb behavior in stables. To do this, a method for the extraction of information through deep learning, one for tracking with image processing, and a predictive model, are proposed. This methodology brings together the information from the proposed tracking method and the information provided by deep learning. Deep learning generated data are used to obtain object category recognition and validate the number of detected objects or an occlusion between animals. The distance traveled by the object tracking is calculated, and all this information is saved. Finally, the proposed predictive model uses this information to determine the normal or abnormal status of the lamb.
The research contributions are (1) a dataset extracted from videos with more than 9652 images of lambs that is manually labeled concerning the activities of “eating”, “laying”, and “standing”; (2) the proposed methodology for behavior detection of lambs; and (3) the creation of a simple predictive model for the evaluation of the welfare of a lamb based on the information taken from the tracking and detection of activities.
The remaining sections of the paper are organized as follows: Section 2 describes the research requirements and configurations for acquiring information from our dataset. Section 3 covers the results obtained from the methodology for the detection of lamb activities and how to evaluate the accuracy of CNN. This same section shows the generation of the predictive model for detecting lamb with motor problems. The challenges and future work of this research are discussed in Section 4. Finally, the conclusions are presented in Section 5.

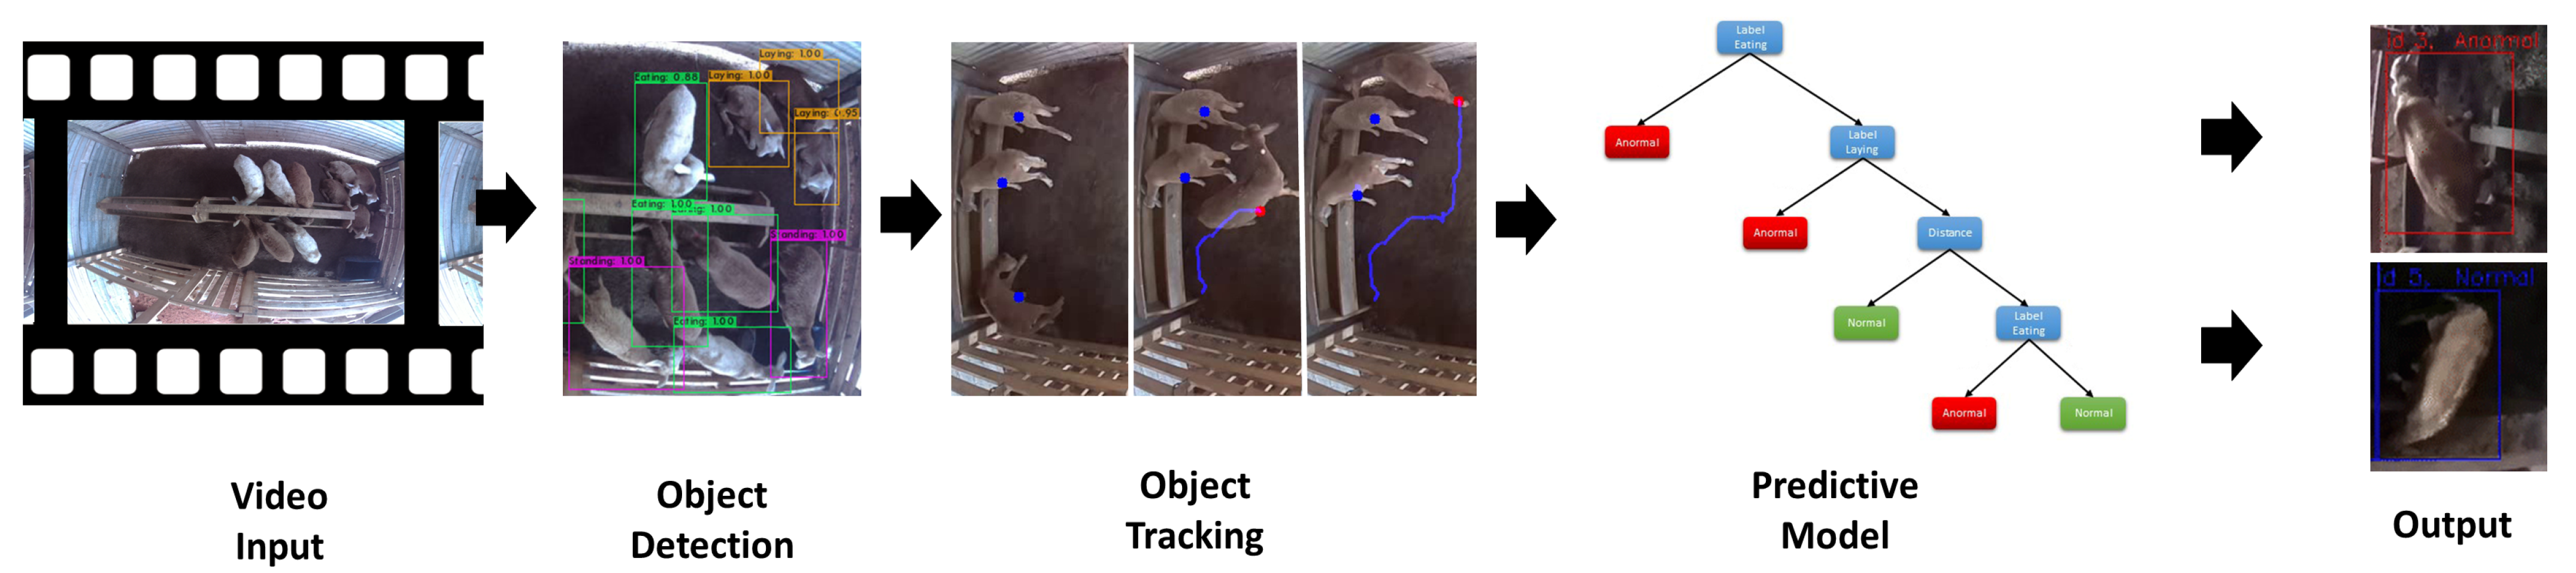
2. Materials and Methods

This section presents the materials used and the proposed methodology. This consists of analyzing lamb behavior with an approach based on deep learning and a predictive model using a single RGB camera. Our strategy was to extract the information from an RGB image through deep learning. Furthermore, this strategy combines the power of abstraction of deep learning and the use of predictive models. This means combining these two approaches to deal with the problem of animal behavior analysis. In order to achieve this process, we analyzed lamp behavior in three steps: detection, tracking, and predictive analysis. First, object detection provided a location and delineation of the lamb in the scene (Section 2.2). Second, mathematical analysis to track the different animals in the scene was used (Section 2.3). Third, a predictive model was proposed to determine the behavior presented in the animals subjected to study (Section 3.2). In addition, an input video was used (Section 2.1). These videos provided the methodology the information needed to function. Figure 1 shows the proposed methodology.

2.1. Video Input

This subsection presents the main gathering of information from videos that were used in our study. These videos provided the information which the methodology needed to work. First, we describe the animal features and the place of study. Second, we present the configuration of the facilities used and the specifications of the recordings.

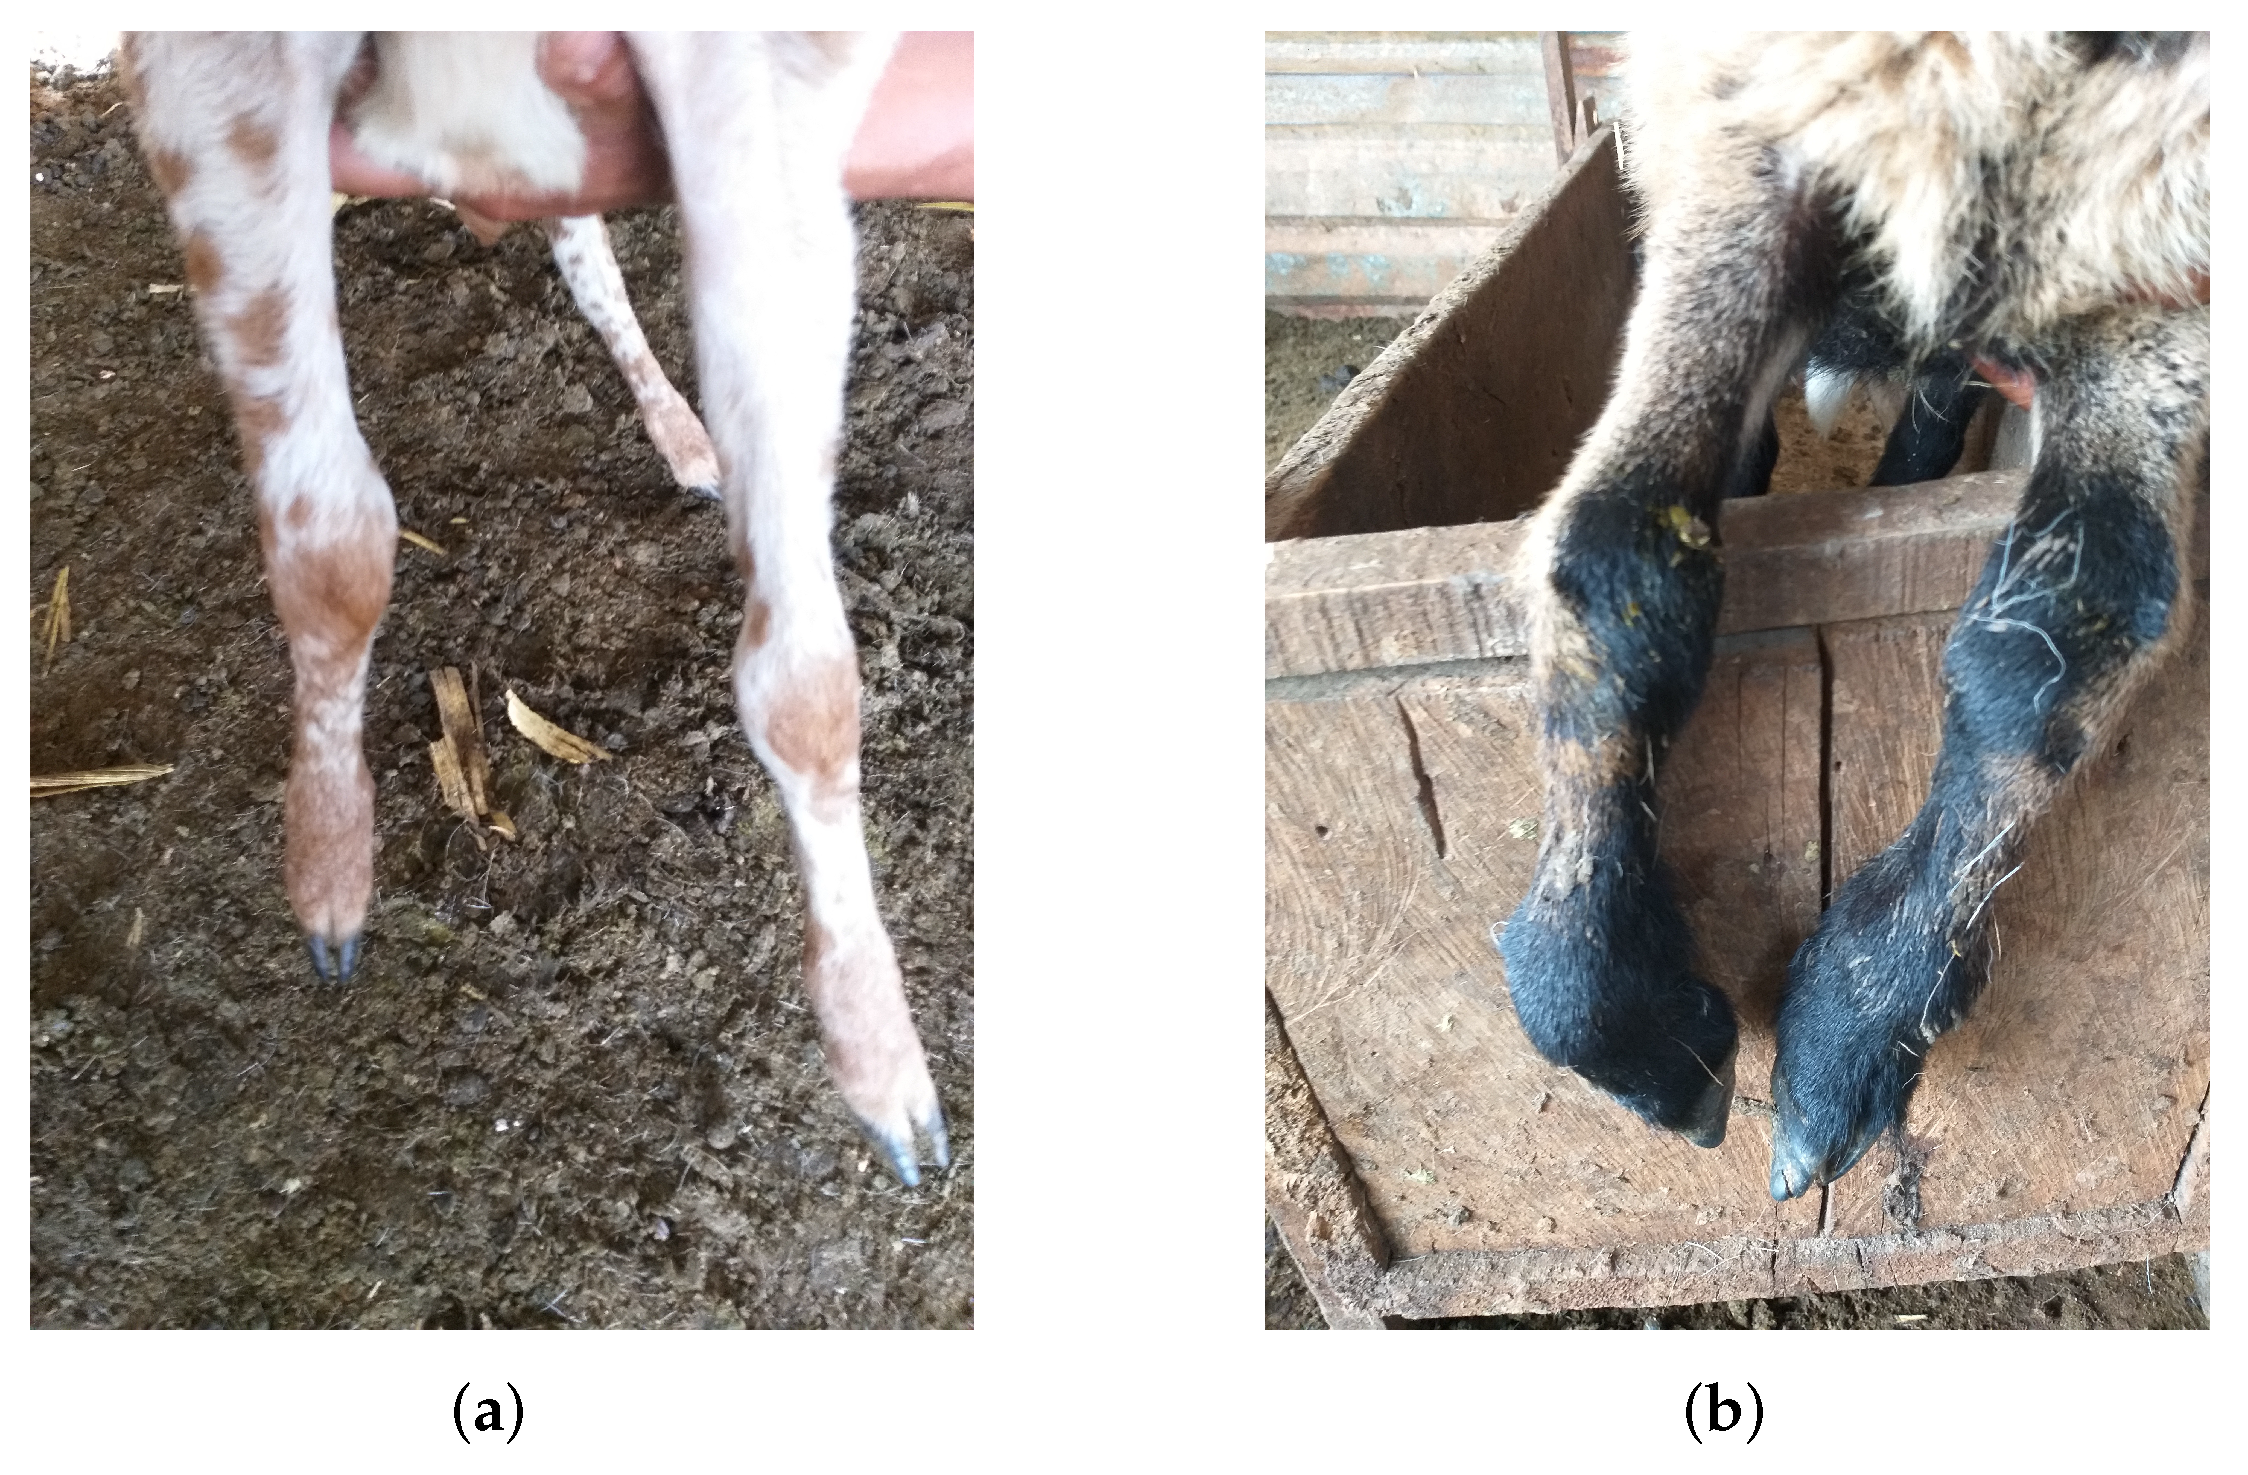
2.1.1. Animals and Test Facility

The place of the study is described in this subsection. The experiments were carried out between 1 June and 20 July 2021, in the corrals of a commercial farm in southwestern Mexico, in the municipality of San Fernando in the state of Chiapas, located at latitude 16.899140 and longitude −93.249931. The stable had feedlots and lamb breeding; the barn had feedlots and lamb farms; these pens were located within the same facilities. The perspectives of the corrals’ cameras, their lighting, and the equipment were similar. The feedlot contained a drinker located at the edge of the area and a mobile feeder. Pasture and fattening feed was the basis of the feeding of the animals. Figure 2a shows the feeder’s location in the central part of a pen.
These are were commonly called conventional or rustic for raising lambs. Small lambs range from 4 to 30 kg, and fattening lambs approximately 30 to 40 kg. Most of the lambs were entirely healthy, but there was a lamb which was born with a leg deformation. Figure 3a shows a lamb with regular legs, while Figure 3b shows the legs of a lamb with the locomotion problems of the deformed lamb in our study.

2.1.2. Spatial Distribution of the System and Video Recordings

The videos recordings have natural light in scenes. The camera implemented in this study is IMX219-160IR with 8-megapixel features (3280 × 2464 px resolution), night vision, and a 160-degree aperture lens.
The resolution of recordings from the pens used was 640 × 480, at a speed of 30 fps/s. This facilitated the processing of a large amount of information. The perspective of the cameras was in a zenith plane position or superior view, in such a way that the pens were observed entirely, trying to cover all the areas where the study objects could be and avoid their occlusion. Figure 2c shows the spatial distribution of the system. The configuration used was similar to the one reported in other research [26]. The cameras were connected wirelessly, and the images were stored locally on an SD memory card and later transferred to a computer for information processing.
For 14 days, 24 h a day, 10-min video recordings were stored. This allowed us to obtain information about the processes of fattening and raising the lambs within the pens. The videos contained samples of feeding times during dusk and at night so as to have different information in different lighting conditions.

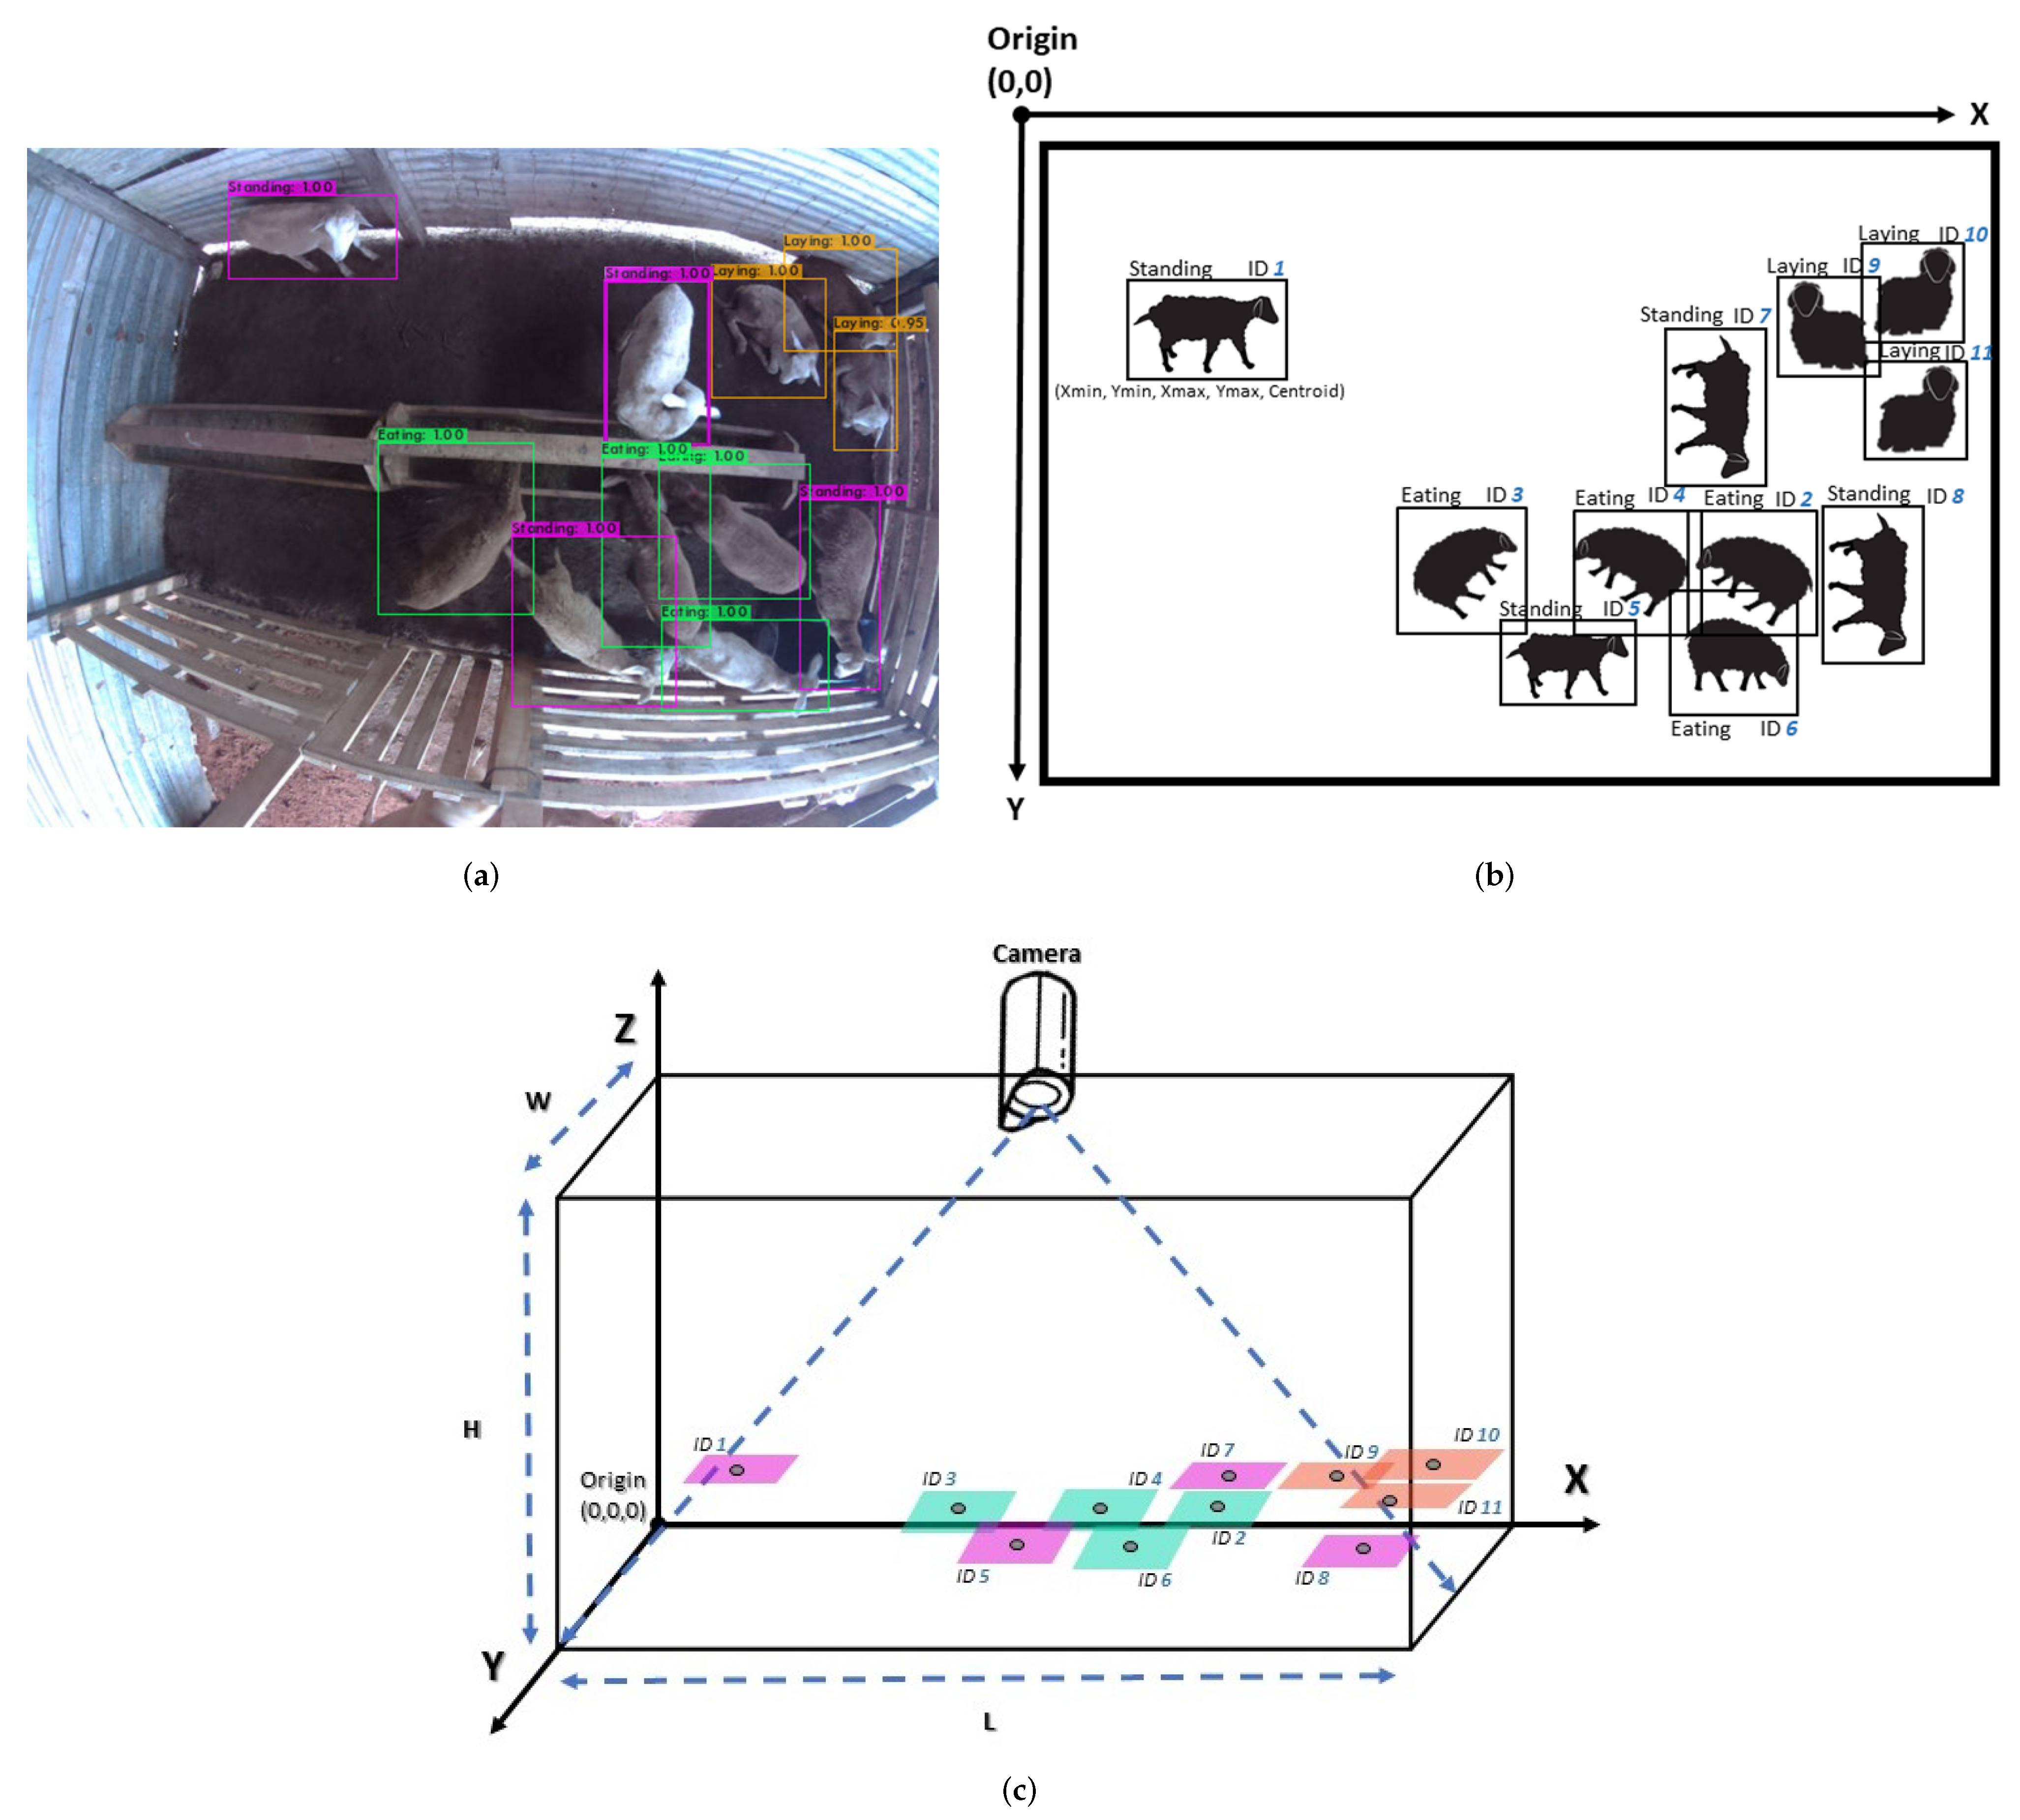
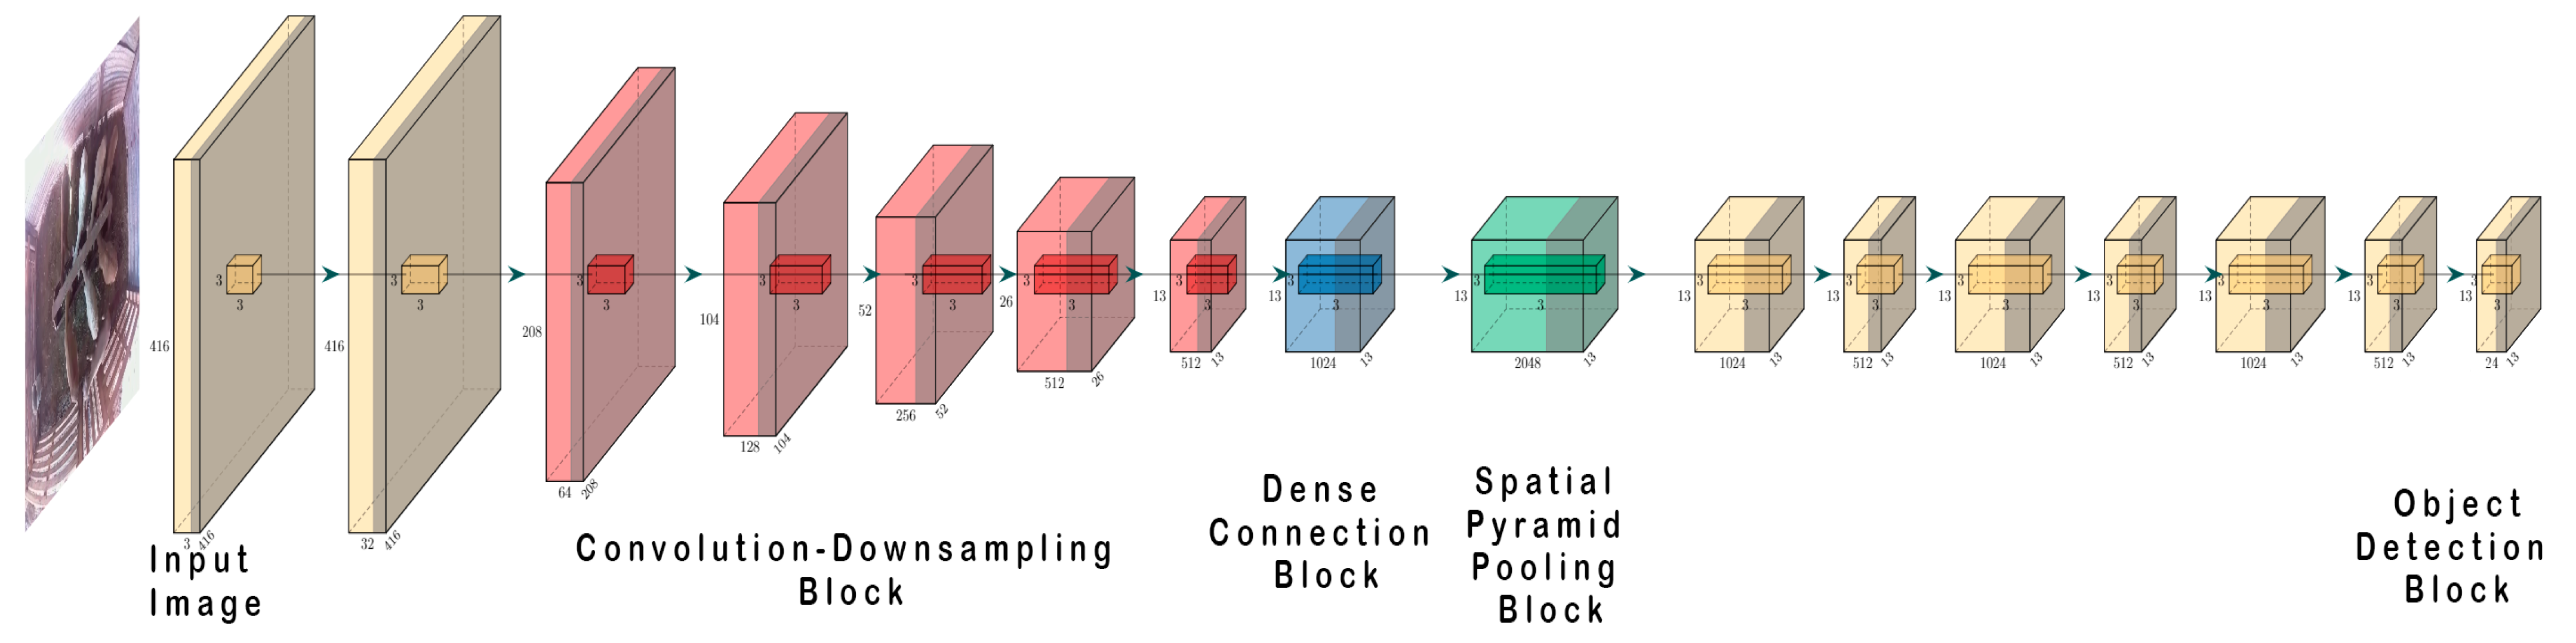
2.2. Object Detection

The object detection stage of our methodology analyzed the input videos and obtained the metrics for the behavior analysis methodology. First, the selected model and its characteristics are described. Additionally, we show how object detection was used and the characteristics of the data stream. Last but not least, the metrics generated by deep learning are shown.

2.2.1. Automatic Detection of Lambs Activities

The proposal focuses on the detection of the position and posture of a lamb as a problem of object detection. Object detection provides algorithms for locating and classifying objects in images [32].
The predefined classes were: (i) standing, (ii) eating, and (iii) laying (Figure 2a). First of all, the object detection problem required determining the positions of the bounding box. The second step was classifying the activity of the lamb in one of the defined categories; this had to be done with a high confidence score for each lamb located in the analyzed image.
In order to detect the lambs’ group activities, Faster R-CNN [33], YOLO V 3 [34], and YOLO V 4 [35] were potential candidates for implementation. In the first case, in order to ensure object detection and easy adaptation, the Faster R-CNN network set in Tensorflow was implemented. This configuration used a region proposal network and was two-stage. On the other hand, YOLO V 3 and YOLO V 4 are one-stage models that approached the object detection problem as regression (Redmon and Farhadi, 2018b). Due to easy customization of backbone layers, spatial pyramid pooling, and path aggregation networks, YOLO V 3 and YOLO V 4 provided a better experience. Additionally, Ref. [35] confirmed that YOLO V 4 tends to be the best object detector in terms of accuracy and speed of object detection. In this context, the model selected for lamb activity detection was determined based on the previous analysis, where YOLO V 4 was the best candidate.
For the selected network, three sets of data were taken into consideration: the bounding box, the class, and the precision value of the detection. The bounding box represented the lamb’s position, which was crucial because it provided information to recognize the behavior. The class represented the predefined activity displayed as laying, standing, or eating. The detection precision value was a numerical reference that indicated a confidence percentage for the detected activity. There were video samples with 6 and 8 objects in the experimental tests. Frames were used where the number of objects were equal to those initially detected due to the possible occlusion of objects in their activities. For processing, training, and testing, an Nvidia GeForce RTX 2070 8 GB (ASUS) graphics card with Intel (R) Core (TM) i7-8750H, 2.2 GHz, 16.0 GB RAM, running Python 3.7 in IDLE—Spyder 4 from Anaconda navigator, was used.
Layer customization was done for YOLO V 4 in this research. Figure 4 shows a graphical representation. The important changes were by the input and output layers of YOLO V 4 . Two convolutions defined the input layers of the model—the first being 416 × 416 × 3 and the second 416 × 416 × 32. The dense connection block and the space pyramid pooling block were without modification (default configuration). The final block of convolutions was compiled of seven convolutions, the first being 13 × 13 × 1024, the second 13 × 13 × 512, the third 13 × 13 × 1024, the fourth 13 × 13 × 512, the fifth 13 × 13 × 1024, the sixth 13 × 13 × 512, and the last output layer 13 × 13 × 24.

2.2.2. Dataset and Labeling Lamb Images

The construction of the set of images was done by extracting a sample from the recorded videos. In order to make the experimental dataset more diverse and representative, select random frames during the lamb’s activities in the videos. Consequently, 844 frames were selected and labeled manually, to which data augmentation techniques were applied, thereby generating a total of 9652 frames, in which 7722 frames to train the detection models for individual lambs. The remaining 1930 frames contained 6 to 8 objects labeled in the same image with the categories of laying, standing, and eating to guarantee the assessment of the model. To do manual labeling are used LabelImg software. Lambs with postures other than “laying” or “eating” belonged to the “standing” category. In addition to the images in this research, images were included from different perspectives, either from the open field or from a side view. The dataset was published in IEEE Dataport [36]: [https://dx.doi.org/10.21227/3tyc-y227].

2.2.3. Data Augmentation

The training of CNNs requires a large number of images, applied the generation of artificial data. This technique is widely used for making more data for a dataset. In the case of this research, we quadrupled the size of the dataset. The additional training data helped the model avoid overfitting when training with few data. An increase in data helps to build more straightforward, robust, and generalizable models.
Data augmentation schemes were applied to the training set and could make the resulting model more invariant to reflection, zooming, and slight noise in pixel values. The images in our training dataset were transformed into the forms: reflection X, reflection Y, reflection XY, rotation, and blur.
Reflection X: Each image was flipped vertically. The mathematical representation of this operation is Equation (1).
x y = 1 0 0 1 * x y
Reflection Y: Each image was flipped horizontally. The mathematical representation of this operation is Equation (2).
x y = 1 0 0 1 * x y
Reflection XY: Each image was flipped vertically and horizontally. The mathematical representation of this operation is Equation (3).
x y = 1 0 0 1 * x y
Rotation: Each image changed its axis. For this rotation, the rotation matrix given in the following equation was used.
R ( θ ) = C o s θ S e n θ S e n θ C o s θ
Blur: Each pixel in the image was replaced with the median value of its neighboring pixels. The following equation represents the operation.
K = 1 9 * 1 1 1 1 1 1 1 1 1

2.2.4. Evaluation Procedures and Metrics

This subsection shows how the YOLO V 4 deep learning system evaluated model performance using the confusion matrix terminology [37] below:
  • True positive (TP).
  • False positive (FP).
  • False negative (FN).
  • True negative (TN).
In object detection, the annotation and the expected shape of a bounding box do not match completely, so an extra parameter is required to calculate the variables in question. This parameter is called intersection over union (IoU) and defines the relative α obligatory overlap of the shapes of the B p bounding boxes and the B g t truth map, as defined by [32]:
α = a r e a B p B g t a r e a B p B g t
The default value of this parameter is 0.5 [38]. Using the terminology of the confusion matrix and IoU, the following metrics were calculated [37]):
Average precision ( A P ) is a measure of an object detector’s performance related to a specific class in the object detection task. The procedure to calculate the A P was as follows:
  • Based on the confidence score, sort all detections.
  • Take detections with the highest confidence scores and match them to the ground truth until a recall r higher than the expected r level is reached.
  • Calculate precision values based on each level of recall r.
  • Interpolate the precision P i n t e r p by the maximum precision obtained for a recall level r.
This was defined by [38]:
A P i n t e r p ( r ) = m a x p ( r ) r : r r
For this study, eleven recall levels were used, r { 0 , 0.1 ; , 1 } , with a consistent step size. Finally, the A P is the arithmetic mean of the precision P i n t e r p at different levels of recall [38], as shown in Equation (8):
A P = 1 11 r 0 , 0.1 ; , 1 P i n t e r p ( r )
Furthermore, the mean average precision (mAP) (Equation (9)) is the mean of the AP values for each class object [39], and the higher the value, the better the result of detection of temperature distribution.
mAP = c = 1 C A P ( c ) C
where C is the number of detection categories. For the specific case of this study, C = 3 .

Tracking Metrics

This subsection shows the lamb behavior metrics generated by YOLO V 4 . These were frame number, detection ID, label, accuracy, bounding box data (Xmin, Ymin, Xmax, Ymax, CentroidX, CentroidY), distance traveled by object based on the previous and current frame, inference time, and date (Table 2).

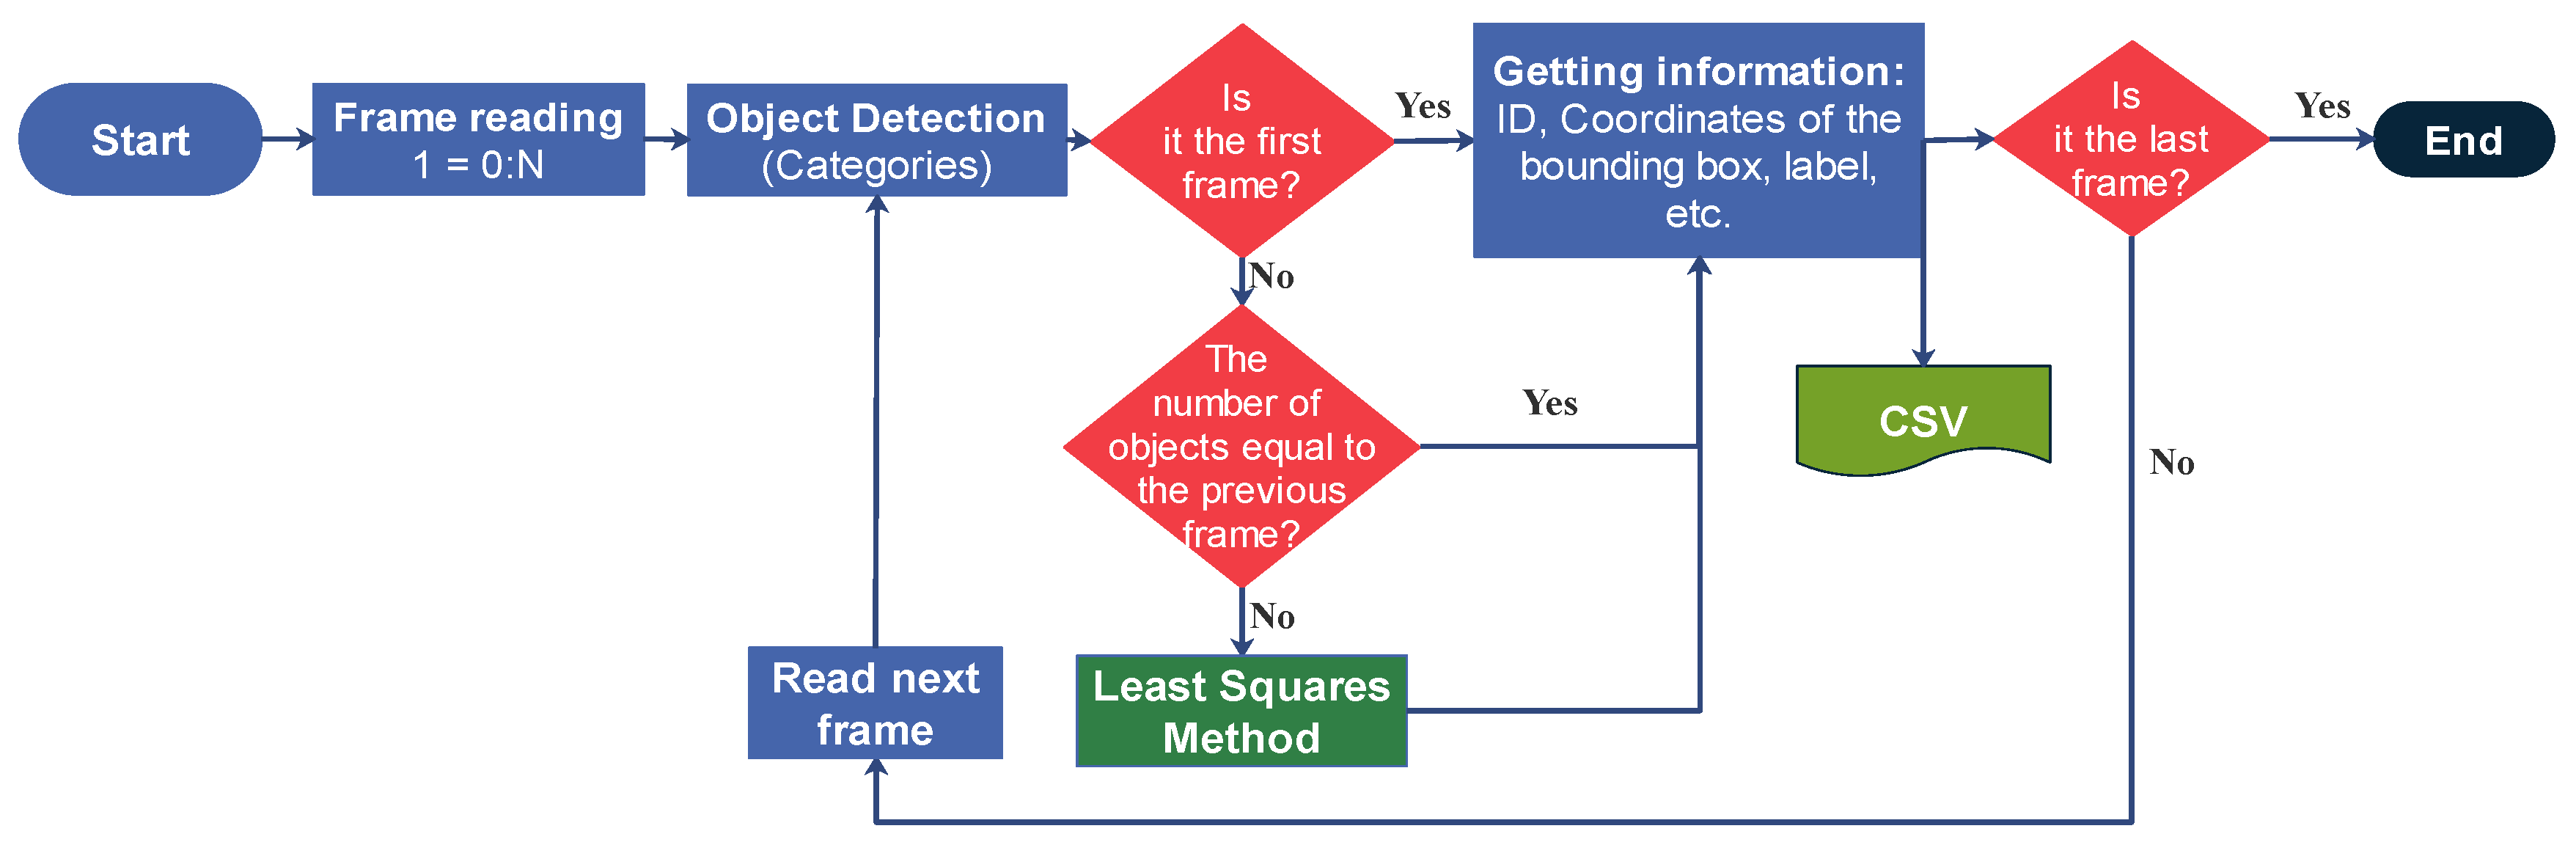
2.3. Object Tracking

In this subsection, the object tracking stage of our methodology is introduced. Tracking in the video provided the information that the predictive model needs to function. First, we describe the tracking method. Second, we describe the coordinate system of object tracking.
The algorithm developed to track objects was applied from a zenith plane to analyze the lambs for 6 min at the beginning of their feeding. The object tracking process was simple. First, read the first frame of the video. Second, the next step is to detect activities using YOLO V 4 ; these detections obtain a unique numerical ID and centroid estimated. Third, storing the information of the initial number of objects in a CSV file. Fourth, read the next frame and activities detection repeat. Fifth, the number of objects detected between the current frame and the previous one is evaluated. If the number of detected objects is equal, calculated the distance between the detected centroids in the previous and current frame, and the smaller distance values are assigned the corresponding ID of the previous frame. The results were cyclically stored in the CSV file at each iteration until the video’s final frame. Tracking was functional with different pen settings and at different times during the day. Figure 5 shows the object tracking block diagram.

Coordinate System

In the experiments, the feeder and drinker were located in the center or on the sides of the barn in the experimental pens. The lamb’s posture and YOLO directly determined the label of eating, standing, or laying. However, the neural network did not detect the same number of objects between some frames. To overcome this problem, a support system to validate the number of objects between frames was added. This system considers the numbers of objects detected in the previous frame and the current frame. Each lamb detected by YOLO is indicated by a bounding box, and based on the distance between the centroids of the bounding boxes, assigning the corresponding identification ID, as shown in Figure 2b. To measure the distance between the bounding box centroid of the current frame and that of the previous frame (Equation (10)), the centroid is calculated with the values of minimum and maximum values of X and Y (Xmin, Ymin) and (Xmax, Ymax) (Equation (11)). This represents bounding box correspondance.
Furthermore, the coordinates ( C x , C y ) in the tracking system were directly related to the resolution of the frames acquired from the video, given by C x 0 , 640 , C y 0.480 . The spatial coordinate system was taken into account when calculating the centroids of the bounding boxes to keep track of the objects.
D a b = ( x b x a ) 2 + ( y b y a ) 2
C x , y = x m i n + x m a x 2 , y m i n + y m a x 2

3. Results

This section presents the object detection experiments and the proposed predictive model. These experiments evaluated the detection of objects (Section 3.1) and the predictive model (Section 3.2). Three different datasets were evaluated. The first main function was to measure the accuracy of object detection. The second dataset was established for the assessment during implementation, and the third set of data was especially for evaluating the predictive model.

3.1. Object Detection Evaluation

The YOLO V 4 object detection network training used the previously described dataset. For the calculation of the mean precision (mAP) of the dataset, 9377 detections and 7054 unique truth values were considered. Table 3 shows the mean precision for each category in the dataset.
Recall = TP TP + FN
Precision = TP TP + FP
For a minimum threshold of 0.25, the result was a precision of 0.98 (Equation (13)), a recall of 1.00 (Equation (12)), and an F1-score of 0.99. There were, in total, 7026 true positives, 144 false positives, 28 false negatives, and a mean IoU of 85.71%. The mean precision for the dataset was 0.9985 or 99.85%, and the detection time was 20 s.

Object Detection Performance

Six videos evaluated Object detection performance. Table 4 shows the performance of the lamb activity detector. The lambs tended to remain around the feeder during feeding, except for the lamb with locomotion problems. The results showed a precision between 83.13% and 98.7% on the detection of the categories: 98.27% for the “eating” category, 95.61% for the “standing” category, and the “laying” category was the one with the lowest average precision, 75.86%.

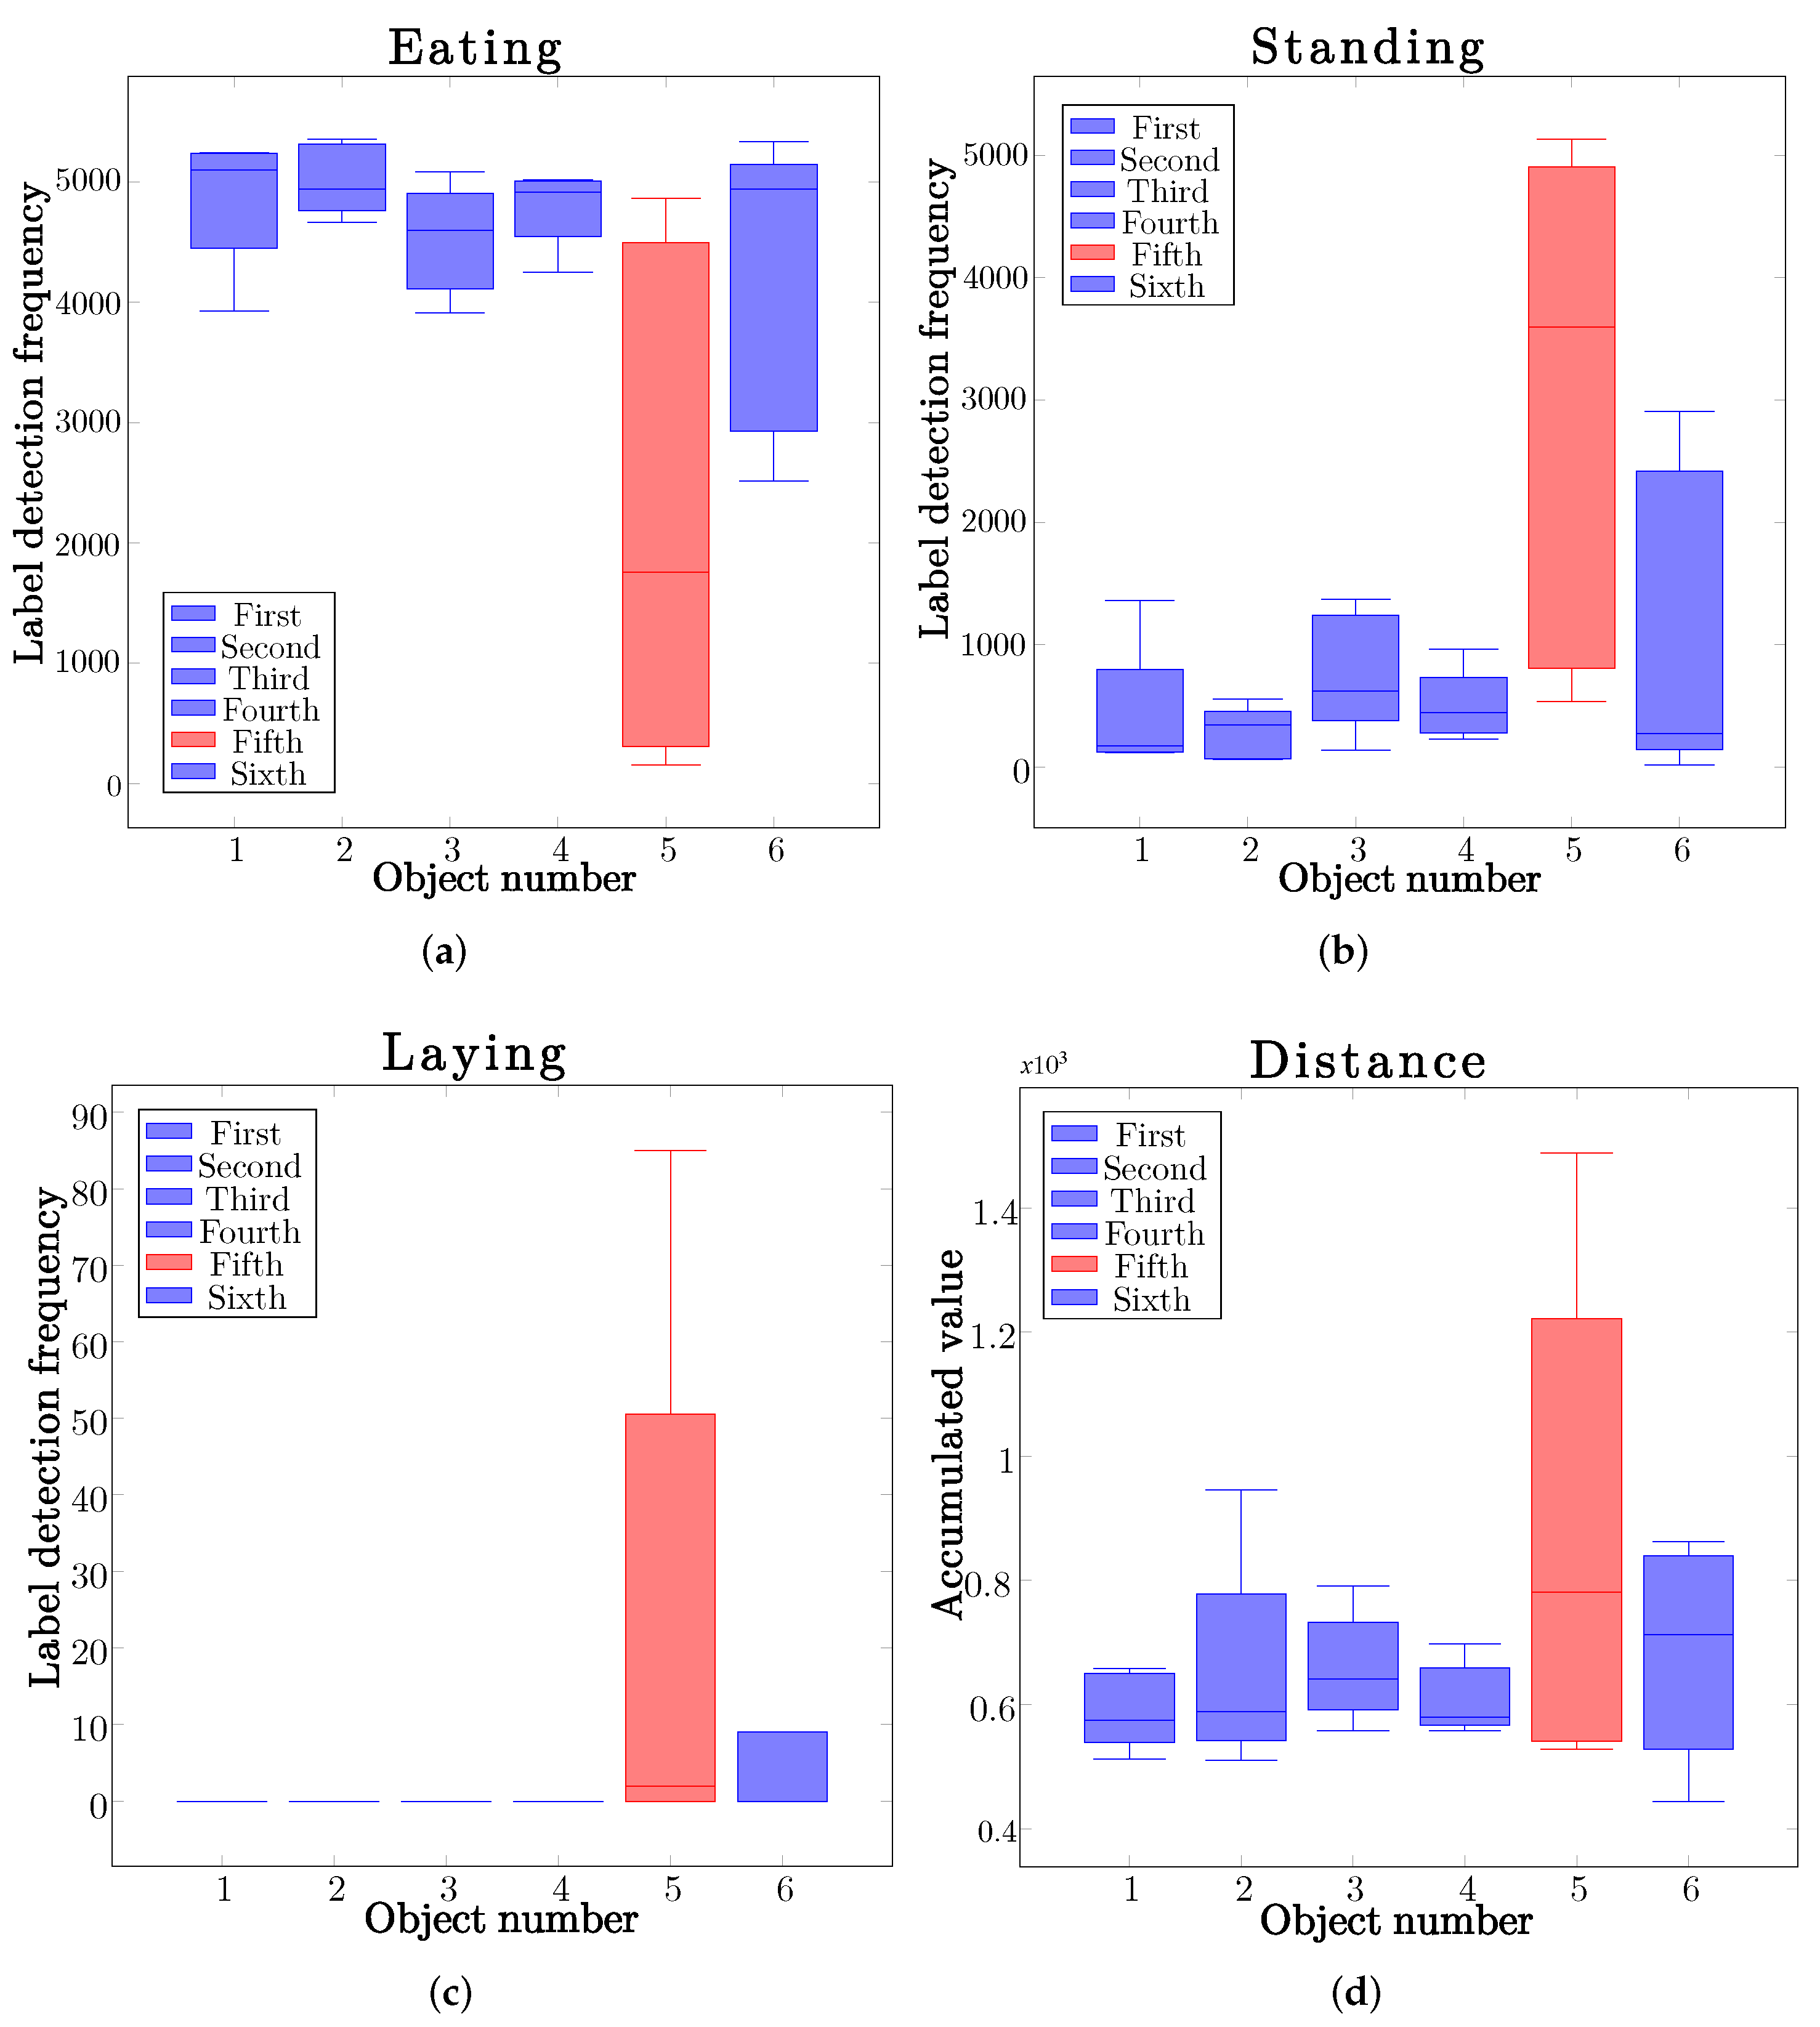
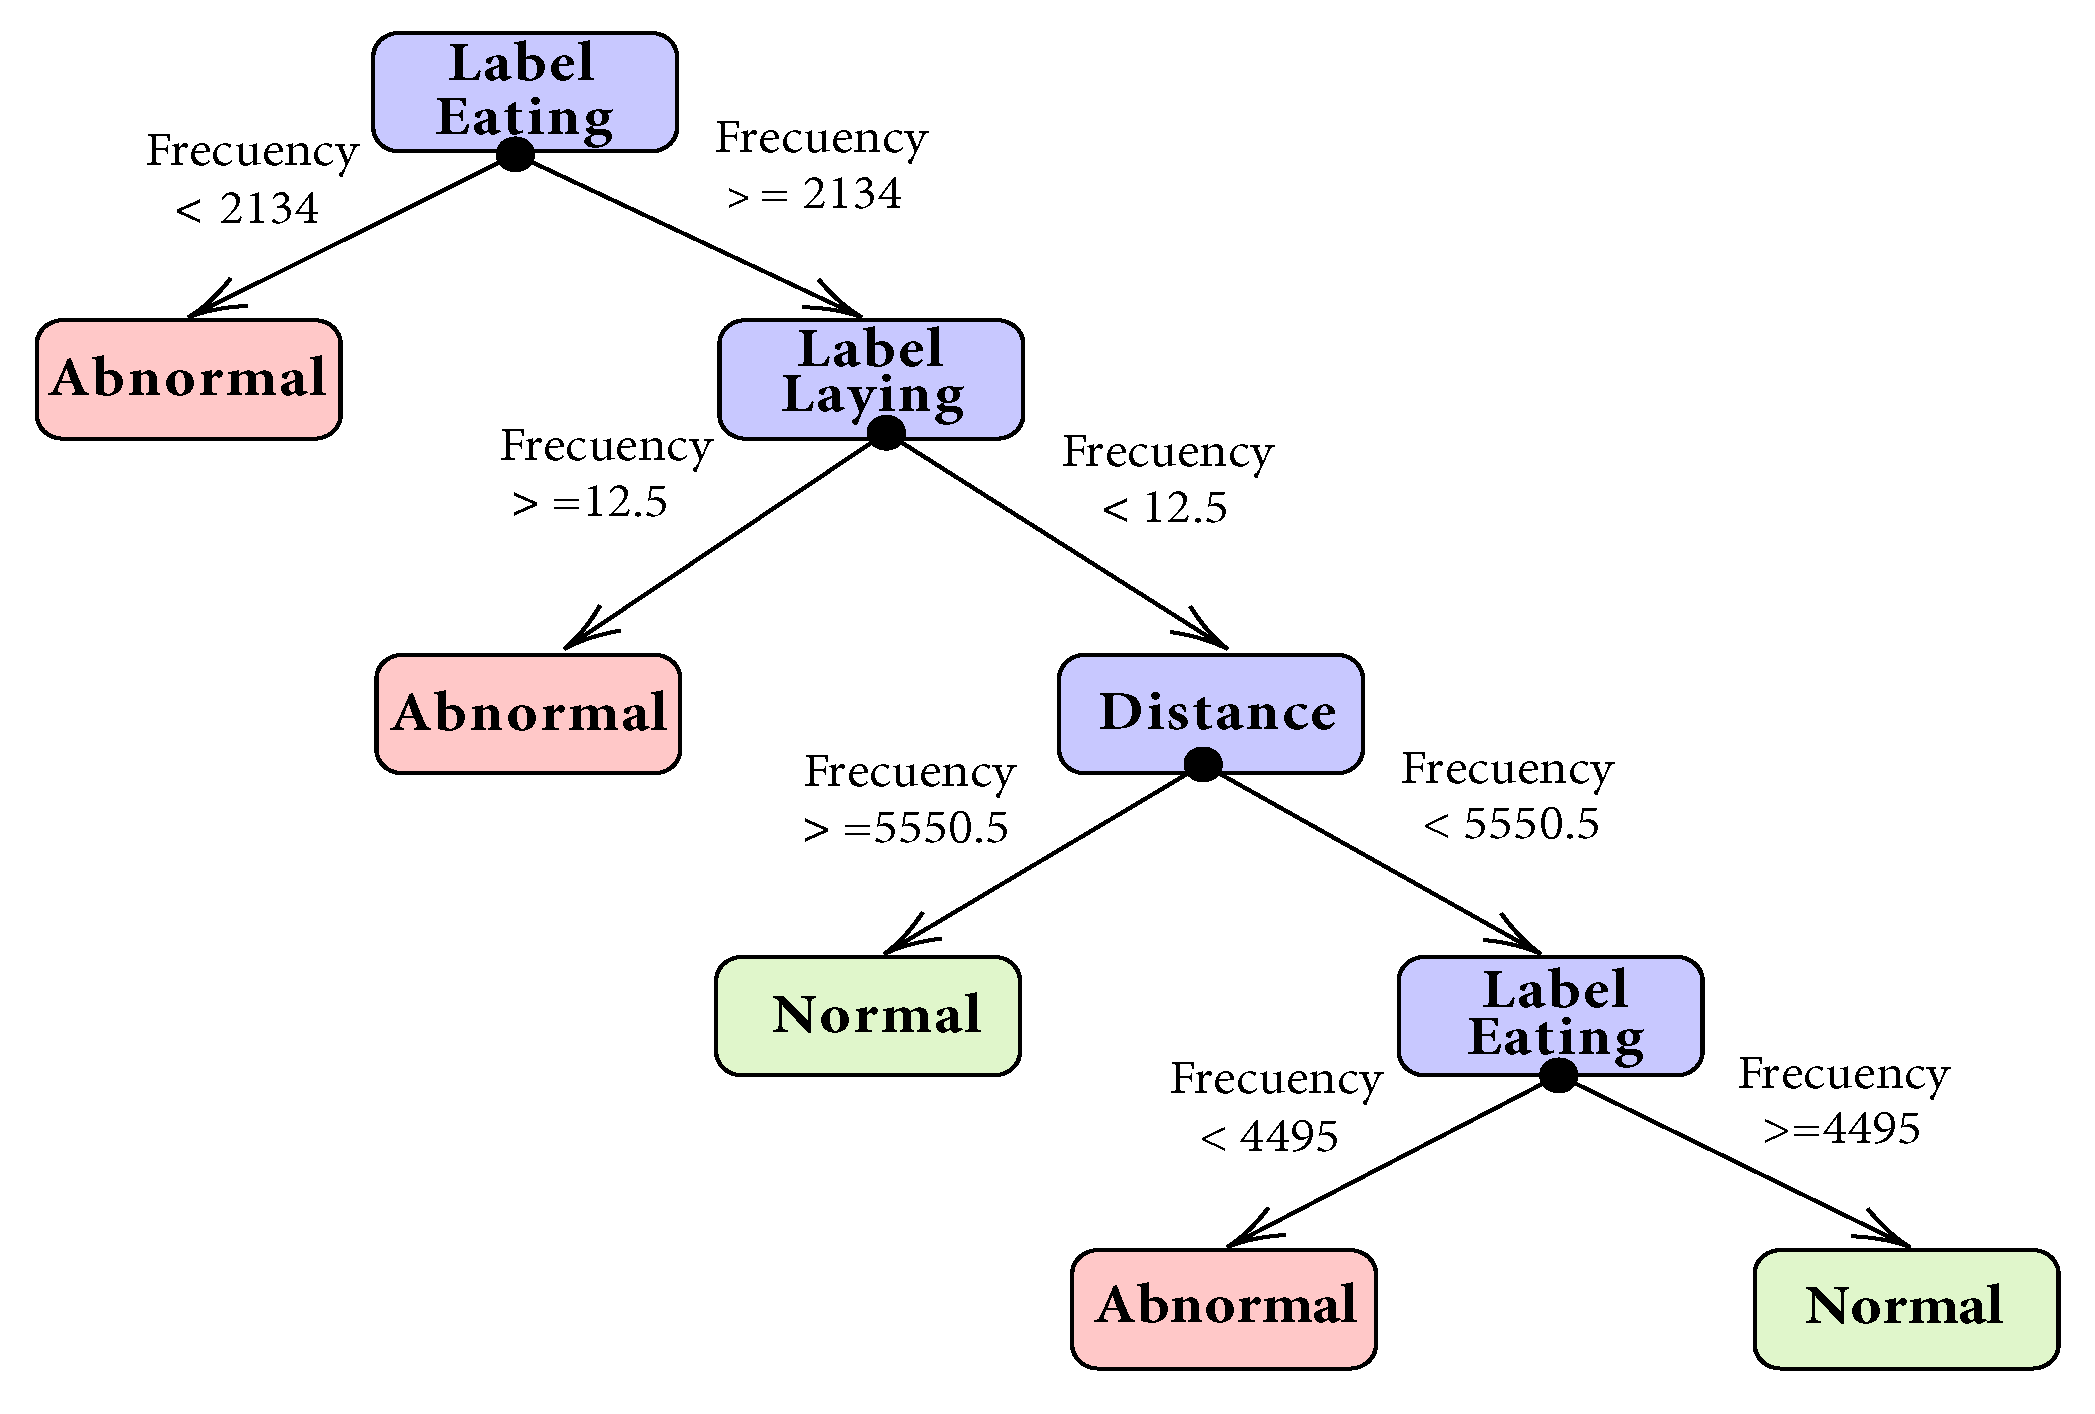
3.2. Predictive Model

In this section, the predictive model proposed to determine the lamb behavior is presented. This predictive model analyzed the information acquired in object detection and tracking, and it eventually provided an output. First, the features of a predictive model are described. Second, the collected metrics and the proposed predictive model are analyzed.
Currently, the use of machine learning algorithms is widespread. One of the goals of machine learning is to build models that make predictions based on metrics. These algorithms need a set of input data to generate a predictive model. This model was able to make predictions with new input data.
This research carried out the generation of a predictive model to determine an abnormal state in a lamb, while monitoring their behavior presented through a video during their feeding, using detection and tracking of objects.
Figure 6 shows the heat maps of lamb locations during feeding. The distribution of lamb tends to be random, denoting their concentration or permanence in the red areas that showed a greater frequency of appearance of objects, the blue areas are those that have a low frequency of appearance, denoting that the lamb have not remained static during their feeding and tend to change positions.

Label Detection Frequency and Cumulative Distance

Figure 7 shows the frequency of appearance and the accumulated frequency during the detection and tracking of activities. Box plots were used to achieve this result. Object 5, shown in red in the graphics, represents the lamb with locomotion problems, as shown in Figure 3b. Even though most lambs have a general tendency, object 5 stood out. Oddly, this lamb with a locomotion problems generally exhibited mostly standing activity during the meal or a greater distance covered. The results of the analysis obtained by the metrics shown in the box diagrams and the heat maps were used to generate a decision tree with WEKA. Figure 8 shows the decision tree. This decision tree delimited normal behavior and abnormal behavior. The decision tree obtained a precision percentage of 100% based on the sample videos generated for its construction.
The performance of the predictive model was measured using 17 videos. These videos were recorded on different dates and with random animals. Additionally, these videos were also different from the previously mentioned datasets. The results obtained are shown in Table 5. The general mean precision obtained was 83.52%.

3.3. Output

Figure 9 shows the output of the tracking and behavior analysis, where each of the multiple categories are visible in a single image. Object detection worked independently of the proximity of the objects, as long as there was no total occlusion of the objects. After analyzing the videos, all metrics were saved in a CSV file; this was processed and sent to the method that contained the constructed predictive model. This method evaluated the accumulated metrics. Figure 8 represents the decision tree generated. The output of the predictive model was an image where bounding boxes marked the analyzed objects. Moreover, they were assigned the color blue to denote that the lamb presented normal behavior and red to denote that the lamb showed abnormal behavior.

4. Discussion

This research evaluated deep learning for automatic activity detection and lamb tracking in images with a top view and a fisheye lens. Several works approached this problem from a superior or top view perspective [13,28,29]. The deep learning system proposed in this work contributed by detecting activities with a CNN and tracking in the same system in different barn configurations. The mAP was 98% for lamb activities. Similar works detected behaviors presented in pigs from a superior view [29,40]. These researches had mAPs of 87% and 80% in similar camera conditions. Other studies implemented the detection of diseases in animals with very different experimental conditions from this one. One study [17] aimed to determine a locomotion disorder based solely on the behavioral analysis presented on video. The YOLO V 4 model used for the detection of activities had a custom setting. This work proposes determining a locomotion disorder based solely on the behavioral analysis presented on video. Finally, for activities detection, the results indicate that the categories of “Eating” can be detected with greater precision, with 98.27%, with 95.61% for the activity of “Standing”, and with the lowest average precision being the category of “Laying” with 75.8687%. The developed predictive model had a precision of 83.52%, with a correlation coefficient of 0.58, with only the metrics considered, additionally contributing to the present work. Table 6 shows a comparison of the most recent works and the proposed methodology.

Limitations

This research had limitations. First, future research should compare the performances of different current deep learning systems, not only those commonly mentioned but Faster R-CNN and YOLO V 3 as well. However, by making the dataset used in this work public, other researchers can use it for training and validation, facilitating experimentation, and replicating the experiments to improve performance. Second, we have not found works related to detecting lamb activities or detecting locomotion problems in lambs. The developed model detected and tracked multiple objects; other research did not address this. This work focused on creating an intelligent system that detected and registered activities—based on this, it also estimated health, obtaining good results in the activity detection task with a mAP of 98%. Third, the selection of videos of beginning feeding was motivated by the fact that lambs showed different behavior. The results displayed were not considered as a 24 h estimate. Fourth, in a generic pen of regional producers implementation the detection of lamb activities. In these conditions, we record videos in 14 days. Therefore, it is a reliable estimate concerning other preview works, which is adaptable. Additionally, the analysis showed that it was possible to apply these deep learning techniques to studying behavior and detecting diseases.

5. Conclusions

In any animal production setting, it is essential to assess the level of animal welfare during the daily behavior shown in a barn. This work proposed an approach for automatic recognition of the abnormal behavior of lambs during group feeding under confined conditions, based on the YOLO V 4 model applied to videos from a top view, an object tracking algorithm, and a behavior classifier based on a decision tree. These algorithms were developed and used to automatically analyze the behaviors presented by a lamb with locomotion problems. The results suggested that at the beginning of the feeding time, that lamb moved more than others, ate less, or was inactive. The detection of activities carried out by YOLO V 4 obtained precision, recovery, and F1 scores higher than 92%. Furthermore, the predictive model was found the lamb to have abnormal behavior during group feeding. Therefore, the proposed methodology has the potential to offer reference information on the analysis of the health and welfare conditions of cattle. Future research should explore more sophisticated lamb detection, tracking, and predictive models to achieve real-time operation.
Furthermore, the predictive model was found the lamb to have abnormal behavior during group feeding.

Author Contributions

Conceptualization, Y.G.-B., M.P.-P. and J.L.C.-A.; data curation, and J.A.F.-M.; formal analysis, H.D.V.-D. and E.N.E.-G.; investigation, O.M.R.-E.; methodology, J.A.F.-M. and J.L.C.-A.; software, Y.G.-B.; supervision, M.P.-P.; validation, Y.G.-B. and E.N.E.-G.; visualization, J.A.G.-R.; writing—original draft preparation, Y.G.-B., J.A.F.-M. and J.A.G.-R. All authors have read and agreed to the published version of the manuscript.

Funding

This research received no external funding.

Institutional Review Board Statement

All the animals used in this study were under the supervision of a veterinarian. Lamb care and everything related to the workplace complied with the Mexican standards [41,42]. The experimental protocol was approved by the Biological Sciences Commission (Document number: DI: 435/2020) of the National Technological Institute of Mexico, Tuxtla Gutiérrez Campus, in Chiapas, Mexico.

Informed Consent Statement

Not applicable.

Data Availability Statement

Data are available on request.

Acknowledgments

I would like to express my great appreciation and gratitude to Tecnológico Nacional de México/I.T Tuxtla Gutiérrez and the Consejo Nacional de Ciencia y Tecnología (CONACYT) for their assistance in providing me with the resources I needed to run and do this research.

Conflicts of Interest

The authors declare no conflict of interest. The funders had no role in the design of the study; in the collection, analyses, or interpretation of data; in the writing of the manuscript, or in the decision to publish the results.

Abbreviations

The following abbreviations are used in this manuscript:
APAverage precision
BBBounding box
CNNConvolutional neural networks
FNFalse negative
IoUIntersection over union
mAPmean average precision
TP  True positive
YOLO  You only look once

References

  1. Poursaberi, A.; Bahr, C.; Pluk, A.; Van Nuffel, A.; Berckmans, D. Real-time automatic lameness detection based on back posture extraction in dairy cattle: Shape analysis of cow with image processing techniques. Comput. Electron. Agric. 2010, 74, 110–119. [Google Scholar] [CrossRef]
  2. Nasiri, A.; Yoder, J.; Zhao, Y.; Hawkins, S.; Prado, M.; Gan, H. Pose estimation-based lameness recognition in broiler using CNN-LSTM network. Comput. Electron. Agric. 2022, 197, 106931. [Google Scholar] [CrossRef]
  3. Nasirahmadi, A.; Hensel, O.; Edwards, S.A.; Sturm, B. A new approach for categorizing pig lying behaviour based on a Delaunay triangulation method. Animal 2017, 11, 131–139. [Google Scholar] [CrossRef] [Green Version]
  4. Menchetti, L.; Nanni Costa, L.; Zappaterra, M.; Padalino, B. Effects of Reduced Space Allowance and Heat Stress on Behavior and Eye Temperature in Unweaned Lambs: A Pilot Study. Animals 2021, 11, 3464. [Google Scholar] [CrossRef] [PubMed]
  5. Jiang, M.; Rao, Y.; Zhang, J.; Shen, Y. Automatic behavior recognition of group-housed goats using deep learning. Comput. Electron. Agric. 2020, 177, 105706. [Google Scholar] [CrossRef]
  6. Massari, J.M.; de Moura, D.J.; de Alencar Nääs, I.; Pereira, D.F.; Branco, T. Computer-Vision-Based Indexes for Analyzing Broiler Response to Rearing Environment: A Proof of Concept. Animals 2022, 12, 846. [Google Scholar] [CrossRef]
  7. Adrion, F.; Kapun, A.; Eckert, F.; Holland, E.M.; Staiger, M.; Götz, S.; Gallmann, E. Monitoring trough visits of growing-finishing pigs with UHF-RFID. Comput. Electron. Agric. 2018, 144, 144–153. [Google Scholar] [CrossRef]
  8. Wang, G.; Muhammad, A.; Liu, C.; Du, L.; Li, D. Automatic Recognition of Fish Behavior with a Fusion of RGB and Optical Flow Data Based on Deep Learning. Animals 2021, 11, 2774. [Google Scholar] [CrossRef]
  9. Condotta, I.C.; Brown-Brandl, T.M.; Silva-Miranda, K.O.; Stinn, J.P. Evaluation of a depth sensor for mass estimation of growing and finishing pigs. Biosyst. Eng. 2018, 173, 11–18. [Google Scholar] [CrossRef]
  10. Pezzuolo, A.; Guarino, M.; Sartori, L.; González, L.A.; Marinello, F. On-barn pig weight estimation based on body measurements by a Kinect v1 depth camera. Comput. Electron. Agric. 2018, 148, 29–36. [Google Scholar] [CrossRef]
  11. Schütz, A.K.; Krause, E.T.; Fischer, M.; Müller, T.; Freuling, C.M.; Conraths, F.J.; Homeier-Bachmann, T.; Lentz, H.H. Computer Vision for Detection of Body Posture and Behavior of Red Foxes. Animals 2022, 12, 233. [Google Scholar] [CrossRef] [PubMed]
  12. Lee, Y.D.; Lee, H.; Yoon, E.; Park, C.; Osborg, E.S.; Løvall, K. A Comparative Assessment of Mid-Water Trawl and Deep Vision for Investigating Fishery Resources in the Coastal Waters off Jeju Island, Korea. Appl. Sci. 2022, 12, 1835. [Google Scholar] [CrossRef]
  13. Nasirahmadi, A.; Richter, U.; Hensel, O.; Edwards, S.; Sturm, B. Using machine vision for investigation of changes in pig group lying patterns. Comput. Electron. Agric. 2015, 119, 184–190. [Google Scholar] [CrossRef] [Green Version]
  14. Khojastehkey, M.; Aslaminejad, A.A.; Shariati, M.M.; Dianat, R. Body size estimation of new born lambs using image processing and its effect on the genetic gain of a simulated population. J. Appl. Anim. Res. 2016, 44, 326–330. [Google Scholar] [CrossRef] [Green Version]
  15. Burghardt, T.; Calic, J. Analysing animal behaviour in wildlife videos using face detection and tracking. IEE Proc.-Vis. Image Signal Process. 2006, 153, 305–312. [Google Scholar] [CrossRef] [Green Version]
  16. Stern, U.; He, R.; Yang, C.H. Analyzing animal behavior via classifying each video frame using convolutional neural networks. Sci. Rep. 2015, 5, 1–13. [Google Scholar]
  17. Zhao, K.; Bewley, J.; He, D.; Jin, X. Automatic lameness detection in dairy cattle based on leg swing analysis with an image processing technique. Comput. Electron. Agric. 2018, 148, 226–236. [Google Scholar] [CrossRef]
  18. Kang, X.; Zhang, X.; Liu, G. Accurate detection of lameness in dairy cattle with computer vision: A new and individualized detection strategy based on the analysis of the supporting phase. J. Dairy Sci. 2020, 103, 10628–10638. [Google Scholar] [CrossRef]
  19. Noor, A.; Zhao, Y.; Koubaa, A.; Wu, L.; Khan, R.; Abdalla, F.Y. Automated sheep facial expression classification using deep transfer learning. Comput. Electron. Agric. 2020, 175, 105528. [Google Scholar] [CrossRef]
  20. Guo, Y.; He, D.; Chai, L. A machine vision-based method for monitoring scene-interactive behaviors of dairy calf. Animals 2020, 10, 190. [Google Scholar] [CrossRef] [Green Version]
  21. Jung, D.H.; Kim, N.Y.; Moon, S.H.; Jhin, C.; Kim, H.J.; Yang, J.S.; Kim, H.S.; Lee, T.S.; Lee, J.Y.; Park, S.H. Deep learning-based cattle vocal classification model and real-time livestock monitoring system with noise filtering. Animals 2021, 11, 357. [Google Scholar] [CrossRef] [PubMed]
  22. Zhang, K.; Li, D.; Huang, J.; Chen, Y. Automated video behavior recognition of pigs using two-stream convolutional networks. Sensors 2020, 20, 1085. [Google Scholar] [CrossRef] [PubMed] [Green Version]
  23. Brünger, J.; Traulsen, I.; Koch, R. Model-based detection of pigs in images under sub-optimal conditions. Comput. Electron. Agric. 2018, 152, 59–63. [Google Scholar] [CrossRef]
  24. D’Eath, R.B.; Jack, M.; Futro, A.; Talbot, D.; Zhu, Q.; Barclay, D.; Baxter, E.M. Automatic early warning of tail biting in pigs: 3D cameras can detect lowered tail posture before an outbreak. PLoS ONE 2018, 13, e0194524. [Google Scholar] [CrossRef] [Green Version]
  25. Fogarty, E.S.; Swain, D.L.; Cronin, G.M.; Moraes, L.E.; Bailey, D.W.; Trotter, M.G. Potential for autonomous detection of lambing using global navigation satellite system technology. Anim. Prod. Sci. 2020, 60, 1217–1226. [Google Scholar] [CrossRef]
  26. Viazzi, S.; Ismayilova, G.; Oczak, M.; Sonoda, L.T.; Fels, M.; Guarino, M.; Vranken, E.; Hartung, J.; Bahr, C.; Berckmans, D. Image feature extraction for classification of aggressive interactions among pigs. Comput. Electron. Agric. 2014, 104, 57–62. [Google Scholar] [CrossRef]
  27. Tassinari, P.; Bovo, M.; Benni, S.; Franzoni, S.; Poggi, M.; Mammi, L.M.E.; Mattoccia, S.; Di Stefano, L.; Bonora, F.; Barbaresi, A.; et al. A computer vision approach based on deep learning for the detection of dairy cows in free stall barn. Comput. Electron. Agric. 2021, 182, 106030. [Google Scholar] [CrossRef]
  28. Li, G.; Hui, X.; Chen, Z.; Chesser, G.D., Jr.; Zhao, Y. Development and evaluation of a method to detect broilers continuously walking around feeder as an indication of restricted feeding behaviors. Comput. Electron. Agric. 2021, 181, 105982. [Google Scholar] [CrossRef]
  29. Riekert, M.; Klein, A.; Adrion, F.; Hoffmann, C.; Gallmann, E. Automatically detecting pig position and posture by 2D camera imaging and deep learning. Comput. Electron. Agric. 2020, 174, 105391. [Google Scholar] [CrossRef]
  30. Fuentes, S.; Viejo, C.G.; Chauhan, S.S.; Joy, A.; Tongson, E.; Dunshea, F.R. Computer Vision Algorithms and Machine Learning Modeling Using Integrated Visible/Infrared Thermal Cameras. Sensors 2020, 20, 6334. [Google Scholar] [CrossRef]
  31. Bhujel, A.; Arulmozhi, E.; Moon, B.E.; Kim, H.T. Deep-Learning-Based Automatic Monitoring of Pigs’ Physico-Temporal Activities at Different Greenhouse Gas Concentrations. Animals 2021, 11, 3089. [Google Scholar] [CrossRef] [PubMed]
  32. Everingham, M.; Eslami, S.M.A.; Van Gool, L.; Williams, C.K.I.; Winn, J.; Zisserman, A. The Pascal Visual Object Classes Challenge: A Retrospective. Int. J. Comput. Vis. 2015, 111, 98–136. [Google Scholar] [CrossRef]
  33. Ren, S.; He, K.; Girshick, R.; Sun, J. Faster R-CNN: Towards real-time object detection with region proposal networks. IEEE Trans. Pattern Anal. Mach. Intell. 2016, 39, 1137–1149. [Google Scholar] [CrossRef] [PubMed] [Green Version]
  34. Redmon, J.; Farhadi, A. YOLOv3: An incremental improvement. arXiv 2018, arXiv:1804.02767. [Google Scholar]
  35. Bochkovskiy, A.; Wang, C.Y.; Liao, H.Y.M. Yolov4: Optimal speed and accuracy of object detection. arXiv 2020, arXiv:2004.10934. [Google Scholar]
  36. González-Baldizón, Y.; Pérez-Patricio, M.; Magadán, A.; Morales-Reyes, A.; Escobar-Gómez, E.N.; Rodríguez-Elías, O.M.; Vázquez-Delgado, H.D.; Fragoso-Mandujano, A. Recognition of Common Postures in Lambs (ICV-TxLamb); IEEE: Piscataway Township, NJ, USA, 2020. [Google Scholar] [CrossRef]
  37. Manning, C.; Schutze, H. Foundations of Statistical Natural Language Processing; MIT Press: Cambridge, MA, USA, 1999. [Google Scholar]
  38. Everingham, M.; Van Gool, L.; Williams, C.K.; Winn, J.; Zisserman, A. The pascal visual object classes (voc) challenge. Int. J. Comput. Vis. 2010, 88, 303–338. [Google Scholar] [CrossRef] [Green Version]
  39. Wu, D.; Lv, S.; Jiang, M.; Song, H. Using channel pruning-based YOLO v4 deep learning algorithm for the real-time and accurate detection of apple flowers in natural environments. Comput. Electron. Agric. 2020, 178, 105742. [Google Scholar] [CrossRef]
  40. Zheng, C.; Zhu, X.; Yang, X.; Wang, L.; Tu, S.; Xue, Y. Automatic recognition of lactating sow postures from depth images by deep learning detector. Comput. Electron. Agric. 2018, 147, 51–63. [Google Scholar] [CrossRef]
  41. NOM-001-SAG/GAN-2015; NORMA Oficial Mexicana NOM-001-SAG/GAN-2015. Sistema Nacional de Identificación Animal para Bovinos y Colmenas: Mexico City, Mexico, 2015.
  42. NOM-042-ZOO-1995; NORMA Oficial Mexicana NOM-042-ZOO-1995. Características y Especificaciones Zoosanitarias Para Las Instalaciones, Equipo y Operación de Unidades de Regularización Zoosanitaria Para Ganado Bovino, Equino, Ovino y Caprino: Mexico City, Mexico, 1995.
Figure 1. A diagram of the proposed methodology.
Applsci 12 04712 g001
Figure 2. General distribution of the system for lamb detection. (a) Real scenario. (b) Plane coordinate system. (c) Distribution spatial system.
Applsci 12 04712 g002
Figure 3. Lamb legs comparison. (a) Lamb with normal legs. (b) Lamb with deformed legs.
Applsci 12 04712 g003
Figure 4. Custom YOLO V 4 network structure.
Applsci 12 04712 g004
Figure 5. Object tracking block diagram.
Applsci 12 04712 g005
Figure 6. Heat maps samples of lambs location: (a) Barn 1—central distribution. (b) Barn 1—lateral distribution. (c) Barn 2—central distribution.
Applsci 12 04712 g006
Figure 7. Label appearance frequency and cumulative object tracking. (a) Eating detection frequency. (b) Standing detection frequency. (c) Laying detection frequency. (d) Accummulated value for distance.
Applsci 12 04712 g007
Figure 8. Decision tree generated.
Applsci 12 04712 g008
Figure 9. Examples of object detections and the behavior analysis output.
Applsci 12 04712 g009
Table 1. Related works comparison.
YearModelPrecision
2022 [11]YOLO V 4 99.91%
2021 [27]YOLO V 3 66.00%
2021 [28]Faster R-CNN93%
2020 [5]YOLO V 4 97.49%
2020 [29]Faster R-CNN80.20%
Table 2. Sample of metrics stored in object detection.
FPSIDLabelPrecisionXminYminXmaxYmaxCentroidXCentroidYDistanceTime InferenceDate
23Standing0.9997343417532816492257374190.793993478 March 2021 08:46
21Eating0.99960161768412312123714400.793993478 March 2021 08:46
24Eating0.99948317285719314833114510.793993478 March 2021 08:46
22Eating0.9991964711819912710918125310.793993478 March 2021 08:46
25Laying0.9989079222621811212428228010.793993478 March 2021 08:46
27Eating0.98845434385646717041814900.793993478 March 2021 08:46
26Eating0.980772553322239117537731010.793993478 March 2021 08:46
28Eating0.913831411149512210517514730.793993478 March 2021 08:46
31Eating0.999600291768412312123714400.823214778 March 2021 08:46
33Standing0.9995762118332616093263372250.823214778 March 2021 08:46
Table 3. Training results.
ClassAverage Precision (AP)True Positive (TP)False Positive (FP)
Standing99.81%1850110
Laying99.79%103332
Eating99.95%414335
Table 4. Testing object detector.
Total FramesPrecision EatingPrecision StandingPrecision LayingGeneral Precision
Video 1541096.783589.818862.816683.139
Video 2540299.463897.9638n/a98.713
Video 3541895.34394.427981.169490.313
Video 4539799.700997.665285.094894.153
Video 5544799.195997.136674.394090.242
Video 6541999.133796.6490n/a97.891
Table 5. Predictive model results.
Total
Objects
True
Positives
False
Positives
True
Negatives
False
Negatives
General
Precision
Video_144000100
Video_243010100
Video_321010100
Video_421010100
Video_510010100
Video_632010100
Video_744000100
Video_810010100
Video_932010100
Video_1032010100
Video_1132010100
Video_1232010100
Video_133101166.66
Video_143001233.33
Video_155301180
Video_16500050
Video_175200340
Table 6. Comparison with related work.
ModelObjectsDatasetPrecisionCategoriesTrackingAnalisis
YOLO V 4 Red foxes [11]891399.91%Sitting, Lying,
Standing
NoIndividual
YOLO V 4 Lambs (Proposed)965299.85%Standing, Lying,
Eating
YesGroup
YOLO V 4 Goats [5]120097.49%Drinking, Eating,
Inactive, Active
YesGroup
Faster R-CNNBroilers [29]904093%Feeder, Eating bird,
Bird around feeder
YesGroup
Faster R-CNNPigs [29]727780.20%Pig, Pig lying,
Pig not lying
NoGroup
YOLO V 3 Dairy cows [27]11,75466.00%Xleft, Xright, Vleft, Vright,
Oleft, Cright, Ileft, Iright
NoGroup
Publisher’s Note: MDPI stays neutral with regard to jurisdictional claims in published maps and institutional affiliations.

