Article

Research on the Evacuation Characteristics of Cruise Ship Passengers in Multi-Scenarios

Green and Smart River-Sea-Going Ship, Cruise Ship and Yacht Research Center, Wuhan University of Technology, Wuhan 430063, China
*
Author to whom correspondence should be addressed.
Appl. Sci. 2022, 12(9), 4213; https://doi.org/10.3390/app12094213
Submission received: 12 March 2022 / Revised: 13 April 2022 / Accepted: 20 April 2022 / Published: 21 April 2022
(This article belongs to the Special Issue Maritime Transportation System and Traffic Engineering)

Abstract

:
As a popular way of travelling on water, cruise tourism is welcomed by the public. The cruise ship, as a large water-borne city, can accommodate a large number of passengers, but simultaneously their safety should be ensured in the event of an emergency. This work studied the evacuation characteristics of passengers by analyzing evacuation processes in multiple scenarios on cruise ships. Four typical evacuation scenarios were established, and the initial parameters of passengers were defined by creating a passenger agent. Simulation experiments were carried out for these scenarios, and the results show that groups of passengers need more time to complete the evacuation than individual passengers. The number of passengers arriving at the embarkation area in one time period under the group evacuation scenario is less than that under the individual evacuation scenario. However, the peak period of arrival at the embarkation area under the group evacuation scenario lasts longer than that under the individual evacuation scenario. For passengers with slower walking speeds, they may complete the evacuation in a shorter time as long as their cabins are near the embarkation deck or in the suitable main vertical zones. This proves that the evacuation efficiency of passengers is affected by their initial positions, and evacuation time can be reduced by means of the allocation of cabins according to the movement characteristics of passengers.

1. Introduction

The safety of passengers has always been a concern of maritime authorities and scholars, especially regarding the evacuation problem of some large passenger ships such as cruise ships. Cruise ships generally have ten or more decks, and most passengers need to traverse several decks to arrive at the embarkation area in the event of an emergency. The evacuation process is also related to the walking speed and the behavior of the passengers. In order to ensure the safety of passengers, some scholars have carried out research on ship evacuation.
The research methods used in studying ship evacuation mainly include data collection, experiments, simulations, and so on. Luo [1] adopted the cutting-edge sensor mesh technology of ScanReach to observe the movement trajectory and evacuation process of pedestrians in real-time. Wang et al. [2,3] investigated the possible behaviors of passengers during evacuation through a questionnaire survey. Casareale et al. [4] analyzed the characteristics of evacuation behavior of pedestrians through another survey. At present, a relatively comprehensive evacuation experiment for passenger ships is project SAFEGUARD [5]. This project carried out evacuation experiments on cruise ships and ROPAX ferries, and collected data related to the response duration and evacuation time of passengers [6,7].
In addition, some scholars have studied ship evacuation through simulations due to the high cost of experiments. Evacuations can be simulated by means of simplified or advanced approaches. Simplified approaches assume pedestrian flow as a hydraulic or flow model, and the advanced approaches assume each pedestrian to be an individual [8]. Most software for evacuation is based on advanced approaches. Gwynne et al. [9,10] conducted an evacuation simulation for naval vessels and tour boats using the maritimeEXODUS software. Vassalos [11,12] used EVI software to analyze the influence of passenger speed on evacuation time. Ginnis et al. [13,14,15] developed the Virtual Environment for Life on Ships system and evaluated the influence of ship motion on the evacuation characteristics of passengers by the system. Meyer-König et al. [16] studied the influence of the trim and pitch angles on pedestrian movement by using AENEAS software to build the passenger evacuation model of a RoPax ship. Hu et al. [17,18] simulated the evacuation process of passengers in a cruise ship by using cellular automata and the multi-grid model, and they analyzed the evacuation characteristics of pedestrians under different floating conditions of the cruise ship. Ni et al. [19,20] studied the behavior of passengers’ return cabins regarding wearing life jackets and simulated the evacuation process using one deck as a scenario. Bellas et al. [21] used Pathfinder software to simulate the evacuation process of pedestrians in a warship and analyzed the effect of stair width on evacuation performance.
For cruise ships, it is common for family members to travel together, and so the behavior in a group evacuation should be considered. Some researchers have studied the differences between group and individual evacuations. Hu et al. [22] took individuals and social groups composed of two pedestrians as the experimental subjects and carried out unidirectional movement experiments in a confined space. Bode et al. [23] conducted an evacuation experiment on social groups of 12 pedestrians in a room with six exits; they found that the evacuation time increased when the social groups were in existence. By considering the impact of social group behavior on evacuation, an extended cellular automaton model was proposed by Lu et al. [24], and their research showed that the negative effects of social group behavior during evacuation would intensify when the social group density increased. The walking mode of social groups had a significant impact on the evacuation process. Zhao et al. [25] found that social groups that walked in the chain pattern had the highest evacuation efficiency compared with those that walked in the mixed pattern and line-abreast pattern. With the increased size of the social group, the decrease in the group walking speed is more obvious, and the deceleration of female walking speed is greater than that of males [26]. However, gender and social relations had little influence on the group walking speed when the group went downstairs [27]. Leaders of groups can play a certain role in the group evacuation process. Research by Turgut et al. [28] showed that leader-centered behavior is superior to group-centered behavior in small group evacuation, and the number of leaders affects the evacuation. Haghani et al. [29] found that the decision time of a social group during evacuation increases with the increase in the group size from an evacuation experiment. However, regardless of the group size, decisions were usually made by the group leader, and the leader would indicate the direction of movement to other members of the group.
In addition, the total evacuation time also increases with the group size [30]. The groups also discussed the evacuation path, but the final decision to evacuate using the stairs or elevators was usually made by the leader [31]. The evacuation is also often affected by the familiarity between individuals among groups. The experiment of Ma et al. [32] showed that group behavior has a positive impact on evacuation if individuals are acquainted with each other. However, competitive behavior may occur when group members were unfamiliar with each other, and thus the movement speed of the group is decreased. Visibility can also affect the movement of groups. Xie et al. [33] found that group behavior had a negative impact on evacuation under normal visibility. However, the situation in the case of the group under limited visibility is the opposite, where group behavior has a positive effect on evacuation. Based on considering the center of mass, shape and direction of the group, Krüchten et al. [34] adopted the minimal ellipse to describe the shape, internal dynamics and movement characteristics of a group. Müller et al. [35] extended the floor field cellular automaton model and added the group-specific floor fields into the model. They simulated the evacuation process of symmetric and asymmetric groups and studied the influence of groups’ interactions on evacuation dynamics.
From the above existing studies, group evacuation is different from individual evacuation, and it has a certain influence on the evacuation process. Moreover, as a dynamic process, the number of pedestrians arriving at the destination in each stage of evacuation is different. Tang et al. [36] used uniform distribution to describe the interval time of passengers arriving at the check-in counter and simulated the arrival process and check-in of passengers through cellular automata. Postorino et al. [37] analyzed the arrival time of different types of passengers based on Bar Coded Boarding Pass technology. Guo et al. [38] established the waiting time model of transfer passengers according to their arrival rates. Kaparias et al. [39] collected the data of passengers arriving at the platform by means of field counting and on-site interviews with passengers, and the collected data showed that the perceived and budgeted waiting times of passengers could be approximately fitted by a lognormal distribution or gamma distribution. Based on the passenger arrival information obtained from railway service tickets, Csikos et al. [40] explored the daily consistency of passengers’ non-random behaviors in the morning commute. Measurement is one of the methods used to obtain the pedestrian arrival distribution, and the data accuracy is greatly affected by the measurement interval. Ye et al. [41] analyzed the effect of different time measurement intervals on hourly flow rate stability and proposed a method to quantitatively calculate the optimal measurement interval of the pedestrian traffic flow model. As for the measurement method of pedestrian density, Das et al. [42] found that 15 or 30 s was the best measurement interval for variance analysis for pedestrian flow data on the sidewalk. For bus passengers with random arrivals, Kieu et al. [43] proposed the collective non-homogeneous Poisson process (cNHPP) to simulate the arrival process of passengers. The computing time of this method was short, and it could construct the arrival process using fewer time regions compared with the homogeneous Poisson process (HPP). Based on analyzing the data of passengers arriving randomly and non-randomly, Ingvardson et al. [44] proposed a general modeling method to describe passenger waiting time by means of uniform distribution and beta distribution. Luethi et al. [45] surveyed the data of 28 public transport facilities in the Zurich area and constructed the passenger arrival distribution model for the timetable-independent and the timetable-dependent arrival of passengers.
It can be seen from the above that scholars have carried out relevant studies on ship evacuation, group evacuation, and pedestrian arrival rules, respectively. However, there are different types of passengers on a ship, and their characteristics and behavior will have different impacts on evacuation. Therefore, this paper mainly analyzes the evacuation process by combining the behavior of passengers (in individual and group mode) and the characteristics of passengers (speed, response time, initial position, etc.).
In addition, evacuation planning is also one of the ways to keep people safe. Evacuation planning establishes a complete emergency plan from a macro point of view. Planning can avoid or minimize the impact of emergencies by building a safe and sustainable environment. The planning approach helps to reduce risks and enhance emergency preparedness through exercises [46]. However, the stay time of passengers on the ship is short, and there is a lack of adequate exercise opportunities. Hence, this paper mainly uses simulation methods to analyze the evacuation process of different types of passengers on cruise ships and explore potential ways to improve evacuation efficiency.
The main contributions in this paper are as follows. Firstly, the evacuation scenarios under the action of individuals and groups are established, and the waiting behavior is added to group evacuation. Secondly, the arrival time distributions of passengers are obtained by simulating the evacuation process of passengers. Finally, the effects of passenger type, walking speed, and initial position on evacuation time are analyzed, and we explore potential methods to improve evacuation efficiency.
The rest of this paper is as follows. Section 2 presents the description of the research problems. The simulation model is established in Section 3. In Section 4, simulation results are discussed. The last section presents the conclusions and future works.

2. The Description of Research Problems

2.1. The Cruise Ship Evacuation Scenarios

Passenger safety has always been one of the most important indicators for cruise ships. The International Maritime Organization issued the Guidelines for Evacuation Analysis for New and Existing Passenger Ships (The IMO Guidelines) [47], which provided relevant provisions for passenger evacuation. The evacuation analysis of passenger ships is stipulated in the guidelines, including two main scenarios, which are day and night scenarios. In the day scenario, passengers are distributed in public areas, and they are inside cabins under the night scenario. The objective cruise ship for this paper is shown in Figure 1.
According to the fire safety and evacuation requirements of cruise ships, there are several main vertical zones (MVZ) along the longitudinal length of the cruise ship. The red line in Figure 1 indicates the location of the main fire barriers (MFB), which divide the ship into six MVZs. Passengers are distributed between MVZ 1 and 5. There are several staircases along the longitudinal length of the cruise ship. Stairs 1–5 are the main evacuation staircases that connect multiple decks. Stairs 6 connects Deck 1 to 2, and stairs 7 and 8 connect Deck 9 to 10. Stairs 1, 2, 5 and 6 are double-run staircases, stairs 3 and 4 are double-divided staircases, and stairs 7 and 8 are single-run staircases. The structure and dimensions of these staircases are shown in Figure 2, Figure 3 and Figure 4.
The activity space of passengers is distributed from Deck 1 to Deck 10. As shown in Figure 1, yellow areas are the public zones and green areas are cabin zones. According to the IMO guidelines, all passengers are distributed in cabins under the night scenario. Each cabin holds two passengers on this cruise ship. In the day scenario, passengers are distributed in public zones, and the number of passengers in each zone can be calculated according to the area of the zone [48]. The passenger capacity of the cruise ship is 948, and the initial positions of passengers in the two main scenarios are shown in Table 1.
At the beginning of the evacuation, all passengers are in their initial positions, and the destinations of the evacuation are embarkation stations where lifeboats are located. The embarkation stations are located on two sides of Deck 2, and passengers from other decks move to Deck 2 through staircases.

2.2. The Parameters of Passengers

Due to gender, age, and other factors, the walking speeds of passengers are different, and the walking speeds have an influence on the evacuation process. Moreover, the walking speeds of passengers going upstairs and downstairs are different from those of passengers traversing flat terrain. Therefore, in order to accurately simulate the evacuation process of passengers, it is necessary to set the corresponding walking speed for different areas. Table 2 shows different types of passengers and their walking speeds as stipulated in the IMO guidelines [47]. As can be seen from Table 2, passengers are divided into ten types according to ages and genders, and each type of passenger occupies a certain proportion of the total passengers. The walking speeds of passengers are different according to their types.

2.3. The Indicators of Evacuation

Within the evacuation process, evacuation time is one of the most important criteria. The IMO guidelines point out that the evacuation time is divided into three parts. The first part is the response duration (R), during which passengers perceive the initial notification of an emergency and begin to evacuate. The second part is total travel duration (T), during which all passengers move from where they perceive the initial notification to the evacuation destinations. The third part is the embarkation and launching duration (E + L), which starts from passengers being assembled and the abandon ship signal being given. The evacuation time of passengers can be calculated by Equation (1) [47]:
1.25 ( R + T ) + 2 / 3 ( E + L ) < n
where R represents the response duration. This begins when the initial notification of an emergency is received and ends when the passenger has realized the situation and has begun to evacuate. T is the total travel duration. ( E + L ) represents the embarkation and launching duration, which should be equal to 30 min when this duration cannot be obtained from manufacturers, similar ships, or embarkation analysis. n is the performance standard of evacuation. n is 60 if the passenger ship has no more than three MVZs, or n is 80 if the MVZs of the ship number more than three. This paper mainly studies the evacuation process of passengers moving from the initial position to the embarkation station when an accident occurs. The evacuation time refers to ( R + T ) in subsequent parts of this paper.
Generally, the response duration of passengers is different in an emergency. The SAFEGUARD project measured the response duration of thousands of cruise passengers during a variety of scenarios and recommends Equations (2) and (3) to represent the response duration under day and night scenarios, respectively [49].
P Day = 1.0548 2 π 0.702 R e x p [ ( ln ( R ) 4.562 ) 2 2 × 0.702 2 ]   0 <   R   < 300
P Night = 1.1074 2 π 0.817 ( R 400 ) e x p [ ( ln ( R 400 ) 5.49 ) 2 2 × 0.817 2 ]   400 <   R   < 700
where P Day and P Night represent the probability density in the response duration R in the day and night scenarios, respectively.
The IMO Guidelines stipulate that the convergence of evacuation time should be checked every 50 simulations. The convergence of the time should meet the provisions of Equation (4) [47].
T lim T 0.95 mean 50 T 0.95 max 50 T 0.95 min 50
where T lim = ( n ( 2 / 3 ) ( E + L ) ) / 1.25 . T 0.95 is the value of the 95th centile of evacuation times of multi-simulations. T 0.95 mean 50 represents the mean value of T 0.95 in the last 50 simulations. T 0.95 max 50 and T 0.95 min 50 are the maximum and minimum values of T 0.95 in the last 50 simulations, respectively. On cruise ships, there are often families who travel together. In the event of an accident, they will also evacuate in groups. Combined with the group behavior of passengers, the day and night scenarios can be subdivided into four types that include day-individual, day-group, night-individual, and night-group. These four scenarios are used to study the different characteristics between individual and group evacuation in the day and night scenarios. It is common for family trips (a mother with one child in most conditions) or elderly couples to travel together [50], so the groups of passengers consist of two people in this paper. In the group mode, one member of a group will wait for the other before evacuating.
The evacuation time of passengers is generally distributed discretely, which can be expressed as Equation (5):
T R ( j ) S ( i ) = { P T R ( j ) S ( i ) ( 1 ) , P T R ( j ) S ( i ) ( 2 ) ,     , P T R ( j ) S ( i ) ( k ) ,     , P T R ( j ) S ( i ) ( N p ) }
where S ( i ) represents scenario i . R ( j ) represents the j th simulation. P T R ( j ) S ( i ) ( k ) represents the evacuation time of the k th passenger in the j th simulation of scenario i . T R ( j ) S ( i ) represents the set of evacuation times of passengers in the j th simulation of scenario i . N p represents the total number of passengers in scenario i .
In order to study the distribution characteristics of passengers arriving at the embarkation stations with discrete evacuation times, the distribution of the number of passengers arriving in each time interval is analyzed, as shown in Equation (6):
P N G D ( l ) S ( i ) = { P N D ( l ) S ( i ) ( R ( 1 ) ) , P N D ( l ) S ( i ) ( R ( 2 ) ) ,     , P N D ( l ) S ( i ) ( R ( j ) ) ,     , P N D ( l ) S ( i ) ( R ( N R ) ) }
where D ( l ) represents the time interval l . P N D ( l ) S ( i ) ( R ( j ) ) represents the number of passengers arriving in the time interval l in the j th simulation of scenario i . N R is the total number of simulations for each scenario. P N G D ( l ) S ( i ) represents the set of the number of passengers arriving during the time interval l in scenario i .
The median is commonly used to describe the data tendency. The arrival trend of the evacuation can be obtained by analyzing the median of passengers arriving at embarkation stations within each time interval, as shown in Equation (7):
M D ( j ) S ( i ) = P N G D ( j ) S ( i ) ( N R + 1 2 )                                             N R   is   odd P N G D ( j ) S ( i ) ( N R 2 ) + P N G D ( j ) S ( i ) ( 1 + N R 2 ) 2         N R   is   even   numbers
where M D ( j ) S ( i ) represents the median of passengers arriving at embarkation stations during the time interval l in scenario i .

2.4. The Description of the Method

Figure 5 presents the description of the method in this paper. Firstly, the walking speed, response duration, and behavior patterns of the group and individual passengers are analyzed. Secondly, according to the obtained characteristics of passengers, the model is established, and four evacuation scenarios are simulated. Thirdly, the arrival time distributions of evacuation are analyzed through the simulation results. Finally, the influence of passenger type, MVZs, and decks on evacuation is discussed.
In addition, the behavior patterns of passengers mainly consider the differences between individuals and groups in the process of evacuation. The main distinction is that one member of the group will wait for another one before evacuating, and group members will also act together in the evacuation process. Therefore, the one member of the group with a faster walking speed will slow down to stay consistent with the speed of another one in the group.

3. The Construction of Simulation Model

The evacuation of pedestrians is a dynamic process, and this process is usually simulated by establishing evacuation models. The Cellular Automata model [51], Lattice-gas automata model [52], Multi-Grid model [53], and Social Force model [54] are common models used by researchers. The social force model is based on Newtonian force. This model assumes that pedestrians have reaction behavior to the outside world, and the force on pedestrians can be represented by force vectors. AnyLogic [55] is software based on the social force model, and it is a widely used tool for the modeling and simulation of evacuation [56,57,58]. This software provides a wide variety of application programming interfaces (APIs), and special parameters and function bodies can be defined by users according to the simulation needs.
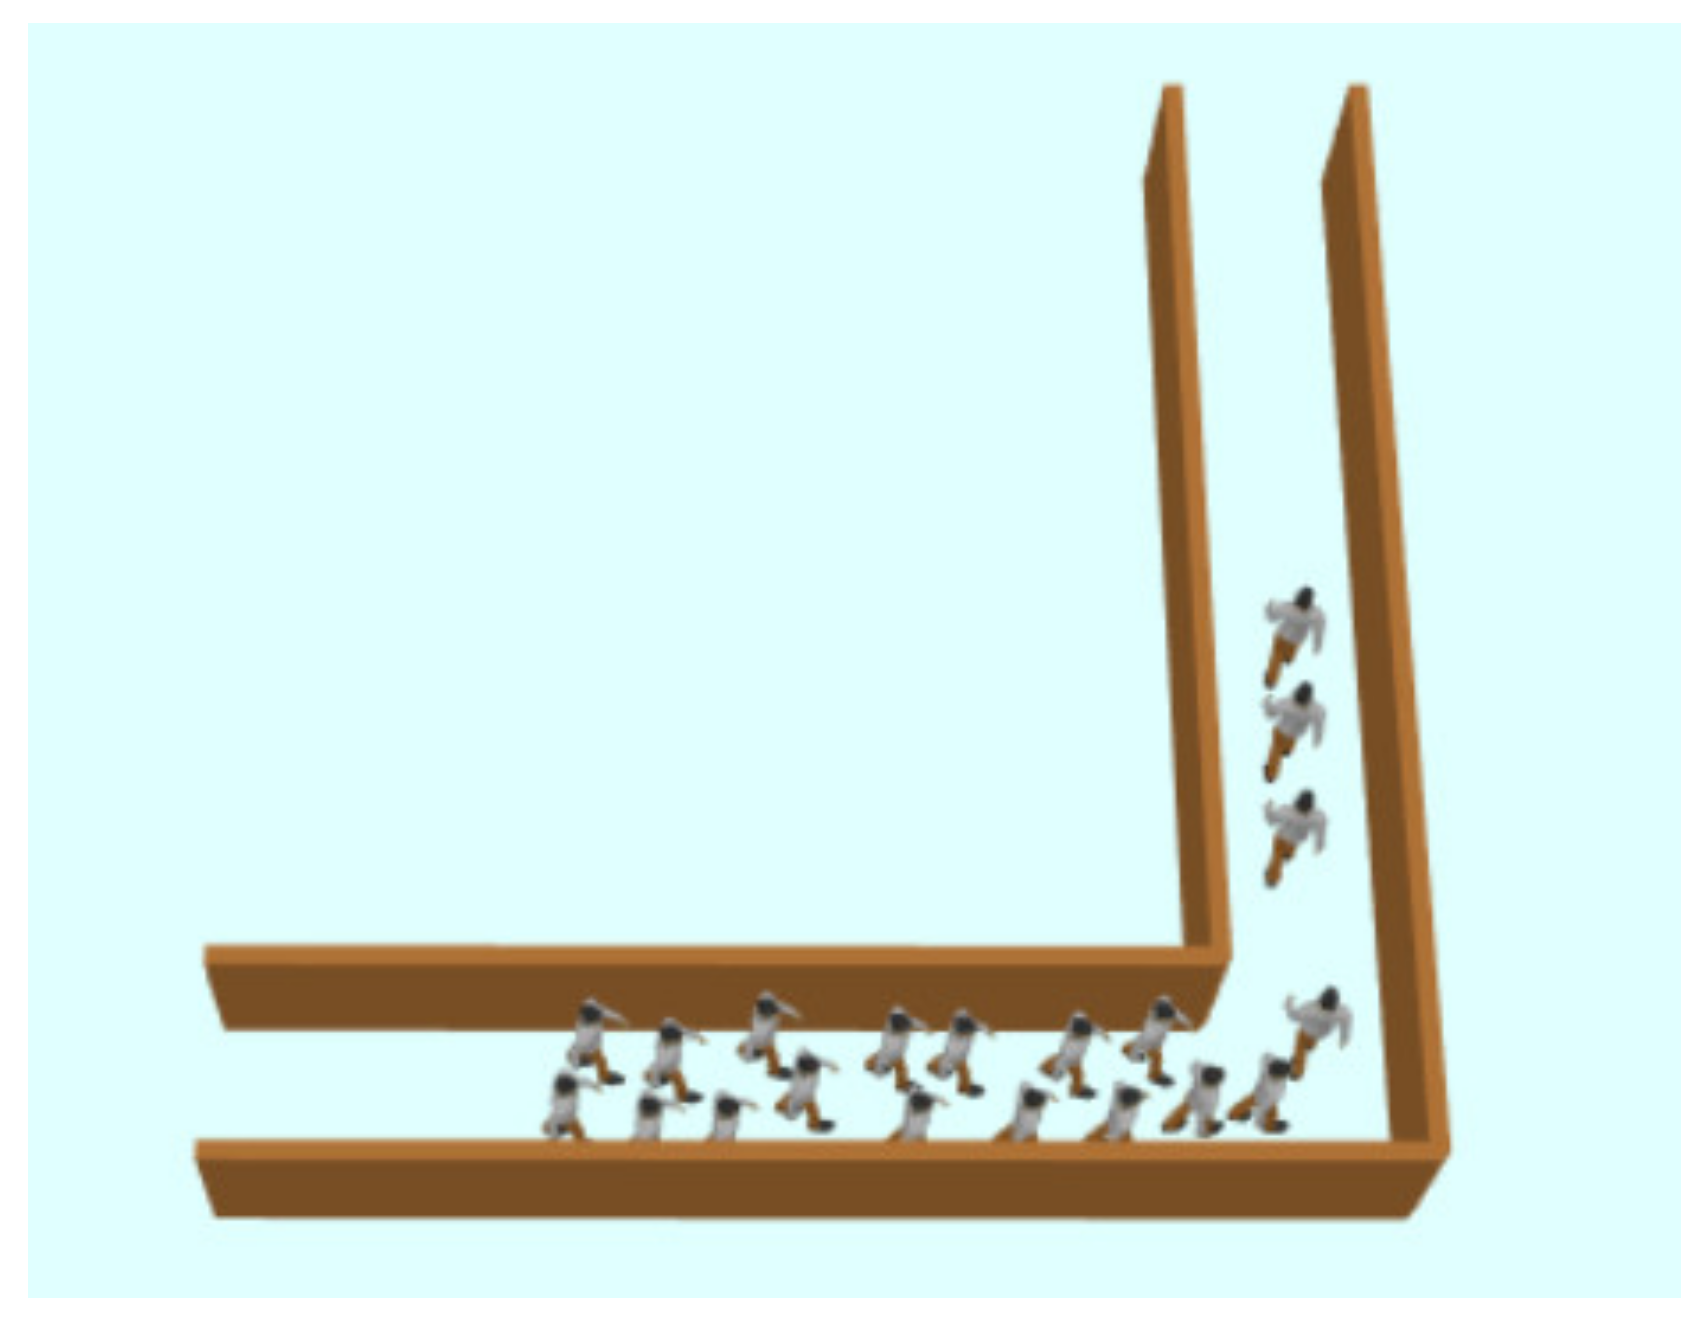
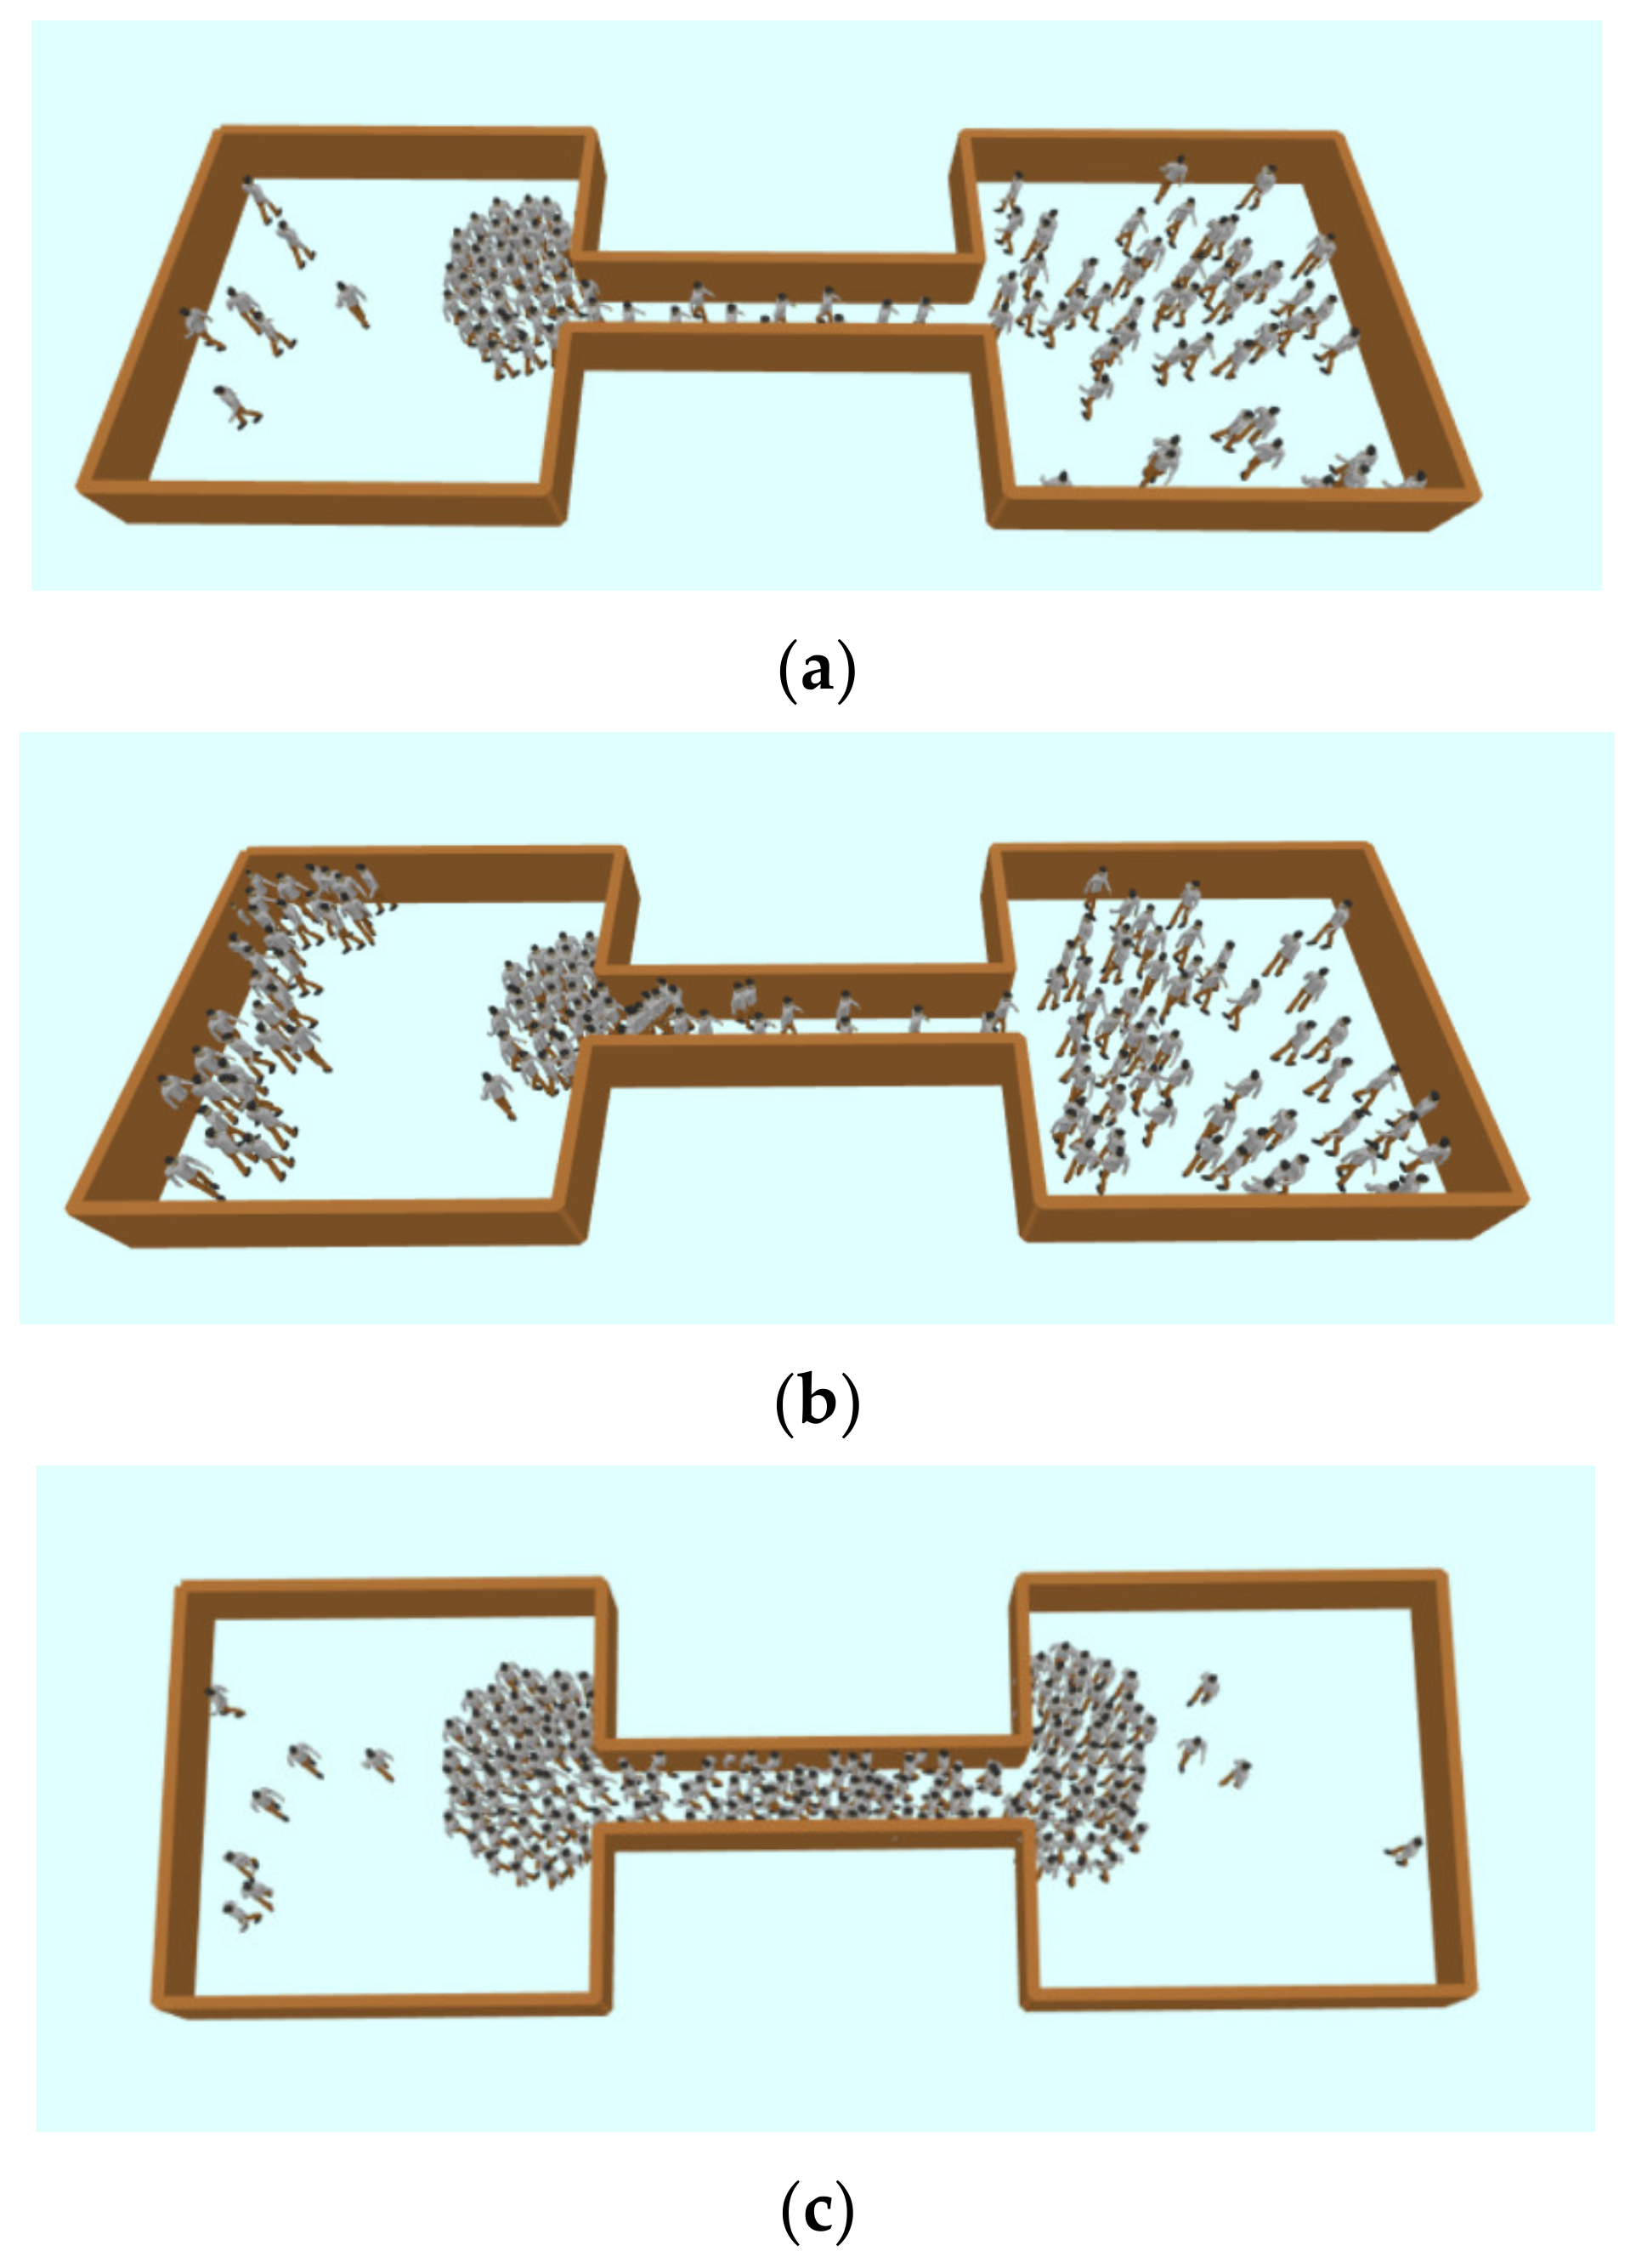
In order to verify whether the software is suitable for evacuation simulation, the verification scenarios [47] specified in the IMO Guidelines are used to test the AnyLogic software. 
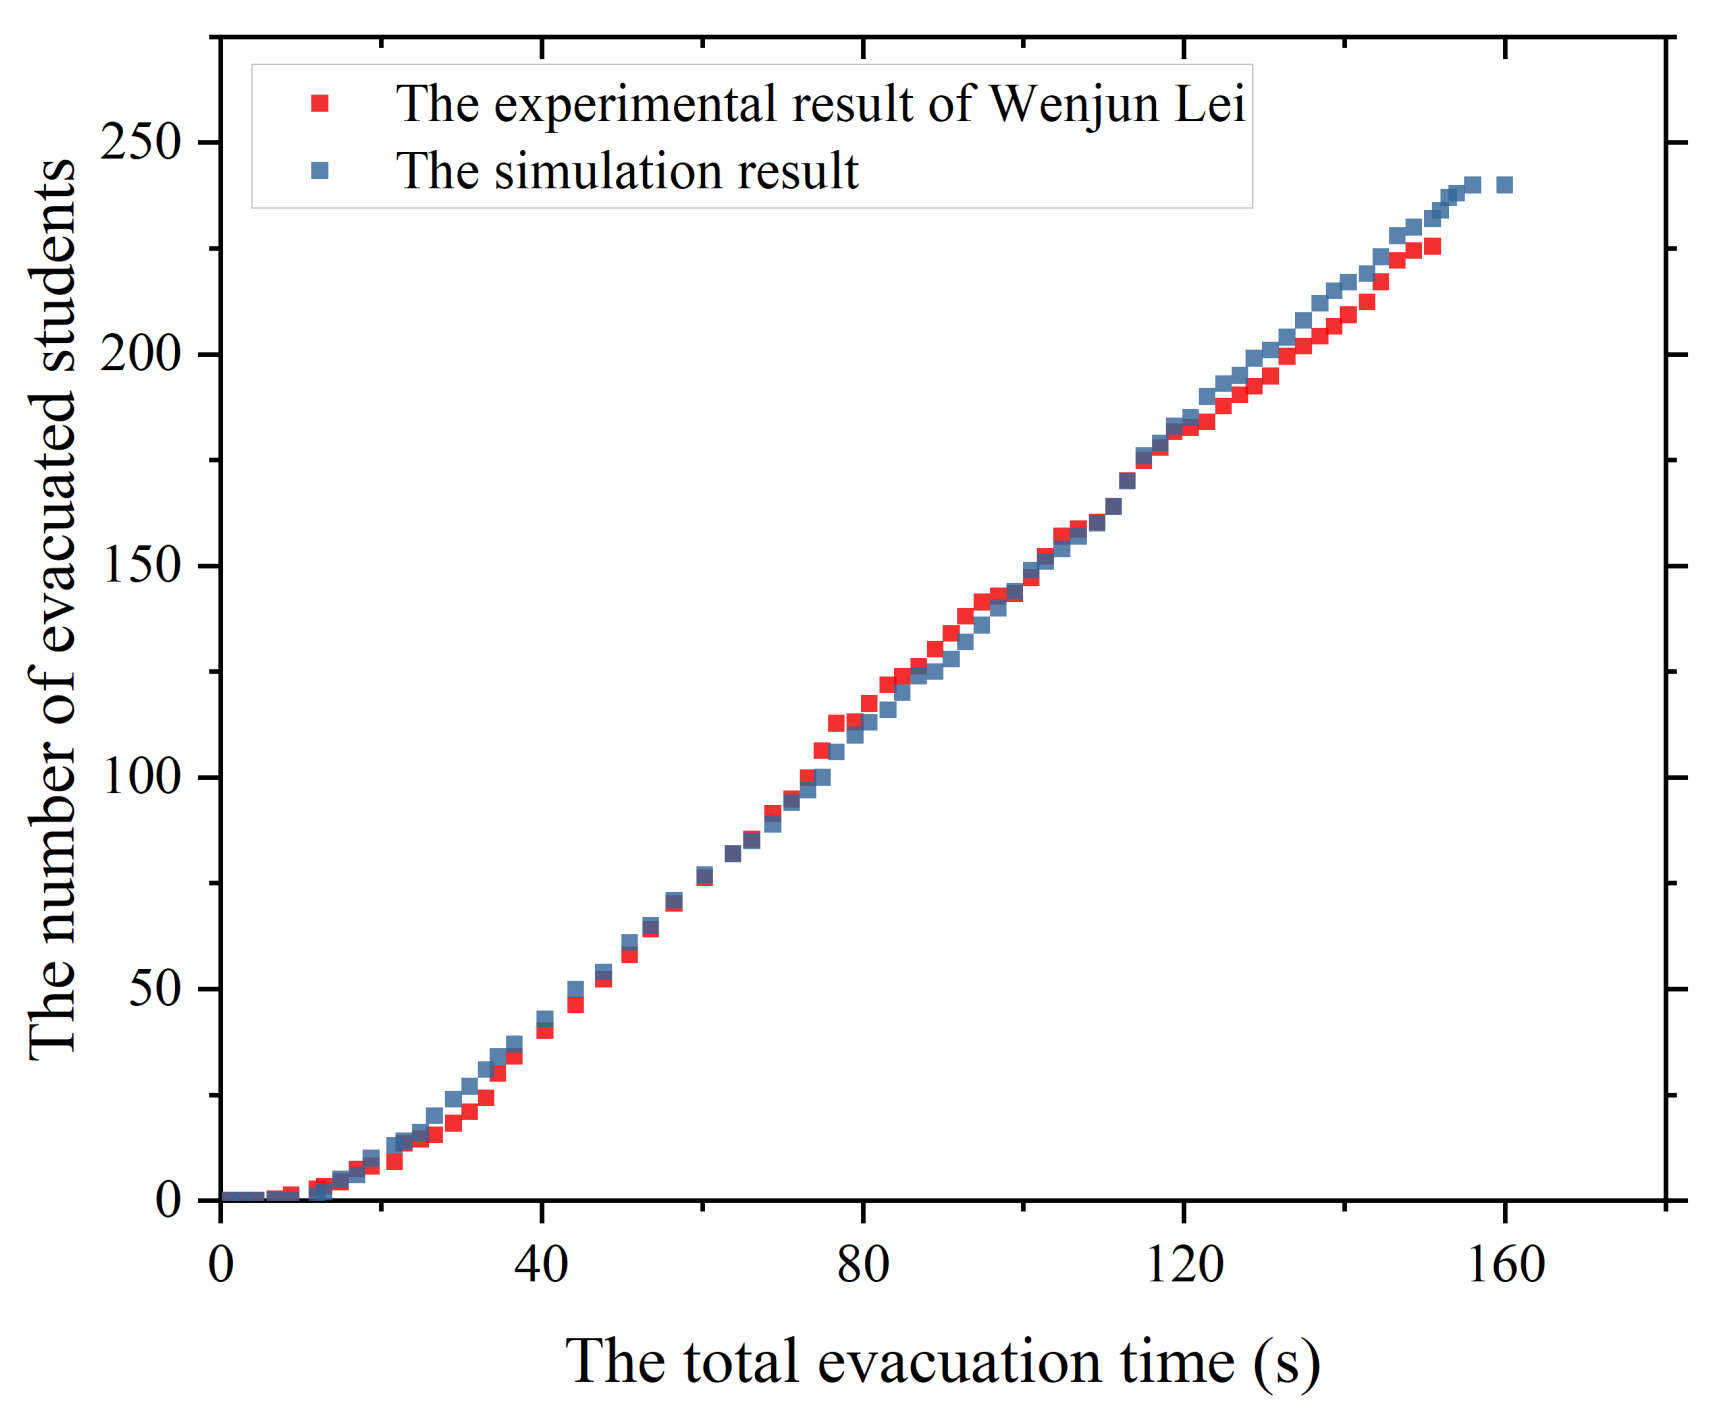
Appendix A is the test result, which shows that AnyLogic meets the test requirements of all scenarios. In addition, we also built a model based on the experimental scenario of the previous research [59] and simulated the scenario using AnyLogic. The details of this simulation can be seen in Appendix B. The simulation result is very close to the experimental result of the previous research. The results of two tests show that AnyLogic can be suitable for evacuation simulation. Therefore, this study used the AnyLogic software to establish the evacuation scenarios and to simulate evacuation processes.

3.1. The Construction of Evacuation Space Models

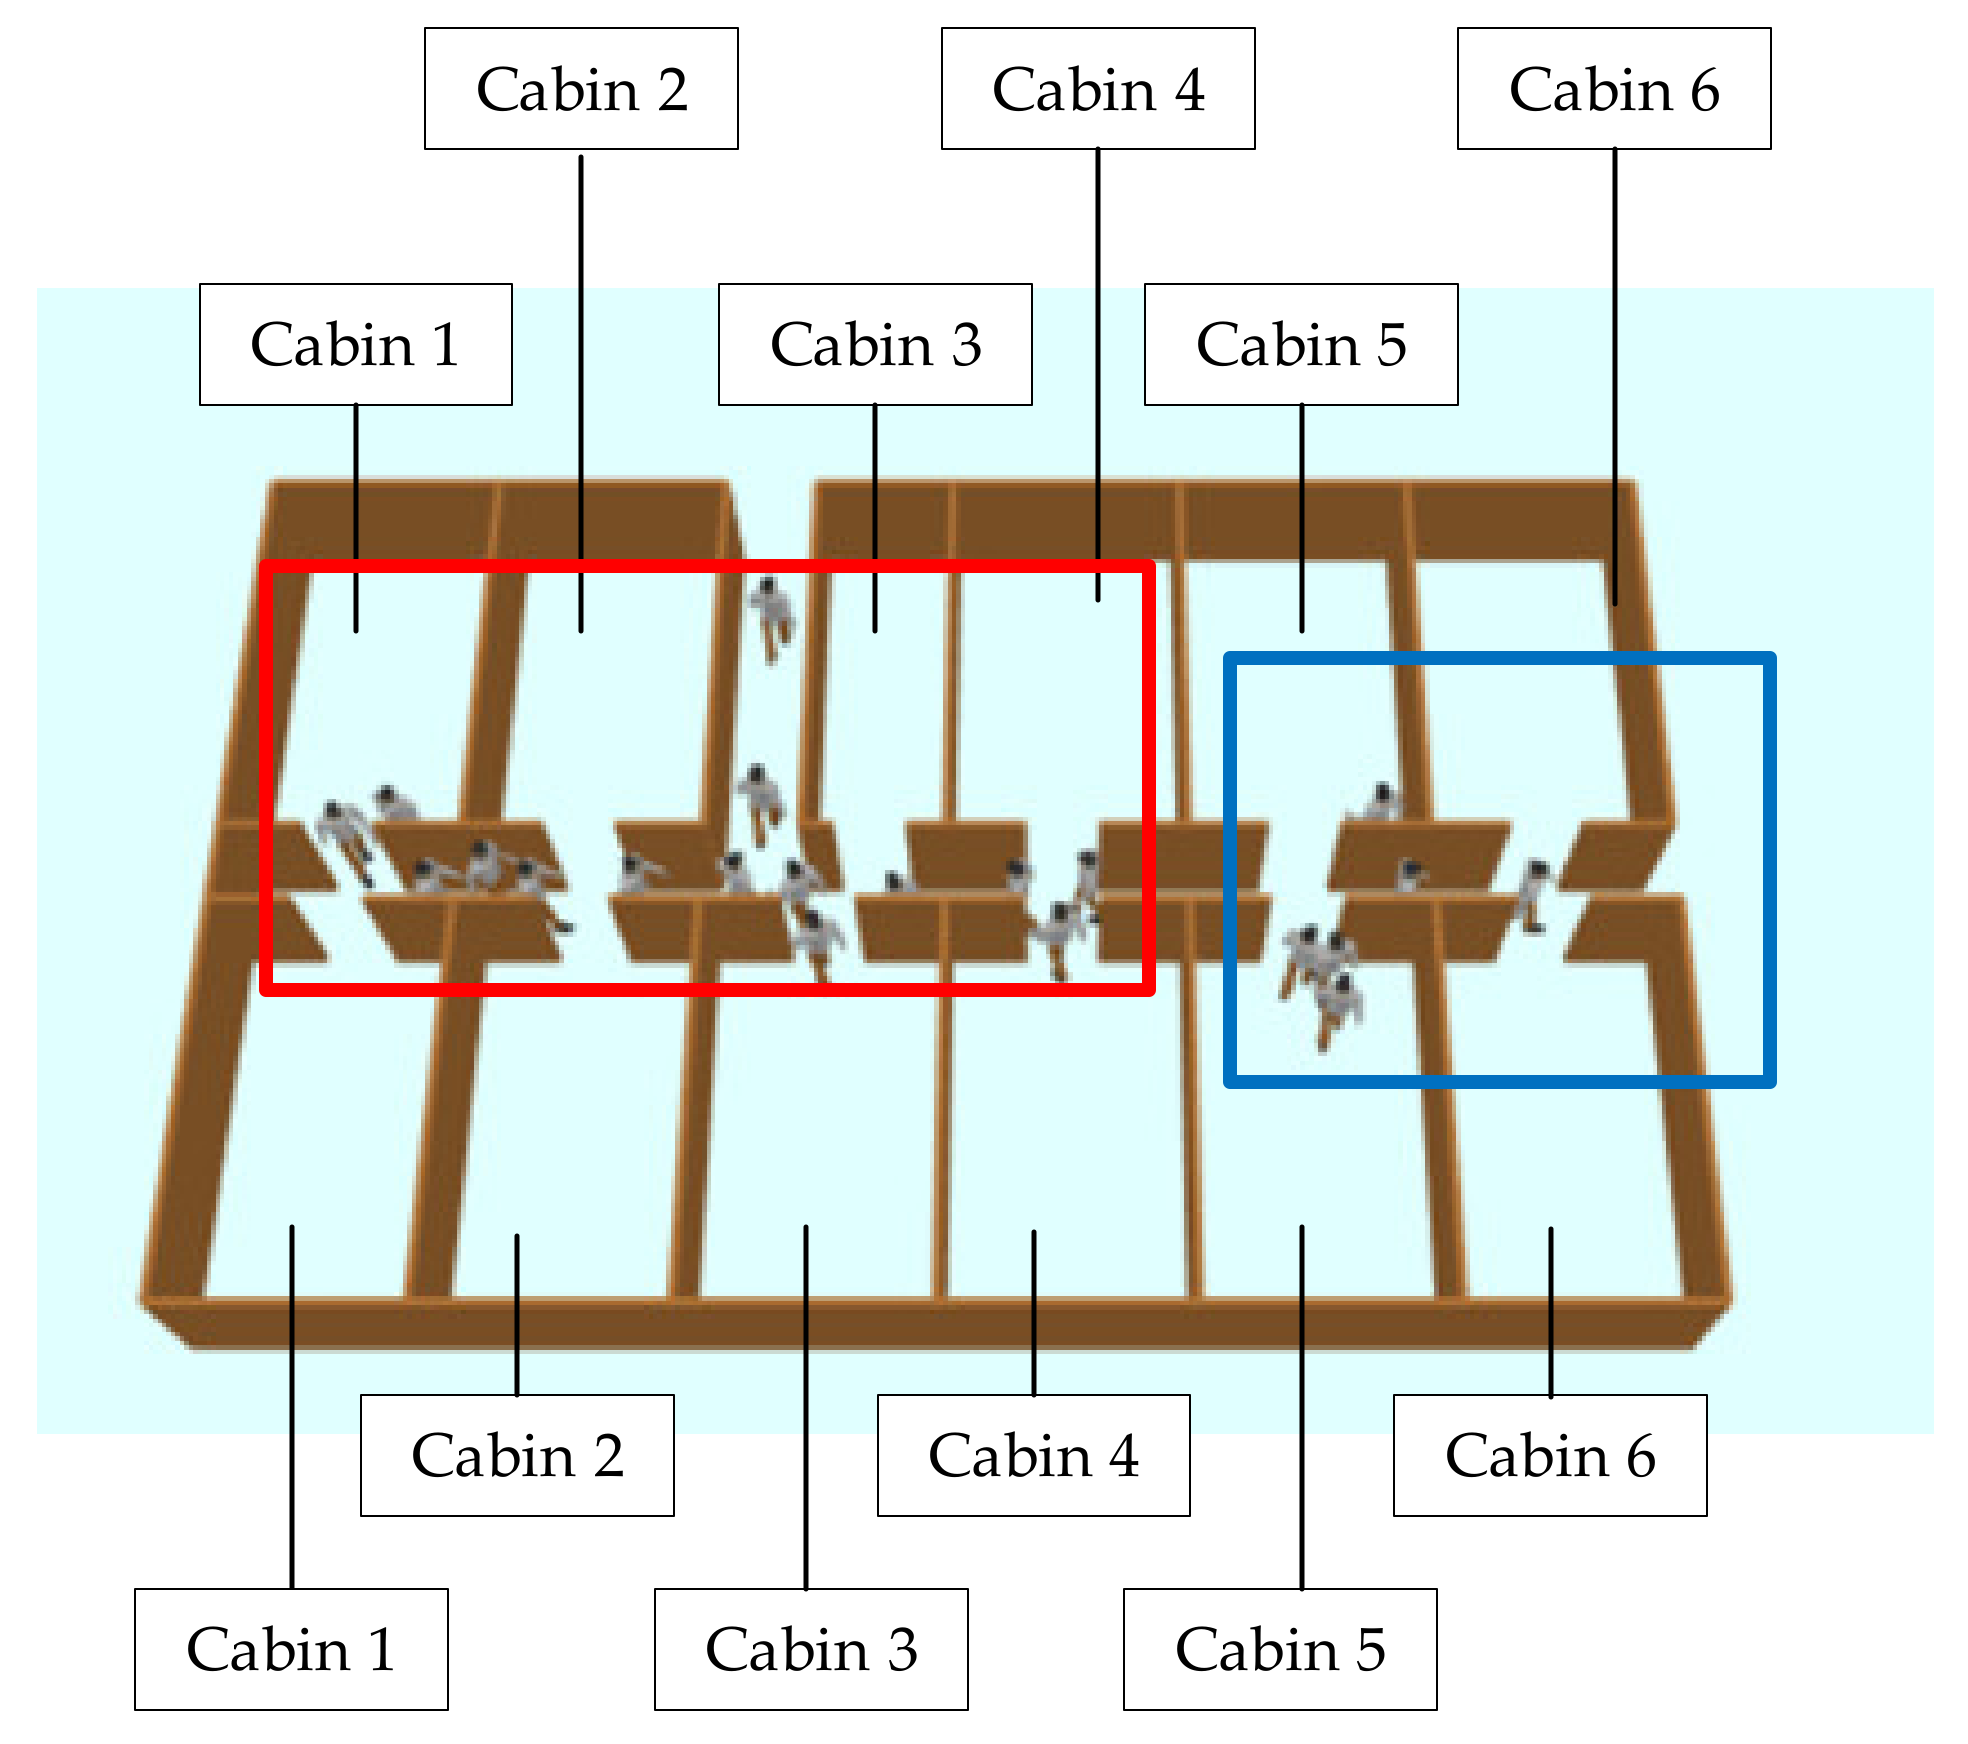
The evacuation space mainly includes planar and vertical spaces composed of decks and staircases, respectively. The deck model can be built according to the deck layout, and the space model of Deck 2 is shown in Figure 6. For furniture that exists in space, such as fixed tables, cabinets, and bar counters, the wall module of the software can be used to simulate this furniture to form boundaries. These boundaries are used to simulate obstacles in scenarios, and passengers cannot cross these boundaries during the simulation process. The final destinations of evacuation are the embarkation stations, which are two areas near the lifeboats on both sides of Deck 2, as shown in Figure 6.
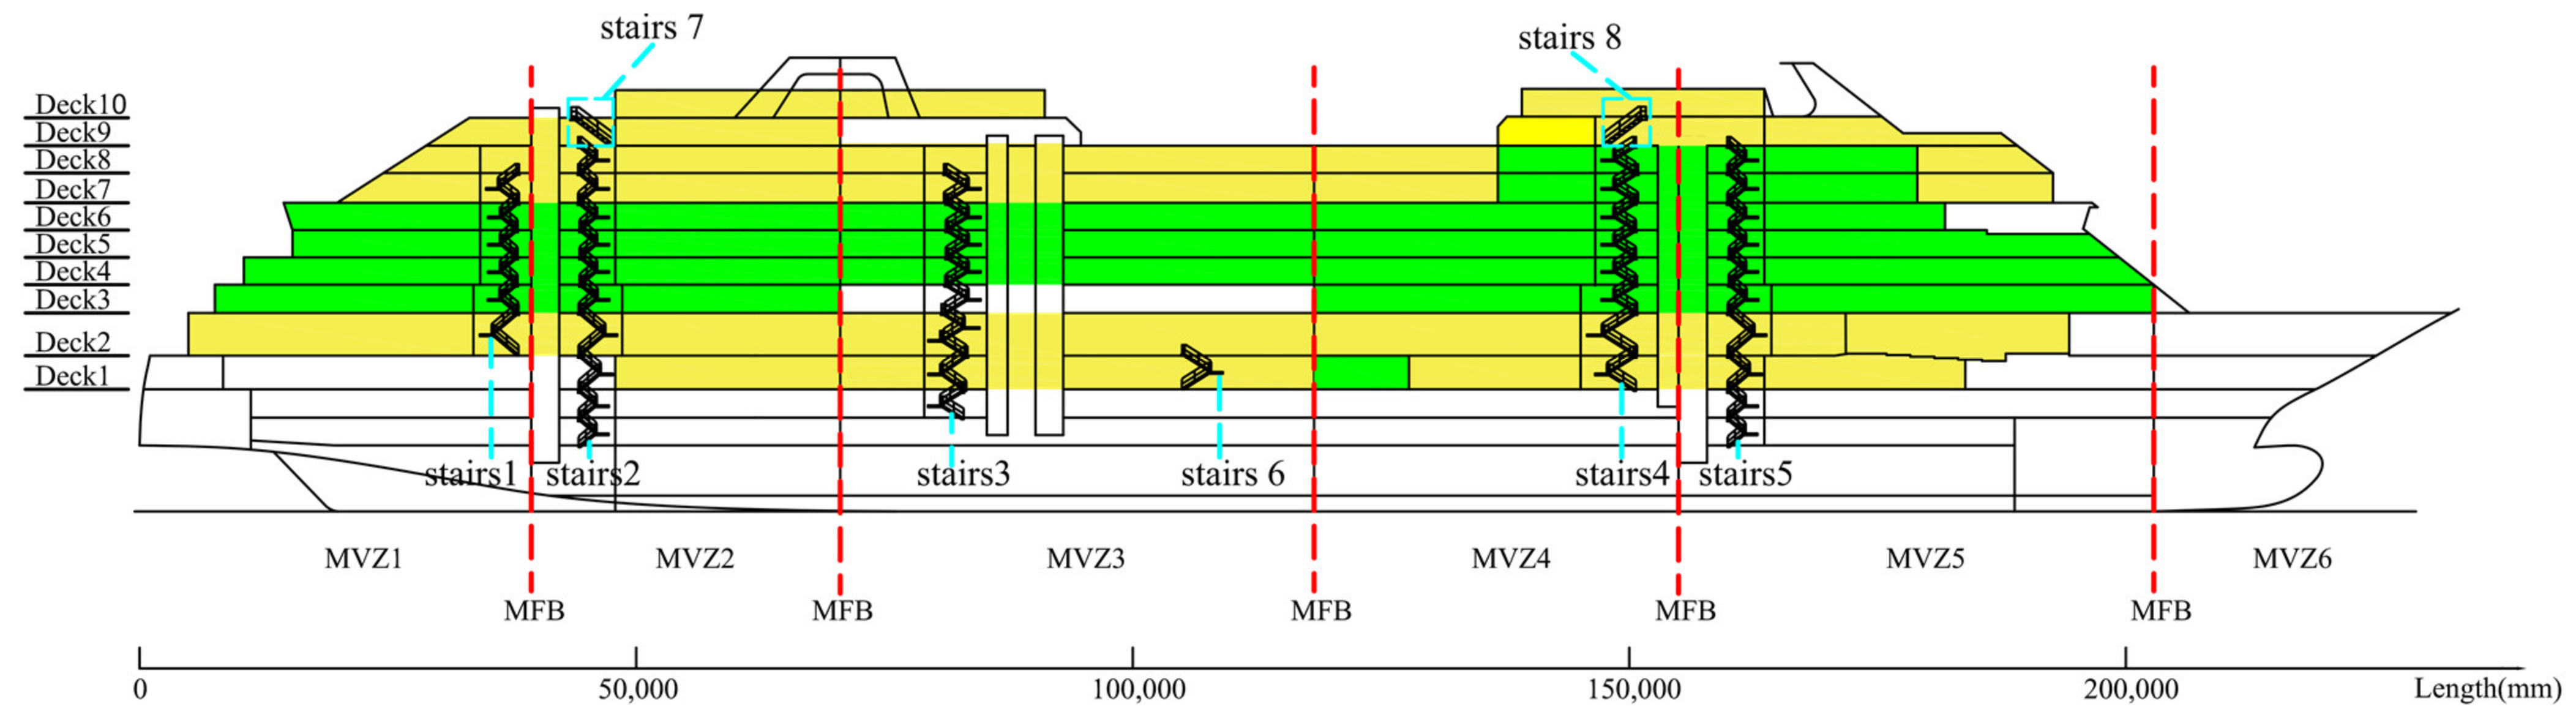
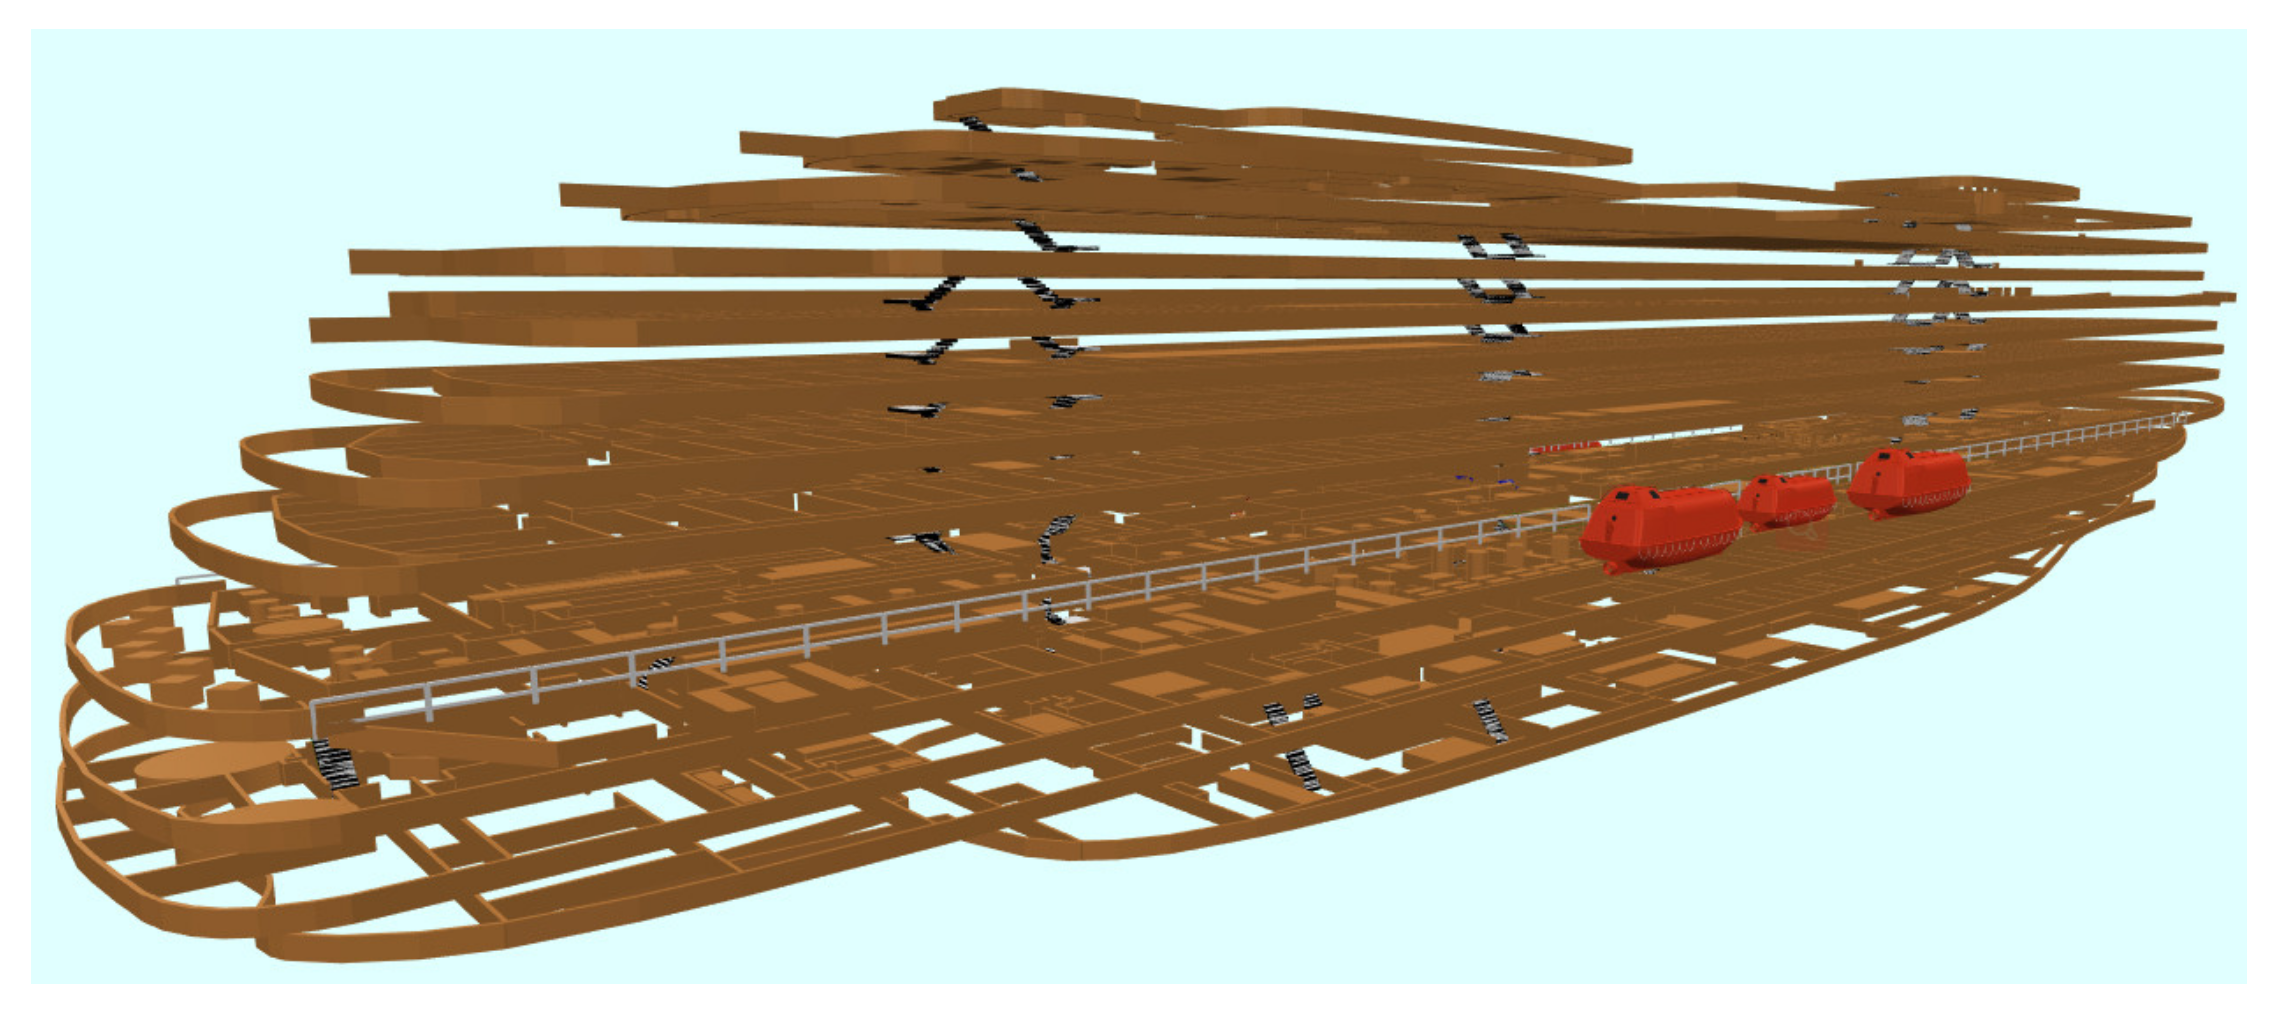
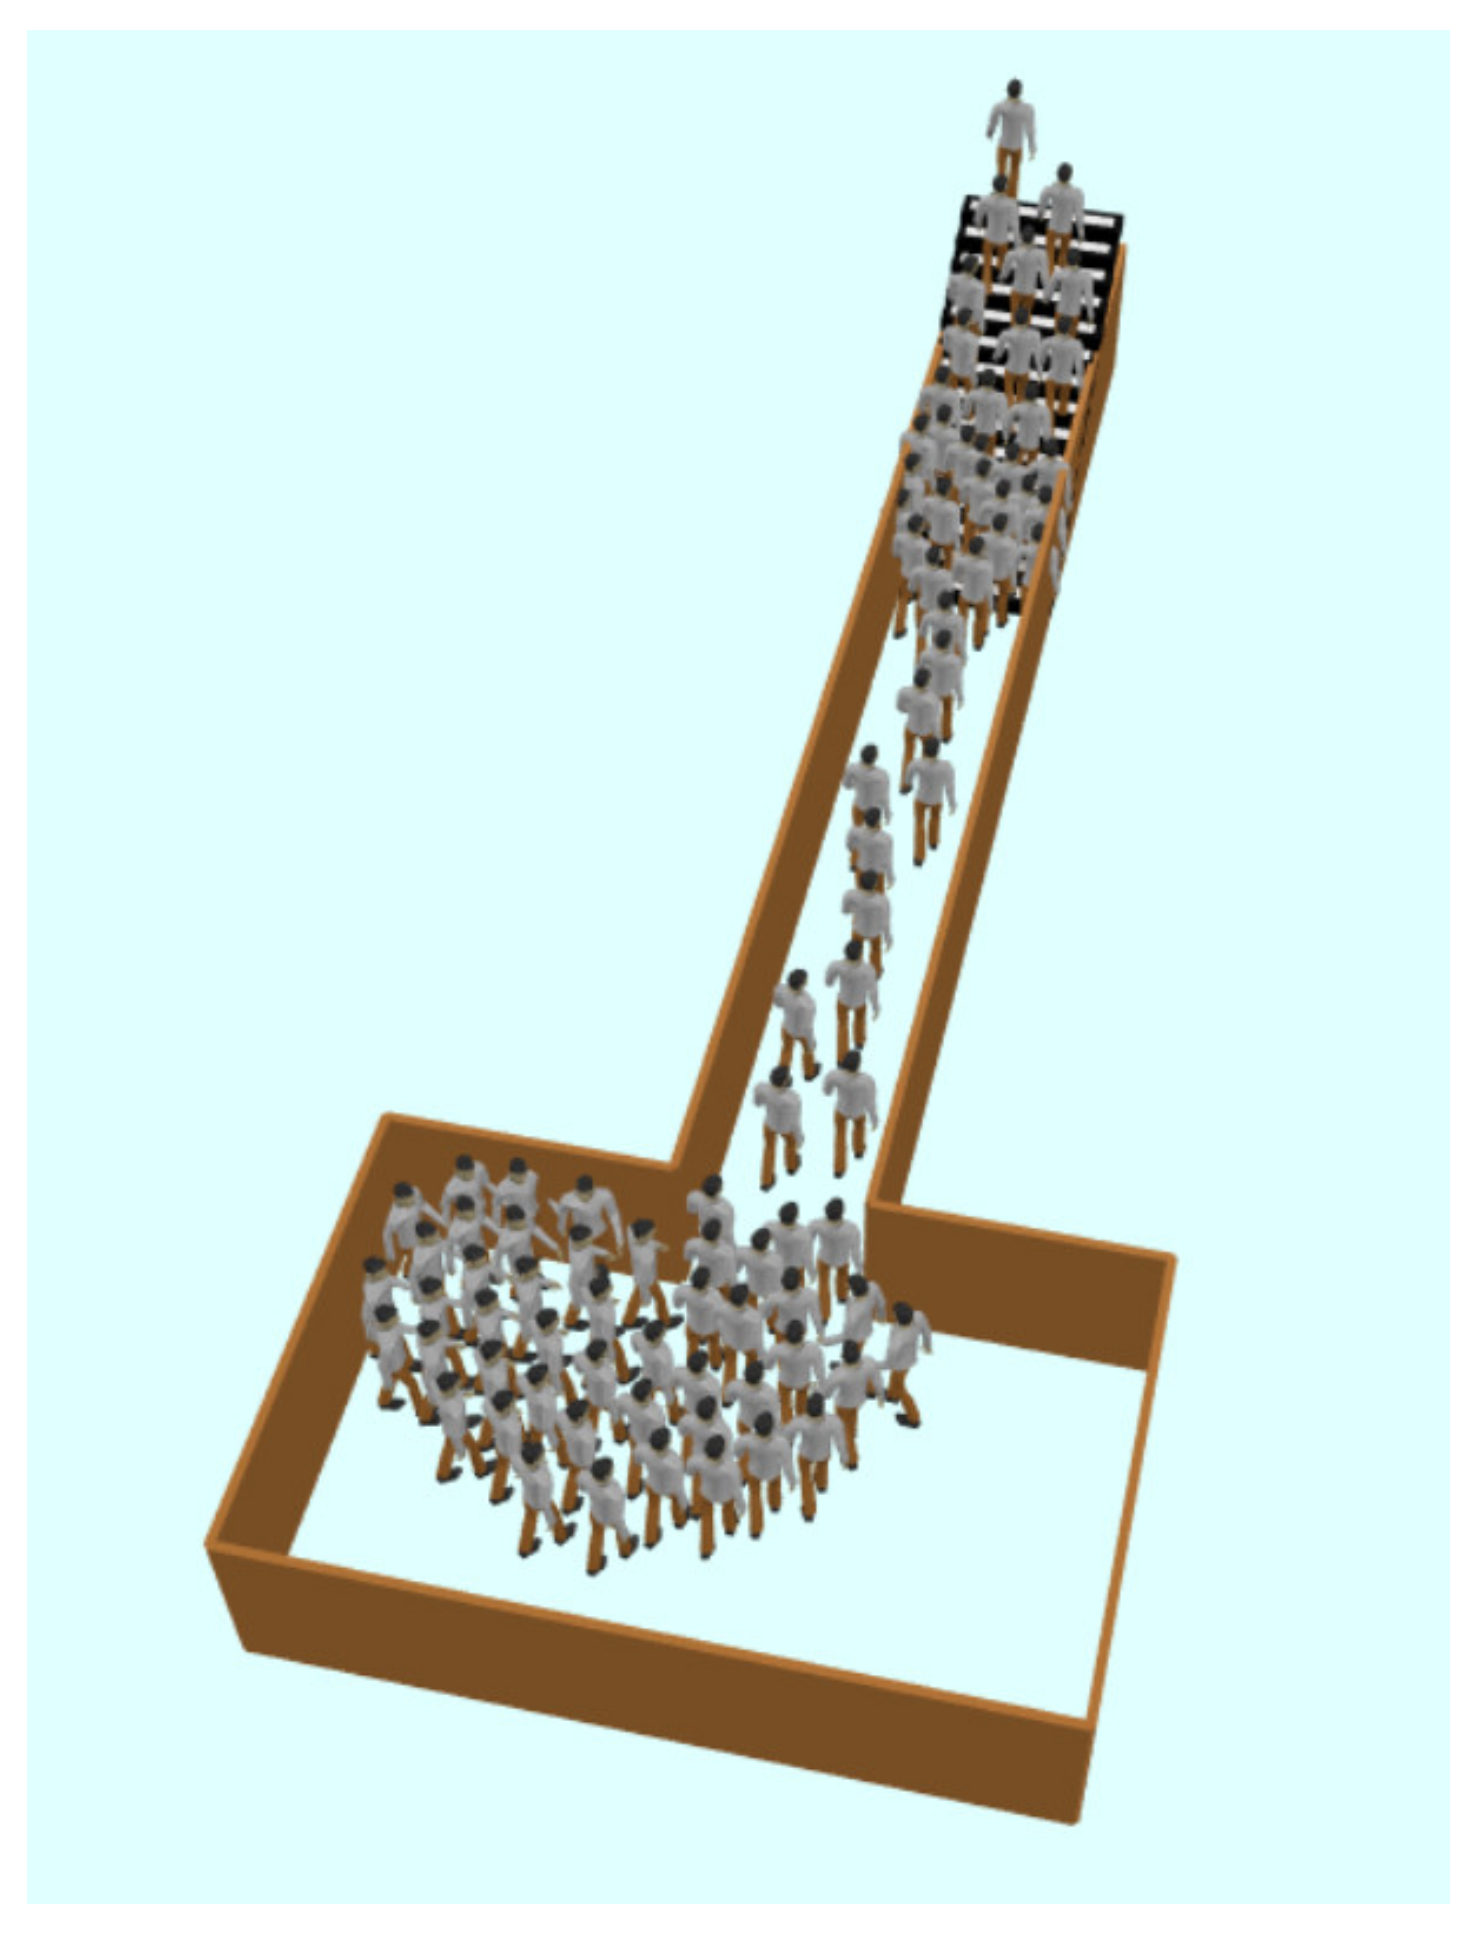
Figure 7 shows the established space model of the cruise ship, and decks in the model are connected by staircases. In the process of evacuation, passengers on other decks arrive at Deck 2 through staircases. The detailed spatial model and annotations of Decks 1–10 can be seen in Figure A13 and Table A2 of Appendix C.

3.2. The Construction of Passenger Model

The Analogic software can define a class of groups with similar attributes by establishing an agent. Due to different types of passengers having different walking speeds and proportions, attributes of passengers can be set by establishing a passenger agent. Java can be used to write programs to realize the functions needed in the simulation process in the software. Figure 8 shows items defined in the passenger agent. The items in the red box, the green box, and the blue box are parameters, variables, and functions of the passenger agent, respectively. A detailed description of each item can be found in Table A3 of Appendix C. The defined functions can be called in the process of evacuation simulation to realize the corresponding functions.

3.3. The Simulation Process

After the cruise ship evacuation space and passenger agent are established, the behavior of passenger evacuation can be set through the Process Modeling Library in the software. Each process module includes interfaces that functions can be called. Figure 9 shows the simulation process of passenger evacuation, which includes the following steps.
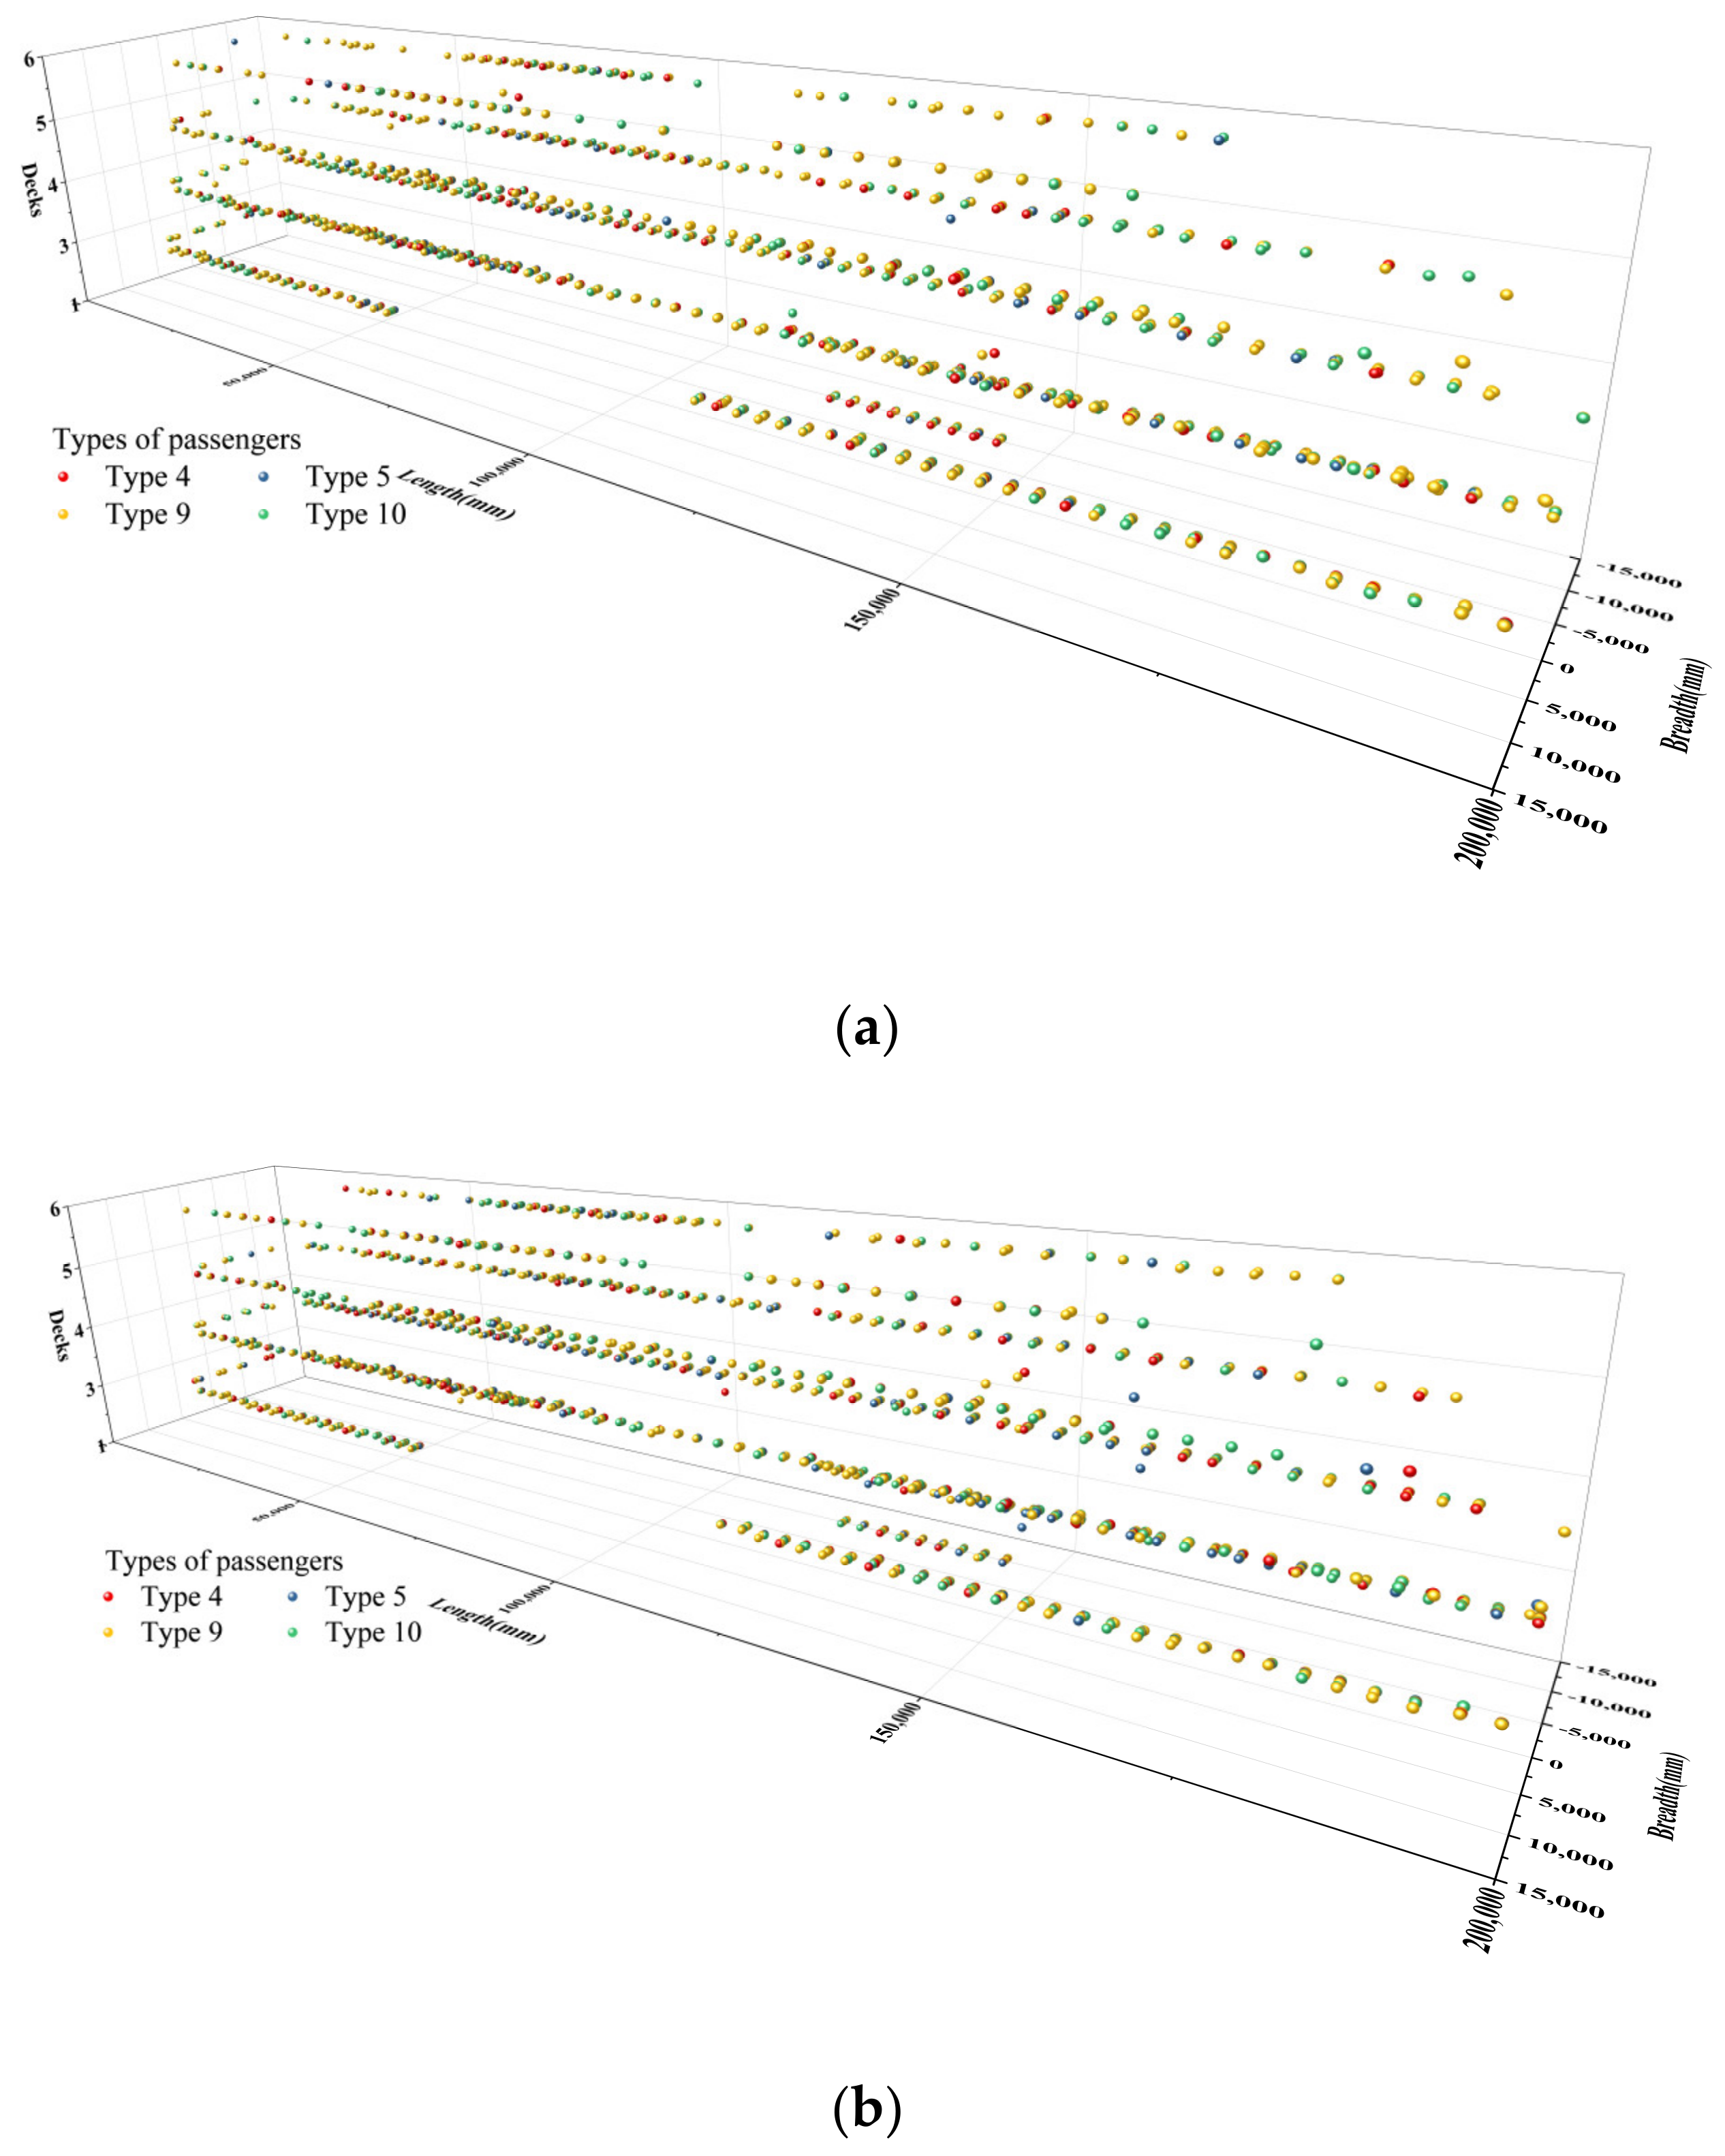
Step 1: Define four evacuation scenarios and determine the spatial distribution of passengers in each scenario.
Step 2: By selecting different evacuation scenarios, passenger models are prepared to be loaded into the space model.
Step 3: Call functions in the passenger agent to initialize passenger models, allocate proportions of different types of passengers, and assign the ID and type for each passenger.
Step 4: When the passenger is loaded into the space model, the corresponding walking speed is set based on the type of the passenger. The initial coordinates, deck, and MVZ can be obtained according to the initial position of the passenger.
Step 5: If the initial location of the passenger is on Deck 2, the passenger directly moves towards the embarkation stations. If the initial location is not on Deck 2, go to step 6.
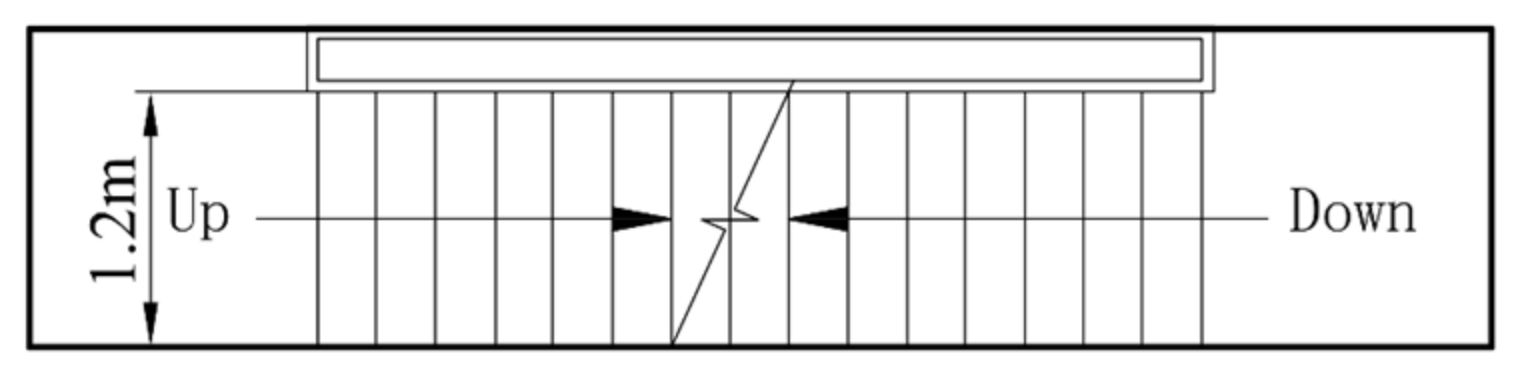
Step 6: Call Find_Location_Line function, causing passengers to turn into the pathfinding mode, and passengers will move towards nearest staircases.
Step 7: When the passenger enters the staircase, if the current location of the passenger is above Deck 2, the passenger will go downstairs from the current deck. Meanwhile, the walking speed of the passenger will be reset by the SetPedSpeed_StairsDown_min and SetPedSpeed_StairsDown_max functions. If the current location of the passenger is below Deck 2, the passenger will go upstairs from the current deck. The walking speed of the passenger will be reset by setPedSpeed_StairsUp_min and setPedSpeed_StairsUp_max functions.
Step 8: When the passenger arrives at another deck by the staircase, the walking speed of the passenger will be reset by the setPedSpeed_min and setPedSpeed_max functions. Then, the passenger checks whether the current deck is Deck 2 or not. If the current deck is not Deck 2, go to step 6. If the current deck is Deck 2, the passenger will move towards the embarkation stations.

4. Discussion of Simulation Results

The evacuation processes of the individual and group passengers under the day and night scenarios were simulated. Each scenario was simulated 500 times according to the stipulation of the IMO Guidelines. Figure 10 presents the snapshots of the simulation. Figure 10a shows the passenger distribution on Deck 7 at 220 s under the day-individual scenario, and Figure 10b shows the passenger distribution on Deck 3 at 650 s under the night-individual scenario. It was found that all passengers were moving toward the staircases, and congestion emerged around the entrance of the staircases.
Table 3 shows the convergence test of evacuation times under four scenarios. It can be seen that T lim T 0.95 mean 50 is greater than ( T 0.95 max 50 T 0.95 min 50 ) in all ranges of simulation times, indicating that all results meet the convergence requirements.

4.1. The Analysis of Arrival Time Distributions

Figure 11 shows frequency histograms of the arrival time distributions of passenger evacuation. The abscissa is the time interval of the evacuation time, and each time interval is 20 s. The maximum value of the abscissa is the total evacuation time. The left ordinate represents the median number of passengers who arrived at the embarkation stations. The right ordinate is the cumulative percentage of the arrival rate. The blue curve represents the cumulative arrival rate. It can be seen from the curve that the slope of the curve is small when the arrival rate is less than 10%. However, the slope of the curve suddenly increases when the arrival rate exceeds about 10%. Within the range of 10–90%, the curve slope barely changes, indicating that the arrival rate of passengers at this stage is stable. In addition, it can also be found from the histogram that many people are arriving in unit time during this stage, but the arrival number experiences little change within a time interval. When the arrival rate exceeds 90%, the arrival number of passengers in a time interval begins to decline significantly, and the slope of the curve also suddenly becomes shallower. Therefore, this paper considers the period when the cumulative percentage is in the range of 10–90% as the peak period of arrival.
Figure 11a shows the arrival time distributions of passengers in the day-individual scenario. It seems that the arrival rate of passengers begins to increase after 80 s. The arrival rate approaches the peak period after 220 s and begins to decline gradually after 560 s. From the cumulative curve, it can be found that about 80% of passengers arrived at a time in the range between 220 s and 560 s. The duration of this period is only 340 s and accounts for about 45.9% of the total evacuation time. Therefore, it is necessary to pay special attention to passenger safety in this period.
Figure 11b shows the arrival time distributions of passengers in the day-group scenario. Compared with Figure 11a, the total evacuation time is longer than that in the day-individual scenario. Meanwhile, the number of passengers arriving in each time interval is less than that in the day-individual scenario. The maximum number of passenger arrivals in all intervals is 40, while it is 52 in Figure 11a. The peak period of group passenger arrival lasts longer, which starts from 240 s and ends at 660 s. About 80% of passengers arrived within this 420 s time period, which accounts for 45.7% of the total evacuation time. Due to group behavior among passengers, the total evacuation time becomes longer, the number of passengers arriving in a time interval becomes smaller and the peak period lasts longer.
Figure 11c shows the arrival time distributions of passengers in the night-individual scenario. It can be found that the total evacuation time of this scenario is longer than that of the above day scenarios; the reason for this phenomenon may be that the response time of passengers is longer in the night scenario. The peak period starts from 650 s and ends at 900 s. The duration of the peak period is 340 s, which accounts for 27.6% of the total evacuation time. Compared with the day scenario, the duration of the peak period is shorter. From Figure 1 and Table 1, it can be seen that the initial positions of most passengers are at Deck 3 to Deck 6 in the night scenario. Moreover, these four decks are close to Deck 2, so that a large number of passengers may arrive in a short time period. In the day scenario, the initial positions of most passengers are on Deck 1, 2, 7, 8 and 9, and passengers on Deck 7, 8, and 9 may need more time to arrive at Deck 2. Therefore, the duration of the peak period in the day scenario is longer than that of the night scenario.
Figure 11d shows the arrival time distributions of passengers in the night-group scenario. Due to the group behavior of passengers, the total evacuation time is longer than that of the night-individual scenario, which is consistent with the day scenario. Compared with Figure 11c, the number of passengers in each time interval is less and the duration of the peak period is longer.
From the above analysis, it can be found that group passengers need more time to complete the evacuation in both day and night scenarios. In the case of group passengers, the duration of the peak period lasts longer than it does for individual passengers. In the night scenario, passengers need more time to complete the evacuation compared with the day scenario. Apart from passengers arriving in peak arrival times, the remaining 20% of arriving passengers take up more than half of the total evacuation time. Therefore, a detailed analysis of the first and last 10% of arriving passengers is necessary.

4.2. The Analysis of the First 10% and Last 10% of Arriving Passengers

By analyzing the arrival time distribution of passengers, the general arrival characteristics of the passenger evacuation can be obtained. Combining the characteristics of the first 10% and last 10% of arriving passengers in the simulation result, a comprehensive understanding of the entire evacuation process could be gained.
Table 4 shows the proportions of passengers whose initial locations are on different decks. For the first 10% of arriving passengers, it seems that the initial positions of passengers have a significant impact on the arrival. In the day scenarios, passengers on Deck 2 can be evacuated quickly due to the embarkation stations being on Deck 2, and so the proportion of these passengers is largest. In the night scenarios, passengers on Deck 3 and 4 could arrive at the destinations quickly, as these two decks are closer to Deck 2. Consequently, passengers on this deck occupy the largest proportion. For the last 10% of arriving passengers, the higher the deck that passengers are on, the greater the proportion of the last 10% they occupy. This means that passengers need more time to arrive at the evacuation destination on Deck 2 if their initial positions are on the higher decks. However, the passenger proportions for Deck 10 in the day scenarios are smaller than the lower decks, and the same situation also appears for Deck 7 under the night scenarios. It can be seen from Table 1 that the initial number of passengers on these two decks is relatively small, so the proportion of passengers is also low.
Table 5 shows the proportions of passengers whose initial locations are in different MVZs. In the first 10% of arriving passengers, the proportions of passengers in MVZ 2, 3, and 4 are significantly larger than the other two MVZs. As can be seen from Figure 1, staircases are set on both sides of MVZ 2, 3 and 4, and passengers in these MVZs can evacuate from two directions. Meanwhile, staircases are only arranged on one side of MVZ 1 and 5, and passengers can only move in one direction in the process of evacuation. Therefore, the evacuation efficiency of MVZ 1 and 5 is lower than that of the other three MVZs. For the last 10% of arriving passengers, the proportions of passengers in MVZ 3 and 5 are larger than other MVZs in the day scenario. As can be seen from Table 1, the number of passengers in MVZ 3 is the largest in the day scenario, which may lead to the higher value of the proportion of passengers in MVZ 3. Meanwhile, the reason for the high proportion value of passengers in MVZ 5 is also the layout of the staircases. For the same reason, the evacuation efficiencies of passengers in MVZ 1 and 5 are low under the night scenario, resulting in the proportions of passengers in these two MVZs being significantly higher than other MVZs. Since the initial number of passengers in MVZ 5 is larger than that in MVZ 1, the value proportion of MVZ 5 is higher than that of MVZ 1.
Table 6 shows the proportions of different types of passengers. For the first 10% of arriving passengers, their walking speed has a significant impact on evacuation, and the faster the walking speed is, the higher the proportion value of the passengers is. In four scenarios, the proportions of type 3 and 8 passengers are the largest in female and male passengers, respectively. It can be seen from Table 2 that, although the walking speeds of type 3 and 8 passengers are not the fastest, the number of these two types of passengers is the largest. The number of these two types of passengers is twice the number of types 1, 2, 6, and 7, and so the proportion value of these two types of passengers is highest in the three scenarios. In female and male passengers, the walking speed of type 1 and 6 passengers is the fastest, respectively. The proportions of these two types of passengers are larger in individual scenarios than in group scenarios. On the contrary, regarding type 4, 5, 9, and 10 passengers, whose walking speeds are slower, the proportions of these passengers were higher in the group scenario than in the corresponding individual scenario. It can be found that in the individual scenario, passengers who move faster have an advantage in the evacuation. However, in the group scenario, this advantage is diminished due to the group behavior of passengers.
For the last 10% of arriving passengers, it appears that the slower the walking speed, the greater the proportion of passengers, and the proportion of female passengers is larger than that of male passengers. In day or night scenarios, the proportion of individual passengers with faster walking speeds is smaller than group passengers, and the situation is quite the reverse for type 4, 5, and 10 passengers with slower speeds. It can be seen that in the group scenario, the evacuation efficiency of passengers with slower walking speeds can be improved, but for passengers with a faster walking speed, the evacuation efficiency is reduced. This is consistent with the characteristics of the first 10% of arriving passengers.
It can also be seen from Table 6 that although the walking speed of passengers in types 4, 5, 9, and 10 is slow, some of them are still in the first 10% of arriving passengers. From Table 4, it is found that, in the night scenario, some passengers on the higher deck can also be within the first 10% of arriving passengers. For type 1, 2, 6, and 7 passengers with a fast walking speed, some of them are in the last 10% of arrivals under the night scenarios. The reasons for this phenomenon are analyzed by combining the types and initial positions of passengers.
Figure 12 shows the initial positions of types 4, 5, 9, and 10 of the first 10% of arriving passengers under the night scenario, and types 1, 2, 6, and 7 of the last 10% of arriving passengers under the night scenario can be seen in Figure 13. As can be seen from these figures, most type 4, 5, 9, and 10 passengers are distributed on Decks 3, 4, and 5. For type 1, 2, 6, and 7 passengers, they are mainly distributed on decks that are higher than Deck 5. In addition, the first 10% of arriving passengers are mainly located in MVZ 2, 3, and 4. The last 10% of arriving passengers are mainly in the two MVZs near the bow and stern. Further analysis is conducted through the initial MVZs where these passengers are located.
As shown in Figure 14, the proportion of types 4, 5, 9, and 10 of the first 10% of arriving passengers in MVZ 1 and 5 is low. The proportion in MVZ 5 is not more than 20%, and the proportion in MVZ 1 does not exceed 10%. From the previous analysis, the evacuation efficiency of passengers in these two MVZs is low due to the distribution of staircases. Therefore, more than 70% of these passengers are distributed in the MVZ 2–5 area. Although the walking speeds of these four types of passengers are slow, they may reach the embarkation area at an earlier stage of evacuation if their initial position is in the middle MVZs.
In the individual scenario of Figure 15a, the proportion of types 1, 6, and 7 of the last 10% of arriving passengers are almost over 80% in MVZ 5, and over 10% in MVZ 1. In the group scenario of Figure 15b, the proportions of the four types of passengers in MVZ 5 are also more than 60%, and the proportions in MVZ 1 are nearly 20%. For these four types of passengers under both scenarios, the sum of proportions of MVZ 1 and 5 is more than 80%. It can be seen that although these four types of passengers move fast, they may also arrive at the embarkation area in the final stage of evacuation if their initial position is distributed on a higher deck or in the MVZs near the bow and stern.

5. Conclusions and Future Works

This paper takes the evacuation characteristics of the cruise passenger evacuation as the research object and establishes the cruise evacuation model by using AnyLogic software. The passenger agent is constructed to set the attributes of ten types of passengers, and then the simulation experiments are carried out in four scenarios that contain day-individual, day-group, night-individual, and night-group scenarios. The results show that the evacuation time of day scenarios is shorter than that of the night scenarios. The peak duration of passenger arrival in the group scenario is longer than in the individual scenario. In the group scenarios, the evacuation efficiency of passengers with fast walking speeds will be reduced, and the situation is quite the reverse for the passengers with a slow walking speed.
The evacuation results are also analyzed from the initial conditions of the passengers. It can be found that passengers with fast walking speeds may arrive at the embarkation area in the final stage if their cabins are far away from the embarkation decks or located in MVZs near the bow and stern. Passengers with a slow walking speed may arrive at the embarkation stations in the early stage of the evacuation as long as their cabins are near the embarkation deck or located in the middle MVZs. Therefore, the positions of passenger cabins could be appropriately adjusted and optimized according to the movement characteristics of passengers, and this is conducive to improving the evacuation efficiency of passengers.
The scenarios studied in this paper were mainly based on the condition that the cruise ship is floating positively. In the event of a casualty, the hull may be damaged and cause the cruise ship to be inclined. In future work, we will add the factor of inclining conditions on passenger movement into the model and study the influence of different incline angles on the passenger evacuation process.

Author Contributions

Conceptualization, M.H. and W.C.; methodology, M.H. and W.C.; software, M.H. and W.C.; writing—original draft preparation, M.H.; writing—review and editing, W.C. All authors have read and agreed to the published version of the manuscript.

Funding

This research was funded by Special Project of Large-Scale Cruise Ship Research and Development in the Ministry of Industry and Information Technology of China, grant number [2017] No. 614; The Research on Design and Construction Technology of Medium-Scale Cruise Ships in the Ministry of Industry and Information Technology of China, grant number G18473CZ03; The Research on the Design Technology of High-Tech Ocean Passenger Ships for the Safe Return to Port System in the Ministry of Industry and Information Technology of China, grant number [2019] No. 331; Research funding of Sanya Science and Education Innovation Park of Wuhan University of Technology, grant number 2020KF0060.

Institutional Review Board Statement

Not applicable.

Informed Consent Statement

Not applicable.

Data Availability Statement

Not applicable.

Conflicts of Interest

The authors declare that they have no conflict of interest.

Appendix A

Test 1: Maintaining set walking speed in corridor.
One pedestrian in a passage 2 m wide and 40 m long with a movement speed of 1 m/s should be verified to complete this distance in 40 s.
Figure A1 is the scenario of test 1, and the completion time of the test is 39.6 s.
Figure A1. The scenario of test 1.
Applsci 12 04213 g0a1
Test 2: Maintaining set speed up staircase.
One pedestrian on a stair 2 m wide and a length of 10 m measured along the incline with a movement speed of 1 m/s should be verified to complete this distance in 10 s.
Figure A2 is the scenario of test 2, and the completion time of the test is 9.9 s.
Figure A2. The scenario of test 2.
Applsci 12 04213 g0a2
Test 3: Maintaining set speed down staircase.
One pedestrian on a stair 2 m wide and a length of 10 m measured along the incline with a movement speed of 1 m/s should be verified to complete this distance in 10 s.
Figure A3 is the scenario of test 3, and the completion time of the test is 9.8 s.
Figure A3. The scenario of test 3.
Applsci 12 04213 g0a3
Test 4: Exit flow rate.
One hundred pedestrians (p) in a space 8 m by 5 m in size with a 1 m-wide door in the middle of the 5 m wall. The flow rate over the whole stage should be no more than 1.33 p/s.
Figure A4 is the scenario of test 4, and the maximum flow rate of the entire period is 0.73 p/s.
Figure A4. The scenario of test 4.
Applsci 12 04213 g0a4
Test 5: Response duration.
Ten pedestrians in a space 8 m by 5 m in size with a 1 m-wide door in the middle of the 5 m wall. The uniform distribution between 10 s and 100 s is set as the response duration. Verify that each pedestrian begins moving at the right time.
As shown in Figure A5, a person starts to move toward the door every 10 s. Figure A5a–d present the states in the room when the time is 10, 20, 50, and 70 s, respectively.
Figure A5. The scenario of test 5. (a) Time = 10 s; (b) time = 20 s; (c) time = 50 s; (d) time = 70 s.
Applsci 12 04213 g0a5
Test 6: Rounding corners.
Twenty pedestrians entering a left-hand corner will successfully walk around the corner without penetrating the boundaries.
As shown in Figure A6, the pedestrians completed the walk around the corner without crossing the boundary.
Figure A6. The scenario of test 6.
Applsci 12 04213 g0a6
Test 7: Counterflow—two rooms connected via a corridor.
Two rooms are both ten meters wide and long, and these two rooms are connected with a passage whose size is ten meters long and two meters wide.
Step 1: One hundred pedestrians walk from room 1 to room 2. In the initial condition, pedestrians are allocated on the left of room 1 at maximum density. The time is recorded when the last pedestrian arrives at room 2.
Step 2: Step one is repeated with 10, 50, and 100 pedestrians assigned to room 2, respectively. These assigned pedestrians should have the same characteristics as the pedestrians in room 1. Pedestrians in both rooms begin to move at the same time, recording the persistent period when the last pedestrian in room 1 arrives in room 2. The desired result is that the recorded persistent period increases when the number of pedestrians in counterflow increases.
In Figure A7, the rooms on the left and right are rooms 1 and 2, respectively. In Figure A7a, ten pedestrians are in room 2, 100 pedestrians are in room 1, and the time taken for the last person in room 1 to enter room 2 is 111 s. In Figure A7b,c, 50 pedestrians and 100 pedestrians are in room 2, respectively, and the time taken for the last person in room 1 to enter room 2 increases to 157 s and 183 s, respectively.
Figure A7. The scenario of test 7. (a) Time = 111 s; (b) time = 157 s; (c) time = 183 s.
Applsci 12 04213 g0a7
Test 8: Exit flow: crowd dissipation from a large public room.
A public space with four doors and containing 1000 pedestrians who are distributed uniformly within the room. Pedestrians leave from the nearest doors.
Step 1: Record the time the last pedestrian exits the room.
Step 2: Shut doors 1 and 2 and repeat step 1. The desired result is an approximate doubling of the period in step 1.
Figure A8a shows the scenario where pedestrians leave through four exits, and the duration is 279 s. Figure A8b shows the scenario of pedestrians leaving through two exits, and the duration of this scenario is 555 s, which is about twice the duration in Figure A8a.
Figure A8. The scenario of test 8. (a) Four exits; (b) Two exits.
Applsci 12 04213 g0a8
Text 9: Exit route allocation.
The pedestrians in cabins 1, 2, 3, 4, 7, 8, 9, and 10 are arranged to leave from the main exit, and the remaining pedestrians are assigned the secondary exit. The desired result is that the assigned pedestrians leave from suitable exits.
As shown in Figure A9, the pedestrians in the red and blue boxes move towards two exits, respectively.
Figure A9. The scenario of test 9.
Applsci 12 04213 g0a9
Test 10: Staircase.
The pedestrians in the room move to the stair through a passage. The desired result is that congestion occurs at the exit of the room. There is a steady flow in the passage with the appearance of congestion at the bottom of the stairs.
As shown in Figure A10, the congestion appears at the exit of the room and the bottom of the staircase. The flow of pedestrians in the passage is steady.
Figure A10. The scenario of test 10.
Applsci 12 04213 g0a10

Appendix B

To verify the availability of AnyLogic software on the evacuation simulation, the scenario of the evacuation experiment organized by Lei et al. [59] is simulated with AnyLogic. The simulation result is as follows.
As shown in Figure A11, there are 24 female dormitories. The two exits are at the lower-left corner, and the width of each exit is 2 m. Each dormitory accommodates ten female students, and the speed range of students is 0.95~1.35 m/s.
Figure A11. The evacuation scenario.
Applsci 12 04213 g0a11
Figure A12 and Table A1 present the comparison of the AnyLogic simulation result and the experimental result of the reference [59]. Figure A12 shows that the simulation results are very close to the experimental results. It can also be seen from Table A1 that the difference between simulation and experimental results is very small, and the differences between the three types of time are all within 3.5 s. Therefore, the AnyLogic is suitable for the evacuation simulation of large numbers of pedestrians from this result.
Figure A12. The results of the evacuation experiment [59] and simulation. The data of evacuation experiment is adapted with permission from Ref. [59]. Copyright 2012 Elesvier.
Applsci 12 04213 g0a12
Table A1. The comparison result between the evacuation experiment and simulation.
Experiment [59]Simulation
Arrival time of the first student (s)9.211.3
Mean evacuation time (s)81.785.1
Total evacuation time (s)154.2156.2

Appendix C

Figure A13. The space model of decks. (a) Deck 10; (b) Deck 9; (c) Deck 8; (d) Deck 7; (e) Deck 6; (f) Deck 5; (g) Deck 4; (h) Deck 3; (i) Deck 2; (j) Deck 1.
Applsci 12 04213 g0a13aApplsci 12 04213 g0a13bApplsci 12 04213 g0a13c
Table A2. The dimensions and areas of the decks.
DecksArea (m2)Length (m)Maximum Breath (m)
Deck 1090053.5 (Stern Area)12.6 (Stern Area)
35.3 (Bow Area)15 (Bow Area)
Deck 92250155.725.2
Deck 84520167.829.2
Deck 74860177.731.2
Deck 64725182.226.6
Deck 54920188.826.6
Deck 45090195.126.6
Deck 35160197.926.6
Deck 26550224.131.2
Deck 16130218.031.4
Table A3. The detailed descriptions of parameters, variables, and functions in the passenger agent.
ItemsFunctional Description
PedTypeStores types of passengers.
InitialDeckStores initial decks where passengers are located.
InitialCoordinateX,Stores initial locations of passengers.
InitialCoordinateY
MVZStores initial MVZs where passengers are located.
idStores identifications of passengers.
list_typeThe linked list stores passenger attributes
id_passengersTemporarily stores the passenger id
setType,The setType function sets the proportion and type of the passenger. The setType function calls setPedDistribution and ListDistribution functions to generate passenger attributes, and finally returns the generated result to the setType function.
setPedDistribution,
ListDistribution
Find_Location_LineSets the wayfinding pattern of passengers.
Judge_StairsTypeSets the judgment pattern of passengers on the type of stairs.
setPedSpeed_min,Sets the range of walking speed of different types of passengers on flat terrains.
setPedSpeed_max
setPedSpeed_StairsUp_min,Sets the range of the walking speed of different types of passengers on stairs.
setPedSpeed_StairsUp_max,
setPedSpeed_StairsDown_min,
setPedSpeed_StairsDown_max

References

  1. Luo, M. How to Guide Emergency Evacuations on Cruise Ships? Modelling with Optimization and Simulation Methodology. Master’s Thesis, Norwegian School of Economics, Bergen, Norway, 2019. [Google Scholar]
  2. Wang, X.; Liu, Z.; Zhao, Z.; Wang, J.; Loughney, S.; Wang, H. Passengers’ likely behaviour based on demographic difference during an emergency evacuation in a Ro-Ro passenger ship. Saf. Sci. 2020, 129, 104803. [Google Scholar] [CrossRef]
  3. Wang, X.; Liu, Z.; Wang, J.; Loughney, S.; Zhao, Z.; Cao, L. Passengers’ safety awareness and perception of wayfinding tools in a Ro-Ro passenger ship during an emergency evacuation. Saf. Sci. 2021, 137, 105189. [Google Scholar] [CrossRef]
  4. Casareale, C.; Bernardini, G.; Bartolucci, A.; Marincioni, F.; Orazio, M.D. Cruise ships like buildings: Wayfinding solutions to improve emergency evacuation. Build. Simul. China 2017, 10, 989–1003. [Google Scholar] [CrossRef]
  5. Fire Safety Engineering Group. Available online: https://fseg.gre.ac.uk/ShipEvacSeminar/index.html (accessed on 5 March 2022).
  6. Galea, E.R.; Brown, R.C.; Filippidis, L.; Deere, S. Collection of Evacuation Data for Large Passenger Vessels at Sea. In Pedestrian and Evacuation Dynamics; Springer: Boston, MA, USA, 2011; pp. 163–172. [Google Scholar] [CrossRef] [Green Version]
  7. Galea, E.R.; Deere, S.J.; Brown, R.; Filippidis, L. A validation data-set and suggested validation protocol for ship evacuation models. Fire Saf. Sci. 2014, 11, 1115–1128. [Google Scholar] [CrossRef] [Green Version]
  8. Nasso, C.; Bertagna, S.; Mauro, F.; Marino, A.; Bucci, V. Simplified and Advanced Approaches for Evacuation Analysis of Passenger Ships in the Early Stage of Design. Brodogradnja 2019, 70, 43–59. [Google Scholar] [CrossRef]
  9. Gwynne, S.; Galea, E.R.; Lyster, C.; Glen, I. Analysing the Evacuation Procedures Employed on a Thames Passenger Boat Using the maritimeEXODUS Evacuation Model. Fire Technol. 2003, 39, 225–246. [Google Scholar] [CrossRef]
  10. Gwynne, S.; Filippidis, L.; Galea, E.R.; Cooney, D.; Boxall, P. Data Collection in Support of the Modelling of Naval Vessels. In Pedestrian and Evacuation Dynamics 2005; Springer: Berlin/Heidelberg, Germany, 2007; pp. 443–454. [Google Scholar] [CrossRef]
  11. Vassalos, D.; Kim, H.S.; Christiansen, G.; Majumder, J.; Schreckenberg, M.; Sharma, S.D. A MMesoscopic Model for Passenger Evacuation in a Virtual Ship-Sea Environment and Performance-Based Evaluation. In Pedestrian and Evacuation Dynamics; Springer: Amsterdam, The Netherlands, 2002; pp. 369–391. [Google Scholar]
  12. Vassalos, D.; Guarin, L.; Vassalos, G.C.; Bole, M.; Kim, H.S.; Majumder, J. Advanced Evacuation Analysis–Testing the Ground on Ships. In Proceedings of the 2nd International Conference on Pedestrian and Evacuation Dynamics, Greenwich, UK, 20–22 August 2003. [Google Scholar]
  13. Ginnis, A.I.; Kostas, K.V.; Politis, C.G.; Kaklis, P.D. VELOS: A VR platform for ship-evacuation analysis. Comput. Aided Des. 2010, 42, 1045–1058. [Google Scholar] [CrossRef] [Green Version]
  14. Ginnis, A.I.; Kostas, K.V.; Politis, C.G.; Kaklis, P.D. VELOS—A VR Environment for Ship Applications: Current Status and Planned Extensions. In Proceedings of the Virtual Realities: International Dagstuhl Seminar, Wadern, Germany, 9–14 June 2013; pp. 33–55. [Google Scholar] [CrossRef] [Green Version]
  15. Kostas, K.V.; Ginnis, A.A.I.; Politis, C.G.; Kaklis, P.D. Motions Effect for Crowd Modeling Aboard Ships. In Pedestrian and Evacuation Dynamics 2012; Springer: Cham, Switzerland, 2012; pp. 825–833. [Google Scholar] [CrossRef]
  16. Meyer-König, T.; Valanto, P.; Povel, D. Implementing Ship Motion in AENEAS—Model Development and First Results. In Pedestrian and Evacuation Dynamics 2005; Springer: Berlin/Heidelberg, Germany, 2005; pp. 429–441. [Google Scholar] [CrossRef]
  17. Hu, M.; Cai, W. Evacuation simulation and layout optimization of cruise ship based on cellular automata. Int. J. Comput. Appl. 2020, 42, 36–44. [Google Scholar] [CrossRef]
  18. Hu, M.; Cai, W.; Zhao, H. Simulation of passenger evacuation process in cruise ships based on a multi-grid model. Symmetry 2019, 11, 1166. [Google Scholar] [CrossRef] [Green Version]
  19. Ni, B.; Li, Z.; Li, X. Agent-Based Evacuation in Passenger Ships Using a Goal-Driven Decision-Making Model. Pol. Marit. Res. 2017, 24, 56–67. [Google Scholar] [CrossRef] [Green Version]
  20. Ni, B.; Lin, Z.; Li, P. Agent-based evacuation model incorporating life jacket retrieval and counterflow avoidance behavior for passenger ships. J. Stat. Mech. Theory Exp. 2018, 2018, 123405. [Google Scholar] [CrossRef]
  21. Bellas, R.; Martínez, J.; Rivera, I.; Touza, R.; Gómez, M.; Carreño, R. Analysis of Naval Ship Evacuation Using Stochastic Simulation Models and Experimental Data Sets. Comput. Modeling Eng. Sci. 2020, 122, 971–995. [Google Scholar] [CrossRef]
  22. Hu, Y.; Zhang, J.; Song, W.; Bode, N.W.F. Social groups barely change the speed-density relationship in unidirectional pedestrian flow, but affect operational behaviours. Saf. Sci. 2021, 139, 105259. [Google Scholar] [CrossRef]
  23. Bode, N.W.F.; Stefan, H.; Wolfgang, M.; Armin, S.; Gaoxi, X. Disentangling the Impact of Social Groups on Response Times and Movement Dynamics in Evacuations. PLoS ONE 2015, 10, e121227. [Google Scholar] [CrossRef] [Green Version]
  24. Lu, L.; Chan, C.; Wang, J.; Wang, W. A study of pedestrian group behaviors in crowd evacuation based on an extended floor field cellular automaton model. Transp. Res. Part C Emerg. Technol. 2017, 81, 317–329. [Google Scholar] [CrossRef]
  25. Zhao, P.; Sun, L.; Yao, L.; Cui, L.; Zhang, K. Analysis of Impact of Group Walking Patterns on Pedestrian Evacuation. Transp. Res. Rec. 2017, 2604, 71–81. [Google Scholar] [CrossRef]
  26. Zhang, B.; Chen, W.; Ma, X.; Qiu, P.; Liu, F. Experimental study on pedestrian behavior in a mixed crowd of individuals and groups. Phys. A Stat. Mech. Its Appl. 2020, 556, 124814. [Google Scholar] [CrossRef]
  27. Fu, L.; Cao, S.; Shi, Y.; Chen, S.; Yang, P.; Fang, J. Walking behavior of pedestrian social groups on stairs: A field study. Saf. Sci. 2019, 117, 447–457. [Google Scholar] [CrossRef]
  28. Turgut, Y.; Bozdag, C.E. Modeling pedestrian group behavior in crowd evacuations. Fire Mater. 2021, 46, 420–442. [Google Scholar] [CrossRef]
  29. Haghani, M.; Sarvi, M.; Shahhoseini, Z.; Boltes, M. Dynamics of social groups’ decision-making in evacuations. Transp. Res. Part C Emerg. Technol. 2019, 104, 135–157. [Google Scholar] [CrossRef]
  30. von Krüchten, C.; Müller, F.; Svachiy, A.; Wohak, O.; Schadschneider, A. Empirical Study of the Influence of Social Groups in Evacuation Scenarios. In Traffic and Granular Flow 15; Springer: Cham, Switzerland, 2016; pp. 65–72. [Google Scholar] [CrossRef]
  31. Li, L.; Ding, N.; Ma, Y.; Zhang, H.; Jin, H. Social Relation Network and group behavior based on evacuation experiments. Phys. A Stat. Mech. Its Appl. 2020, 545, 123518. [Google Scholar] [CrossRef]
  32. Ma, Y.; Li, L.; Zhang, H.; Chen, T. Experimental study on small group behavior and crowd dynamics in a tall office building evacuation. Phys. A Stat. Mech. Its Appl. 2017, 473, 488–500. [Google Scholar] [CrossRef]
  33. Xie, W.; Lee, E.W.M.; Cheng, Y.; Shi, M.; Cao, R.; Zhang, Y. Evacuation performance of individuals and social groups under different visibility conditions: Experiments and surveys. Int. J. Disaster Risk Reduct. 2020, 47, 101527. [Google Scholar] [CrossRef]
  34. von Krüchten, C.; Schadschneider, A. Group Parameters for Social Groups in Evacuation Scenarios. In Traffic and Granular Flow 17; Springer: Cham, Switzerland, 2019; pp. 255–263. [Google Scholar] [CrossRef]
  35. Müller, F.; Wohak, O.; Schadschneider, A. Study of Influence of Groups on Evacuation Dynamics Using a Cellular Automaton Model. Transp. Res. Procedia 2014, 2, 168–176. [Google Scholar] [CrossRef] [Green Version]
  36. Tang, T.; Shao, Y.; Chen, L. Modeling pedestrian movement at the hall of high-speed railway station during the check-in process. Phys. A Stat. Mech. Its Appl. 2017, 467, 157–166. [Google Scholar] [CrossRef]
  37. Postorino, M.N.; Mantecchini, L.; Malandri, C.; Paganelli, F. Airport Passenger Arrival Process: Estimation of Earliness Arrival Functions. Transp. Res. Procedia 2019, 37, 338–345. [Google Scholar] [CrossRef]
  38. Guo, S.; Yu, L.; Chen, X.; Zhang, Y. Modelling waiting time for passengers transferring from rail to buses. Transp. Plan. Technol. 2011, 34, 795–809. [Google Scholar] [CrossRef]
  39. Kaparias, I.; Rossetti, C.; Trozzi, V. Analysing passenger arrivals rates and waiting time at bus stops. In Proceedings of the 94th Annual Meeting of the Transportation Research Board, Washington, DC, USA, 11–15 January 2015. [Google Scholar]
  40. Csikos, D.; Currie, G. Investigating consistency in transit passenger arrivals: Insights from longitudinal automated fare collection data. Transp. Res. Rec. 2008, 2042, 12–19. [Google Scholar] [CrossRef]
  41. Jianhong, Y.; Xiaohong, C. Optimal measurement interval for pedestrian traffic flow modeling. J. Transp. Eng. 2011, 137, 934–943. [Google Scholar] [CrossRef]
  42. Das, P.; Parida, M.; Bhaskar, A.; Katiyar, V.K. Optimization technique for pedestrian data extraction. Transp. Res. Procedia 2016, 17, 32–42. [Google Scholar] [CrossRef]
  43. Kieu, L.M.; Cai, C. Stochastic collective model of public transport passenger arrival process. IET Intell. Transp. Syst. 2018, 12, 1027–1035. [Google Scholar] [CrossRef]
  44. Ingvardson, J.B.; Nielsen, O.A.; Raveau, S.; Nielsen, B.F. Passenger arrival and waiting time distributions dependent on train service frequency and station characteristics: A smart card data analysis. Transp. Res. Part C Emerg. Technol. 2018, 90, 292–306. [Google Scholar] [CrossRef] [Green Version]
  45. Luethi, M. Passenger arrival rates at public transport stations. In Proceedings of the TRB 86th Annual Meeting Compendium of Papers, Washington, DC, USA, 21–25 January 2007. [Google Scholar]
  46. Rindone, C.; Panuccio, P. Risk reduction in transport system in emergency conditions: A framework for evacuation planning. Saf. Secur. Eng. IX 2022, 206, 285–297. [Google Scholar] [CrossRef]
  47. International Maritime Organization. Guidelines for Evacuation Analysis for New and Existing Passenger Ships; International Maritime Organization: London, UK, 2016; p. 5. [Google Scholar]
  48. International Maritime Organization. International Code for Fire Safety Systems; International Maritime Organization: London, UK, 2000; p. 31. [Google Scholar]
  49. Brown, R.; Galea, E.R.; Deere, S.; Filippidis, L. Passenger Response Time Data-Sets for Large Passenger Ferries and Cruise Ships Derived from Sea Trials and Recommendations to IMO to Update MSC Circ 1238; The Royal Institution of Naval Architects: London, UK, 2012. [Google Scholar]
  50. Wang, R. Study on Characteristics of Chinese Cruise Tourists Based on Demographic Data. Master’s Thesis, Xiamen University, Xiamen, China, 2018. [Google Scholar]
  51. Li, D.; Han, B. Behavioral effect on pedestrian evacuation simulation using cellular automata. Saf. Sci. 2015, 80, 41–55. [Google Scholar] [CrossRef]
  52. Jiang, R.; Wu, Q. Pedestrian behaviors in a lattice gas model with large maximum velocity. Phys. A Stat. Mech. Its Appl. 2007, 373, 683–693. [Google Scholar] [CrossRef]
  53. Song, W.; Xu, X.; Wang, B.; Ni, S. Simulation of evacuation processes using a multi-grid model for pedestrian dynamics. Phys. A Stat. Mech. Its Appl. 2006, 363, 492–500. [Google Scholar] [CrossRef]
  54. Helbing, D.; Molnar, P. Social force model for pedestrian dynamics. Phys. Rev. E 1995, 51, 4282–4286. [Google Scholar] [CrossRef] [Green Version]
  55. The AnyLogic Software. Available online: https://www.anylogic.com/ (accessed on 5 March 2022).
  56. Joo, J.; Kim, N.; Wysk, R.A.; Rothrock, L.; Son, Y.; Oh, Y.; Lee, S. Agent-based simulation of affordance-based human behaviors in emergency evacuation. Simul. Model. Pract. 2013, 32, 99–115. [Google Scholar] [CrossRef]
  57. Zuo, J.; Shi, J.; Li, C.; Mu, T.; Zeng, Y.; Dong, J. Simulation and optimization of pedestrian evacuation in high-density urban areas for effectiveness improvement. Environ. Impact Assess. Rev. 2021, 87, 106521. [Google Scholar] [CrossRef]
  58. Tang, Y.; Xia, N.; Lu, Y.; Varga, L.; Li, Q.; Chen, G.; Luo, J. BIM-based safety design for emergency evacuation of metro stations. Autom. Constr. 2021, 123, 103511. [Google Scholar] [CrossRef]
  59. Lei, W.; Li, A.; Gao, R.; Zhou, N.; Mei, S.; Tian, Z. Experimental study and numerical simulation of evacuation from a dormitory. Phys. A Stat. Mech. Its Appl. 2012, 391, 5189–5196. [Google Scholar] [CrossRef]
Figure 1. The space distribution of the cruise ship.
Applsci 12 04213 g001
Figure 2. The double-run staircase.
Applsci 12 04213 g002
Figure 3. The double-divided staircase.
Applsci 12 04213 g003
Figure 4. The single-run staircase.
Applsci 12 04213 g004
Figure 5. The description of the method.
Applsci 12 04213 g005
Figure 6. The space model of Deck 2.
Applsci 12 04213 g006
Figure 7. The space model of the cruise ship.
Applsci 12 04213 g007
Figure 8. The passenger agent.
Applsci 12 04213 g008
Figure 9. The simulation process of passenger evacuation.
Applsci 12 04213 g009
Figure 10. The snapshots of the evacuation simulation. (a) Deck 7; (b) Deck 3.
Applsci 12 04213 g010
Figure 11. The arrival time distributions of passenger evacuation. (a) The day-individual scenario; (b) the day-group scenario; (c) the night-individual scenario; (d) the night-group scenario.
Applsci 12 04213 g011
Figure 12. The initial positions of the first 10% of arriving passengers under night scenarios. (a) The night-individual scenario; (b) the night-group scenario.
Applsci 12 04213 g012
Figure 13. The initial positions of the last 10% of arriving passengers under night scenarios. (a) The night-individual scenario; (b) the night-group scenario.
Applsci 12 04213 g013aApplsci 12 04213 g013b
Figure 14. The MVZs of the first 10% of arriving passengers under night scenarios; (a) the night-individual scenario. (b) the night-group scenario.
Applsci 12 04213 g014
Figure 15. The MVZs of the last 10% of arriving passengers under night scenarios. (a) The night-individual scenario; (b) the night-group scenario.
Applsci 12 04213 g015
Table 1. The initial positions of passengers in the day and night scenarios.
ItemThe Numbers of Passengers
MVZ 1MVZ 2MVZ 3MVZ 4MVZ 5
DayNightDayNightDayNightDayNightDayNight
Deck 1004404808218600
Deck 2580360240520400
Deck 304004400052060
Deck 4036044068048048
Deck 5028036068048044
Deck 6024036068044032
Deck 734022011805484214
Deck 821014054013163624
Deck 910025011090230
Deck 100040204080
Table 2. The percentage and walking speed of passengers.
PassengersPercentage of Passengers (%)Walking Speed on Flat Terrain (m/s)Walking Speed on Stairs (m/s)
Stairs DownStairs Up
TypeCharacteristicsMin.Max.Min.Max.Min.Max.
1Females younger than 30 years70.931.550.560.940.470.79
2Females 30–50 years old70.711.190.490.810.440.74
3Females older than 50 years160.560.940.450.750.370.61
4Females older than 50, mobility impaired (1)100.430.710.340.560.280.46
5Females older than 50, mobility impaired (2)100.370.610.290.490.230.39
6Males younger than 30 years71.111.850.761.260.50.84
7Males 30–50 years old70.971.620.641.070.470.79
8Males older than 50 years160.841.40.50.840.380.64
9Males older than 50, mobility impaired (1)100.641.060.380.640.290.49
10Males older than 50, mobility impaired (2)100.550.910.330.550.250.41
Table 3. The convergence test of the evacuation times.
The Range of Simulation Times Time for Convergence Calculation Under Four Scenarios (s)
The Night-Individual ScenarioThe Night-Group Scenario The Day-Individual Scenario The Day-Group Scenario
T lim T 0.95 mean 50 T 0.95 max 50 T 0.95 min 50 T lim T 0.95 mean 50 T 0.95 max 50 T 0.95 min 50 T lim T 0.95 mean 50 T 0.95 max 50 T 0.95 min 50 T lim T 0.95 mean 50 T 0.95 max 50 T 0.95 min 50
0 to 501675.4 117.9 1492.4 306.0 2163.5 142.9 1927.8 403.1
51 to 1001674.7 171.3 1493.1 297.6 2148.2 168.5 1933.2 345.4
101 to 1501680.9 142.5 1475.9 295.2 2162.6 129.5 1925.5 409.7
151 to 2001673.4 144.3 1494.4 244.8 2163.0 137.4 1924.3 341.8
201 to 2501675.0 123.6 1487.2 237.9 2152.4 157.9 1910.5 417.1
251 to 3001675.5 150.6 1471.6 393.9 2147.3 194.2 1909.4 409.1
301 to 3501670.6 167.4 1465.1 419.7 2159.5 132.9 1939.5 302.9
351 to 4001670.2 168.9 1499.8 253.5 2156.5 141.2 1943.1 439.7
401 to 4501678.1 121.2 1489.4 293.4 2153.1 214.6 1946.8 333.7
451 to 5001675.6 137.7 1492.6 231.3 2142.4 186.8 1910.7 460.6
Table 4. Proportions of passengers on different decks.
DecksFirst 10% of Arriving PassengersLast 10% of Arriving Passengers
Day-IndividualDay-GroupNight-IndividualNight-GroupDay-IndividualDay-GroupNight-IndividualNight-Group
Deck138.29%36.81%4.18%3.91%2.13%5.01%--
Deck261.70%63.18%--1.50%0.73%--
Deck3--38.33%37.04%--10.11%7.25%
Deck4--35.80%35.87%--19.48%17.14%
Deck5--15.22%16.33%--24.70%25.77%
Deck6--6.46%6.86%--25.46%27.92%
Deck7----35.06%29.06%6.47%6.67%
Deck8----34.48%36.32%13.79%15.24%
Deck9----22.32%24.05%--
Deck10----4.51%4.81%--
Table 5. Proportions of passengers in different MVZs.
MVZFirst 10% of Arriving PassengersLast 10% of Arriving Passengers
Day-IndividualDay-groupNight-IndividualNight-GroupDay-IndividualDay-GroupNight-IndividualNight-Group
111.41%13.22%11.06%9.28%10.58%10.13%18.46%19.39%
227.23%27.17%20.15%20.68%15.86%14.69%5.80%6.79%
332.73%29.64%23.45%27.01%31.27%24.14%4.60%3.84%
419.75%21.11%28.69%27.40%8.78%13.82%8.82%11.39%
58.89%8.87%16.65%15.63%33.50%37.22%62.32%58.59%
Table 6. Proportions of passengers in different types.
Type of PassengersFirst 10% of Arriving PassengersLast 10% of Arriving Passengers
Day-IndividualDay-GroupNight-IndividualNight-GroupDay-IndividualDay-GroupNight-IndividualNight-Group
110.20%9.49%10.71%9.73%2.51%4.04%3.12%4.18%
27.75%7.76%8.09%7.99%4.44%5.14%4.71%5.40%
313.33%13.76%12.93%14.07%16.16%15.21%15.90%15.20%
45.60%5.77%3.92%5.51%18.55%15.78%18.01%15.23%
54.09%4.40%2.16%3.76%24.87%20.63%24.75%20.59%
611.33%11.28%12.87%11.59%1.53%3.20%1.95%3.33%
710.44%9.84%11.38%10.03%2.33%3.75%2.50%3.85%
820.22%20.15%22.07%20.35%8.02%10.12%7.96%10.47%
99.43%9.45%9.43%9.41%9.00%9.66%8.85%9.67%
107.61%8.08%6.46%7.56%12.61%12.47%12.26%12.09%
Publisher’s Note: MDPI stays neutral with regard to jurisdictional claims in published maps and institutional affiliations.

