1. Introduction
Research published in
The Lancet in 2018 warned that “if current trends continue, the 2025 global physical activity target (i.e., a 10% relative reduction in insufficient physical activity) will not be met,” urging the implementation of policies to increase population levels of physical activity worldwide [
1,
2]. Considering the overall percentage of insufficient physical activity, high-income Western countries register the rate of 36.8%, whereas Central and Eastern Europe fares better at 23.4%.
According to the the World Health Organization (WHO), walking is “a great way to get the physical activity needed to obtain health benefits” and strategies to promote it should therefore be pursued [
3]. Walking does not require any specific skills, which means it is performable by most of the population. This is defined by Objective 3.1 of the Physical Activity Strategy for the WHO European Region 2016–2025 as reduction of car traffic and increase of walking and cycling suitability. However, if the aim is to motivate people to walk, it is necessary to create a supportive pedestrian environment with walkable features (quality sidewalks and destinations) and places that are felt to be safe, convenient, and empowering physical activity.
This is in line with the Sustainable Development Goals (SDG) for good health and well-being (SDG3) and sustainable cities and communities (SDG11), and with the Health 2020 European Policy for Health and Well-being. Effective policies include improving provisions for cycling and walking infrastructure, improving road safety and creating more opportunities for physical activity in public open spaces and parks, in workplaces and in other local community settings [
4]. That means citizens’ opinions about the quality of the pedestrian space and their improvement to meet users’ expectations must be heard.
Over the last ten years, digital tools, social networks, and applications have played a main role in our everyday lives [
5,
6,
7]. This new way of communicating has already sharpened urban life through more dynamic exchange of information [
8,
9]. Furthermore, virtual performances posted by the users of social networks such as Facebook, Instagram, Twitter and other open-generated data may help urban designers to collect necessary information about cognitive and perceptive impressions of the users.
Since we are living in a time of smartphone revolution, a new field of research possibilities has opened, due to its technological features. This can be seen in the growing interest across urban design in understanding the role played by new location-based media and the impact of the increasing availability of urban digital data from various sources [
10]. With the development of social media and social networks, online platforms [
11] have become a place for sharing opinions and not just a place for sharing details about personal daily lives. Social network users use these platforms to express their opinions about services, products, events, public individuals, public locations, etc. The experience of citizens and visitors in cities can now be shared through pictures, videos, posts, and check-ins, while social media has become a vital information source through which different urban phenomena can be explored [
12,
13] and can help to explain a variety of spatial-temporal phenomena [
14]. One aspect of the shared urban environment which is particularly important for planners and policy makers is pedestrian space. Analysis of social media data can give insights into the quality of this space, which can then be used to improve or support its use.
For several years now, much attention has been paid to the transformation of the main city streets of major European cities. Many streets are in capitals such as Paris, Madrid, Brussels, Oslo, Vienna, Copenhagen, Ljubljana, London, etc., and these world-famous streets attract many users, visitors and tourists. On the other hand, the main city street is much more than a place; it is also a state of mind and a set of values [
15]. Transformation of the main city street can have a significant effect in relation to future urban practices and values but also in relation to the quality of life of the citizens of that city.
Having in mind several initiatives and plans concerning the transformation of Oxford Street in London [
16,
17] and the very nature of the changes envisaged for it [
18,
19], this street was taken as an appropriate example to investigate the potential of user-generated data related to public space. In addition to the above, the Oxford Street District is a major part of London’s West End and among the world’s most visited destinations. Approximately 200 million people visit the district each year, around 70% of whom arrive by public transport [
20]. It is also home to over 38,000 residents and employs over 155,000 people. This location was chosen because the planning phase of the transformation of Oxford Street has just begun, and the implementation phase has not started yet at the moment of writing this work. This gives a good basis to be able to collect data from social networks while having a baseline and comparable research conducted using traditional methods of data collection (i.e., surveys and interviews). It is important to mention that a similar study was done between 1 July 2015 and 29 February 2016 for the predefined places of interest in Belgrade, Serbia, when 2872 tweets were collected [
21], but the focus was on tweets with geotags in order to measure the attractiveness of the locations in this city.
In accordance with the above-mentioned factors, this research investigates the user-generated data from Twitter to classify and visualize Twitter data sentiment relating to the pedestrian experience of the quality of open spaces, based on their content. It is one of the most popular data sources for research and offers an opportunity to study human communication and social networks [
22] because of its open network, allowing access to information published through this platform.
Considering the character of social networks and user-generated content, the study reflects tertiary communication as knowledge that is distributed across different individuals and social groups but can be less easily retrieved/usable and operationalised. To find a unique focus for the use of this data, in this research, a sentiment analysis approach was used on Twitter data to map and evaluate user opinions and sentiments related to the specific location, with the goal of classifying them in information clusters about the quality of the pedestrian environment. Classification of Twitter data was done by determining the sentiment of each tweet and classifying them in one of three categories: positive, neutral, and negative sentiments. The results from this analysis were used for consideration of ideas for urban planning of the public space. The location of interest was Oxford Street in London, UK.
Accordingly, this work proposes a basis for identifying issues dealing with a certain public space characteristic that can be further analysed in more depth. Therefore, the research question (RQ1) focuses on extracting common topics from Twitter data that are related to certain public space and investigating whether the collective sentiment on this public space can relate to urban design and improvement of pedestrian space. RQ1 aims to extract semantics (topics of interest for pedestrian space) and sentiments (public’s opinions about environmental elements relating to public pedestrian space). The following question (RQ2) seeks to validate the finding from RQ1 by comparing it with publicly available data on the community opinions about the public space. The overall goal of this work is to map user experience and opinions about the pedestrian space and to detect sentiment clusters around environmental elements that can be further used for urban and public space design. Given the time- and cost-effectiveness of the proposed model, many of the overlooked opinions and elements can be collected and analysed.
2. Materials and Methods
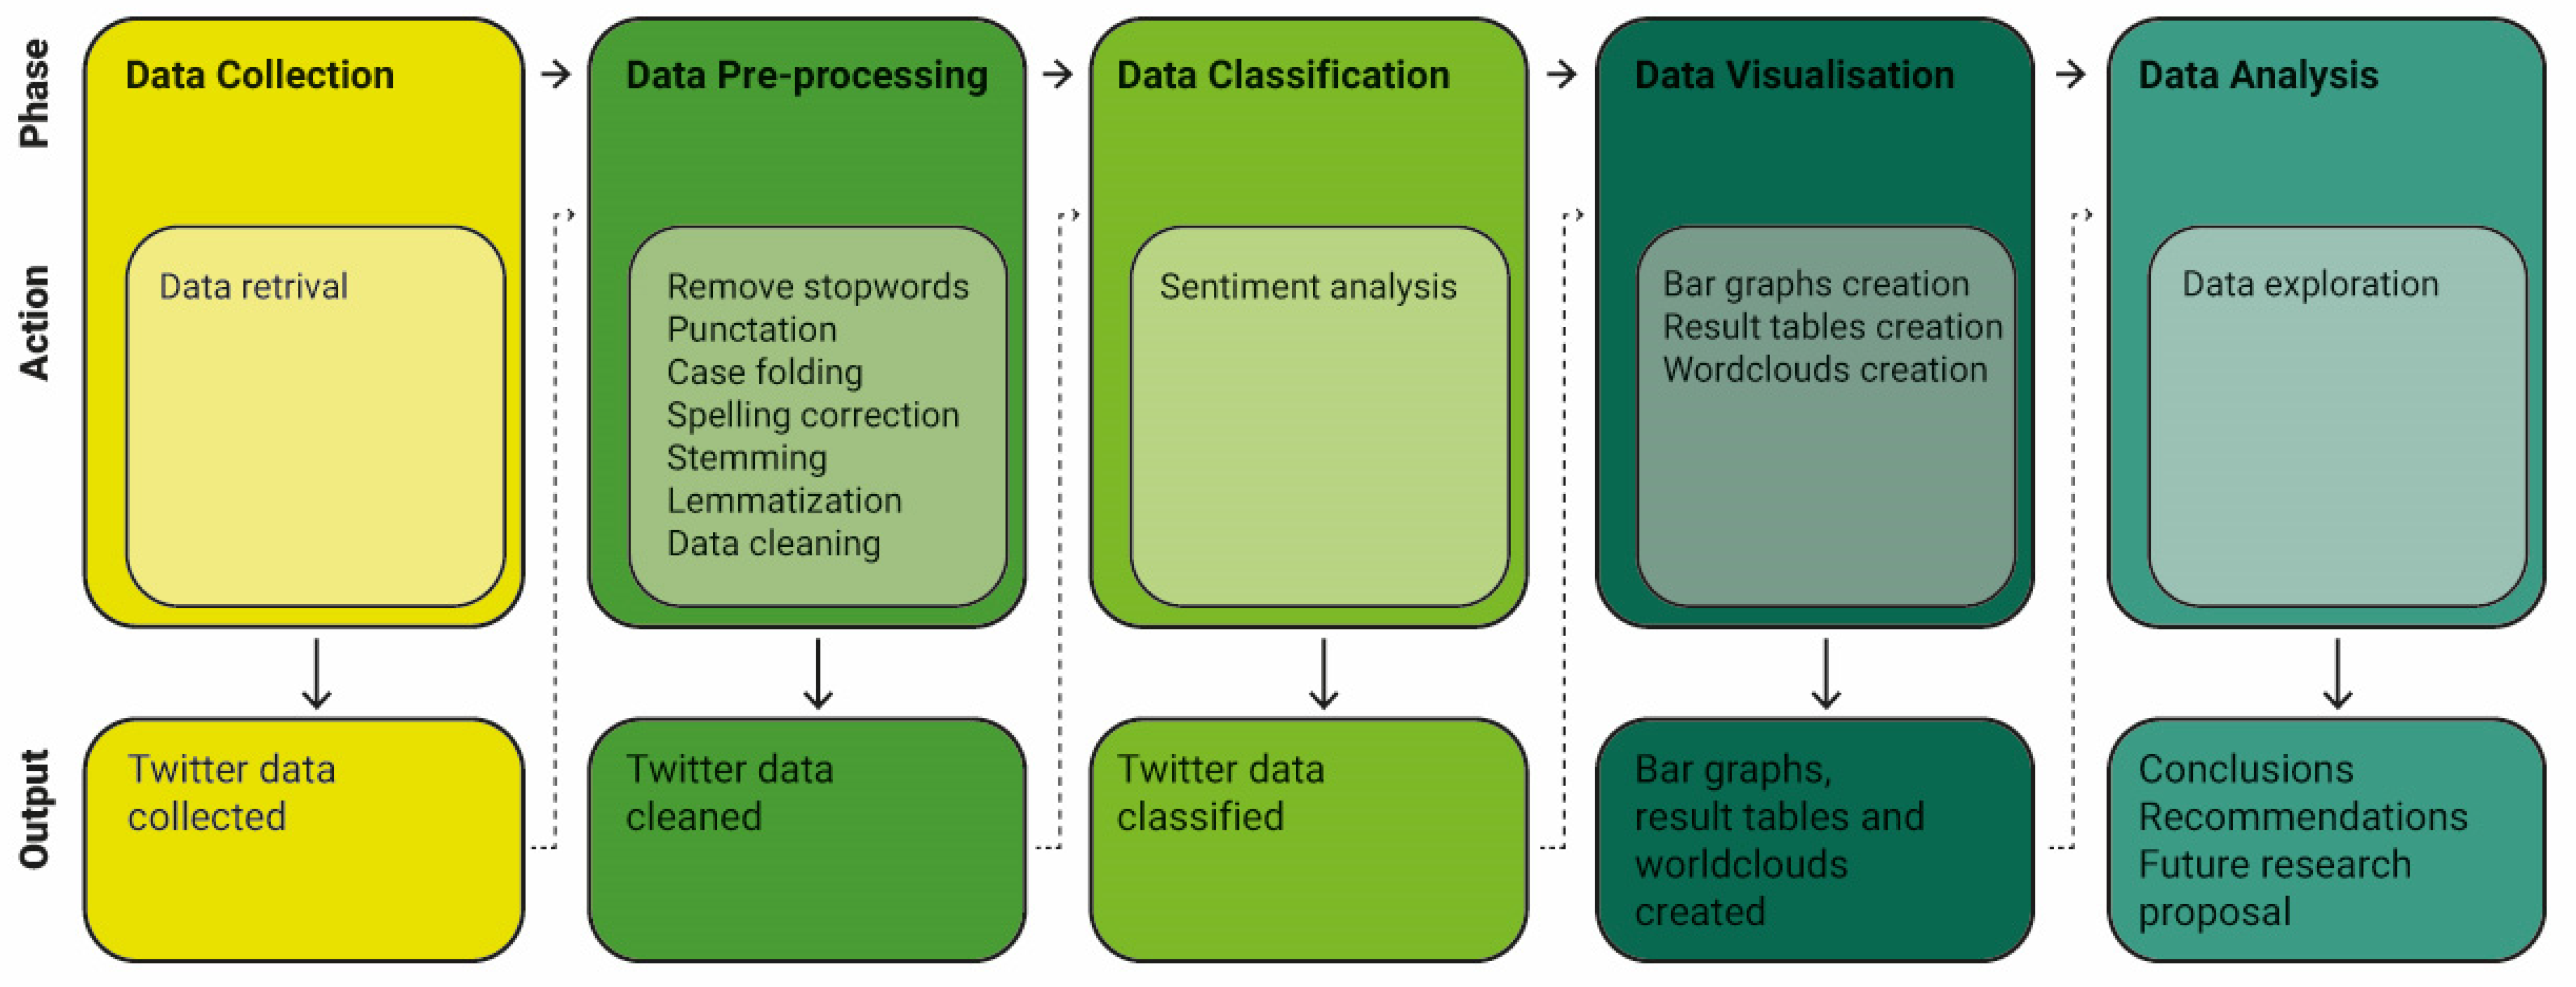
The research methodology for Twitter data collection, processing and analysis is shown in
Figure 1. The flowchart shows several key steps in the research methodology, including data collection, data pre-processing, data classification, data visualisation and data analysis.
Data collection presumes data retrieval from Twitter.
Collected data is retrieved in original format, and it requires processing and “cleaning” of data, which is done during the
Data pre-processing phase.
Cleaned data is further classified in the
Data Classification phase using sentiment analysis methods, which is then visualized (
Data Visualisation) using different statistical and visualisation methods. Once the visualisations are ready, the last phase of this research was conducted through
Data Analysis. Each phase of this research method is further described in the following sections.
2.1. Data Collection
Data used in this study was collected from Twitter in the period from 5 May 2021 to 24 January 2022. Data collection was focused on the location of Oxford Street, London, UK. Data was collected based on geotag and related hashtags. Data was acquired through Twitter API (Application Programming Interface). For
Academic Research, this API allows for collection of 10 million tweets per month, with the limitation of 100 requests per 15 min [
8,
23]. During this period, 24,821 tweets were collected, but after the data “cleaning” process, the final sample was reduced to 23,587 tweets. It is necessary to state that data that was collected during the COVID-19 measures at times included lock down, which may to some extent have influenced opinions, keeping in mind that the citizens wanted to walk down the street and stay in open spaces. This includes certain restrictions on the presence of visitors and tourists, while it can be assumed that during this period there were mostly locals.
During the collection of data certain assumptions were made:
Only tweets in English were collected.
Tweets containing hashtags #oxford, #oxfordstreet, #oxfordst were collected. 738 tweets were collected using these hashtags.
Tweets containing oxford and oxford street in the tweet text were also collected.
Geotagged tweets containing Oxford Street as a place obtained from Twitter’s reverse geocode endpoint in the REST API were collected.
Retweets were removed, as they were considered to be duplicate content.
22,530 tweets were collected using defined hashtags and keywords. Only 327 collected tweets contained geotag, while 27 tweets were collected based on geotagging. Compared to the research conducted during 2015 and 2016 [
21], it can be concluded that Twitter’s modifications of privacy settings, which included significant reinforcements of user data protection and user location, led to smaller samples of tweets with geotags.
2.2. Data Pre-Processing
The phase of
data pre-processing includes several steps that eliminate parts of tweets that contain elements that may unnecessarily affect the sentiment score. The goal is to reduce the “noise” that comes with social networks data, such as links, slang, stop words, etc., as much as possible so that data is in a text format that can be parsed and classified. For these steps, Python’s String methods and the library Natural Language Toolkit (NLTK) were used [
24]. NLTK is a suite of libraries and programs that helps with work in natural language processing (NLP) for English.
Data pre-processing steps include the following:
Capitalization/case-folding—converting upper case to lower case. When case-sensitive analysis is used, two same words can be treated as different.
Punctuation—Removing punctuation, digits and special characters that don’t convey any sentiment.
Remove stop words—removing stop words which do not affect the meaning of the sentence, removing short words that contain 3 or less characters (his, all, are, at, etc.).
Spelling correction—correcting spelling conducted because it could affect the sentiment.
Stemming—normalizing words from the inflected form to be able to analyse words in their root dictionary form. For example, loves, loving, lovable are often used in the same context, and in stemming affixes are eliminated to the root word “love.”
Lemmatization—normalizing words using vocabulary and morphological analysis of words. As in stemming, the word is converted to its root dictionary form; however, unlike in stemming, lemmatization considers context and normalizes words to its meaningful root word (i.e., changing “worse” to “bad”).
Data cleaning—removing URL and username, as this data will not provide any additional information needed for this stage of research.
Examples of tweets before and after data pre-processing are given in
Table 1.
2.3. Data Classification
Data classifications were conducted using a sentiment analysis tool developed by CJ Hutto and Eric Gilbert, VADER (Valence Aware Dictionary and sEntiment Reasoner) [
25]. VADER is a lexicon- and rule-based sentiment analysis tool that is specifically oriented to analyse sentiments in social media data. Each tweet was categorized in one of the sentiment categories: positive, neutral, or negative. VADER sentiment analysis uses a sentiment lexicon: a list of words that are mapped to emotion intensities known as sentiment scores. Sentiment scores are normalized between −1 (most extreme negative) and +1 (most extreme positive). The sentiment score of a text is calculated as a sum of the intensity of each word in the text. Based on the sentiment score, tweets are classified as positive (sentiment score higher than 0), neutral (sentiment score equals to 0) and negative (sentiment score lower than 0). The sentiment score for each tweet is stored in order to make this data available for further analysis of the level of negative or positive sentiments.
2.4. Data Visualisation and Presentation
Data was presented and visualized using tables, bar graphs, word cloud and histograms. Histograms were used to visually represent data distribution and to do finer analysis of sentiments by analysing more deeply within the sentiment classifier. For instance, looking into negative sentiments, it is important to analyse what tweets are more negative than others. Bar graphs were used to visually present the quantity of the specific tweets and their sentiments. A word cloud was used to represent used words based on their frequency. The more that a certain word appears in collected tweets, the larger the font size used to visually present that word in the word cloud.
3. Results
By processing the collected data, using the previously mentioned methodology, the results were obtained, which are presented below.
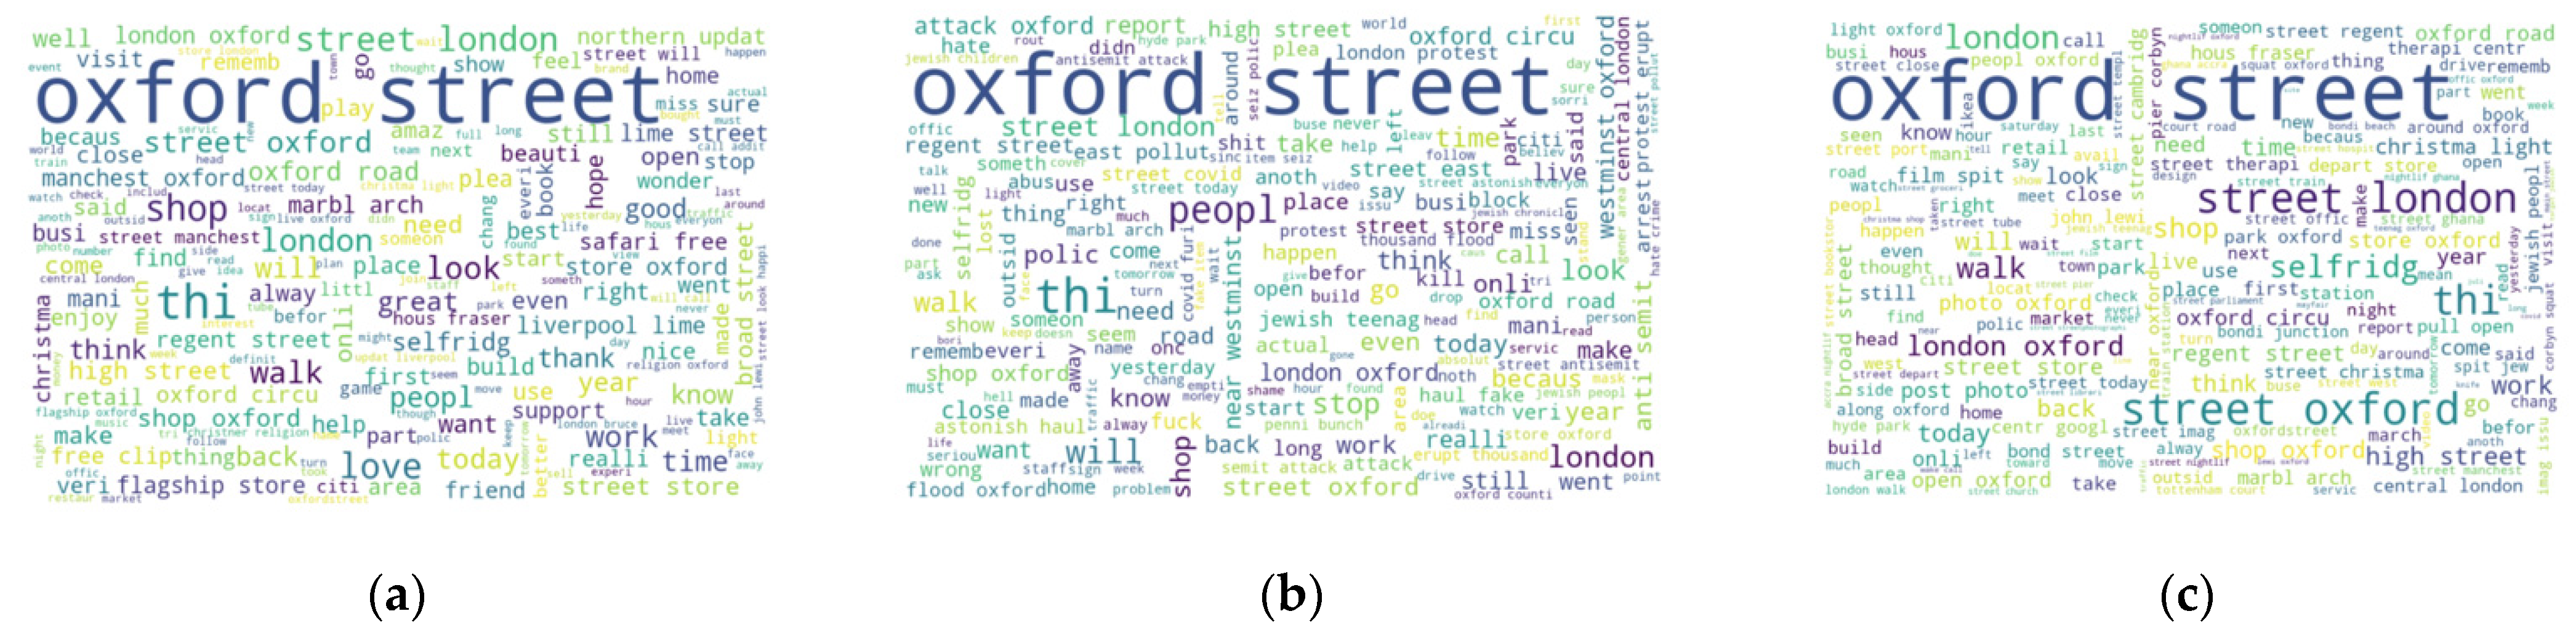
Figure 2a,c represent the words that appear with the highest frequency in tweets, with positive, negative, and neutral sentiment, respectively.
Besides the keywords used for data collection, such as “oxford street”, most frequently used words in positive tweets are
love,
today,
look,
good,
work,
life,
smile and
feel. Similarly, for negative tweets the most frequently used words are
London,
people,
attack,
Jewish,
protest,
stop,
fire,
hate; while in neutral tweets the most frequently used words are
London,
shop,
flagship,
Christmas,
park,
place and
Selfridge (
Table 2).
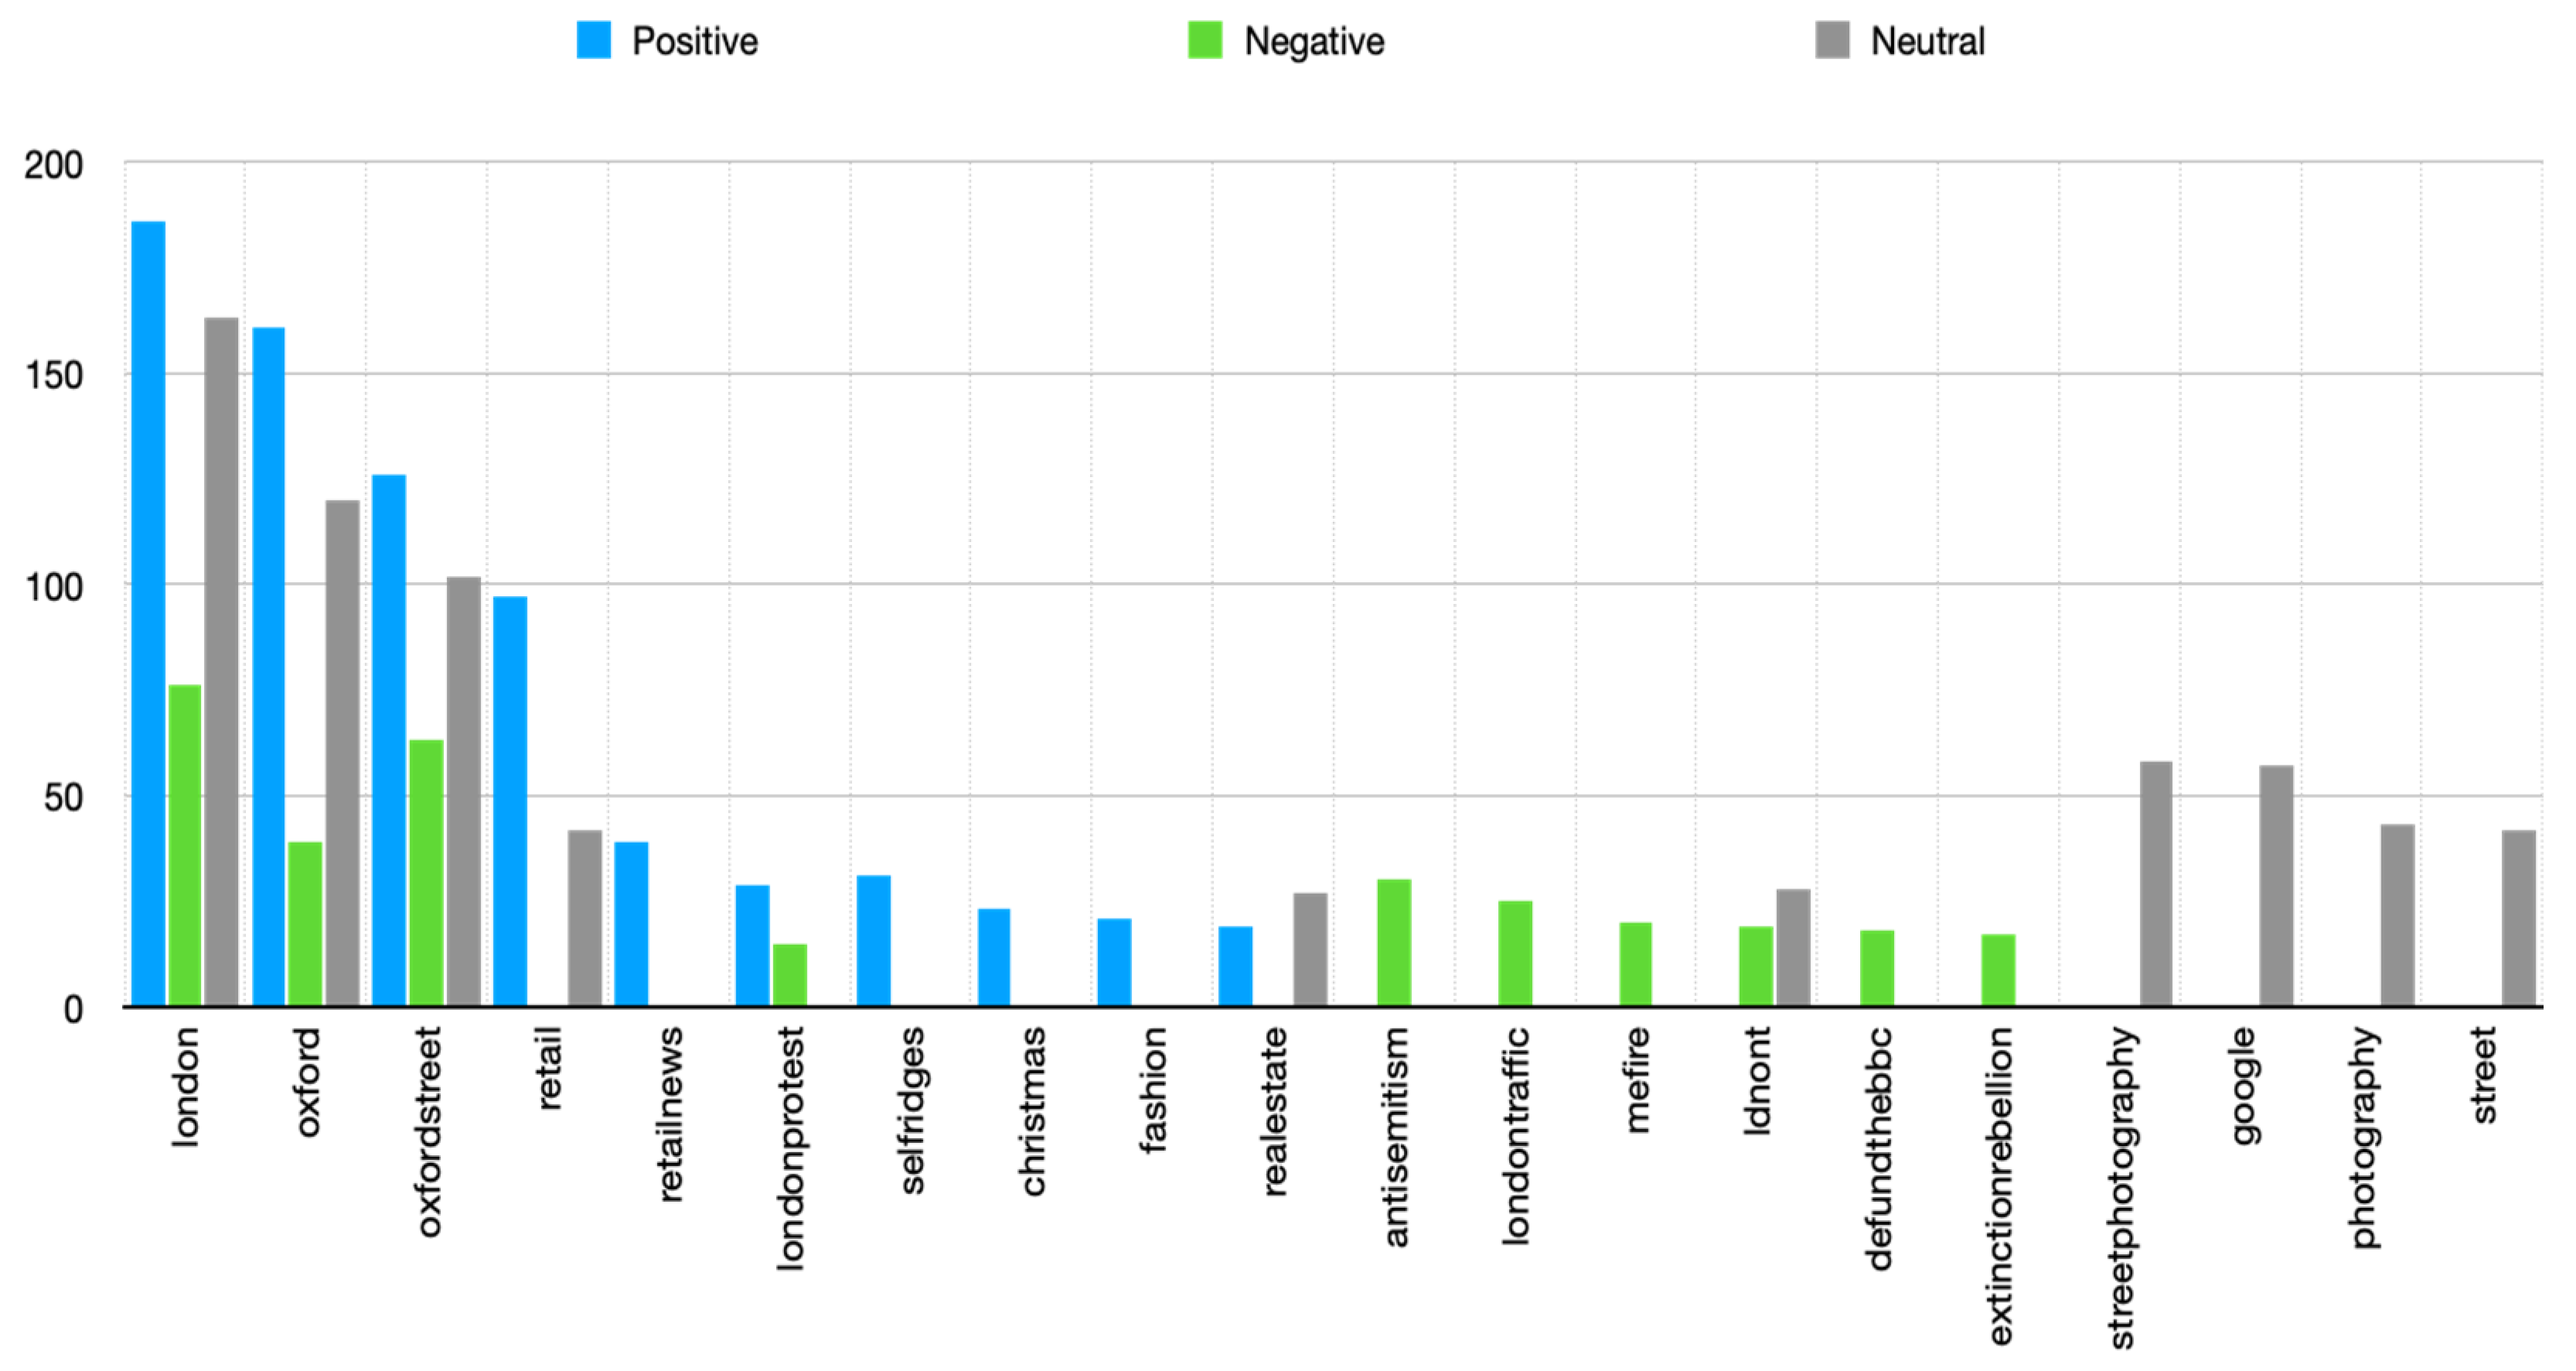
As data was collected based on the assigned keywords and hashtags, it was of interest to analyse what were other related hashtags showing up in the collected tweets.
Table 3 provides this information based on the tweet sentiment, giving the number of tweets in which related hashtags appear and the percentage of the total number of positive, negative and neutral tweets (
Figure 3).
Considering the overall sentiment of the collected tweets, the analysis shows that 40.40% of tweets carry positive sentiment, while 27.73% are negative and 31.87% are neutral (
Table 4).
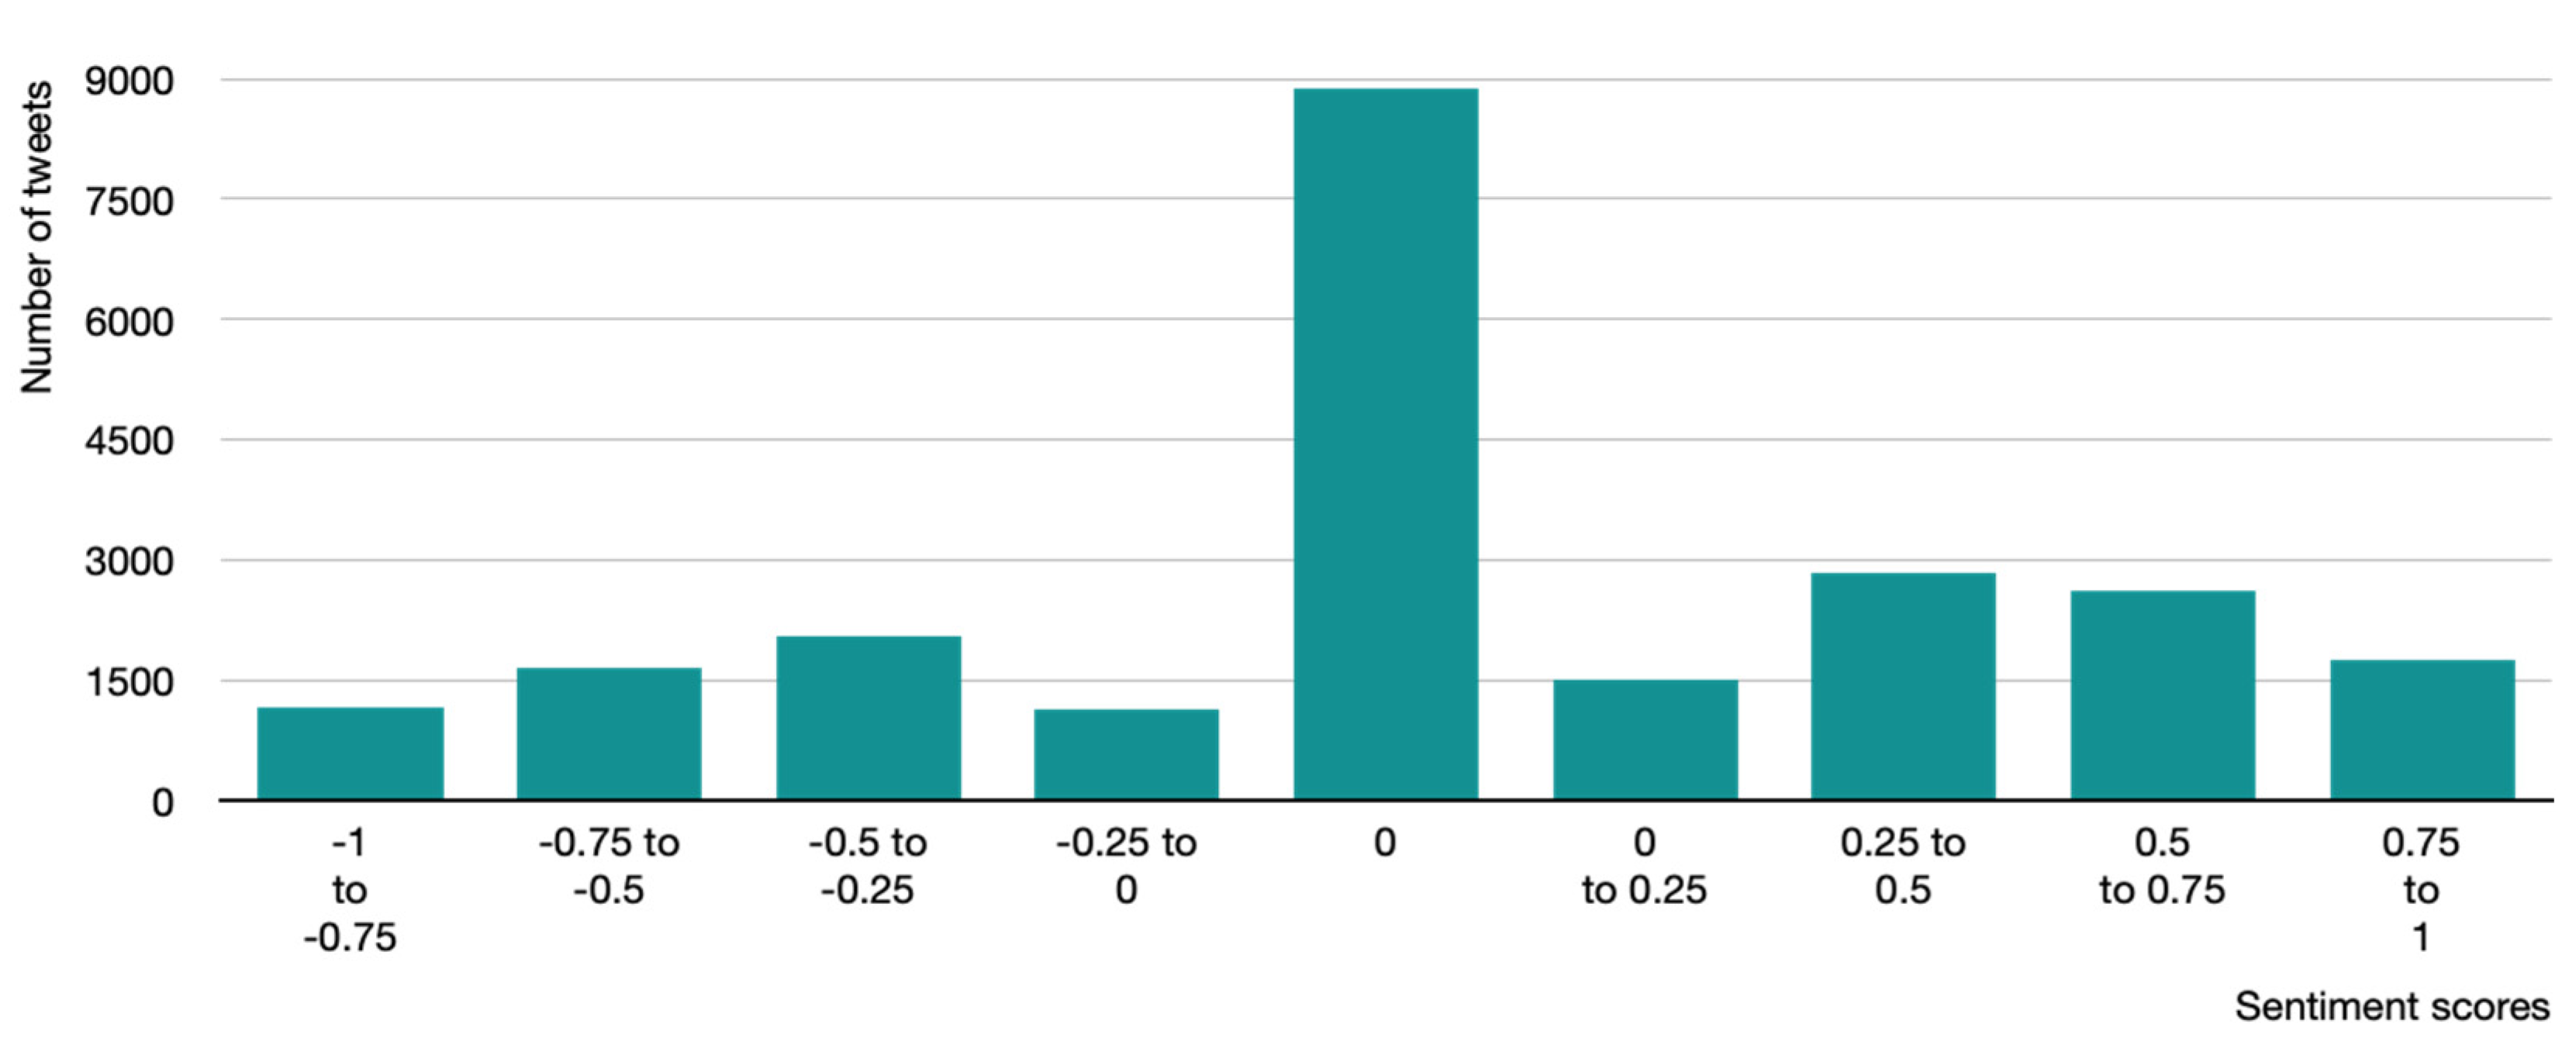
Sentiment for all tweets was further analysed to determine the level of positive and negative sentiment.
Figure 4 shows the number of tweets in specified intervals of sentiment scores. Intervals were assigned in 0.25 increments, while neutral sentiment tweets are positioned at “0.” It can be seen that “weak positive” tweets that follow in the range between 0–0.25 are similar to the tweets that are classified as “strong positive”, 0.75–1.
However, most of the positive tweets are either in the sentiment score range of 0.25–0.5 or 0.5–75 (
Table 5). Similar trends are seen with negative sentiment scores as well, since “weak negative” and “strong negative” do not differ much, whereas the middle range scores are where most of the negative sentiment scores fall.
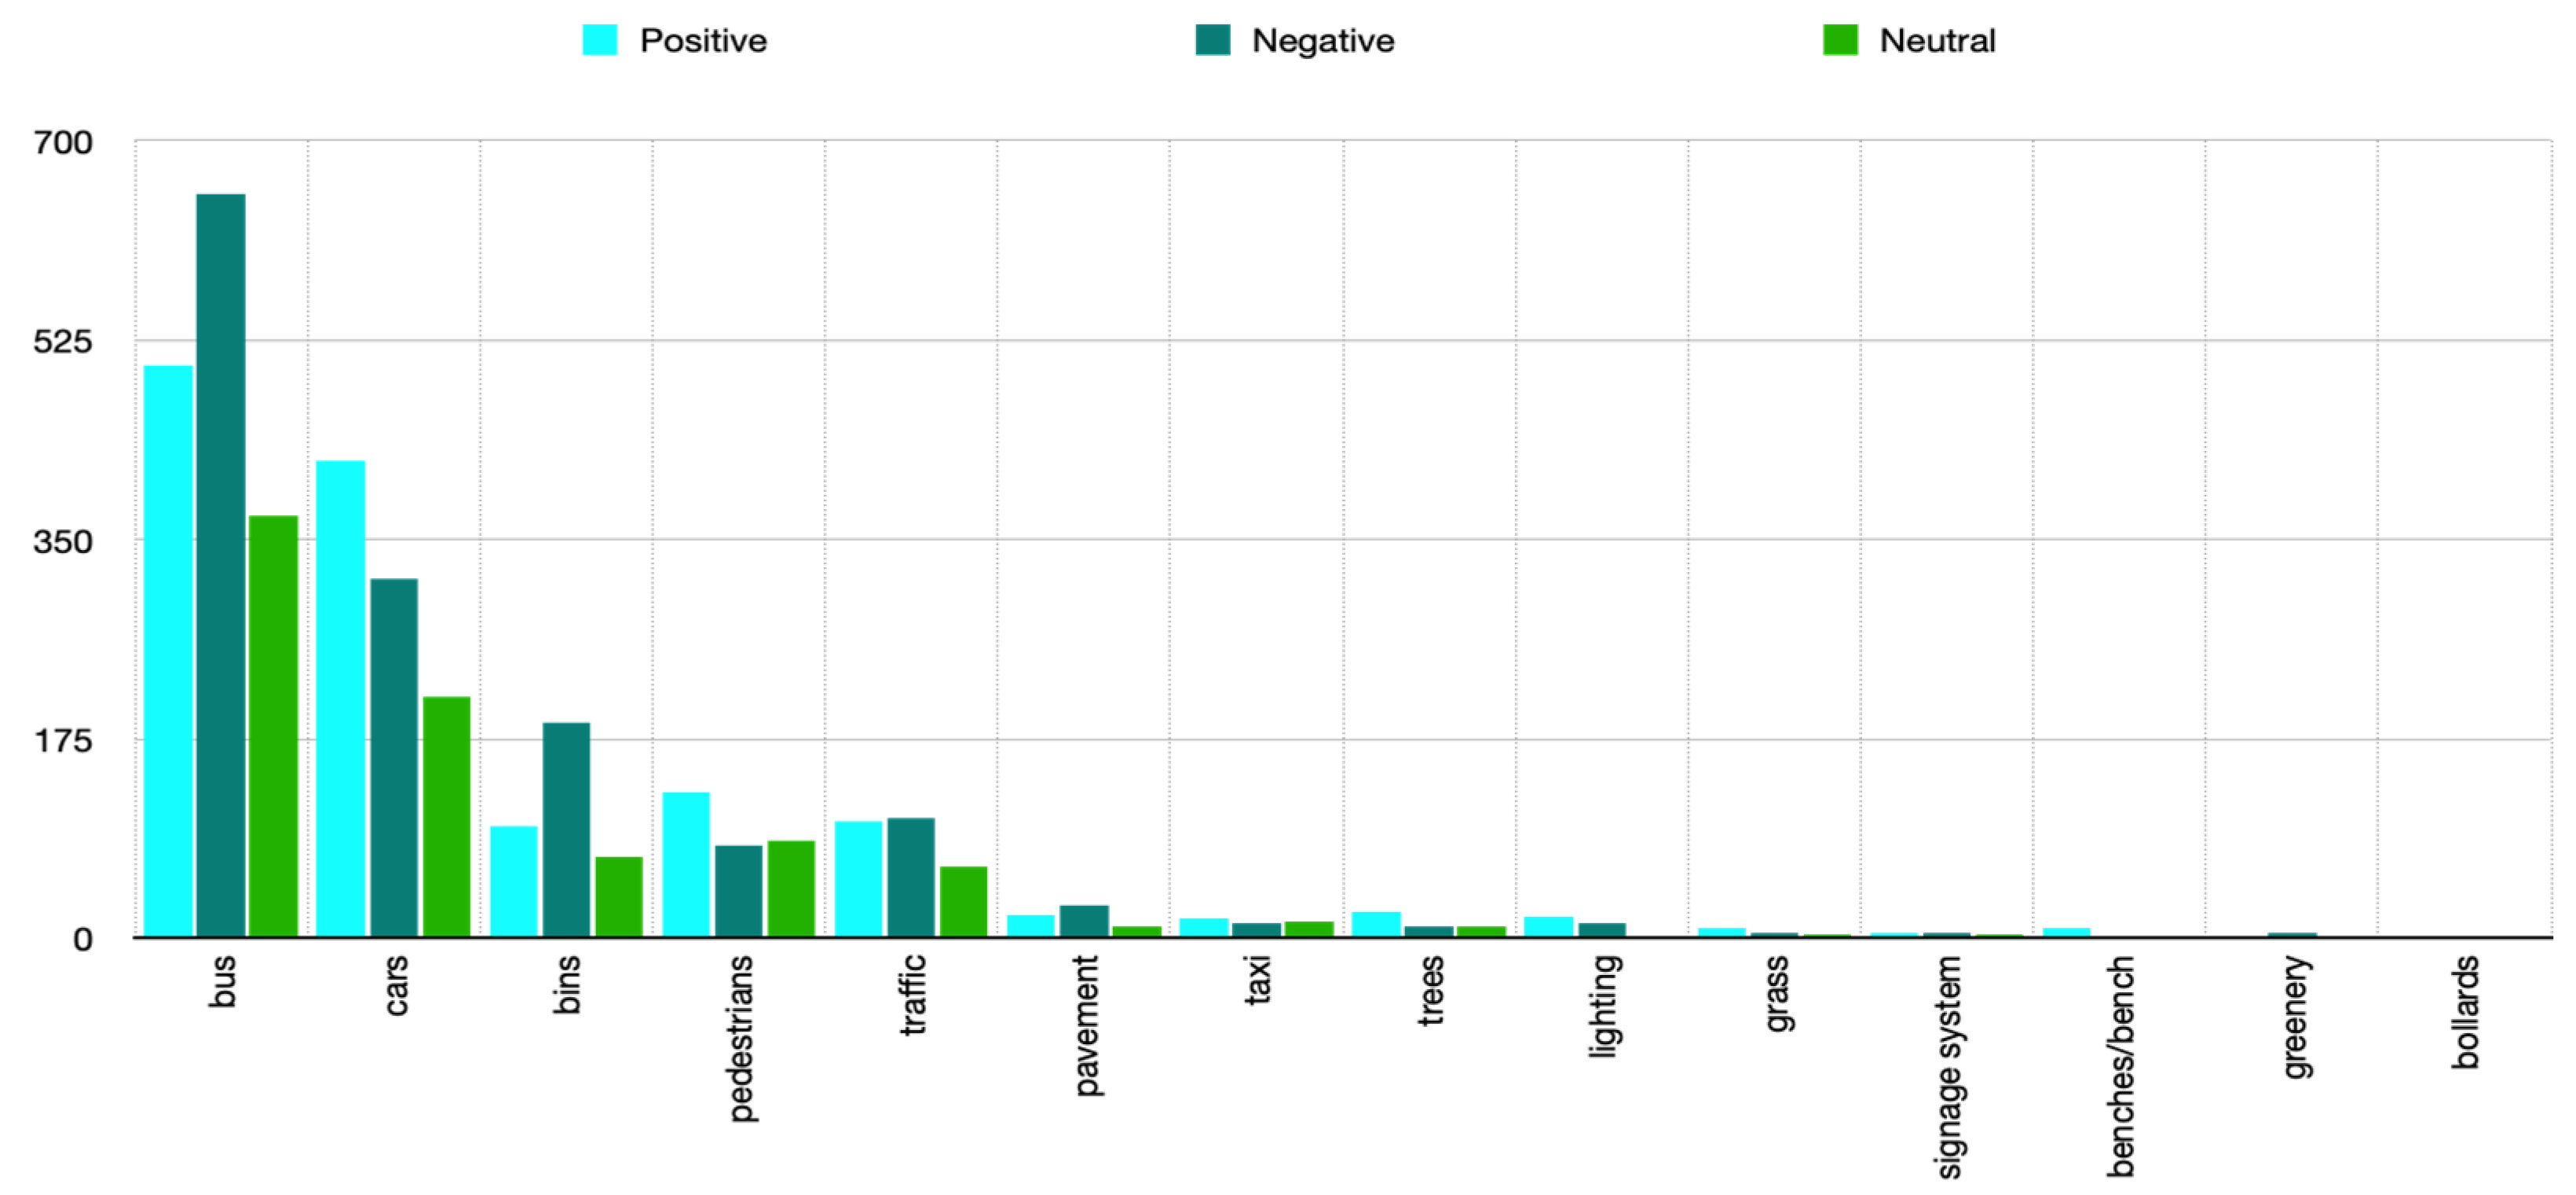
Words relating to the environment elements that can contribute to pedestrian experience were analysed separately (
Figure 5).
Words relating to environment elements appear in 3638 tweets, most of which deal with expressions related to traffic or some modality of transport, such as bus (1527 tweets), cars (947 tweets), pedestrians (294 tweets), traffic (271 tweets) and taxi (47 tweets). The sentiment of pedestrians, cars and taxi carry positive sentiments, whereas bus and traffic carry negative sentiments.
Other terms, such as bins (358 tweets), pavement (60 tweets), trees (45 tweets) and lighting (35 tweets), appear on a much smaller scale. Further analysis determined that elements of urban equipment such as bins and pavement carry negative sentiment, whereas trees, grass and lighting appear with positive sentiment.
4. Discussion
Considering the aim of this research, special attention was paid to the questions regarding the potential of using Twitter data. Results were analysed having in mind the amount and relevance of the collected data, as well as the possibilities regarding data interpretation. The potential of the data for the purpose of the analysis of pedestrian space quality, precision of sentiment determination and the usability of data were considered in relation to a particular open public space—Oxford Street, London, UK.
4.1. Amount and Relevance of the Collected Twitter Data
During the nine months, 24,821 tweets were collected, which related to the research area of Oxford Street in London. After removing the retweets, the sample included 22,530 tweets collected using defined hashtags and keywords (#oxford, #oxfordstreet, #oxfordst, oxford and oxford street), and 327 collected tweets contained geotag, while only 27 tweets were collected based on geotagging at Oxford Street. It was noticed that the intensity of certain tweets was higher at the time when an event such as the London protests or the anti-Semitic act on the bus took place. In addition to the above, there were a very small sample of tweets that have geotags. That share is 1.39%. It is assumed that the reason is that most of the social network users switch off geolocation, both on the application and on the phone.
The amount and relevance of this sample can be compared with the data related to the conducted public consultations related to the future appearance and use of Oxford Street and its contact zone (Oxford Street District—OSD). The first consultations were held in the period from 6 November 2017 until 3 January 2018, shortly after the announcement of the Mayor of London that “about half a mile of the street from Oxford Circus to Orchard Street could become a “traffic-free pedestrian boulevard” [
26]. In the specified period, around a million people were directly contacted for the public consultation [
18]. During the consultation, 14,377 responses were collected, “with just over 9000—about 64%—either supporting the project outright or backing the plans with some concerns about certain elements” [
27].
Public consultations on the draft Oxford Street District Place Strategy were held from 6 November to 16 December 2018, which was preceded by the presentation of the Strategy to the residents, employers and those visiting or working in the area. Consultations were conducted through online questionnaires (on the website and by email) and direct surveys. During the 6 weeks of consultation, 1800 online questionnaires were completed, while 354 were directly surveyed [
28]. Considering the respondent type, the largest group were regular visitors to the OSD (61%), followed by residents of Westminster (34%) and District workers (20%).
Considering the results of the official public consultation reports, it can be interpreted that the data collected from Twitter can be characterized as relevant, having in mind both the amount (2757 tweets per month) and the thematic framework of interest, determined by the choice of content that contains specific terms and hashtags. An increase in the sample and more concrete answers and discussions could be expected after the implementation of a social network campaign that would be focused on a specific topic.
4.2. Twitter Data Mining
Insight into the results of the research could easily lead to the dominant character of Oxford Street—trade and retail, which is characterized as positive. This is confirmed by the number of tweets with positive sentiment that included hashtags such as #
retail (97 tweets with positive sentiment and 42 tweets with neutral sentiment), #
retailnews (39 tweets with positive sentiment), #
Selfridges (31 tweets with positive sentiment) and #
fashion (21 tweets with positive sentiment), see
Table 3.
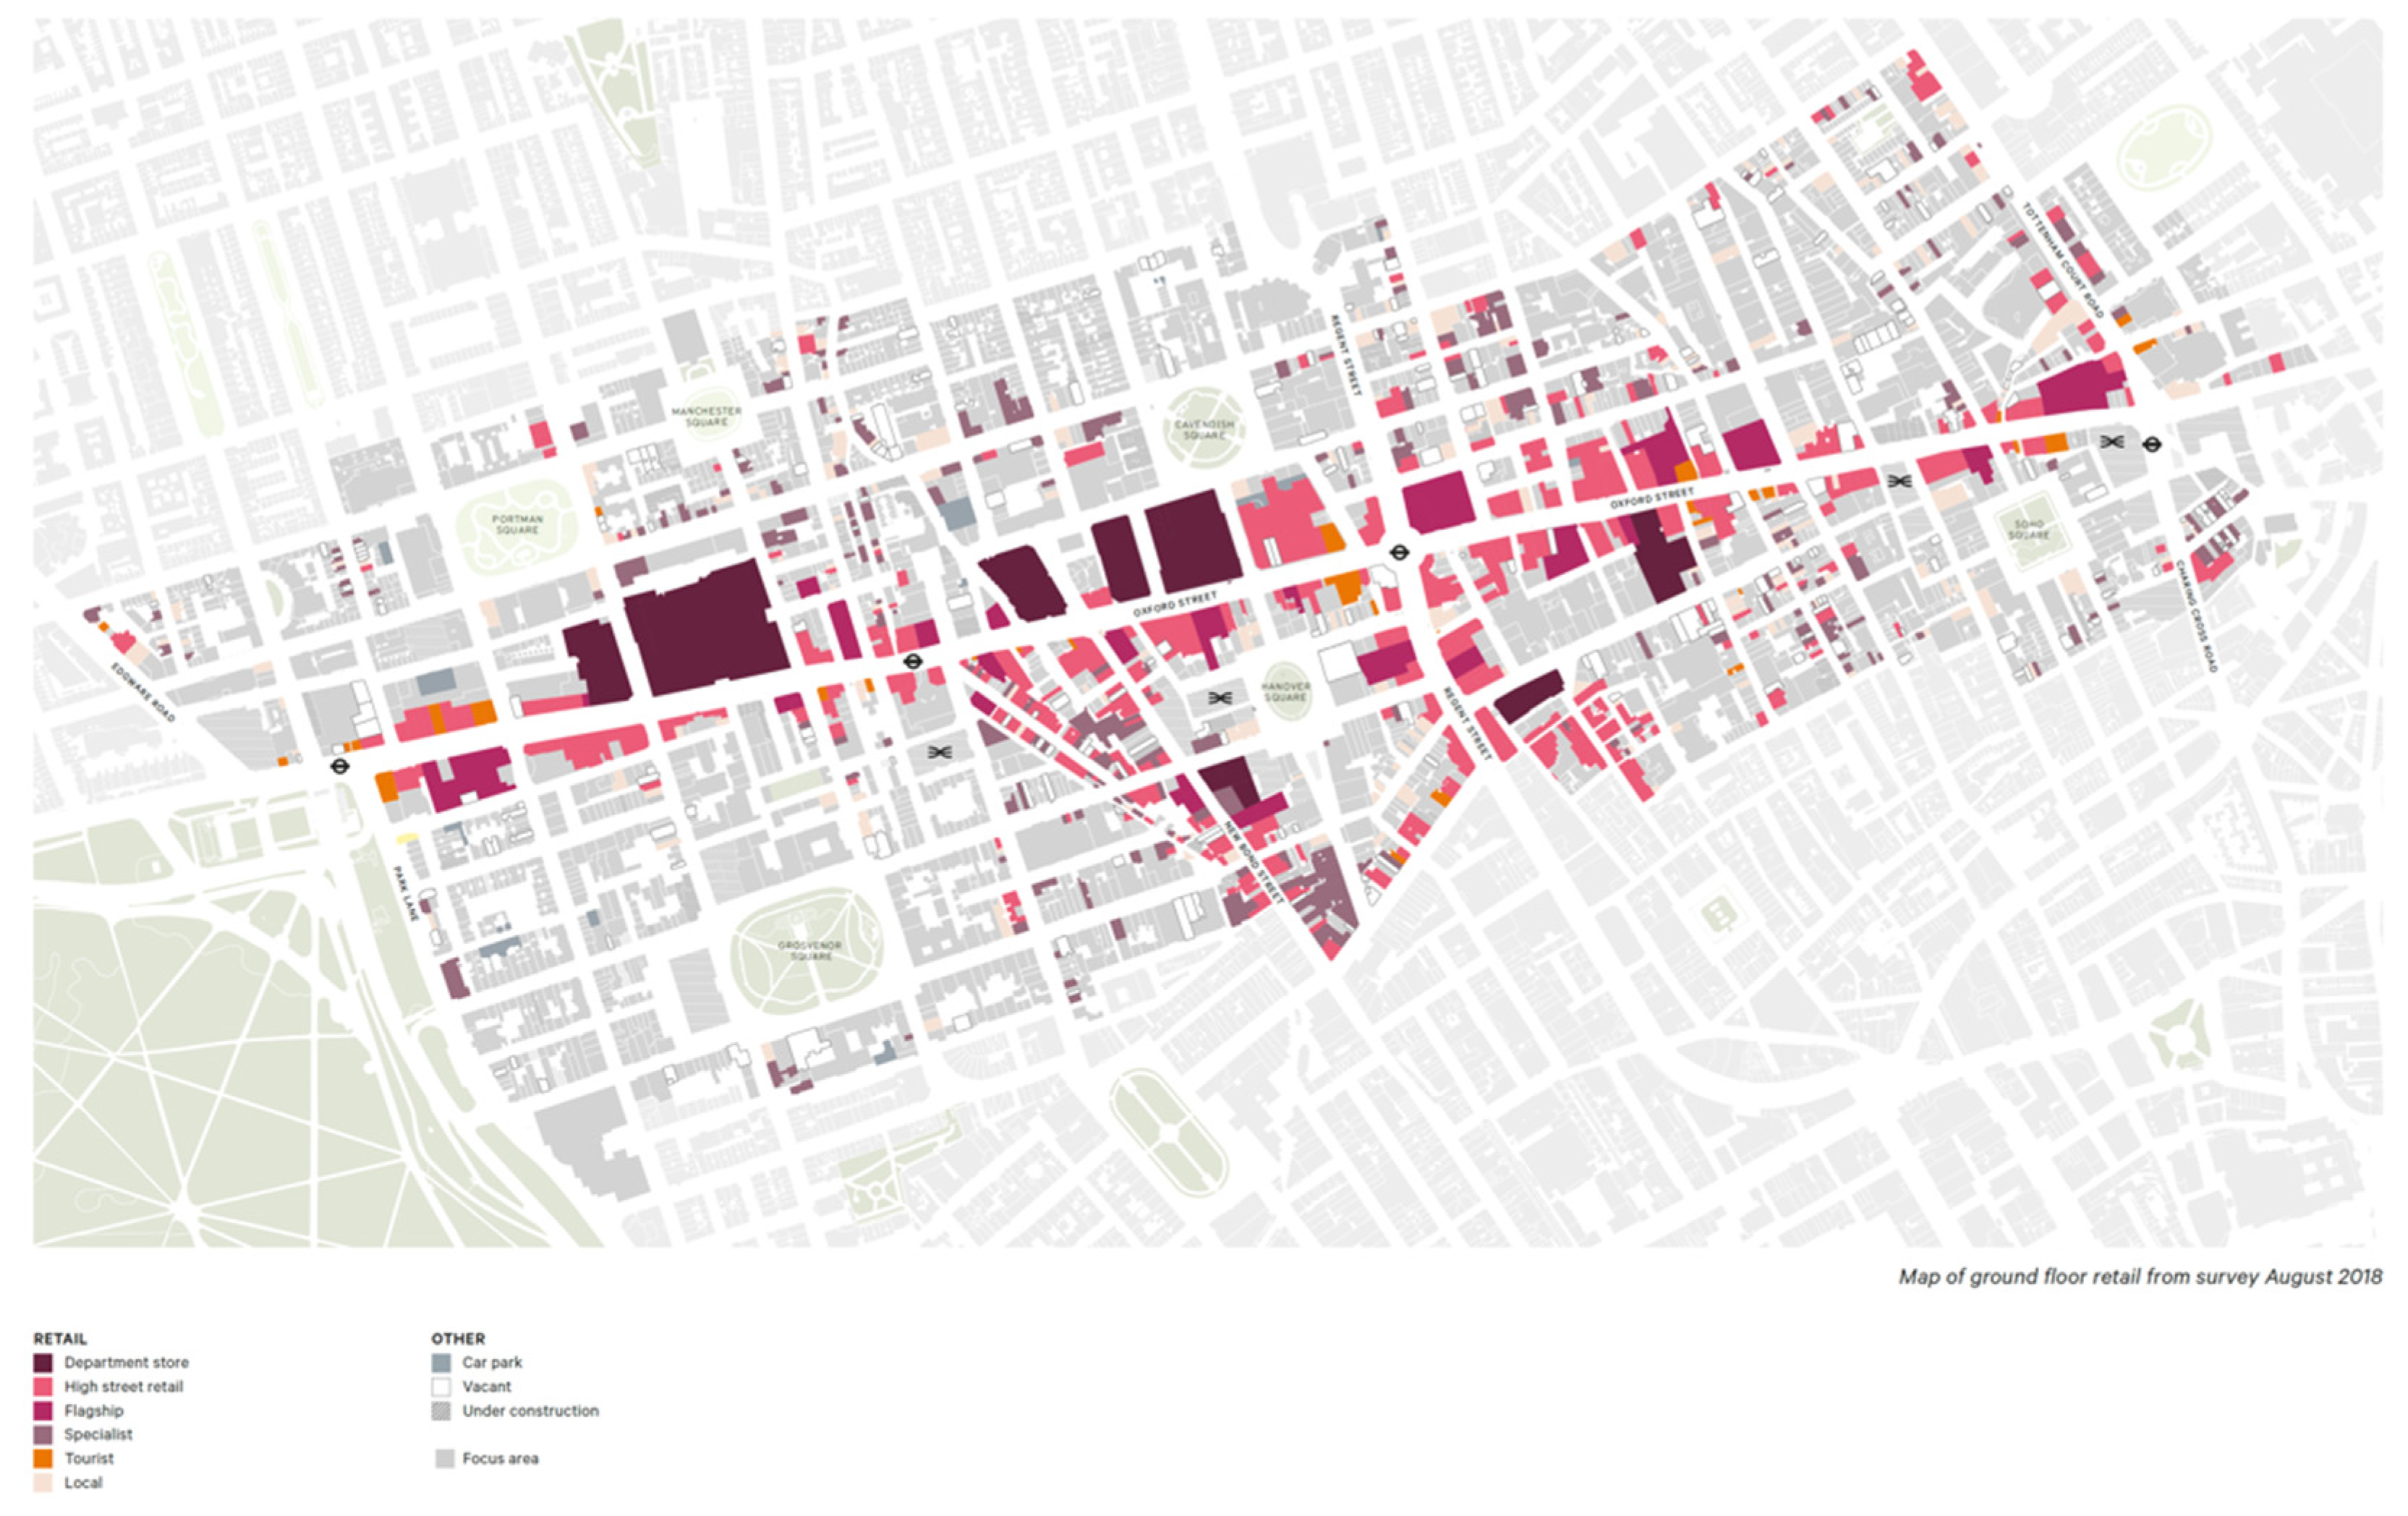
The factual situation according to which Oxford Street (
Figure 6) is predominantly characterised as “the retail spine of London’s West End” [
20] speaks in favour of the above. This means that department stores, flagship and high-street retailers predominantly occupy the ground floor.
On the other hand, as the main problem, if individual events that receive a lot of attention in a short period of time are left out [
29], the traffic can be clearly singled out
(#londontraffic, 25 tweets with negative sentiment). When this is compared with the results of the public consultation, the traffic problem clearly stands out as one of the ten “most frequently raised issues” [
30] (p. 26). On this occasion, the participants in the public consultations pointed out the need for banning the motorised traffic from Oxford Street and supported greater restriction to traffic within the OSD [
30].
The above overview of the results indicates that Twitter data can give a clear overall picture of a particular location and its dominant character and issues, viewed from the urban perspective.
4.3. Twitter Data Mining in Pedestrian Space Quality Analysis
In this research, special attention was paid to the elements of the pedestrian environment, which were analysed using specific words related to this micro scale such as
bench, bin, bollard, signage system, lighting, pavement (urban equipment and furnishing),
grass, trees, greenery (landscaping elements),
pedestrian, car, bus, taxi and
traffic (modes of transport). These terms appear in 3638 tweets, which is 15.42% of the total sample. The most common are tweets related to traffic (76.1%), where buses and traffic in general are mentioned as an issue, unlike pedestrians and taxis, which carry positive sentiment (see
Figure 5). In relation to urban equipment, the notion of
bins is most prevalent in a negative context, while other elements occur to a lesser extent. It should also be noted that the words
trees (1.2%),
grass (0.5%), and
lighting (1.0%), although appearing on a significantly smaller scale, carry positive sentiment. In this way, issues can be clearly separated from desirable elements of pedestrian spaces.
If these results are compared with the results of public consultations on the issue of respondents’ interest in certain topics, a certain analogy can be observed (see
Table 6). Thus, the most interest arises in relation to transport (63.6%), landscape (4.6%), amenity (3.5%), lighting (3.4%) and materials (2.1%) [
30] (p. 34). Further, specific recommendations from the first public consultations in 2018 [
27] referred to pedestrianisation of Oxford Street, levelling the pavement of the road and sidewalks to improve accessibility and extension of the taxi ranks.
This comparison with the results of targeted research suggests that Twitter can be considered a resource channel in the analysis of pedestrian areas. The assumption is that some other social networks, such as Instagram, which is also popular in Europe [
31], will be an even better and richer basis, and that data collected from several social networks can be combined with research. For these purposes, some other methods for sentiment research should be considered to get a better insight of the sentiment of data that are in formats other than text.
Observing positive and negative sentiment related to individual elements of the pedestrian space can contribute to future decisions of urban designers related to transformation proposals. What users have described as positive should be retained and nurtured, while what is characterized as negative should find solutions and improvements. For example, bins are characterized negatively, due to accumulated garbage, irregular maintenance, and high leakage between elements. Accordingly, more regular maintenance and emptying, greater volume of manure and closer distance between individual elements should be proposed. On the other hand, what is characterized positively, such as trees or grass, should be emphasized, the area and number of seedlings should be increased, or some additional alternative solutions in the form of green walls and roofs should be given.
4.4. Precision of Sentiment Determination
In the context of this work, it was noticed that sentiment classification of individual tweets does not always perform classification accurately. For instance, the tweet “I wonder if London holiday guides still refer to Oxford Street as the “ultimate shopping destination”. Cos… it’s not. Just bare American candy shops, traffic, and Zara’s. It’s so yuck now” was classified as positive, even though by examination it was identified that this tweet carries negative sentiment. Something similar can be seen with the tweet “I never thought I’d love walking down a heaving Oxford Street, but it was bloody brilliant! Normality”, which was classified as negative, and it carries positive sentiment. Previous research identifies VADER classification of social media for all normalized sentiment scores between −1 and +1, at F1 Classification Accuracy of 0.96 [
25]. A possible reason for this is due to the lack of sentiment-oriented text, often expressed by emoticons, slang, initials and abbreviations [
25]. VADER does not detect irony and phrases, but will rate individual words, which may lead to the wrong classification of the sentiment [
32].
Different authors have analysed and compared VADER’s precision and accuracy. Accuracy is defined as a proportion of total number of correctly classified tweets and total number of analysed tweets, while precision represents the measure of correctly classified positive tweets only. VADER’s accuracy rate is 83%, while the precision is 90% (F1 score is 89%) [
33]. The high accuracy and precision rate of the VADER method are not the only advantages of this method. Its computational efficiency and quickness are also an advantage. Furthermore, VADER is transparent and easily accessible, with its use and easy interpretation, making it useful for non-computer scientists. As different researchers report much lower precision and accuracy when VADER is applied to different topics and domains, future research should analyse further the precision and efficiency of other sentiment analysis approaches that may provide better performance when analysing social media on the topic of urban planning of public spaces.
4.5. Usability of Data in Relation to a Particular Open Public Space
It should be considered here that the research of the potential of Twitter data for the purpose of evaluating the quality of pedestrian space was done in relation to one of the most famous and most visited open public urban spaces—Oxford Street in London. Therefore, the question arises to what extent the use of Twitter data would be possible for the needs of another pedestrian space, which is not so well known and popular, in relation to the sample size itself. There are also important cultural factors regarding the intensity of the use of social networks in a certain territory, as well as the language in which certain topics are tweeted, which can be considered a minor challenge. Also, the analysis cannot fully indicate the character of the users of the space, such as the age of the users, their gender, occupation, or place of residence, which is important for the needs of urban design.
In addition, this work proposes a combined research approach, social network sentiment data analysis and survey of public opinions for mapping user experience and their opinions about environmental elements of the pedestrian or open public space. This Twitter data sentiment analysis demonstrates that certain patterns of user experience and opinions can be clearly mapped from the tweets’ sentiments. Twitter data information is compared with research conducted using traditional methods (interviews and surveys). Research about public opinions of public space that was derived from traditional data collection was noticeably labour- and time-consuming, while being able to collect smaller amounts of data from specific demographics. On the other hand, collecting data from social networks is much faster, less labour-intensive and less time-consuming. Real-time availability of data-driven analysis is not slow and costly, as are traditional methods. In the case of the used case study of Oxford Street, it was noticed that certain events triggered a higher volume of data collection. Having this in mind, and other surveys conducted about the public space design of this location, it would be of interest to combine not only these sources but also to combine similar efforts at the same time, to aggregate a larger amount of usable and relevant data.
5. Conclusions
This study indicates the fact that users of pedestrian areas observe certain phenomena in detail and characterize them in terms of values, and that social networks give them the opportunity to express them and to inform others about them. If these channels are observed carefully, valuable data can be obtained, based on which one can get an impression of the quality and needs of a certain pedestrian space. This research explored how topics related to environmental elements of public pedestrian space can be extracted from Twitter data, and the sentiment for each topic was classified based on the sentiment scores for each tweet. The extracted topics and their sentiments were compared to the research conducted using traditional methods for data collection through surveys and interviews. Our research shows that an analogy was found between analysing sentiments of Twitter data and traditional research. While data collection and analysis are efficient using data collection from social media, it also shows that complementing efforts with traditional data collection can contribute to the context of urban planning and design. It is interesting that data from social networks, which do not represent targeted research such as interviews and surveys, give similar results, especially bearing in mind that users of open spaces react to some situations on their own initiative and record their observations and impressions. In that sense, urban planners and designers get an overview of the positive and negative properties of a certain space in relation to which they can give an appropriate proposal for transformation—emphasizing and nurturing characteristics that are singled out as advantages and changing and proposing solutions for what is singled out as an issue. However, the relevance of this tool is possible only when there is a sufficient sample, which in the presented Oxford Street study can be considered acceptable compared to the sample obtained using traditional methods. With regards to this, the behaviour of this tool in relation to less visited open spaces, i.e., those of a local character, should be checked. Also, bearing in mind that the work focused on comparing the results obtained through social networks and the results obtained by traditional methods, future research should be directed to other locations such as Paris, Brussels, or Milan, to verify the obtained results.
On the other hand, to explore how cities can create more quality space for people, social media is considered as an important tool [
34,
35,
36,
37,
38,
39,
40] for urban planners and designers to reach the community and to advance the conversation about urban issues. Future research should explore defining a framework for extracting data about public space from other systems such as social networks, web-based systems, and other related open data. Several challenges should be addressed in future research: (1) identify data sources that are adequate for extracting common and relevant topics for urban planning of pedestrian space (i.e., TripAdvisor, Foursquare, Facebook, etc.), (2) design software architecture that can integrate different external heterogeneous data sources while identifying proper methods for data transformation that can optimize topic extraction efficiently and (3) identify methods to automatically classify topics from collected data only related to public pedestrian spaces. In accordance with the above, further research will go in the direction of applying some of the current methods [
41] of researching the quality of open public urban spaces, such as the Placemaking method [
42], PEDS (Pedestrian Environment Data Scan [
43]), PERS [
44] or the SACLAV [
45] method that is being developed at the University of Belgrade.


