Article

Optimized Design of Floor Plan and Components of Prefabricated Building with Energy-Cost Effect

1
School of Architecture, Tianjin University, Tianjin 300072, China
2
Tianjin International Engineering Institute, Tianjin University, Tianjin 300072, China
*
Author to whom correspondence should be addressed.
Appl. Sci. 2022, 12(8), 3740; https://doi.org/10.3390/app12083740
Submission received: 14 February 2022 / Revised: 27 March 2022 / Accepted: 5 April 2022 / Published: 8 April 2022
(This article belongs to the Topic Artificial Intelligence (AI) Applied in Civil Engineering)

Abstract

:
Optimizing building performance and economic benefits through feedback in building design is a hot topic in current academic research. However, few studies on prefabricated buildings have been undertaken in this field. Meanwhile, the methodology used for achieving optimized solutions is still poor. In this paper, genetic algorithms and correlation analysis are employed and two parametric design methods—i.e., the floor plan generation method and the component selection method—are proposed for the modularity of the prefabricated buildings. Taking a typical high-rise building in Tianjin as an example, correlation analyses are performed on the basis of the two proposed methods to enhance the depth of the optimized finding approach. The outcome of this research demonstrates the feasibility of the proposed numerical approach, which can produce the optimized floor plan and construction set under the local conditions. This also reveals that the shape coefficient and window-to-wall ratio are strongly correlated with the energy performance of a building, which can help architects to pursue optimized design solutions in the schematic design process.

1. Introduction

The issue of global energy consumption is in the spotlight today. The U.S. Information Administration presents a future scenario in which global energy consumption will increase by nearly 50% over the next 30 years or so [1]. Building energy consumption accounts for 21.7% of the national energy consumption in China [2], and there is still work to be done to reduce overall energy consumption in the building industry.
Cost limits, of course, are crucial factors in restricting building energy efficiency [3]. The optimization of energy efficiency without the consideration of cost may result in high incremental costs and the inability to promote applications. As a result, energy usage and cost should be considered throughout the optimization process.
Many earlier researchers have investigated this topic using the genetic algorithm technique. I2n 2002, Caldas et al. used evolutionary algorithms on the DOE2.1E platform to improve the arrangement and size of windows in public buildings to lower the yearly energy consumption [4]. Ferrara et al. optimized near-zero-energy buildings to achieve a low economic cost [5]. Thalfeldt et al. identified the design priorities for cold-climate building facades [6]. However, related research has revealed that diverse optimization targets have conflicting characteristics [7], suggesting that focusing on a single goal is unsuitable in particular optimization schemes. As a result, an increasing number of researchers are attempting to adapt the multi-objective optimum design technique to the purpose of the architecture. With illumination and energy consumption as the optimization targets, Khoroshiltseva et al. employed modeFRONTIER and Daysim to optimize the spacing and angle of the sunshade for the south window of an office [8]. To complete the façade design while guaranteeing building performance, Mohammadjavad et al. exploited the twin aims of lighting and heating to optimize the curtain wall design parameters (surface angle) of an office building [9]. By using the Grasshopper platform, Cheng Sun et al. achieved the performance optimization of a large public building focusing on energy, cost, and daylight [10]. Shaoqing Gou et al. used the Energyplus and JEPlus platforms to create an architectural design plan for a residential project in Shanghai to improve indoor thermal comfort and lower energy consumption [11].
However, the basic models commonly employed in related studies are primarily used for non-assembled buildings—i.e., the optimized solutions often find it difficult to meet the standardization, modularity, and modulization needs of prefabricated buildings.
The trend of building industrialization has been evident in recent years. With the deepening of the concept of green and sustainable development, prefabricated buildings are receiving more and more attention from the domestic and international construction community because of their standardization, energy efficiency, and economy [12,13,14]. Prefabricated building envelopes can be selected to have an appropriate envelope structure based on the building orientation, climate conditions, and economic costs, among other factors, in order to achieve low energy costs, thanks to their modular design, factory manufacturing, and assembly construction [15]. The application of this approach to the design process, as well as the successful combination of genetic algorithm and assembly construction, is the focus of this study. In summary, the previous studies also had the following shortcomings:
  • Few scholars have applied the synergy of energy consumption and cost to prefabricated buildings.
  • The models of the former studies can mainly be divided into two categories: one is a generic model with similar characteristics to that obtained from our research (it is usually a city building and is used to propose some common optimization conclusions [4,8,9,10]); the other is generally a specific model, usually for a public building, and the findings primarily relate to the renovation and refurbishment of the building [5,6,11]. However, there are numerous phases in the architectural design process, including conceptual design, preliminary design, and detailed design [16]. In this article, we think that applying the two models to conceptual and preliminary design is most beneficial.
  • Many of the articles in this area end up focusing on the optimization results, while in practice designers tend to make changes based on these. These articles tend to lack any discussion of which parts need to be changed to have less impact on the optimization results.
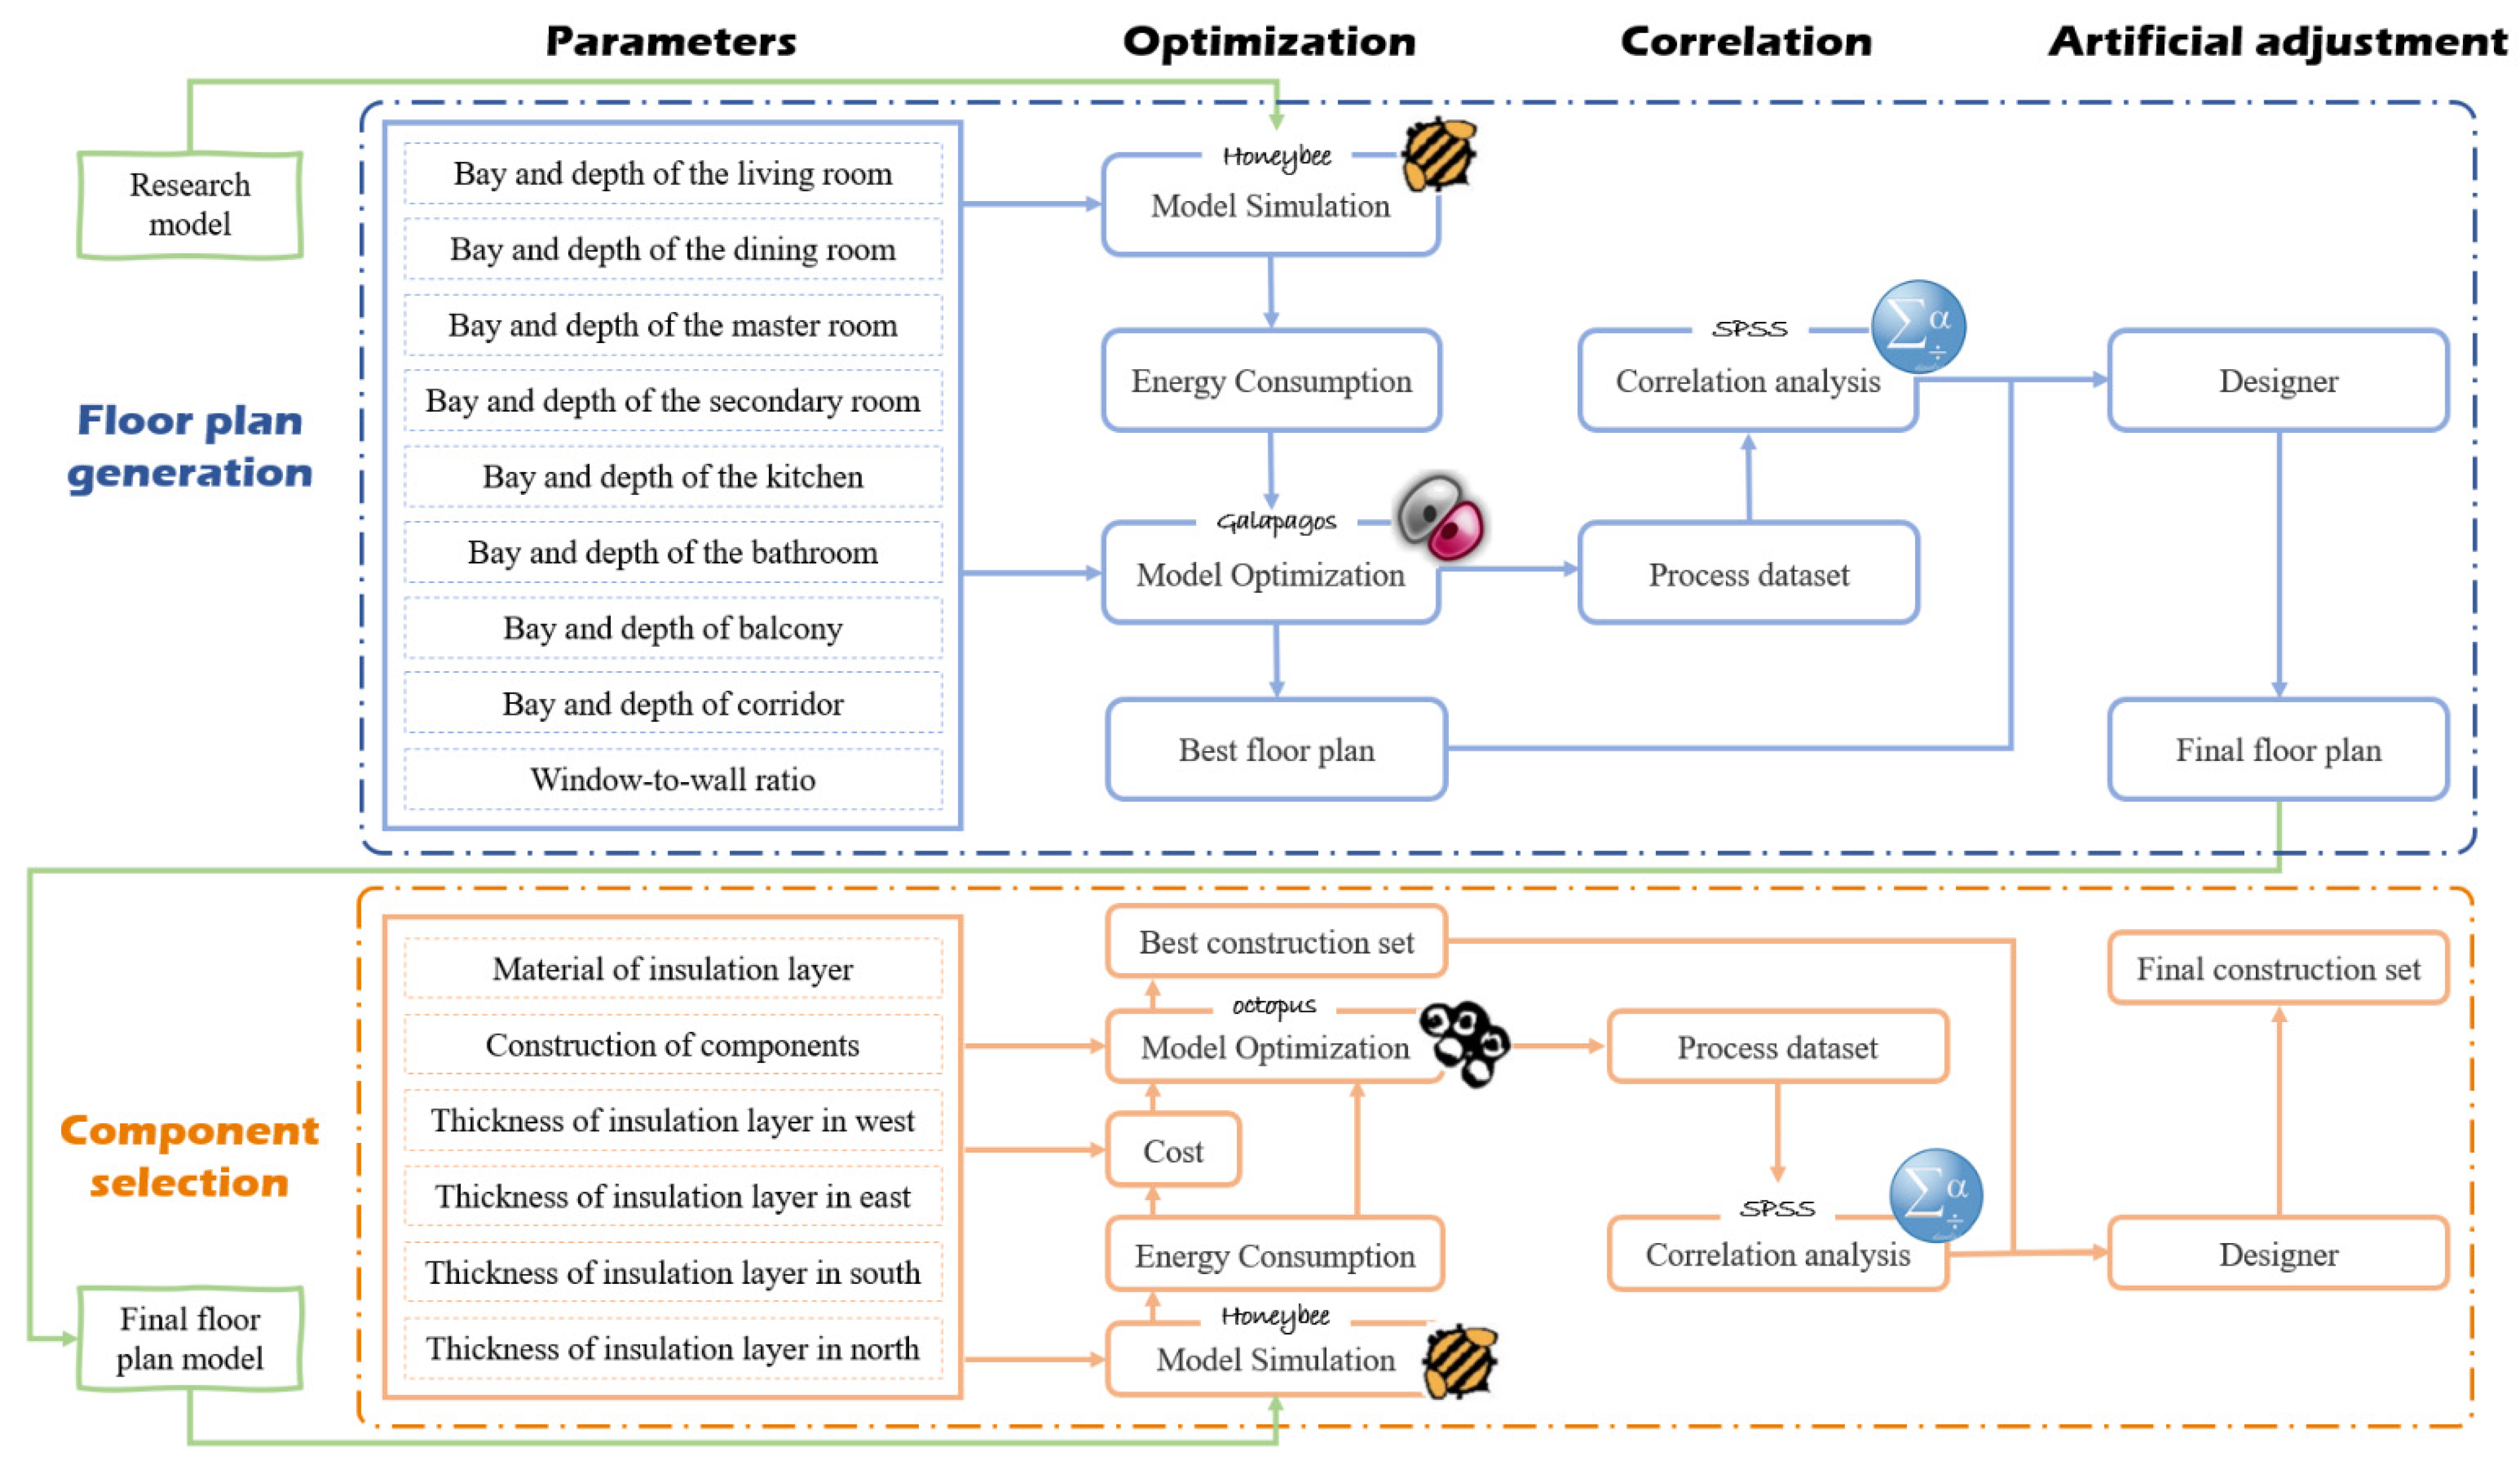
Therefore, this paper proposes two design methods based on the genetic algorithm to take building energy consumption into consideration: a floor plan generation method for the conceptual design process and a complement selection method for the preliminary design. The designer can then use the results of the optimization and parameter correlation analysis as a theoretical basis to make further modifications to the computer-aided optimization design. The total workflow of the two design methods is shown in Figure 1.

2. Methods

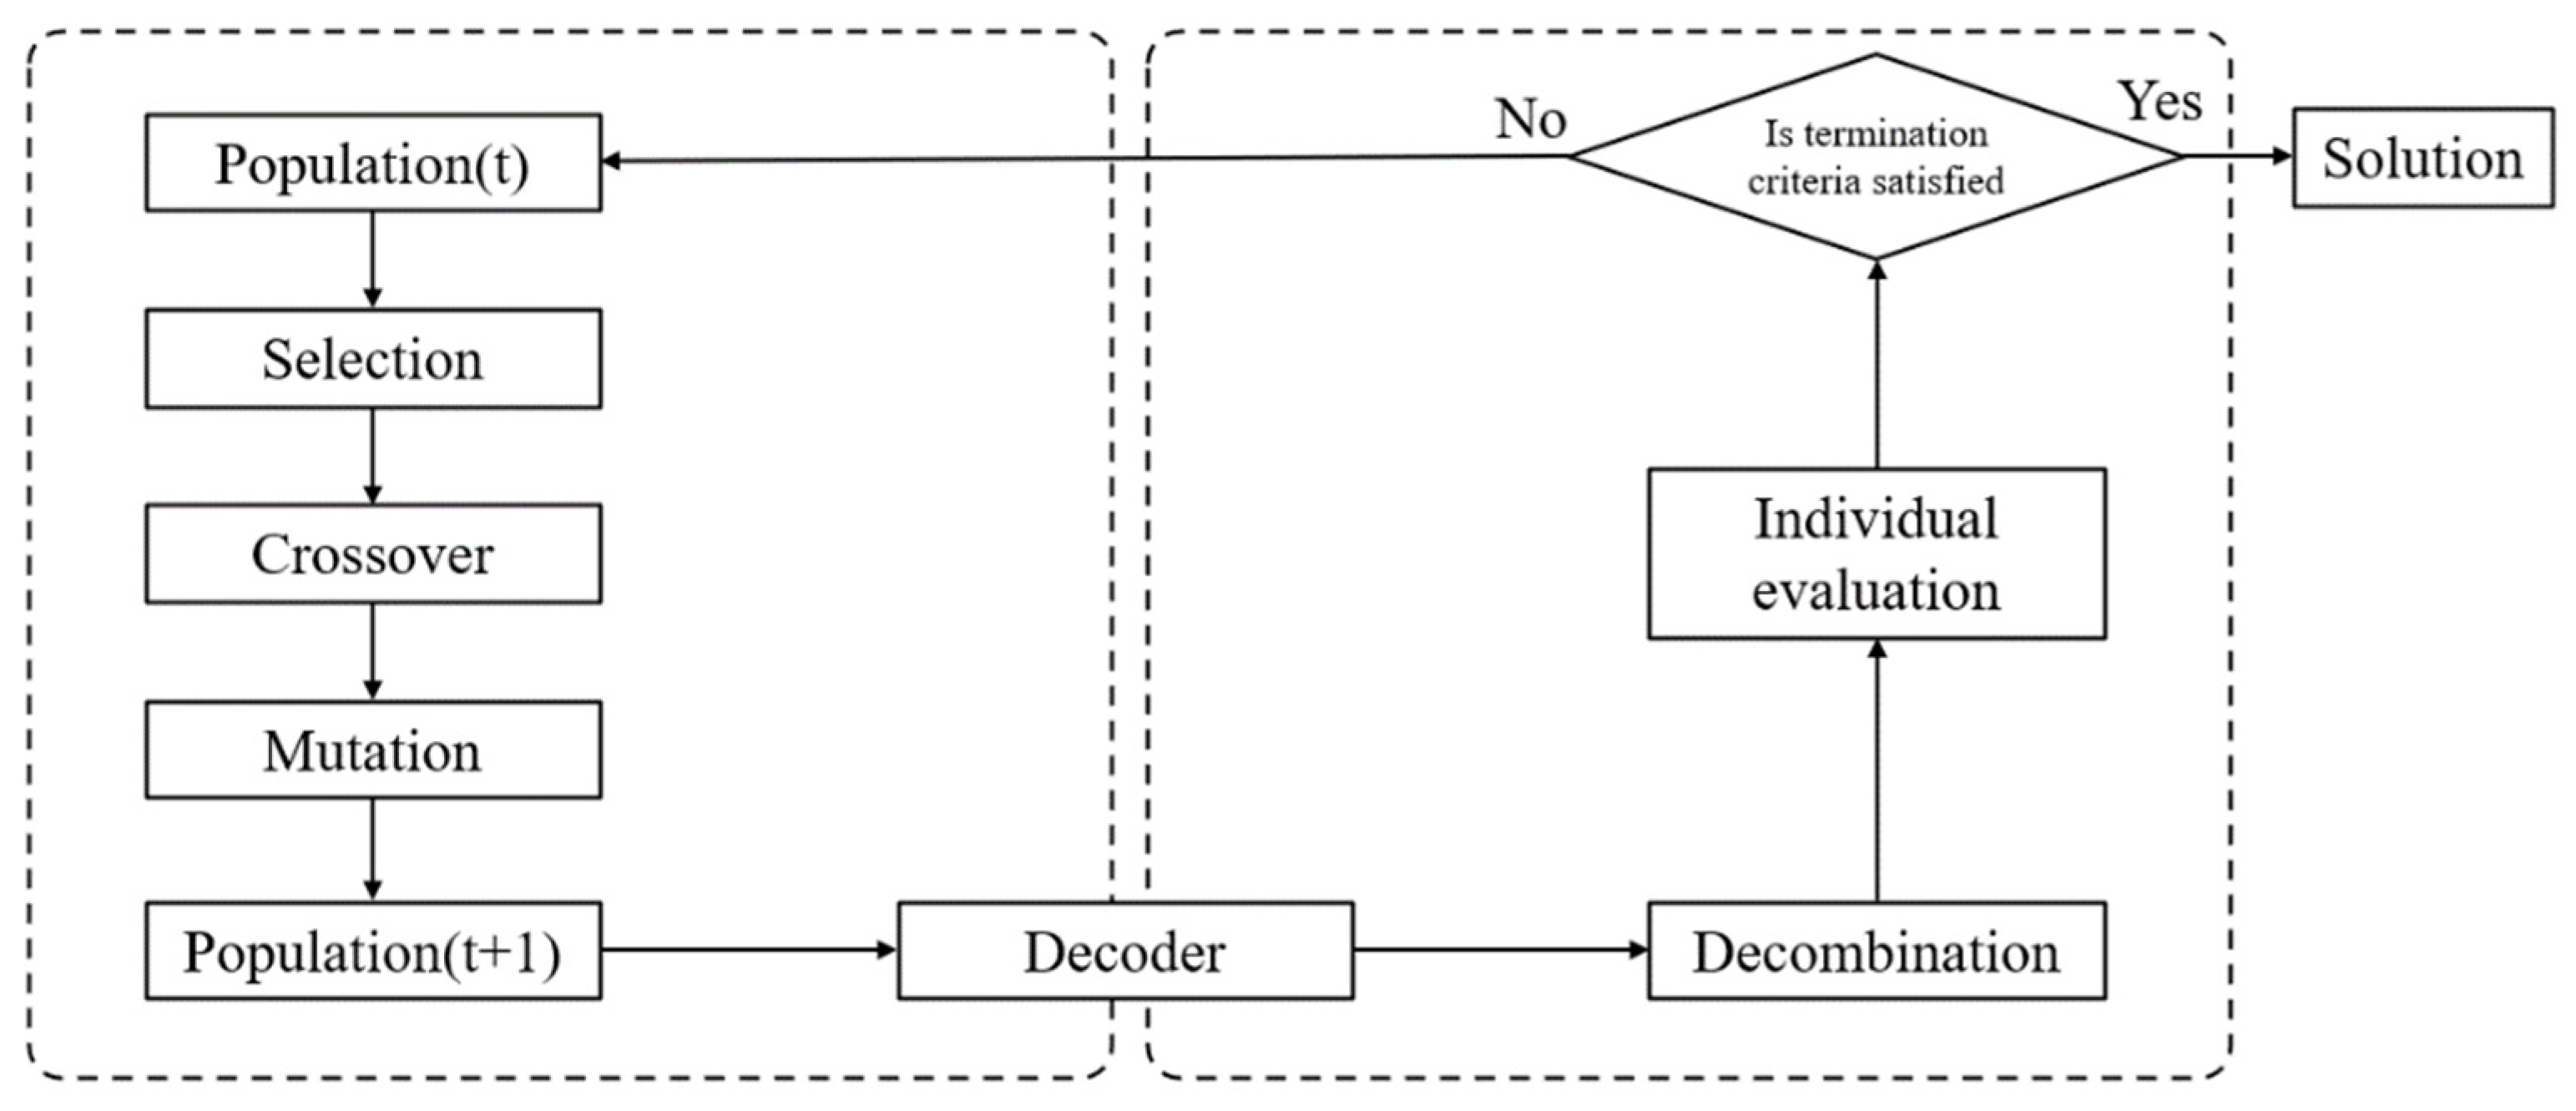
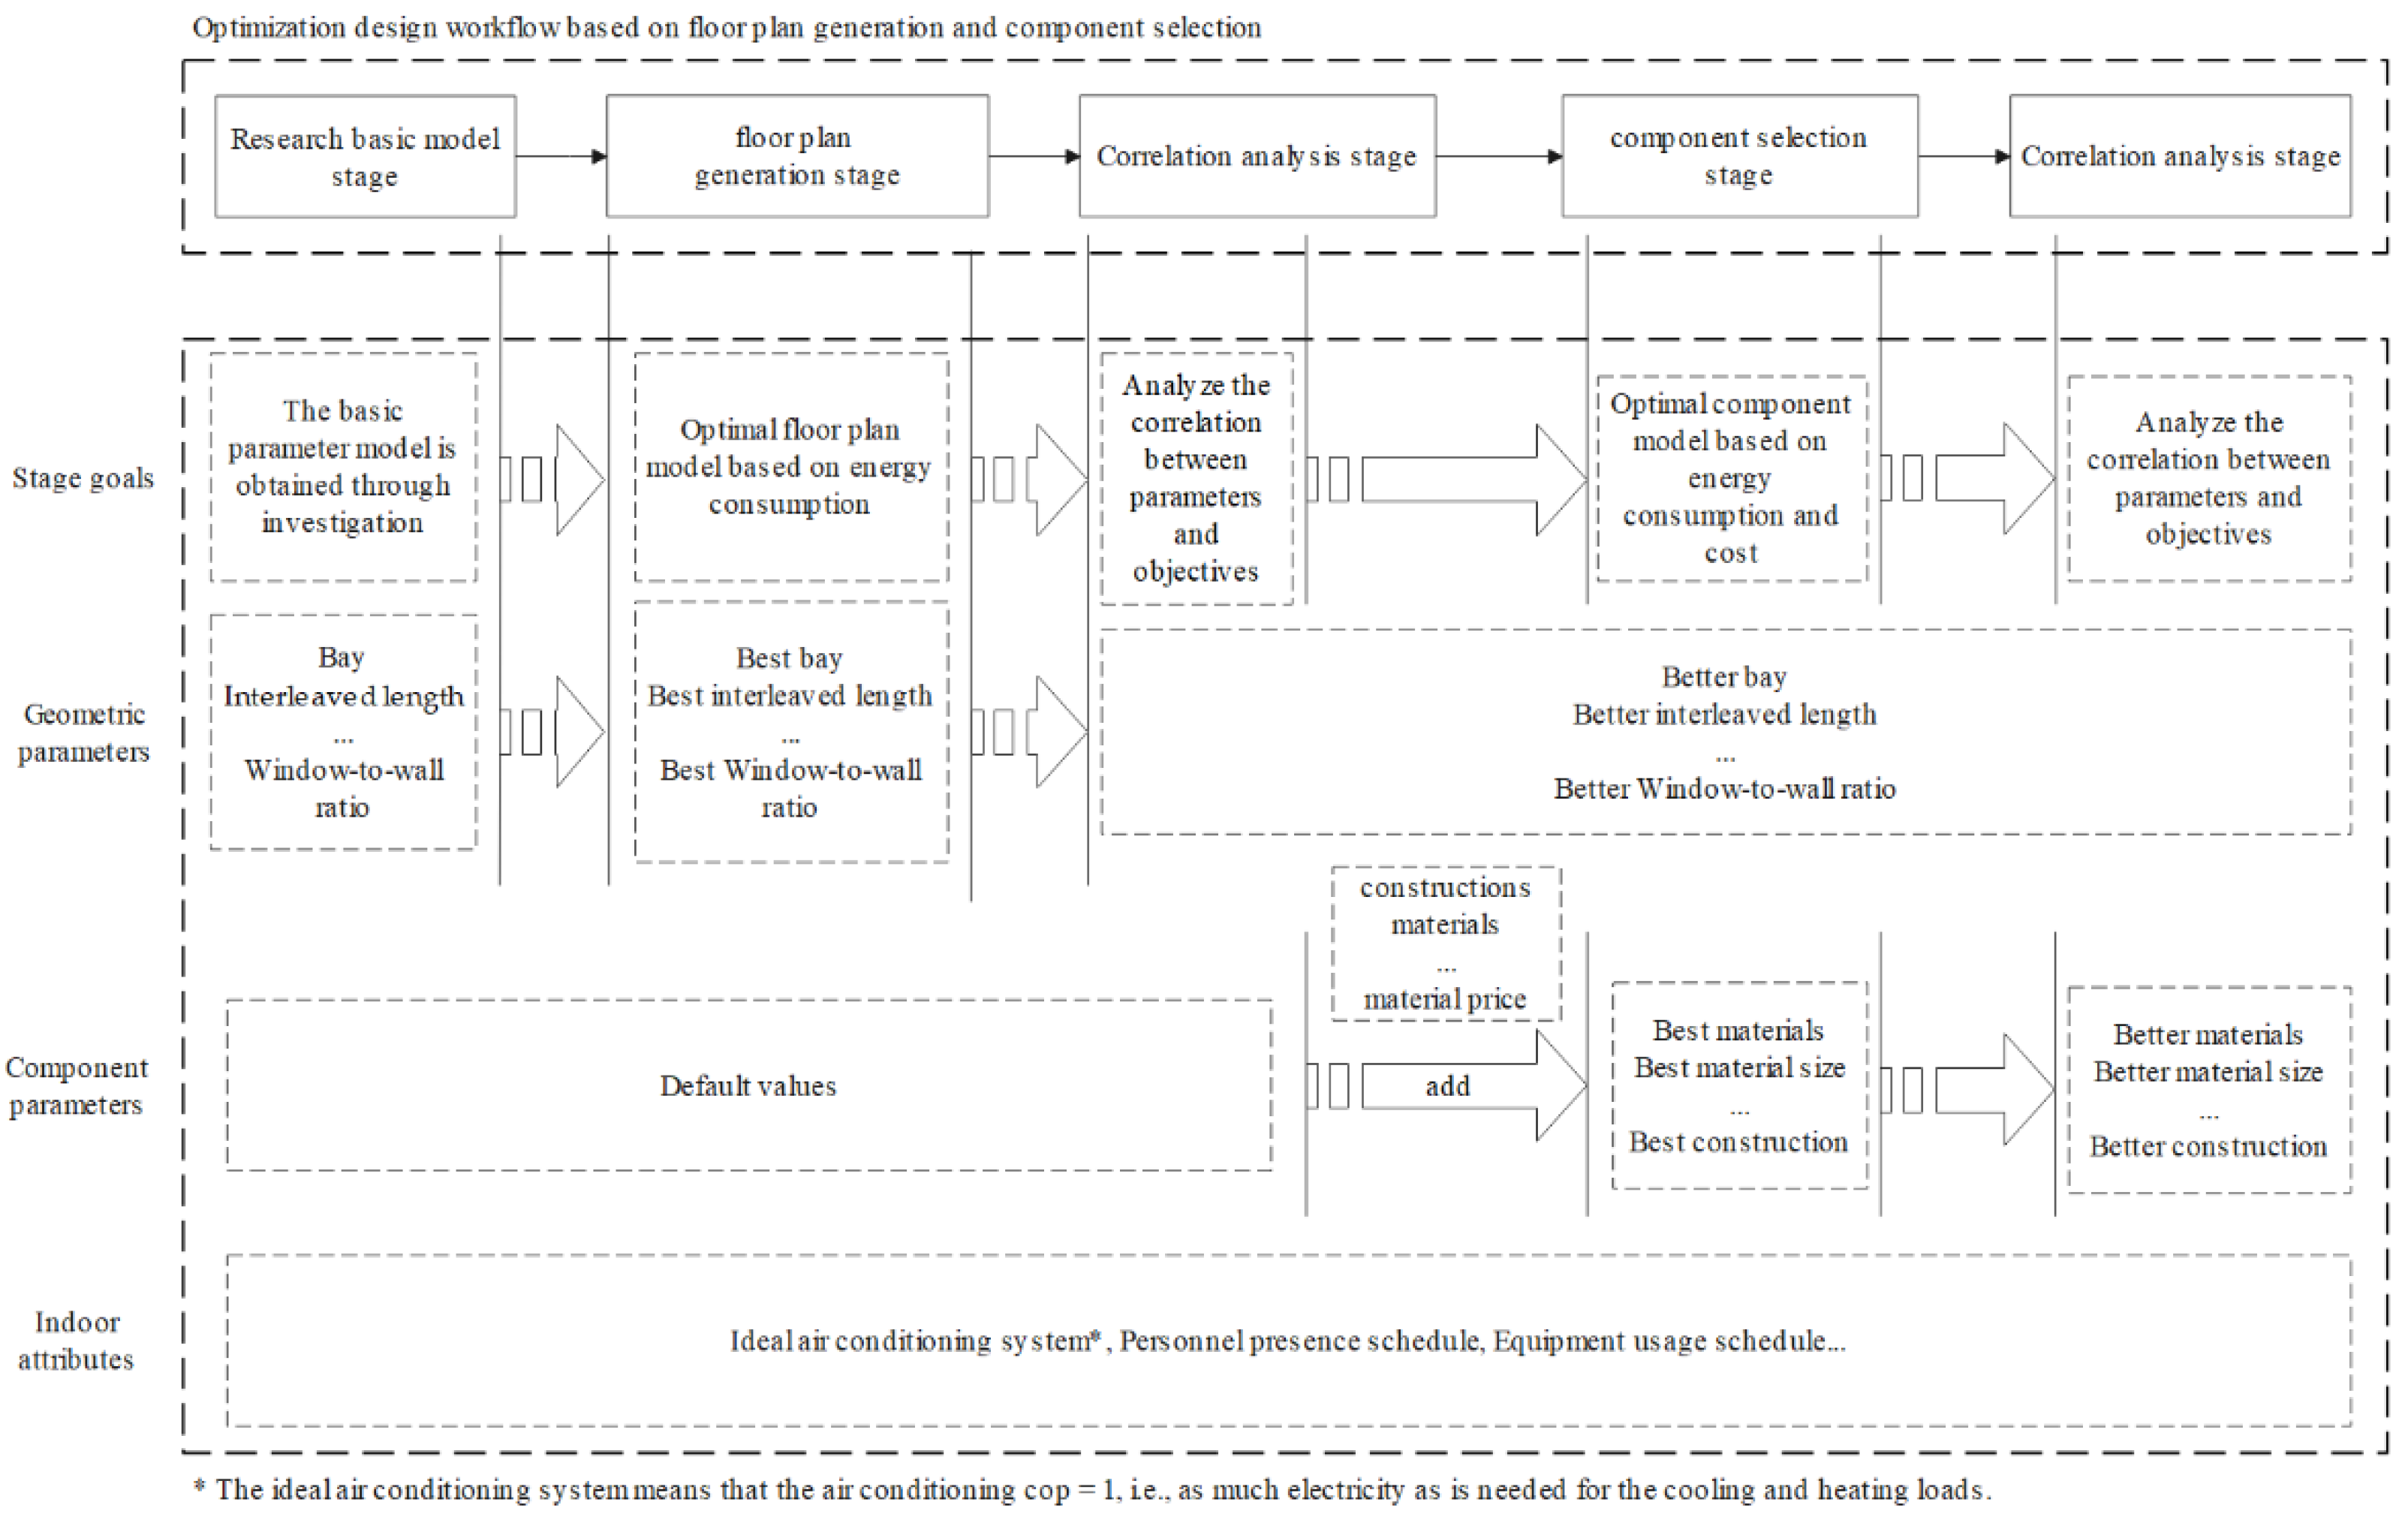
2.1. Optimization Method

The genetic algorithm (GA) was utilized as the optimization approach in this work; it has been frequently used in similar papers in recent years [17]. Genetic algorithms, which were researched and proposed by Professor Holland of Michigan University in 1975, are based on the theory of biological evolution and incorporate the evolutionary concepts of reproduction, hybridization, mutation, competition, and selection into the optimization process to achieve global optimization [18]. Figure 2 depicts the optimization concept [19]. This study uses the Galapagos and Octopus plug-ins integrated with the Grasshopper platform. Galapagos is a GA component that comes with the new version of Grasshopper and can perform optimization solutions for a single objective with a simple operation, fast computation, and easy convergence. However, it has the drawback of being able to optimize solutions for only one goal. Developed by the University of Applied Arts Vienna, Austria, and Bollinger + Grohmann Engineering, Germany, the Octopus plug-in is a Grasshopper component that combines Pareto frontier solution sets and GA for the optimization of multiple objectives. Pareto frontier solution sets can provide a basis for analyzing the trade-offs made between design objectives [20].

2.2. Correlation Analysis Method

2.2.1. Standard Regression Coefficient

The size of the absolute value of the standard regression coefficient, which is the regression coefficient obtained after eliminating the impact between the objective and the units of the parameters, directly represents the degree of effect of the parameters on the objective [21]. Its regression model can be expressed as Function (1):
Y = i = 1 N β i X i X ¯ σ X + ε
where β i is the ith parameter’s standard regression coefficient, X ¯ is the ith parameter’s mean, σ X is the ith parameter’s standard deviation, ε is a constant, and N is the number of parameters.
We need to test the problem of multicollinearity suggested by Frisch in 1934 over the course of the investigation [22]. To detect multicollinearity, a variety of approaches are used, including partial correlation coefficient, tolerance, variance inflation factor (VIF), and conditional index [23]. The variance inflation factor measured by the SPSS software is used to assess the aforementioned problem in this study. A result of greater than one and less than ten generally suggests that the problem does not exist [24].

2.2.2. Pearson Correlation Coefficient

The Pearson correlation coefficient, which is used to estimate the correlation between X and Y variables, can be calculated using Function (2). The coefficient takes values in the range of [−1, 1]: the closer it is to 1, the more likely the two variables are positively correlated; the closer it is to −1, the more likely it is that the two variables are negatively correlated; a value of 0 indicates that the two variables are uncorrelated. The article was followed up with calculations conducted using SPSS to obtain the Pearson correlation coefficient.
ρ X , Y = c o v ( X , Y ) σ X σ Y
where c o v ( X , Y ) is the covariance between X and Y and σ X and σ Y are their respective standard deviations.

3. Model, Parameters, and Objectives
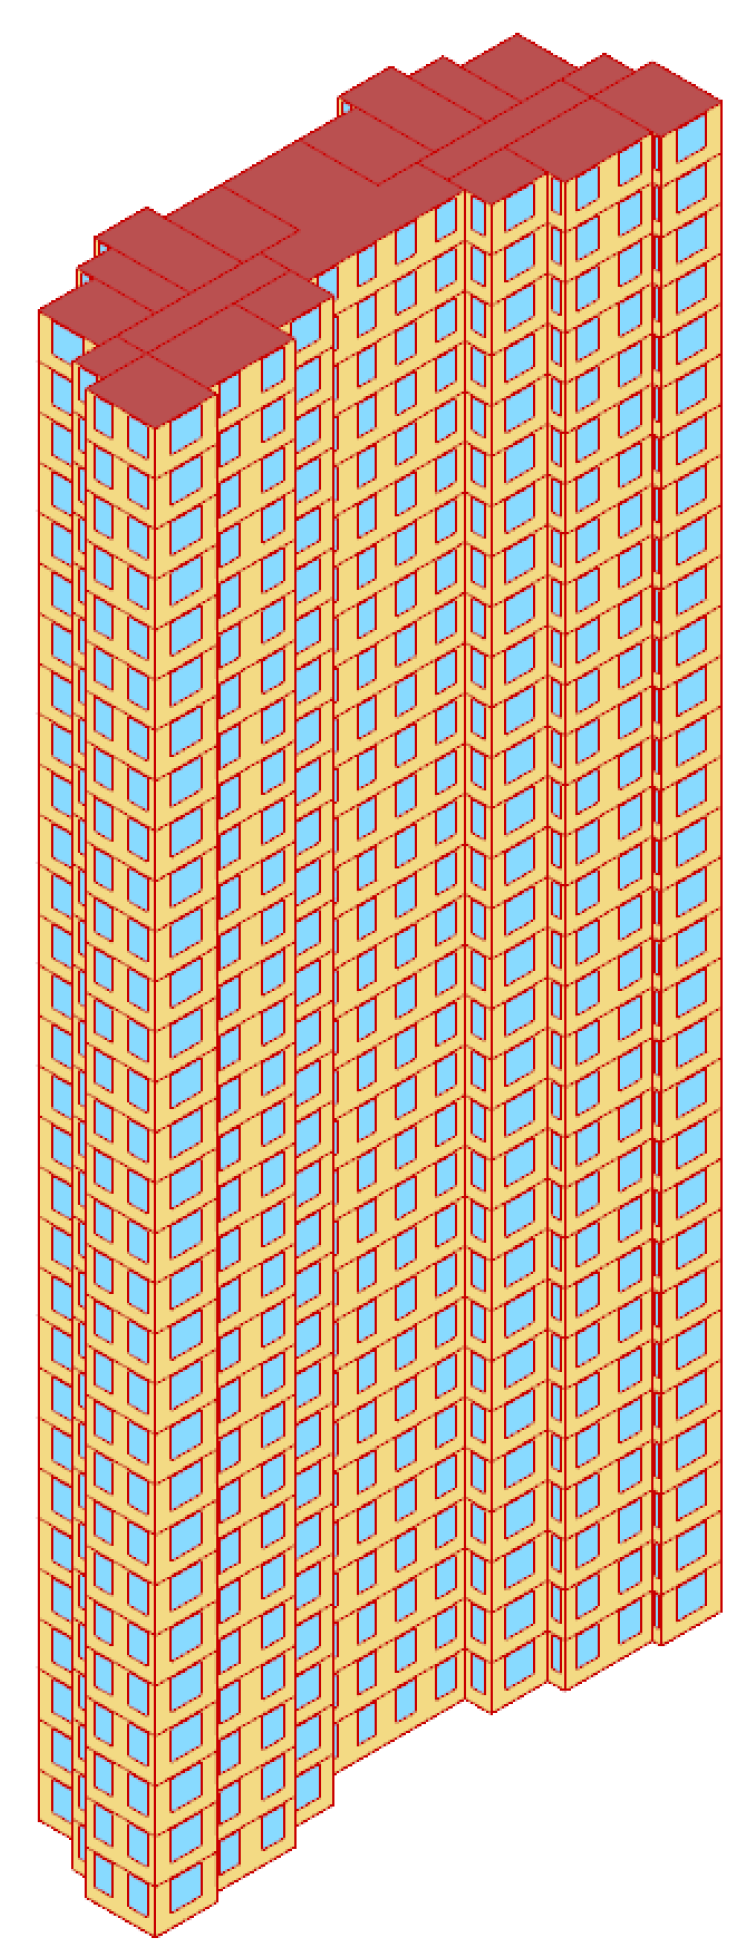
3.1. Model

In this study, the thresholds of room bays, depths (Table 1), and the laws of arrangement of each functional space (Figure 3) were summarized from several sets of house types, which were based on the prototype of prefabricated high-rise (one-staircase, two-family) commercial houses with a PC frame shear wall structure in Tianjin. After this, random values in the parameter range were used to form the base floor plan.
Following that, specific common attributes are assumed to finish the model’s development, and their values are provided in Table 2. After the attributes are specified, a complete 3D building model (Figure 4) can be created, which is the default model used in this study.

3.2. Parameters

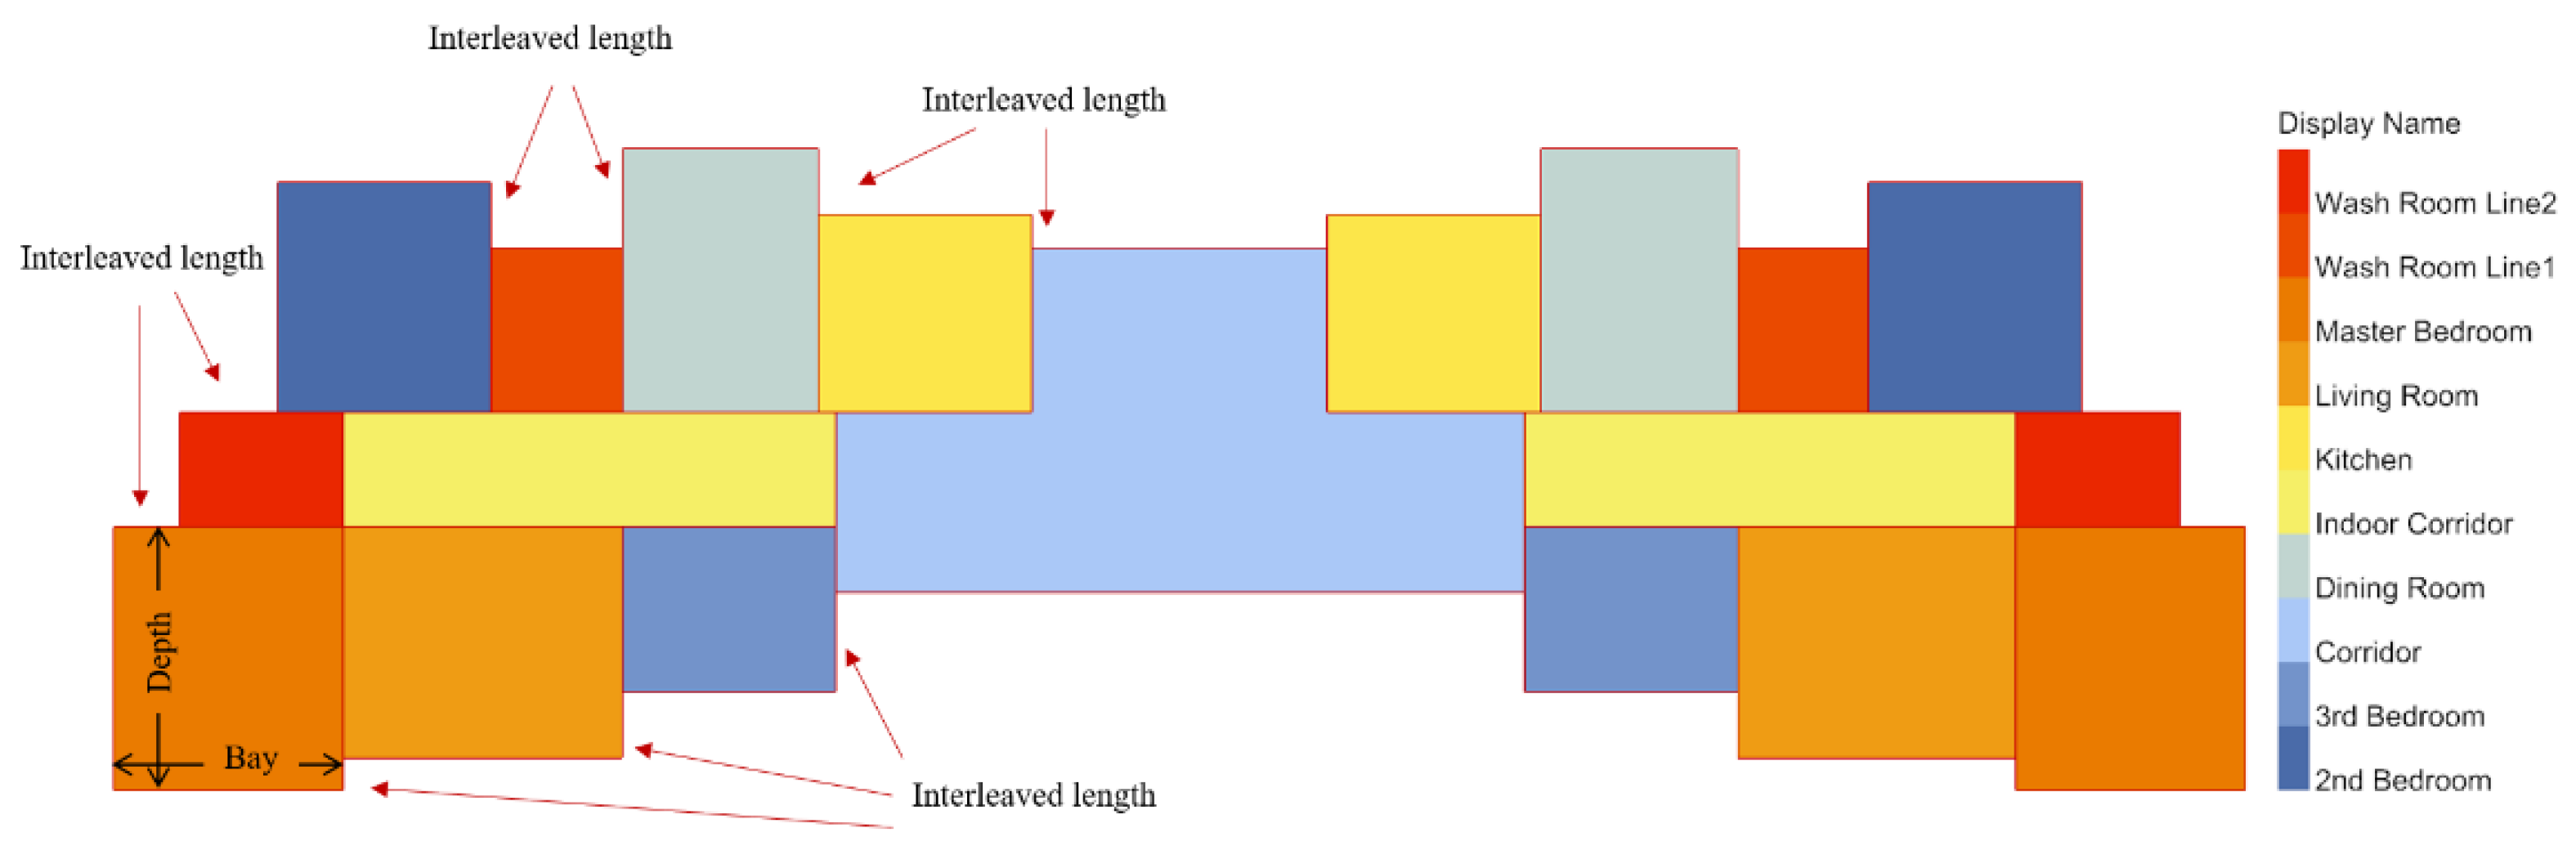
3.2.1. Parameters of the Floor Plan Generation Method

The control variables required for the floor plan generation method are the window-to-wall ratio of each orientation, the bays and depths of each functional space, and the interleaved length between them. The research object of this paper is the prefabricated building. One of the core tasks to promote the degree of industrialization of the building is to adopt a modular coordinated system to achieve the universality and interchangeability of the components [27]. Therefore, a novel qualification method that considers the modulus of prefabricated buildings is proposed when defining the control variables of space types. This method can reduce the range of control variables based on the modulus to enhance the optimization efficiency and ensure the reasonable size of the prefabricated buildings. The objective function can be seen in Function (3).
x = [ x 1 , x 2 , x 3 , , x n ] T k i = [ 1 , 2 , , b i a i j M ] T min           y e c = f ( x ) = f ( x 1 , x 2 , , x n ) s . t .               { a m x m b m               m { 1 , 2 , 3 , 4 } x i { x | x = a i + j M · k i }
where x is the vector of control variables; k i is the step vector of x i control variables; x m is the window-to-wall ratio for each orientation; a m and b m are the minimum and maximum values of the corresponding window-to-wall ratio; x i is the interleaved length of the bay, depth, and spaces, i { 5 , 6 · · · n } , m; j is a constant in dimensional transformation which is used to expand the step length of the building modulus in a single transformation, j + ; and M is the basic modulus of the building at the dimensional transformation of the prefabricated building (M = 0.1 m), b i a i j M .

3.2.2. Parameters of the Component Selection Method

The parameters used in this optimization are the material of the insulation layer, the thickness of the insulation layer, and the construction of the wall components, which can be divided into qualitative and quantitative indexes. The range of values shown Table 3 are determined by summarizing after researching manufacturers.
In the optimization process of the component selection method, the physical properties and cost of each material are considered as attributes, assuming that they are constant throughout the construction phase. The specific attributes are shown in Table 4. In the optimization process, material and construction are qualitative indicators, and there are few desirable types. The optimal solution can be selected using the exhaustive method. On the basis of this solution, the thickness of the insulation material for each orientation is used as the optimization variable, while the total building energy consumption and total cost of insulation material are used as the optimization objectives for the next optimization step.

3.3. Objectives

3.3.1. Objective of the Floor Plan Generation Method

The goal energy consumption in the floor plan generation design technique is confined to the use phase, since most buildings consume around 70% of their total energy over their whole life cycle during their use phase [28]. Lighting energy consumption and equipment energy consumption are not affected by control variables [29]. The annual energy consumption (yec) per unit area of the building optimized in this study can be calculated using Function (4):
y e c = E h + E c A
where E h is the annual heating energy consumption of the buildings, kWh; E c is the annual cooling energy consumption of the buildings, kWh; and A is the gross floor area of the buildings, m 2 .

3.3.2. Objective of Component Selection Method

g e c is the same as the expression of y e c in the floor plan generation method. Instead, only the cost of materials used during the construction phase is considered. The changes in the dimensions of the structural material will affect the energy use of buildings. We assume that the structural material cannot be changed during the selection process, which means that the cost of the structural material is constant for the same floor plan. In order to simplify the calculation, the material cost during construction is considered only as the insulation construction cost ( g i c ), which can be expressed through Function (5).
g i c = i = 1 4 C i d i S i
where i from 1 to 4 are the four orientations of the buildings; C i is the price of the insulation board used for each facade orientation, CNY/m3; d i is the thickness of the insulation board used in each direction of the external wall, m; and S i is the total area of each facade orientation, m2.
The optimization objective function can be expressed as Function (6).
x = [ x 1 , x 2 , x 3 , , x n ] T min           g = g ( x ) = { g e c ( x ) , g i c ( x ) } s . t .               x B = { x | h s ( x ) 0 , s = 1 , 2 , , p }
where x is the vector of control variables; g is the vector of objectives; and h s ( x ) is the sth constraint of the vector x , from which the feasible domain B is formed.
After completing the above settings, we can obtain the details of the changes in parameters and properties for each phase of the complete workflow, as shown in Figure 5.

4. Results and Discussion

Two design methods were applied on the above case and then the correlation between some parameters or attributes with the energy consumption was analyzed.

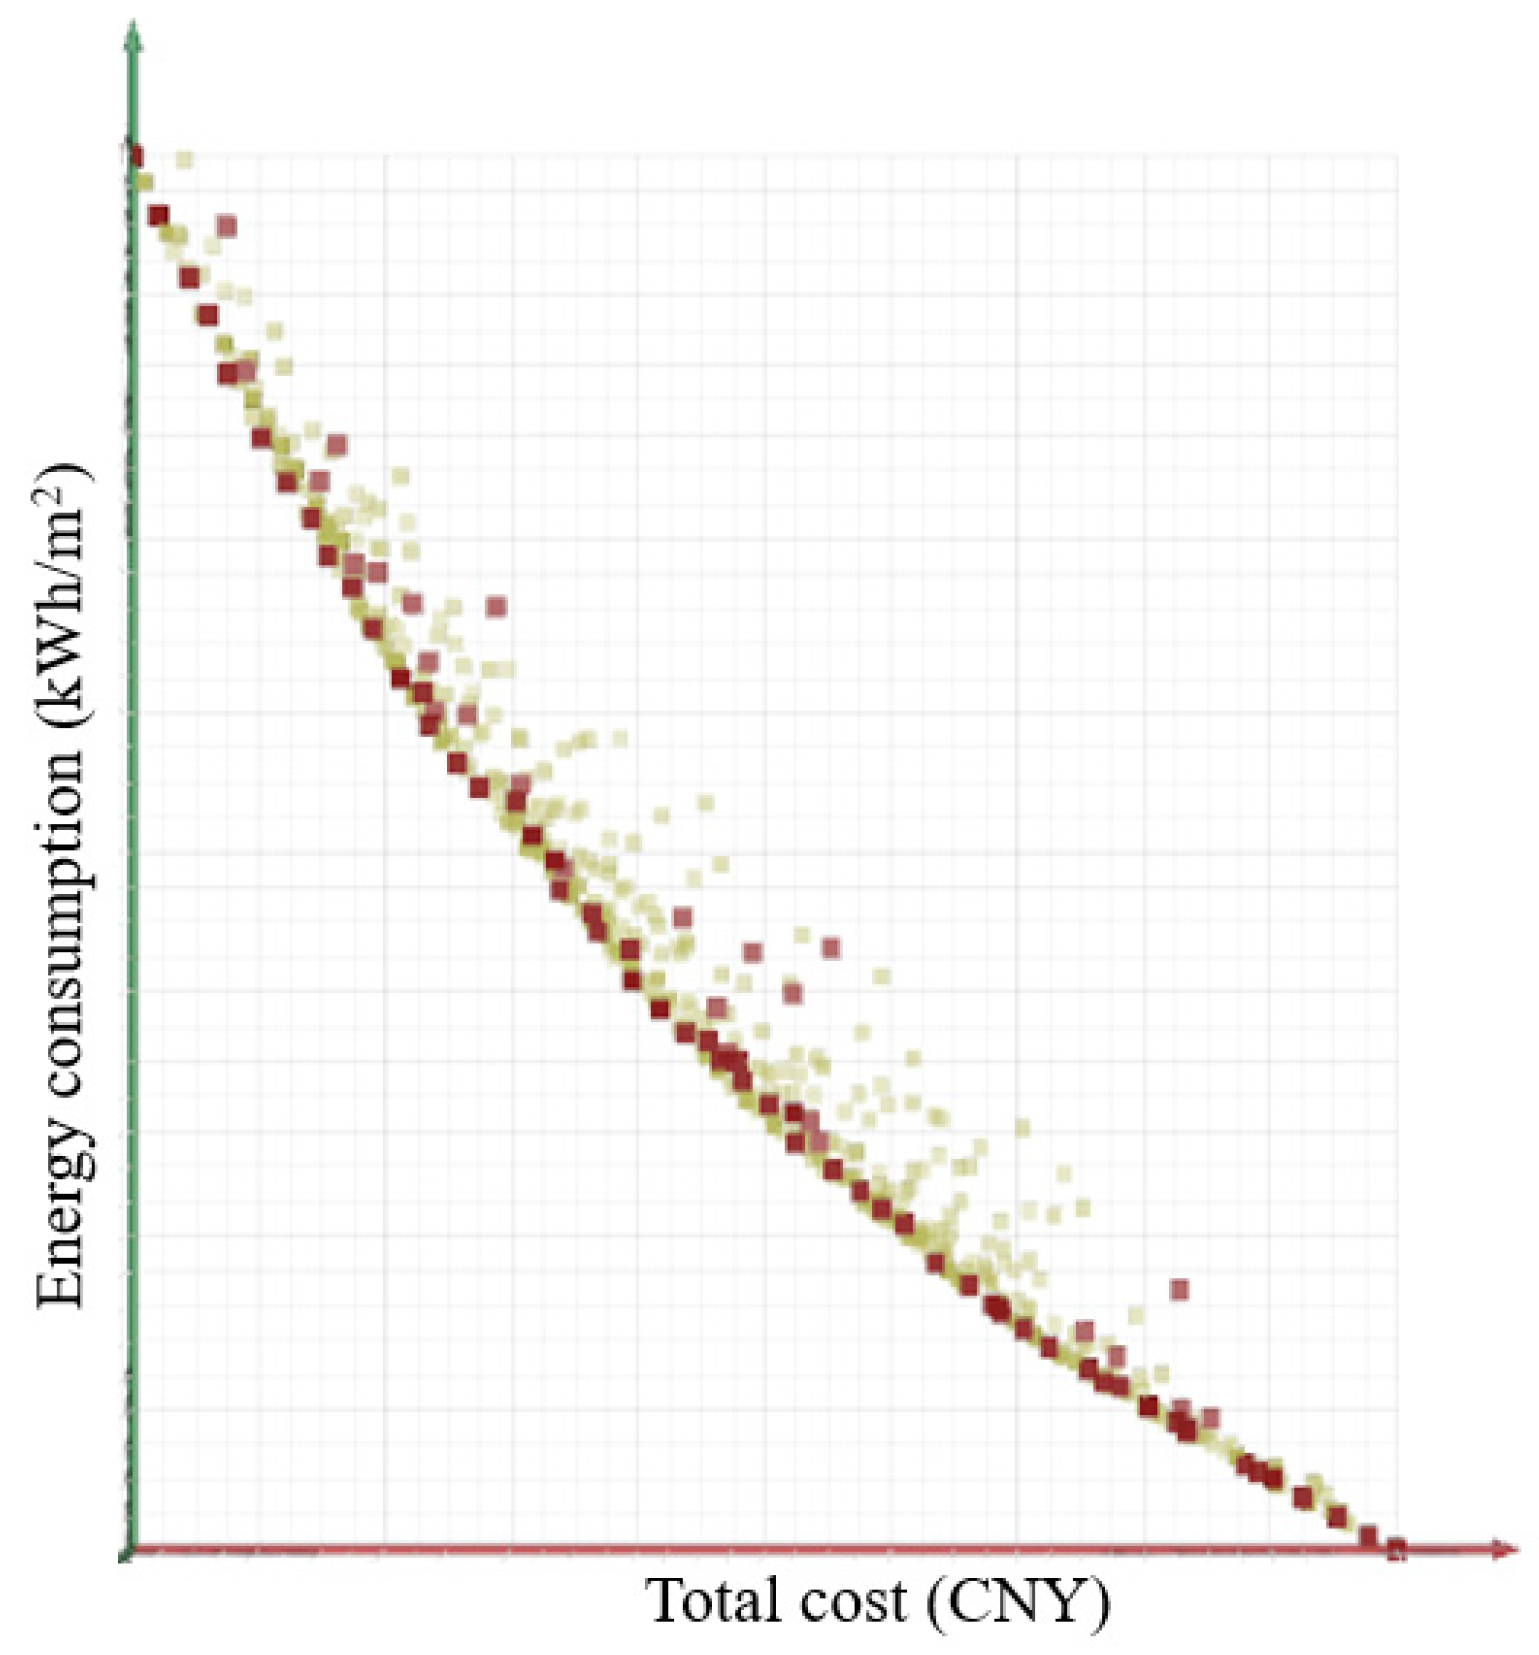
4.1. Optimization Results

In the floor plan generation method, the specific range of values for window-to-wall ratio, bays, depths, and interleaved length parameters could be determined using Function (3). In this case, j = 3. The threshold was adjusted appropriately according to the limitation of b i a i j M . Finally, the bays, depths, and interleaved lengths were limited to a small range of values. The Galapagos parameters were set as stated in Table A1 during the optimization process, and convergence was mostly obtained at around 80 iterations, with the optimization ending after around 120 generations. Table 5 shows a comparison of the model before and after the plan optimization with improved energy consumption as the aim. Table A1 in the Appendix A shows the detail of optimization technique used. It can be seen that after the optimization, the building energy consumption and interleaved length between each functional space are reduced.
In the optimization of the component selection method, the model was inherited from the previous optimization step without any modification and then the enumeration method was used to optimize the material and structure. The Octopus parameters were set as stated in Table A3 during the optimization process. The step size of the thickness in the optimization process was 0.05 m and the distribution was between 0 and 0.15 m. The curves of the energy consumption and cost for different insulation materials with different constructions is shown in Figure 6.
The energy-cost charts for the four orientations show the same pattern. Rock wool board material and polystyrene board material were closer to the 0-coordinate point of the coordinate system—i.e., they were better than the other insulation materials in terms of their reducing energy consumption and cost. Considering the cost of fire protection, rock wool board was selected as the optimal material in the next dual-objective optimization. From Figure 6, it can be seen that the two innermost curves are for sandwich insulation, which indicates that the effect of sandwich insulation is better than that of external insulation and internal insulation. Thus, sandwich insulation was chosen as the construction method for the optimization determination.
The thickness was selected as the optimization object, and basic convergence was achieved after 10 iterations. The Pareto frontier solution set (Figure 7) was derived after reaching the maximum number of iterations, and correlation plots between insulation thickness, total energy consumption, and total cost for each orientation were derived (Figure 8).
From the Pareto frontier solution set, it can be seen that the cost kept increasing and the total energy consumption kept decreasing as the total thickness increased within a certain thickness range, in accordance with the objective law.

4.2. Correlation Analysis Results

4.2.1. Correlation Analysis of Floor Plan Generation Method

Eleven influencing factors were selected as variables for regression analysis from the parameters that may affect energy consumption—namely, interleaved length, east window wall ratio, south window wall ratio, west window wall ratio, north window wall ratio, east exterior wall area, south exterior wall area, west exterior wall area, north exterior wall area, shape coefficient, and aspect ratio. After exporting 3680 sets of data from the optimization process and eliminating 3 sets of invalid data, we obtained 3677 sets of valid data. The validity of the selected variables was first determined by testing the multicollinearity; if the variance inflation factor (VIF) of each variable was tested to be less than 10 (Table 6), this meant that each variable had a certain degree of independence. A significance test was then performed, yielding an overall p-value of 0.0001 less than 0.05—i.e., the proposed model was valid at a 95% confidence interval. Additionally, the p-value for each variable (Table 7) was less than 0.05—i.e., each variable was significant at a 95% confidence interval. The larger the standard regression coefficient of a variable is, the more important the variable is under the same condition. The variables are ranked in Table 7, and it can be seen that parameters such as the shape coefficient and the window-to-wall ratio are more important than the area of the exterior walls of each orientation—i.e., when making adjustments, the radiant area of the walls and windows of each orientation can be appropriately altered while controlling the shape coefficient and the window-to-wall ratio.

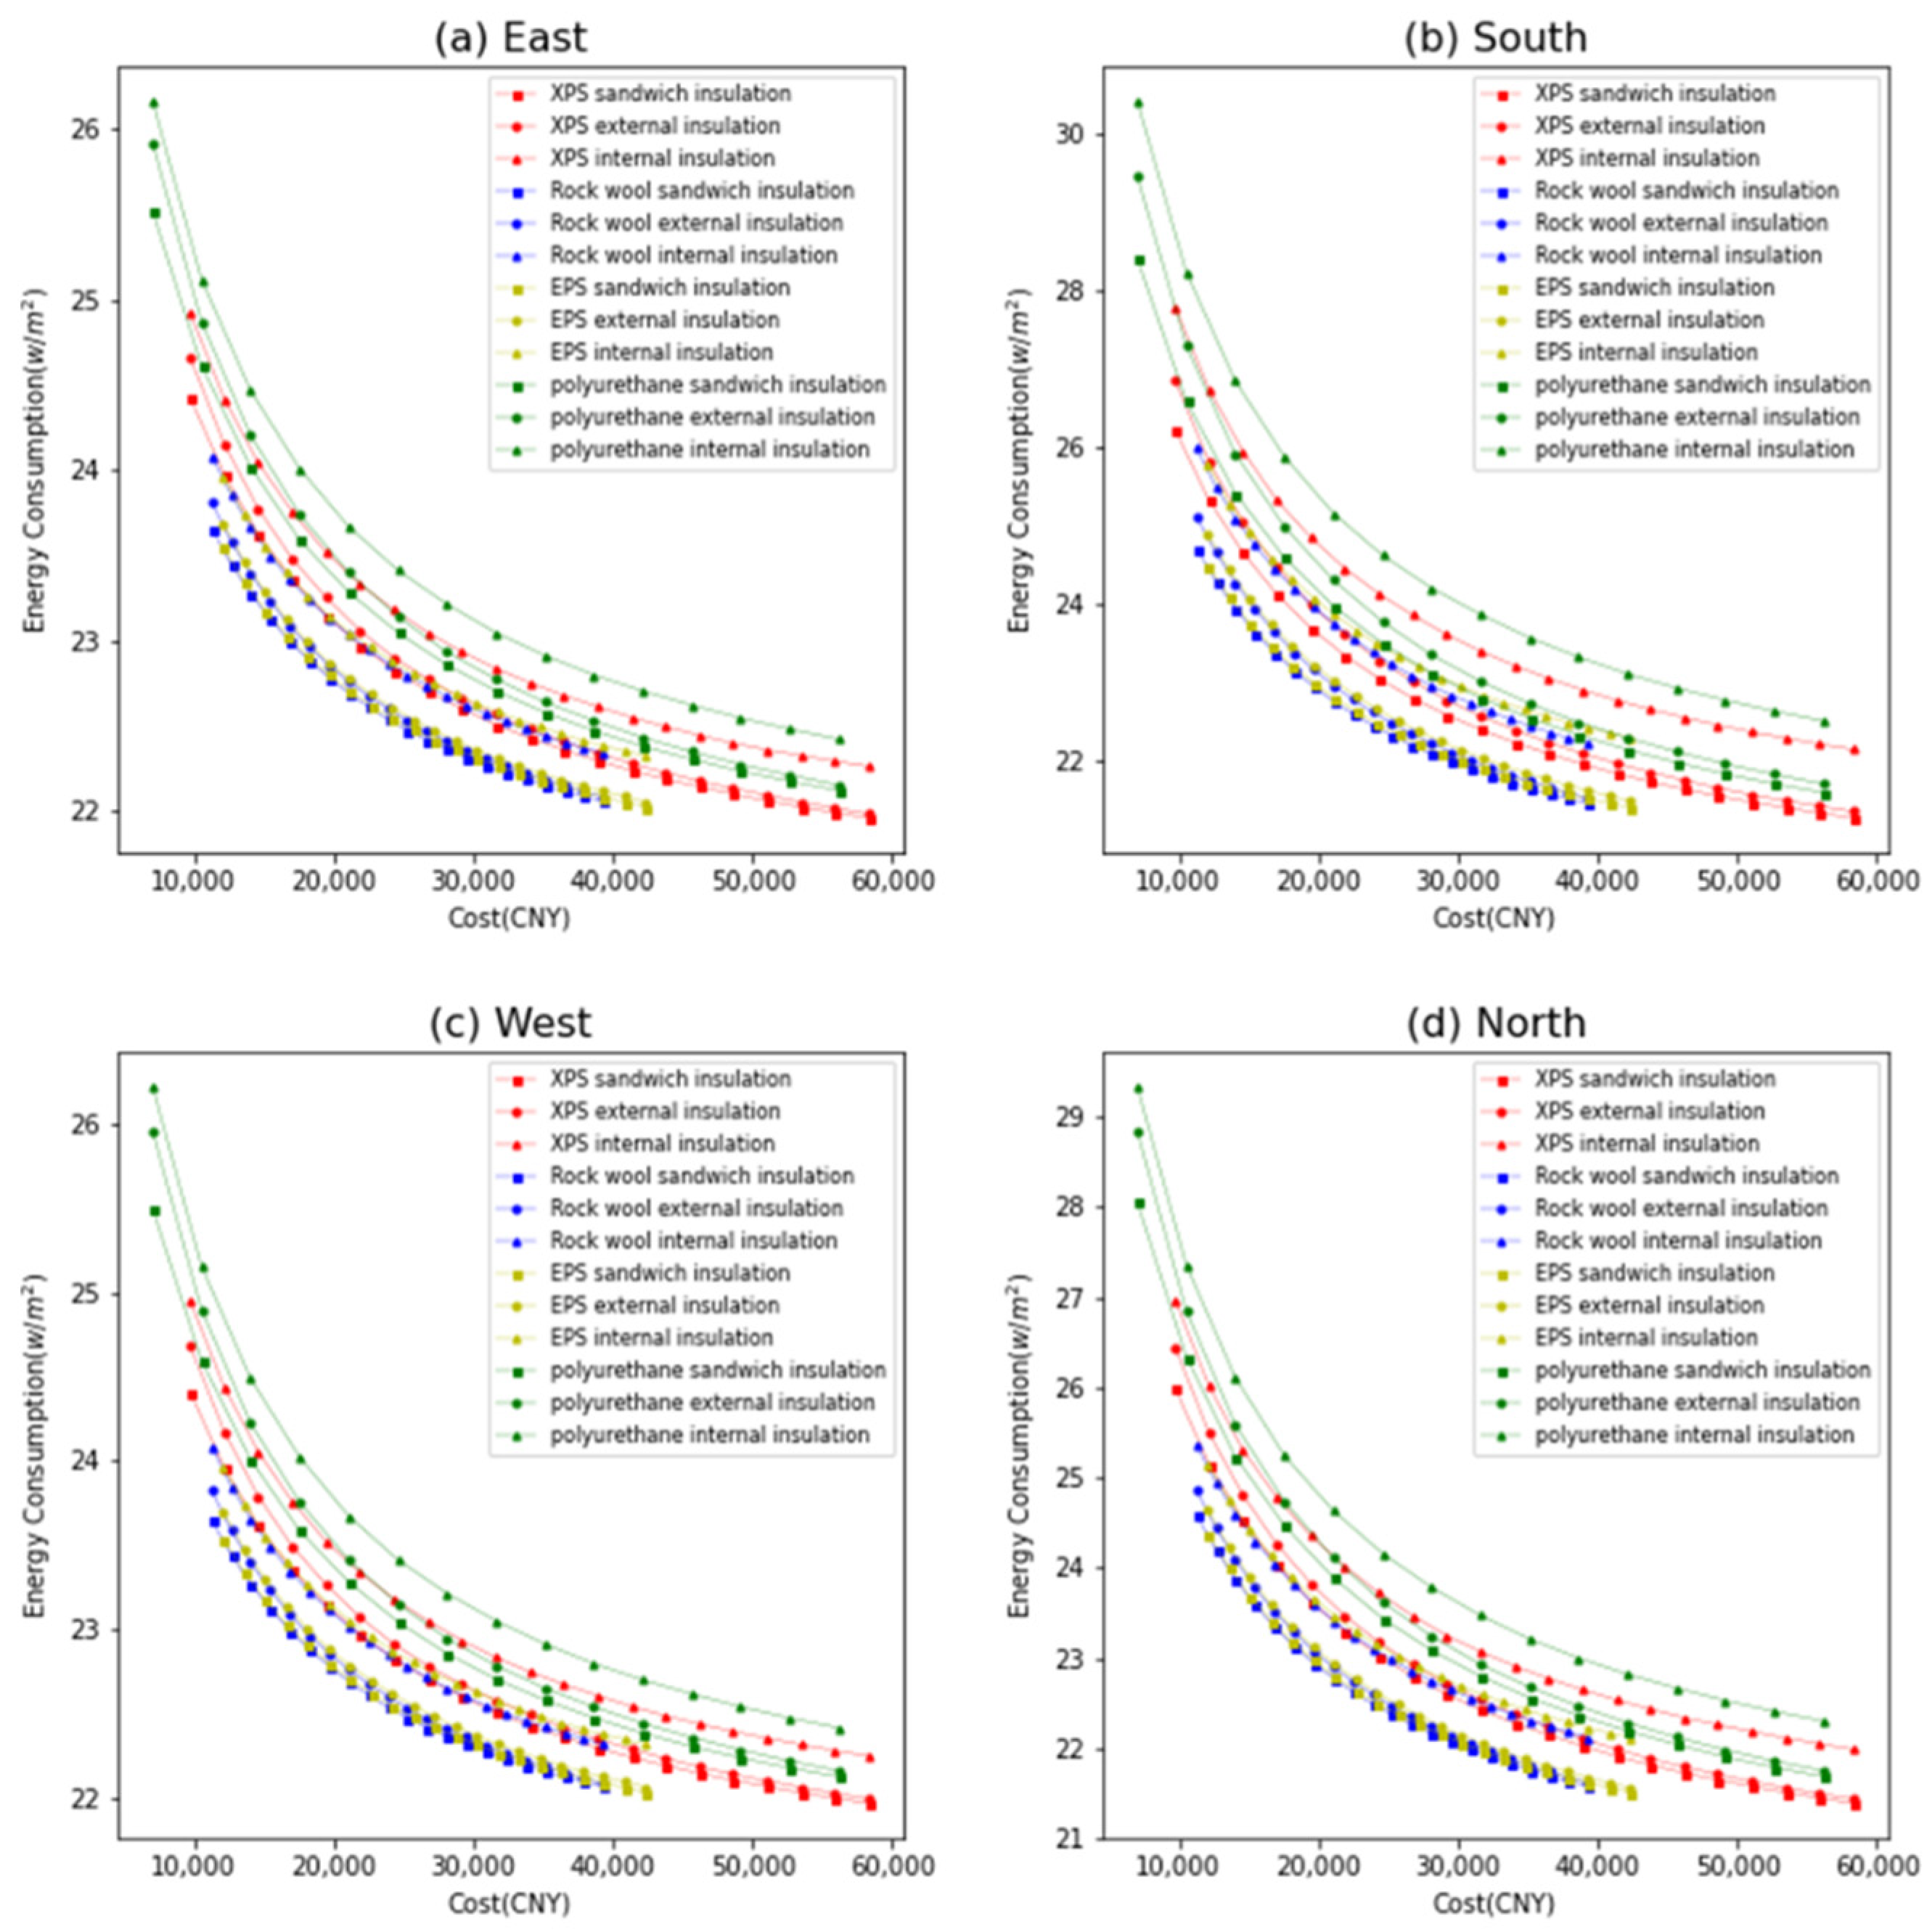
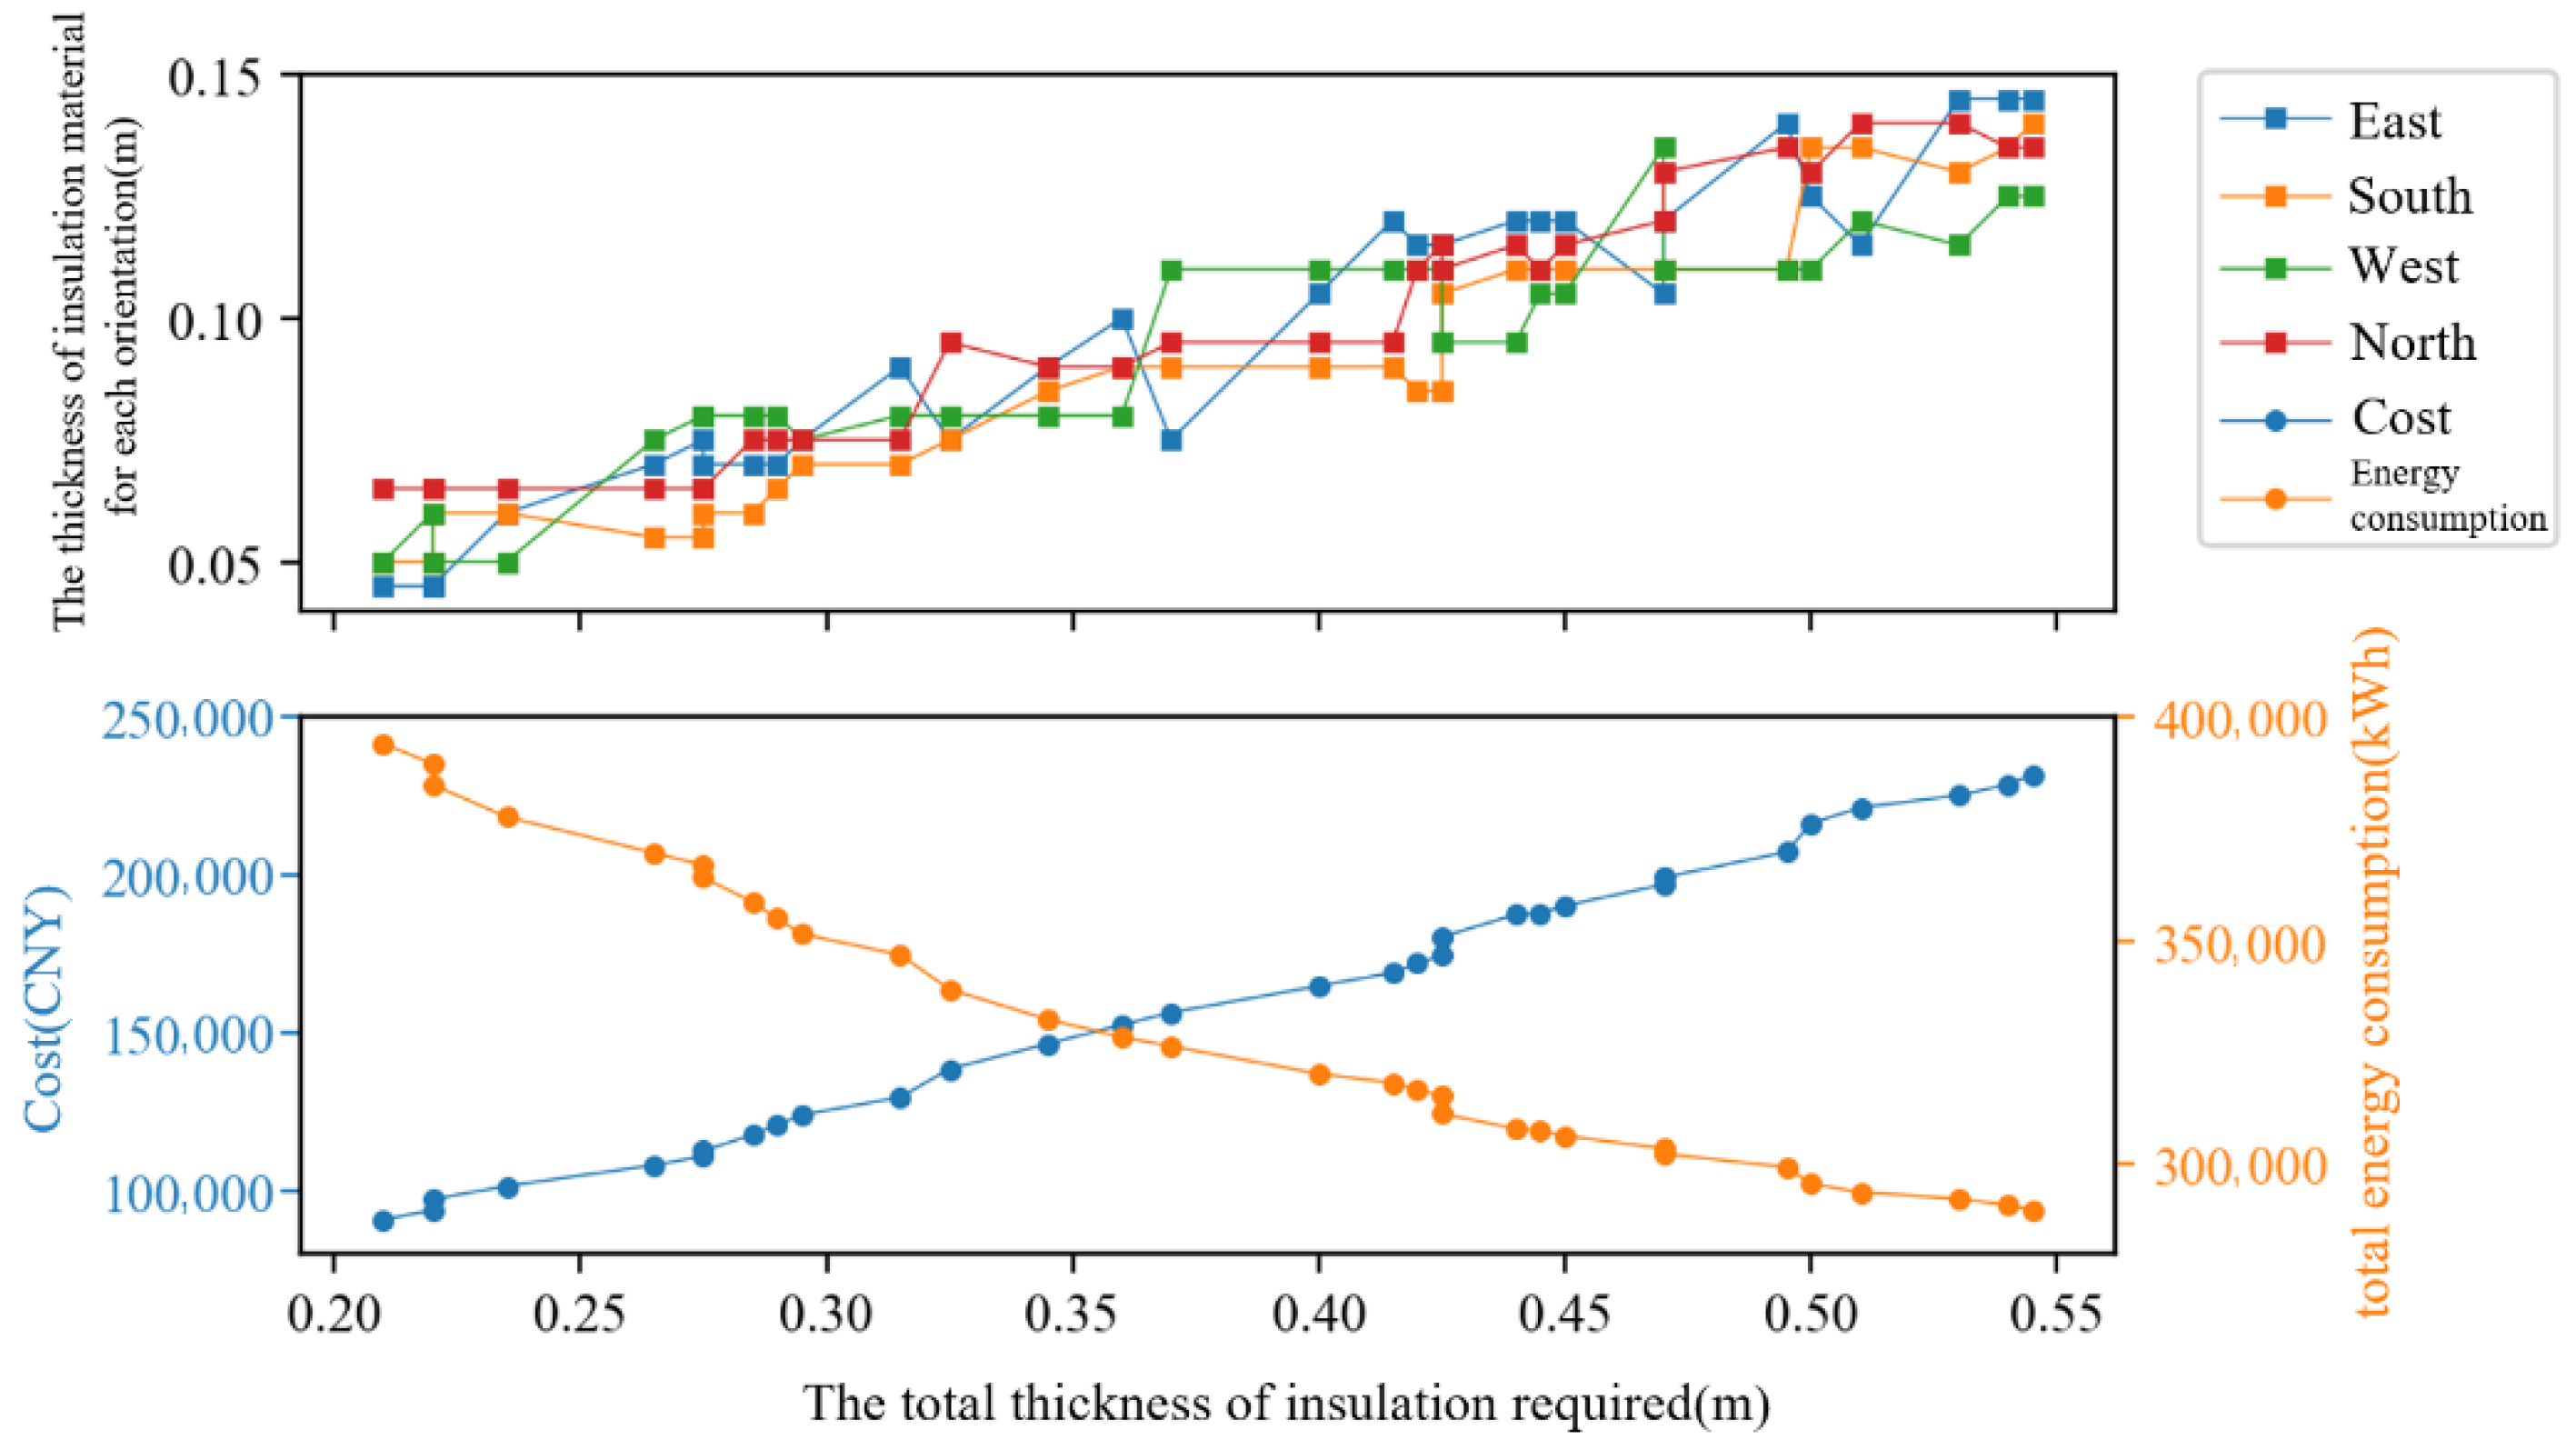
4.2.2. Correlation Analysis of Component Selection Method

In the phase of correlation analysis, only the relationship between the percentage of the thickness of the insulation in each orientation to the total insulation thickness and the total energy consumption is required, given that the types of material and construction have already been determined (Table 8).
A negative correlation could be observed between the insulation thickness in the east/south directions and total energy consumption—i.e., increasing the proportion of the insulation in the east and south directions will decrease the total energy consumption; conversely, increasing the proportion of the insulation in the west and north directions will increase the total energy consumption. From a correlation point of view, in order to reduce the total building energy consumption, the insulation of east- and south-oriented buildings should be appropriately increased and the insulation of west- and north-oriented buildings should be reduced under a certain cost limit.

5. Conclusions

  • Simulation-based single-objective or multi-objective optimization can be performed for prefabricated buildings. Unlike traditional buildings, the building modulus and component selection need to be considered in the optimization process. This not only meets the demand for the standardization of prefabricated buildings, but also increases the speed of optimization computation through reducing the number of values taken from parameters.
  • A novel, modular parametric modeling approach was proposed and applied in the floor plan generation method. After this, the optimal generation of prefabricated high-rise buildings in Tianjin was completed based on this method. The correlation between each parameter and energy consumption was also studied, and it was concluded that the shape coefficient and window-to-wall ratio are the main factors affecting the energy consumption of the buildings in Tianjin.
  • A preliminary component selection method based on computer simulation was proposed—i.e., the component selection for the prefabricated building was mainly carried out to determine the construction of exterior walls, the selection of insulation materials, and the thickness of the insulation layer. By optimizing the generated models, it was finally concluded that sandwich insulation constructions and rock wool board insulation materials should be selected for buildings in Tianjin. According to the correlation analysis, the thickness of the insulation material in the east and south directions should be increased under a certain cost limit in order to reduce the total energy consumption of buildings.

Author Contributions

Conceptualization, J.G.; methodology, M.L.; software, M.L.; validation, J.G.; formal analysis, Z.J.; investigation, M.L.; resources, Z.J.; data curation, Z.J.; writing—original draft preparation, M.L., Z.W. and Y.Z.; writing—review and editing, M.L., Z.W. and Y.Z.; visualization, M.L., Z.J. and Z.W.; supervision, J.G.; project administration, J.G.; funding acquisition, J.G. All authors have read and agreed to the published version of the manuscript.

Funding

This work was supported by the project funded by Tianjin Natural Science Foundation (Grant No. 18JCQNJC08200).

Conflicts of Interest

The authors declare no conflict of interest.

Appendix A

Table A1. Parameter setting of Galapagos.
ProjectThe Maximum Number of
Iterations
Population SizeMultiplier of
Initial Boost
Value120302
ProjectProportion of retained elitesCrossover ratio
value5%75%
Table A2. Tianjin area floor plan generation process results.
Number of Iterations04812
Plan shape Applsci 12 03740 i003 Applsci 12 03740 i004 Applsci 12 03740 i005 Applsci 12 03740 i006
Energy consumption ( kWh / m 2 )86.1870.5463.1351.97
Number of iterations15192327
Plan shape Applsci 12 03740 i007 Applsci 12 03740 i008 Applsci 12 03740 i009 Applsci 12 03740 i010
Energy consumption ( kWh / m 2 )42.8634.5228.0927.55
Number of iterations31353943
Plan shape Applsci 12 03740 i011 Applsci 12 03740 i012 Applsci 12 03740 i013 Applsci 12 03740 i014
Energy consumption ( kWh / m 2 )27.1426.7826.2125.95
Number of iterations47515559
Plan shape Applsci 12 03740 i015 Applsci 12 03740 i016 Applsci 12 03740 i017 Applsci 12 03740 i018
Energy consumption ( kWh / m 2 )24.5124.1924.0123.88
Number of iterations62667074
Plan shape Applsci 12 03740 i019 Applsci 12 03740 i020 Applsci 12 03740 i021 Applsci 12 03740 i022
Energy consumption ( kWh / m 2 )23.3122.8922.4522.13
Number of iterations78828589
Plan shape Applsci 12 03740 i023 Applsci 12 03740 i024 Applsci 12 03740 i025 Applsci 12 03740 i026
Energy consumption ( kWh / m 2 )21.9521.1520.9220.3
Number of iterations9397101105
Plan shape Applsci 12 03740 i027 Applsci 12 03740 i028 Applsci 12 03740 i029 Applsci 12 03740 i030
Energy consumption ( kWh / m 2 )19.919.619.2218.87
Number of iterations108112116120
Plan shape Applsci 12 03740 i031 Applsci 12 03740 i032 Applsci 12 03740 i033 Applsci 12 03740 i034
Energy consumption ( kWh / m 2 )18.7318.6618.5518.11
Table A3. Parameter setting of Octopus.
ProjectThe Maximum Number of
Iterations
Population SizeMultiplier of
Initial Boost
Value506050%
ProjectRatio of variationCrossover ratio
Value50%80%

References

  1. Park, C.; Kim, C.; Lee, S.; Lim, G.; Lee, S.; Choi, Y. Effect of Control Strategy on Performance and Emissions of Natural Gas Engine for Cogeneration System. Energy 2015, 82, 353–360. [Google Scholar] [CrossRef]
  2. China Construction Energy Conservation Association 2020 China Building Energy Consumption Research Report. Available online: https://www.cabee.org/site/content/24021.html (accessed on 14 February 2022).
  3. Long, H. Inquiry of restrictive factors for green building development. Jiangxi Build. Mater. 2021, 2, 189–191. [Google Scholar]
  4. Caldas, L.; Norford, L. A Design Optimization Tool Based on a Genetic Algorithm. Autom. Constr. 2002, 11, 173–184. [Google Scholar] [CrossRef]
  5. Ferrara, M.; Fabrizio, E.; Virgone, J.; Filippi, M. A Simulation-Based Optimization Method for Cost-Optimal Analysis of Nearly Zero Energy Buildings. Energy Build. 2014, 84, 442–457. [Google Scholar] [CrossRef]
  6. Thalfeldt, M.; Pikas, E.; Kurnitski, J.; Voll, H. Facade Design Principles for Nearly Zero Energy Buildings in a Cold Climate. Energy Build. 2013, 67, 309–321. [Google Scholar] [CrossRef]
  7. Znouda, E.; Ghrab-Morcos, N.; Hadj-Alouane, A. Optimization of Mediterranean Building Design Using Genetic Algorithms. Energy Build. 2007, 39, 148–153. [Google Scholar] [CrossRef]
  8. Khoroshiltseva, M.; Slanzi, D.; Poli, I. A Pareto-Based Multi-Objective Optimization Algorithm to Design Energy-Efficient Shading Devices. Appl. Energy 2016, 184, 1400–1410. [Google Scholar] [CrossRef] [Green Version]
  9. Mandavinejad, M.; Nazar, N.S. Daylightophil High-Performance Architecture: Multi-Objective Optimization of Energy Efficiency and Daylight Availability in BSk Climate. In Proceedings of the International Conference—Alternative and Renewable Energy Quest (areq 2017), Barcelona, Spain, 1–3 February 2017; Amer, M., Sotoca, A., Nasselli, F., Mohareb, N., Alalouch, C., Eds.; Elsevier Science Bv: Amsterdam, The Netherlands, 2017; Volume 115, pp. 92–101. [Google Scholar]
  10. Sun, C.; Liu, Q.; Han, Y. Many-Objective Optimization Design of a Public Building for Energy, Daylighting and Cost Performance Improvement. Appl. Sci. 2020, 10, 2435. [Google Scholar] [CrossRef] [Green Version]
  11. Gou, S.; Nik, V.M.; Scartezzini, J.-L.; Zhao, Q.; Li, Z. Passive Design Optimization of Newly-Built Residential Buildings in Shanghai for Improving Indoor Thermal Comfort While Reducing Building Energy Demand. Energy Build. 2018, 169, 484–506. [Google Scholar] [CrossRef]
  12. Bingbing, Z. Application analysis of domestic and foreign application. Tiles Bricks 2017, 9, 47–48. [Google Scholar] [CrossRef]
  13. Yan, J. prefabricated building standardization helps to promote the overall development of residential industrialization. Archit. Des. Manag. 2015, 32, 44–45. [Google Scholar]
  14. Goldfinch, D.A. Health Centre Design; Prefabricated Construction. Hosp. Health Manag. 1949, 12, 11–14. [Google Scholar] [PubMed]
  15. Yu, J.; Yang, C.; Tian, L.; Liao, D. A Study on Optimum Insulation Thicknesses of External Walls in Hot Summer and Cold Winter Zone of China. Appl. Energy 2009, 86, 2520–2529. [Google Scholar] [CrossRef]
  16. Jin, R.; Zhong, B.; Ma, L.; Hashemi, A.; Ding, L. Integrating BIM with Building Performance Analysis in Project Life-Cycle. Autom. Constr. 2019, 106, 102861. [Google Scholar] [CrossRef]
  17. Kheiri, F. A Review on Optimization Methods Applied in Energy-Efficient Building Geometry and Envelope Design. Renew. Sust. Energ. Rev. 2018, 92, 897–920. [Google Scholar] [CrossRef]
  18. Ming, Z.; Shudong, S. Genetic Algorithm Principle and Application; National Defense Industry Press: Beijing, China, 1999; p. 77. [Google Scholar]
  19. Jie, S. Application Research on Green Building Techniques Based on Grasshopper. Master’s Thesis, South China University of Technology, Guangzhou, China, 2012. [Google Scholar]
  20. Mattson, C.A.; Messac, A. Pareto Frontier Based Concept Selection under Uncertainty, with Visualization. Optim. Eng. 2005, 6, 85–115. [Google Scholar] [CrossRef]
  21. Haiyan, W.; Fangting, Y.; Lu, L. Comparison and Application of Standardization Coefficient and Delay Comparison Coefficient. Quant. Econ. Tech. Econ. Res. 2006, 9, 150–155. [Google Scholar]
  22. Farrar, D.E.; Glauber, R.R. Multicollinearity in Regression Analysis: The Problem Revisited. Rev. Econ. Stat. 1967, 49, 92–107. [Google Scholar] [CrossRef]
  23. Xia, X.; Xingguo, W. Multi-contiguous linear geometric explanation in linear regression. Stat. Decis. 2021, 37, 46–51. [Google Scholar] [CrossRef]
  24. Multicollinearity Test Example Using SPSS. Available online: http://www.spsstests.com/2015/03/multicollinearity-test-example-using.html (accessed on 16 March 2022).
  25. JGJ/T449-2018; Standard for Green Performance Calculation of Civil Buildings. Ministry of Housing and Urban-Rural Development of the People’s Republic of China, China Architecture & Building Press: Beijing, China, 2018.
  26. GB50176-2016; Code for Thermal Design of Civil Building. Ministry of Housing and Urban-Rural Development of the People’s Republic of China, China Architecture & Building Press: Beijing, China, 2016.
  27. Yan, K. China Residential Standardization History and Prospect. China Constr. 2007, 6, 22–24. [Google Scholar]
  28. Noori, M.; Ghattas, R.; Gregory, J.; Miller, T.; Olivetti, E.; Greene, S. Life Cycle Assessment for Residential Buildings: A Literature Review and Gap Analysis Rev. 1. 2016. Available online: https://www.researchgate.net/publication/309034390_Life_Cycle_Assessment_for_Residential_Buildings_A_Literature_Review_and_Gap_Analysis_Rev_1/citations (accessed on 16 March 2022).
  29. Zhenyu, Y.; Fei, L.; Yu, Z.; Wei, X.; Dening, S. Application of Multi-Objective Optimization Method Based on Multi-Objective Optimization Design of Near Zero Energy Consumption Building. Archit. Sci. 2019, 35, 8–15. [Google Scholar] [CrossRef]
Figure 1. Optimized design workflow based on floor plan generation and component selection.
Applsci 12 03740 g001
Figure 2. Genetic algorithm calculation process.
Applsci 12 03740 g002
Figure 3. The laws of arrangement of each functional space.
Applsci 12 03740 g003
Figure 4. Three-dimensional axonometric drawing of the building model.
Applsci 12 03740 g004
Figure 5. Goals, parameters, and attributes of the different phases of the floor plan generation and component selection methods.
Applsci 12 03740 g005
Figure 6. Energy consumption and cost charts of various orientations and different insulation materials.
Applsci 12 03740 g006
Figure 7. Pareto frontier solution set.
Applsci 12 03740 g007
Figure 8. Chart of thickness–total energy consumption–cost.
Applsci 12 03740 g008
Table 1. Building geometric parameter threshold.
Geometric ParametersParameter
Thresholds
Bay depth of the living room (m × m)(2.8–3.3) × (4.0–6.0)
Bay depth of the dining room (m × m)(2.8–3.3) × (4.0–6.0)
Bay depth of the master bedroom (m × m)(2.4–3.0) × (3.2–3.6)
Bay depth of the secondary bedroom (m × m)(2.1–2.4) × (2.4–2,9)
Bay depth of the kitchen (m × m)(1.5–2.1) × (1.95–3.1)
Bay depth of the bathroom (m × m)(1.5–1.8) × (1.8–2.65)
Bay depth of the balcony (m × m)(1.8–3.3) × (1.2–1.5)
Bay depth of the corridor (m × m)-----
Window-to-wall ratio of each room0.1–0.9
Interleaved length between each functional space (m)−1.8–1.8
Table 2. The value of the attributes used in the optimization process.
The Name of the AttributesValue
Height between floors3 m
Number of floors30
Envelope wallsDefault values of constructs and materials
Operation schedules, equipment loadRelated standards [25,26]
Table 3. Ranges of the component selection method’s parameters.
Parameters of ComponentsRanges
Material of insulation layer{Extruded polystyrene, expanded polystyrene,
foamed polyurethane, rock wool}
Construction of components{External insulation, internal insulation, sandwich insulation}
Thickness of insulation layer in each direction (m)0–0.5
Table 4. The value of the attribute of the optimized process.
MaterialDensity
kg/m3
Specific Heat Capacity
J/kg·°C
Heat Transfer Coefficient
W/(m2·K)
Material Price
CNY/m3
Extruded polystyrene3513800.033450
Expanded polystyrene2513800.042280
Foamed polyurethane3013800.027650
Rock wool15012200.0045260
Table 5. Model comparison before and after optimization.
Number of Iterations0120
Plan shape Applsci 12 03740 i001 Applsci 12 03740 i002
Energy consumption ( kWh / m 2 )86.1818.11
Table 6. VIF value of each parameter.
Aspect RatioEast Window-to-Wall RatioWest Window-to-Wall RatioInterleaved LengthSouth Window-to-Wall RatioSouth Exterior Wall AreaShape Coefficient 1North Exterior Wall AreaNorth Window-to-Wall RatioWest Exterior Wall AreaEast Exterior Wall Area
VIF7.795.715.615.334.624.374.213.943.672.222.2
1 Shape coefficient: the ratio of the exterior area of a building in contact with the outdoor atmosphere to the volume it encloses.
Table 7. Standard regression coefficient of each parameter after standard regression.
Shape CoefficientNorth Window-to-Wall RatioSouth Window-to-Wall RatioWest Window-to-Wall RatioEast Window-to-Wall RatioInterleaved LengthSouth Exterior Wall AreaLength-Width RatioNorth Exterior Wall AreaEast Exterior Wall AreaWest Exterior Wall Area
p-value00000000000.012
Coefficient0.4920.2210.2090.1680.1420.0710.04650.0290.0200.0150.004
Table 8. Comparison of the model before and after the generation of building shape.
Thickness of Insulation Layer in Each Direction/Total ThicknessPearson Correlation
East ratio−0.427
West ratio0.361
South ratio−0.252
North ratio0.318
Publisher’s Note: MDPI stays neutral with regard to jurisdictional claims in published maps and institutional affiliations.

