
Categorization and Visualization of Issue Tickets to Support Understanding of Implemented Features in Software Development Projects

 , , and
Abstract
:1. Introduction
- RQ1.
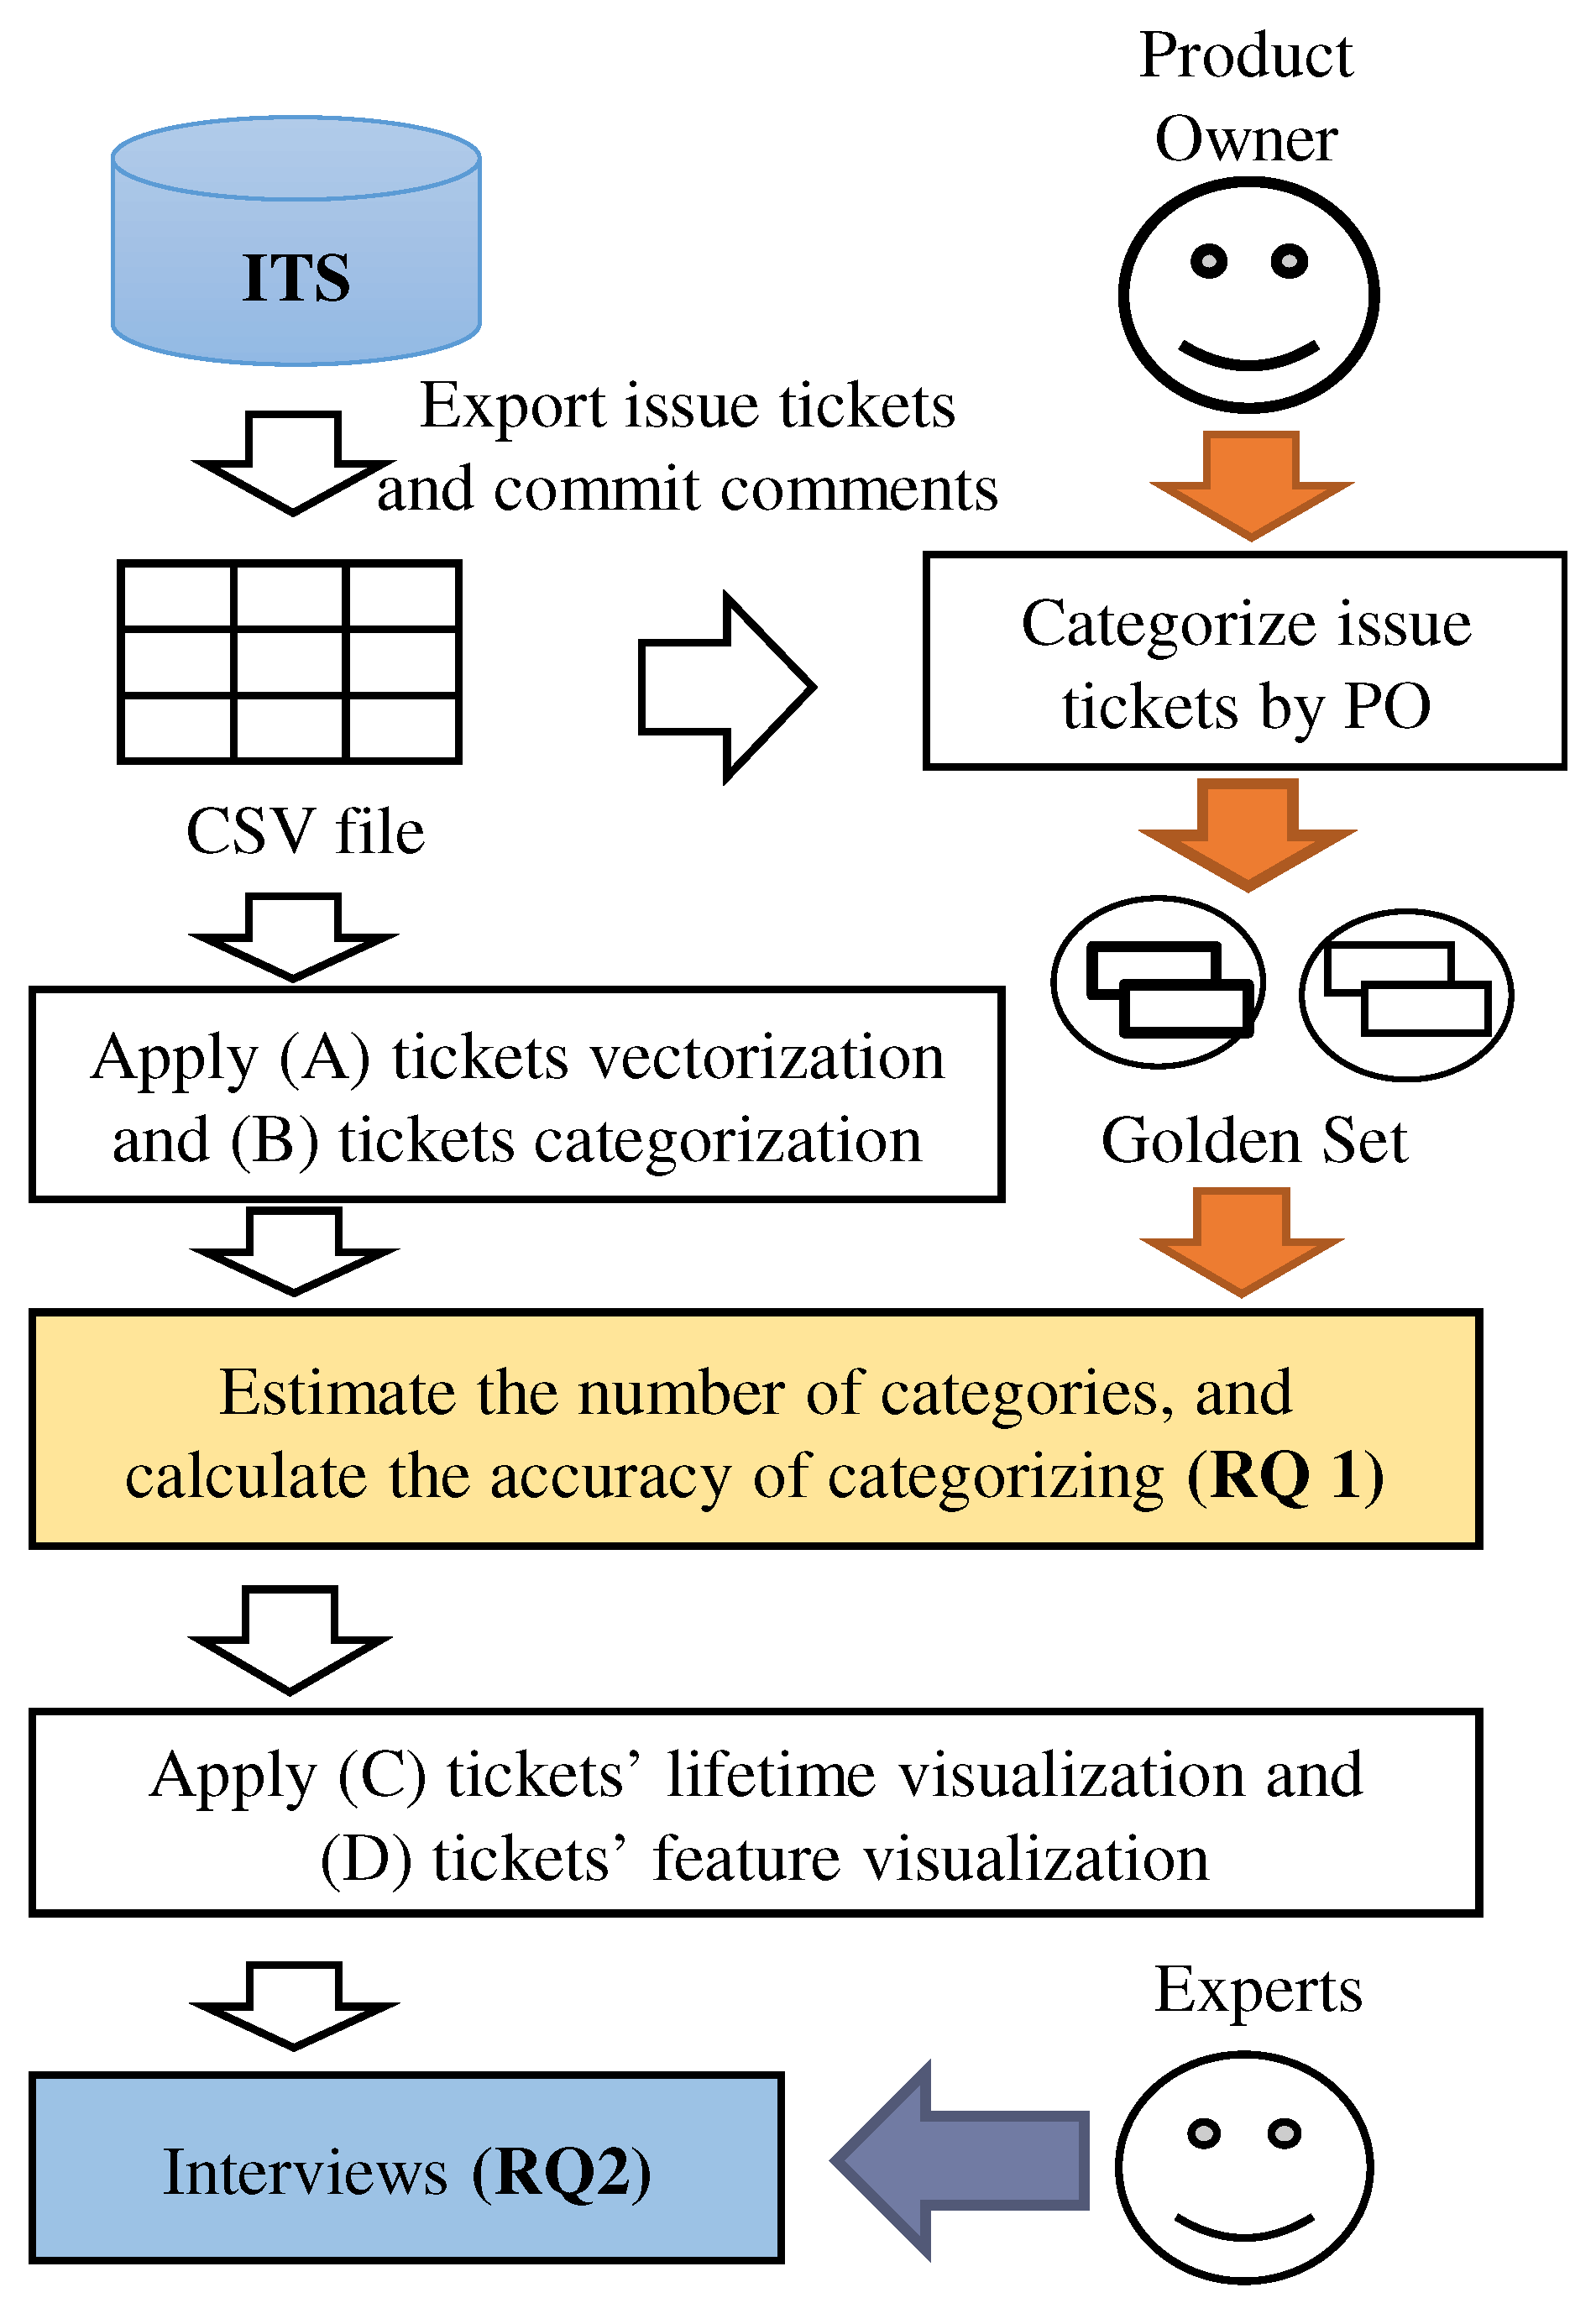
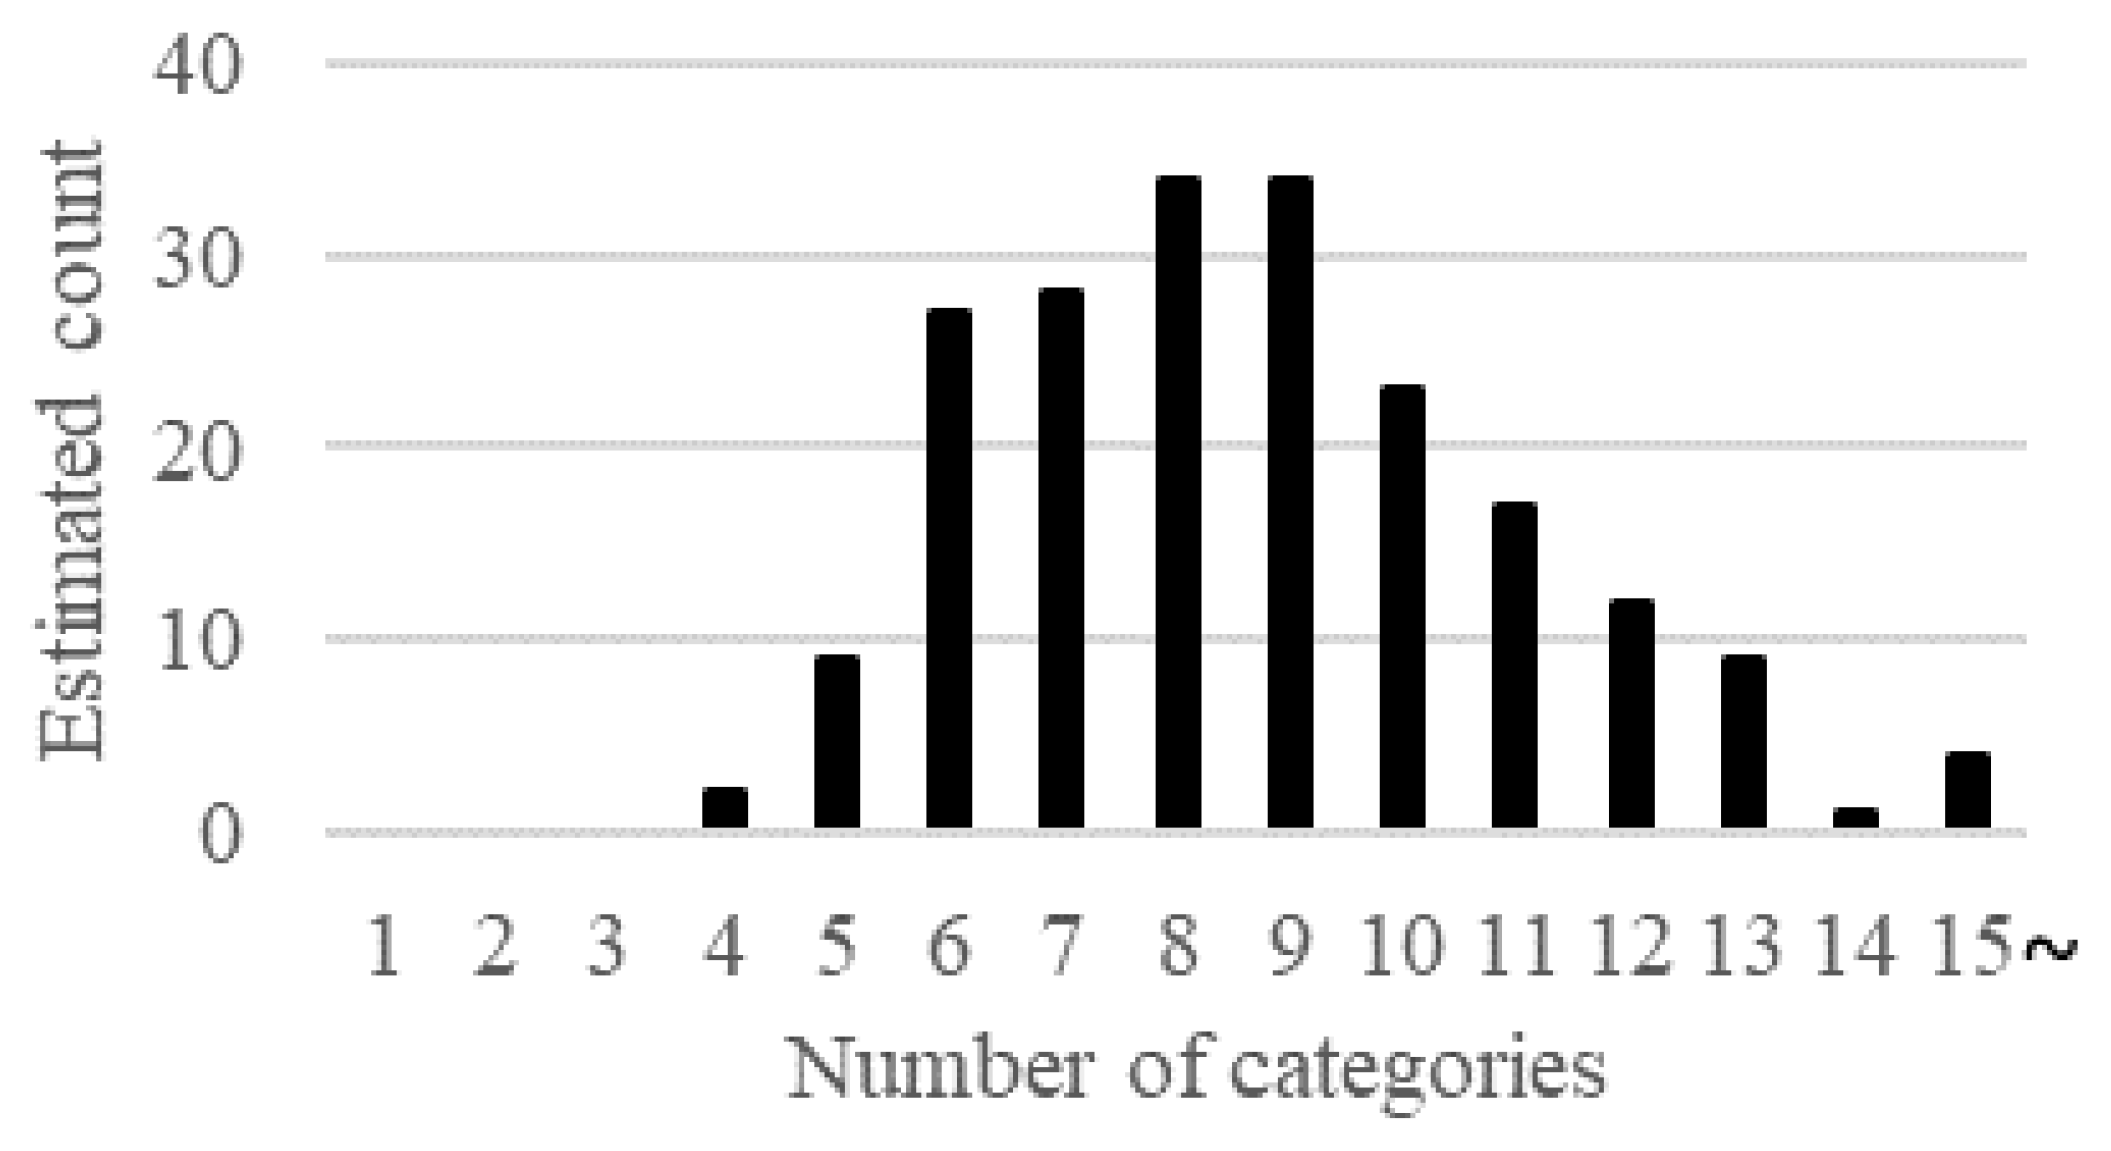
- Does our categorization method estimate the number of ticket categories and categorize tickets accurately? To answer this question, we categorized 111 tickets using K-means clustering and gap statistics. K-means is an unsupervised partitional clustering algorithm and one of the most widely used algorithms for grouping data [9]. K-means clustering is widely used to cluster requirement documents. Gap statistics is an automatic method to estimate the number of clusters. We evaluated the estimation accuracy for the number of ticket categories from the distribution of 200 automatic estimations. Furthermore, we assessed the categorization accuracy for tickets using well-known clustering measures [10].
- RQ2.
- Can our visualization method help new members understand the implemented features of a project? To answer this question, we interviewed two project members and three external experts. During the interviews, the results of the ticket categorization and the ticket visualization were shared because they show the lifetime and keywords of ticket categories as well as the relationships between categories. Interviewees were asked if our method helps comprehend the project’s features.
- RQ3.
- Does our method improve project comprehension? To answer this question, an experiment compared the comprehension of the target tasks using our method and a traditional method. The target tasks in the experiment were the same as those in the case study. Subjects were asked to perform four tasks: two comprehension tasks for activeness of ticket categories and two comprehension tasks for activeness of features. We divided the 28 subjects into two groups (i.e., the experimental group and the control group) to compare subjects’ comprehension correctness with and without the support of our method.
- RQ4.
- For which tasks is our method effective? To answer this question, we compared the statistical test results of all four tasks. Then we identified tasks with the most significant difference between the two groups.
2. Related Work
2.1. Requirement Classification
2.2. Requirement Visualization
2.3. Project Onboarding
3. Ticket Categorization and Visualization Method
3.1. Ticket Vectorization
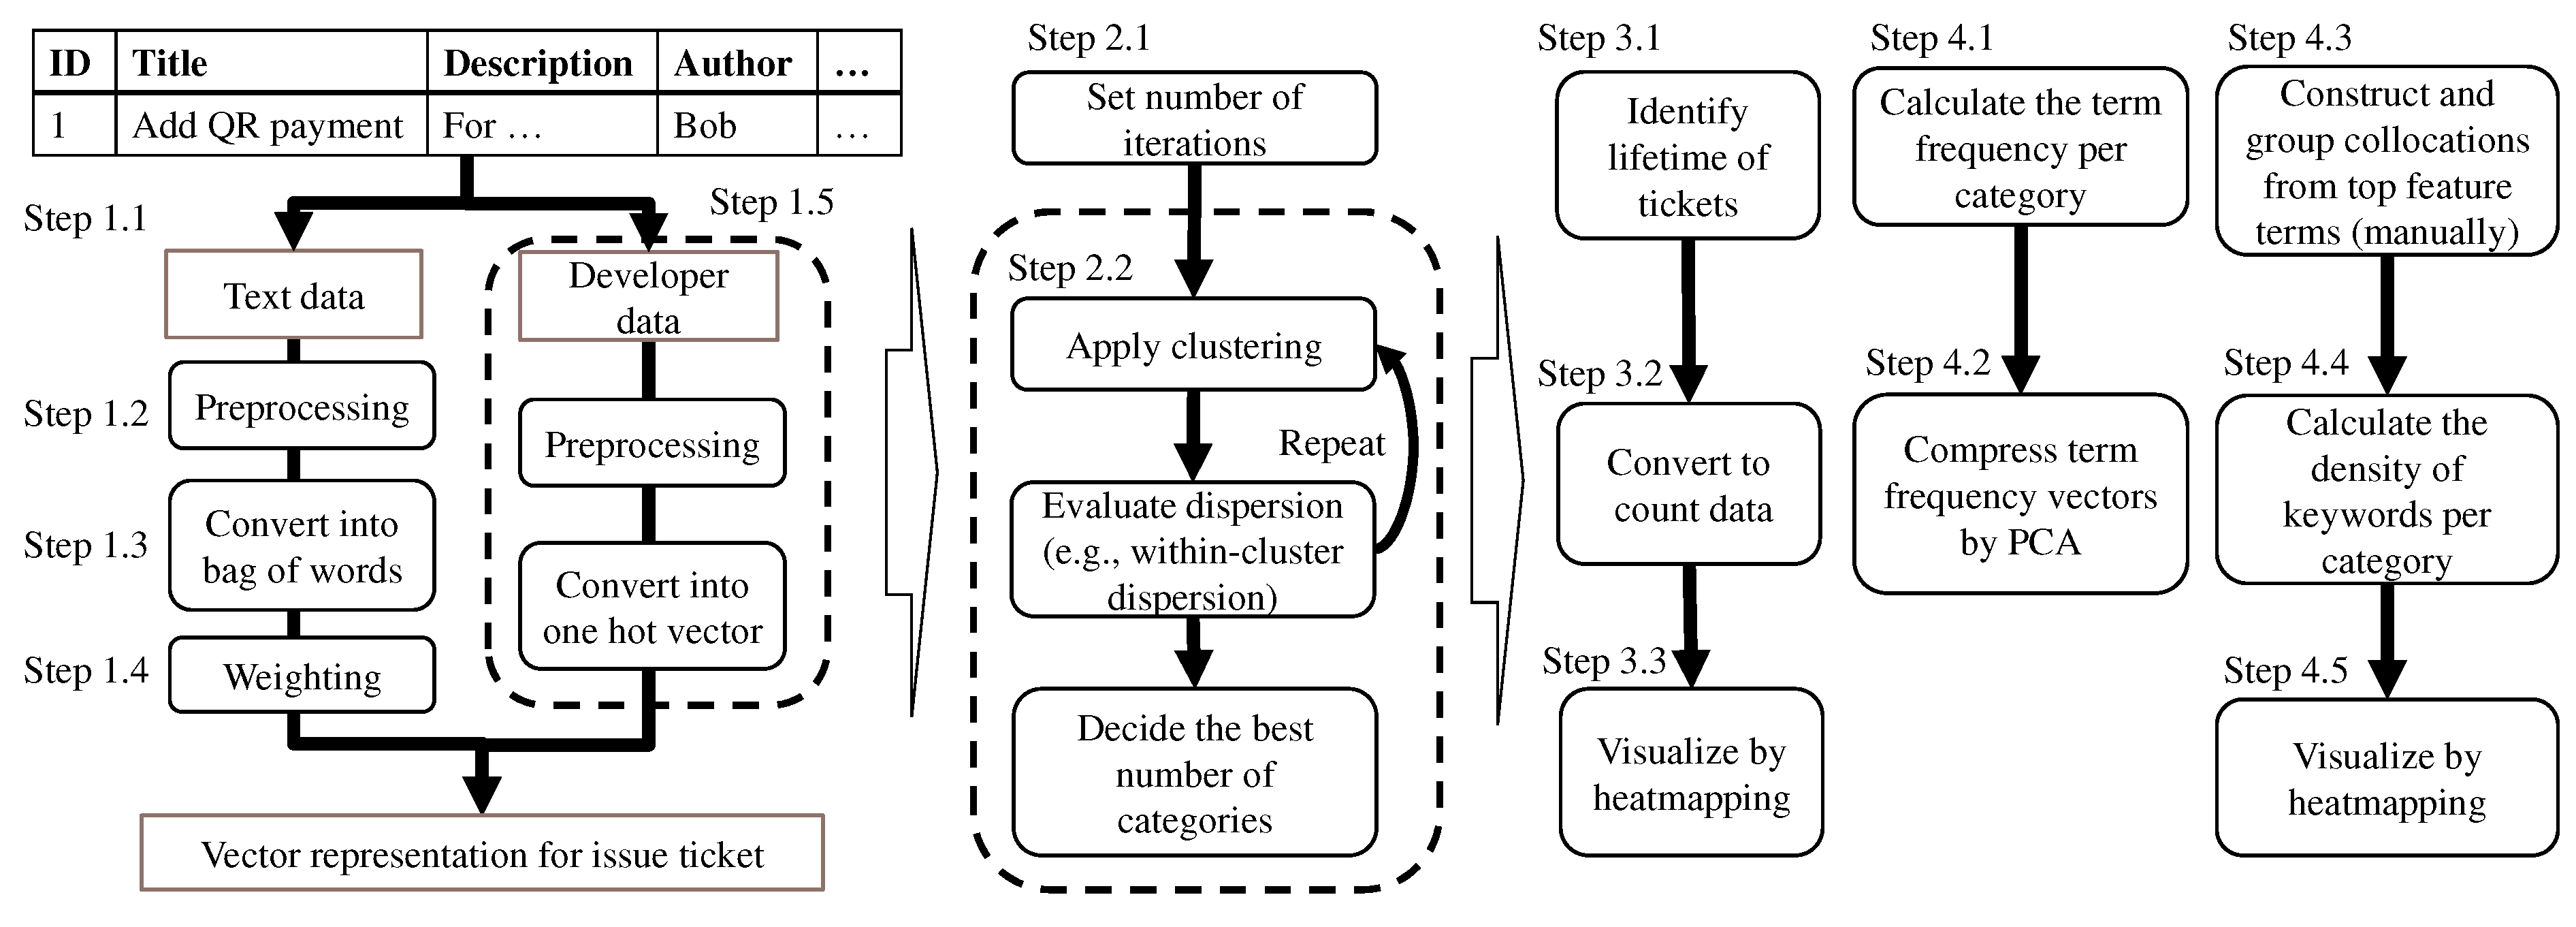
- Step 1.1. To handle tickets for natural language processing, select the text data columns that indicate the project’s features (e.g., ticket title). Multiple columns should be selected due to the small sentence length. For example, commit comments are useful because they may contain information about the features modified.
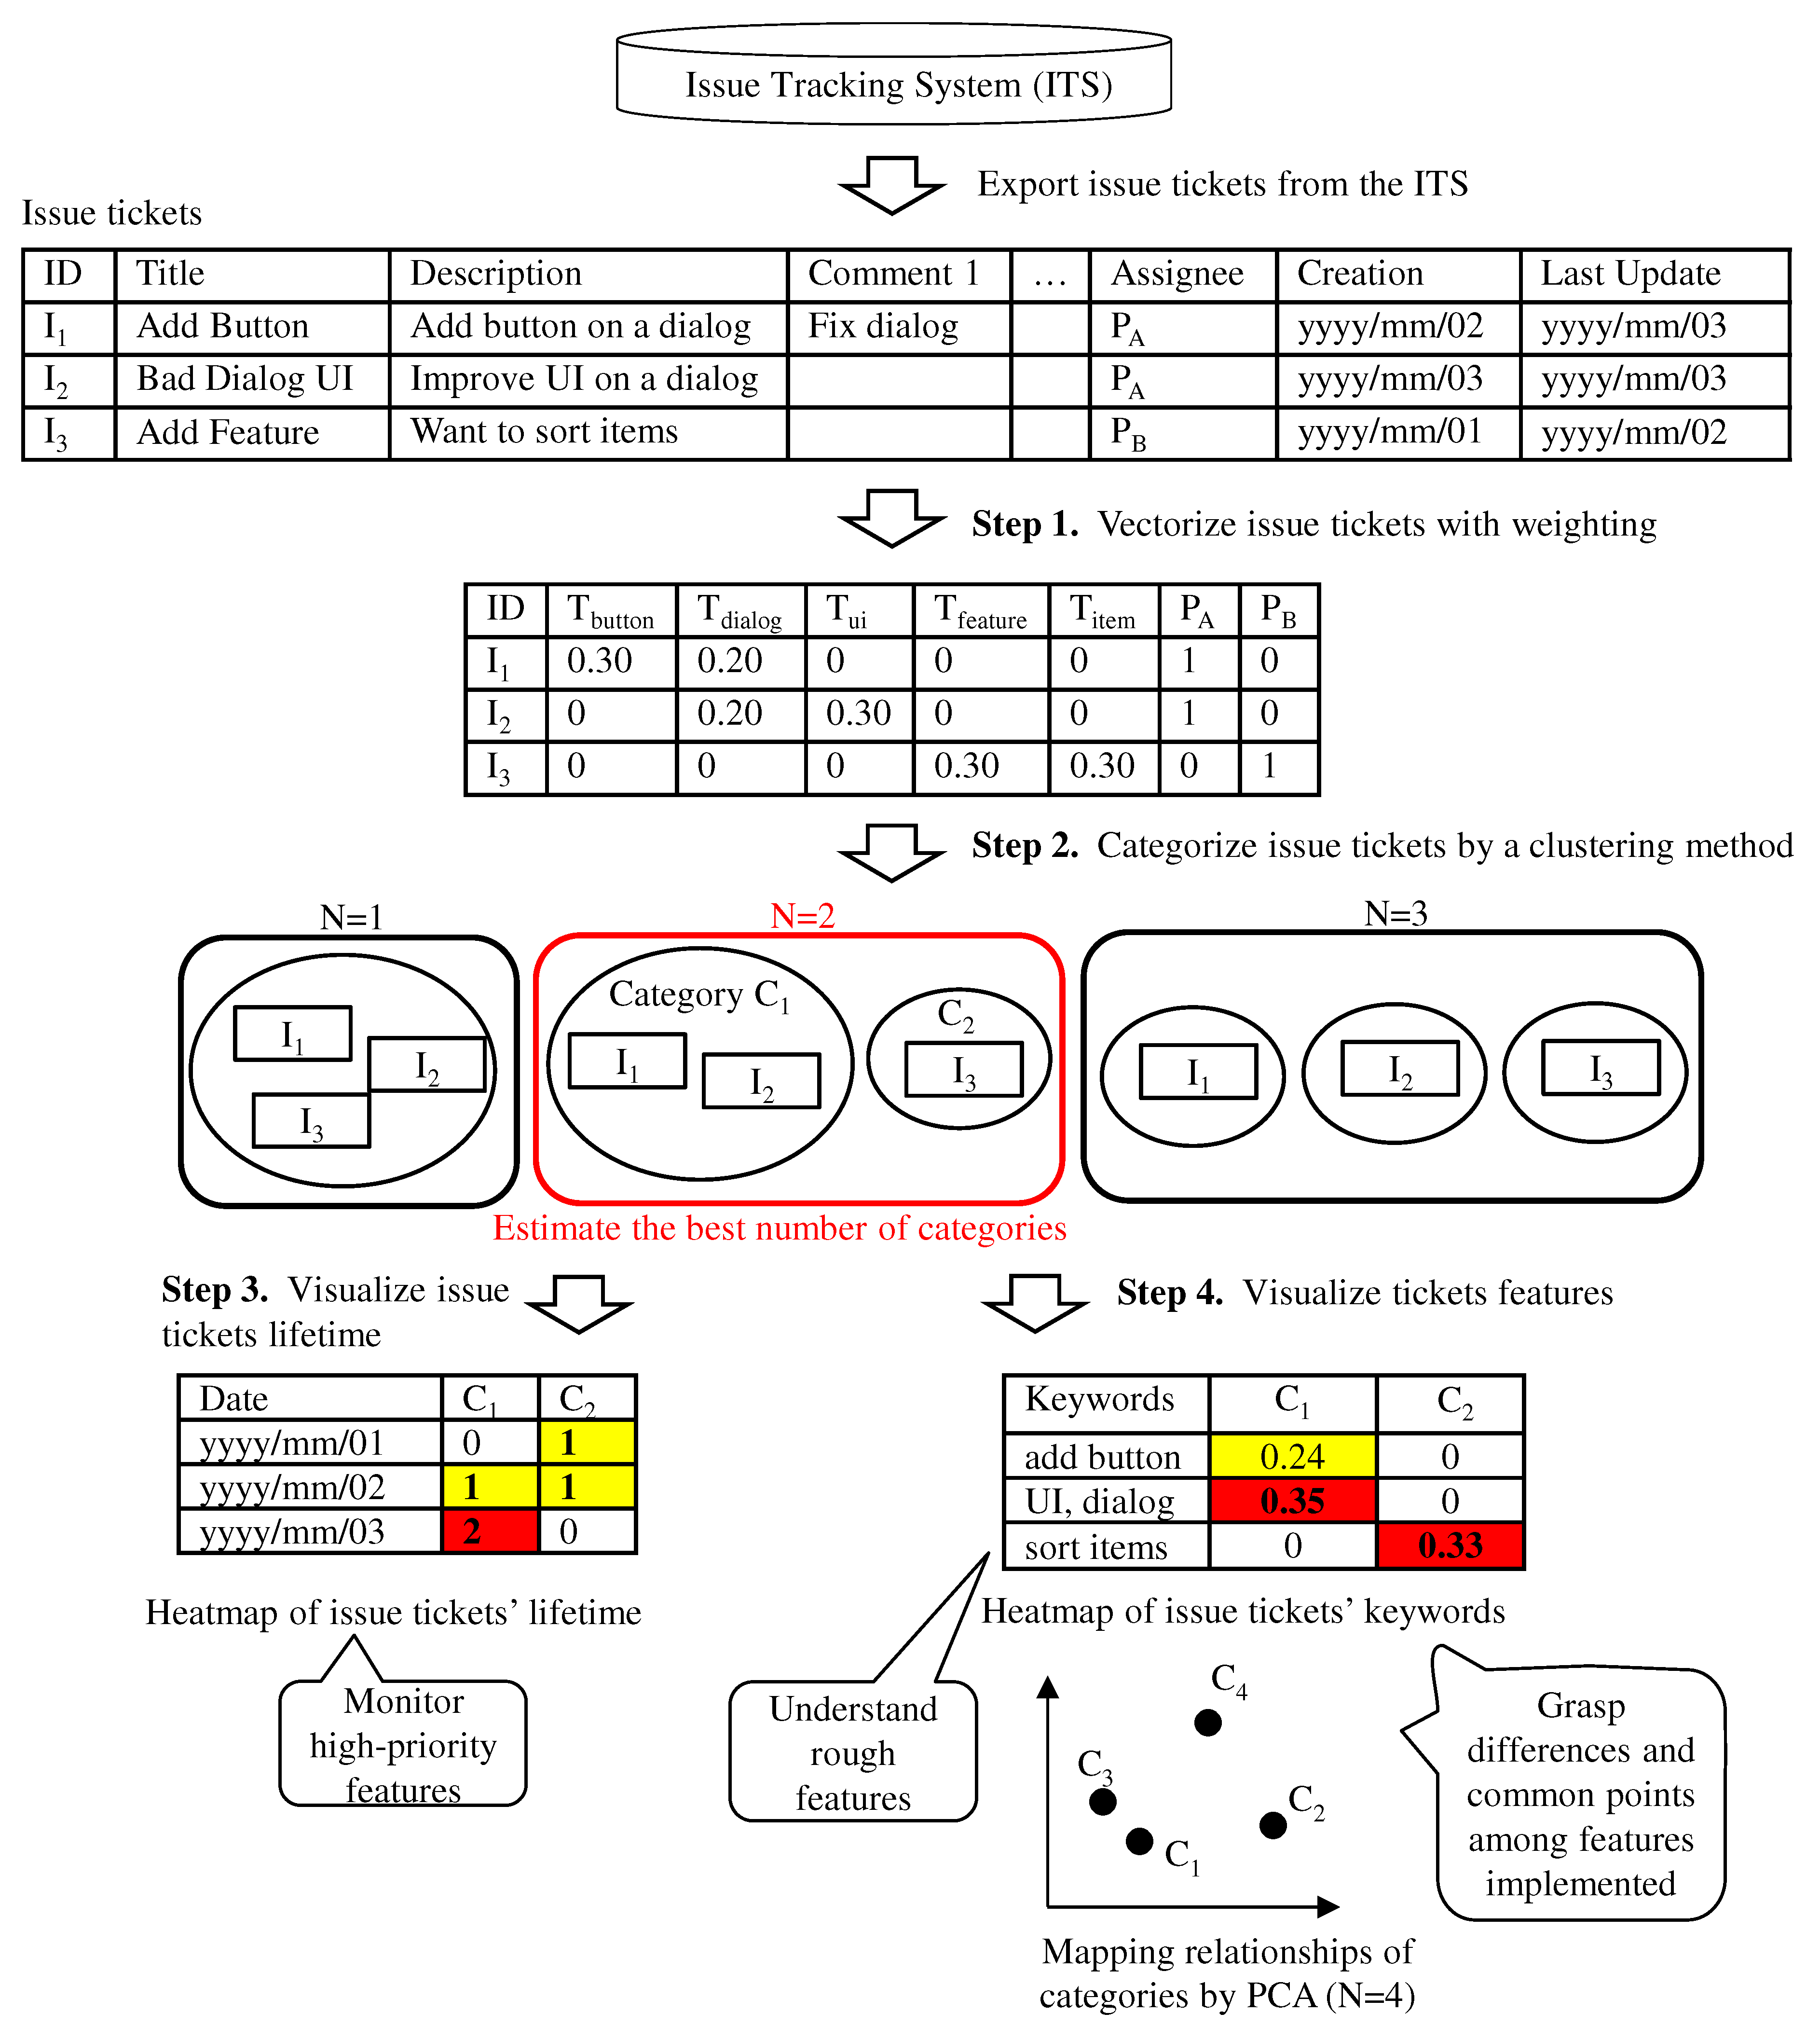
- Step 1.2. To enhance the accuracy of ticket categorization, parse the extracted text data into terms and filter uninformative terms such as stop words. If terms are not separated by white space, use morphological analysis to parse the sentence into terms (e.g., [37]). For example, if only nouns are extracted from ticket , “Button” from the title, “button” and “dialog” from the description, and “dialog” from comment 1 are extracted (Figure 2).
- Step 1.3. To obtain the ticket vectors, count the term frequency in each ticket. For example, the term frequency of ticket is (Figure 2).
- Step 1.4. To emphasize the keywords, weigh the term frequency vectors based on the term frequency–inverse document frequency (TF-IDF). TF-IDF weights a term vector to extract the feature terms. The weight of term i of ticket j is calculated aswhere is the term frequency of term i of ticket j, and is the number of tickets containing term i. N is the number of tickets.Moreover, select important and unimportant terms by clustering the most common terms in each category and weight the vectors of these terms in a second analysis.
- Step 1.5. To consider the relationship between features managed by the same developers, select columns of developer data (e.g., author and assignee of tickets). To concatenate the developer data with the weighted term frequency, convert developer data into binary data. For example, the developer vector of ticket is (Figure 2).
3.2. Tickets Categorization
- Step 2.1. To obtain the distribution of the estimated number of categories, set R, which is the number of iterations, using an automatic estimation method.
- Step 2.2. To determine the appropriate number of clusters , perform ticket clustering R times according to the automatic estimation method for the number of clusters (e.g., gap statistics). Then estimate from the distribution of the estimated number of categories (e.g., median and mean values). Finally, categorize tickets into categories using a clustering method. For example, three tickets are grouped into two categories in Figure 2. Category includes tickets and , while category includes ticket .
3.3. Ticket Lifetime Visualization
- Step 3.1. To define the ticket lifetime, select columns of time series data indicating the start date (e.g., creation date) and the end date (e.g., updated date and due date).
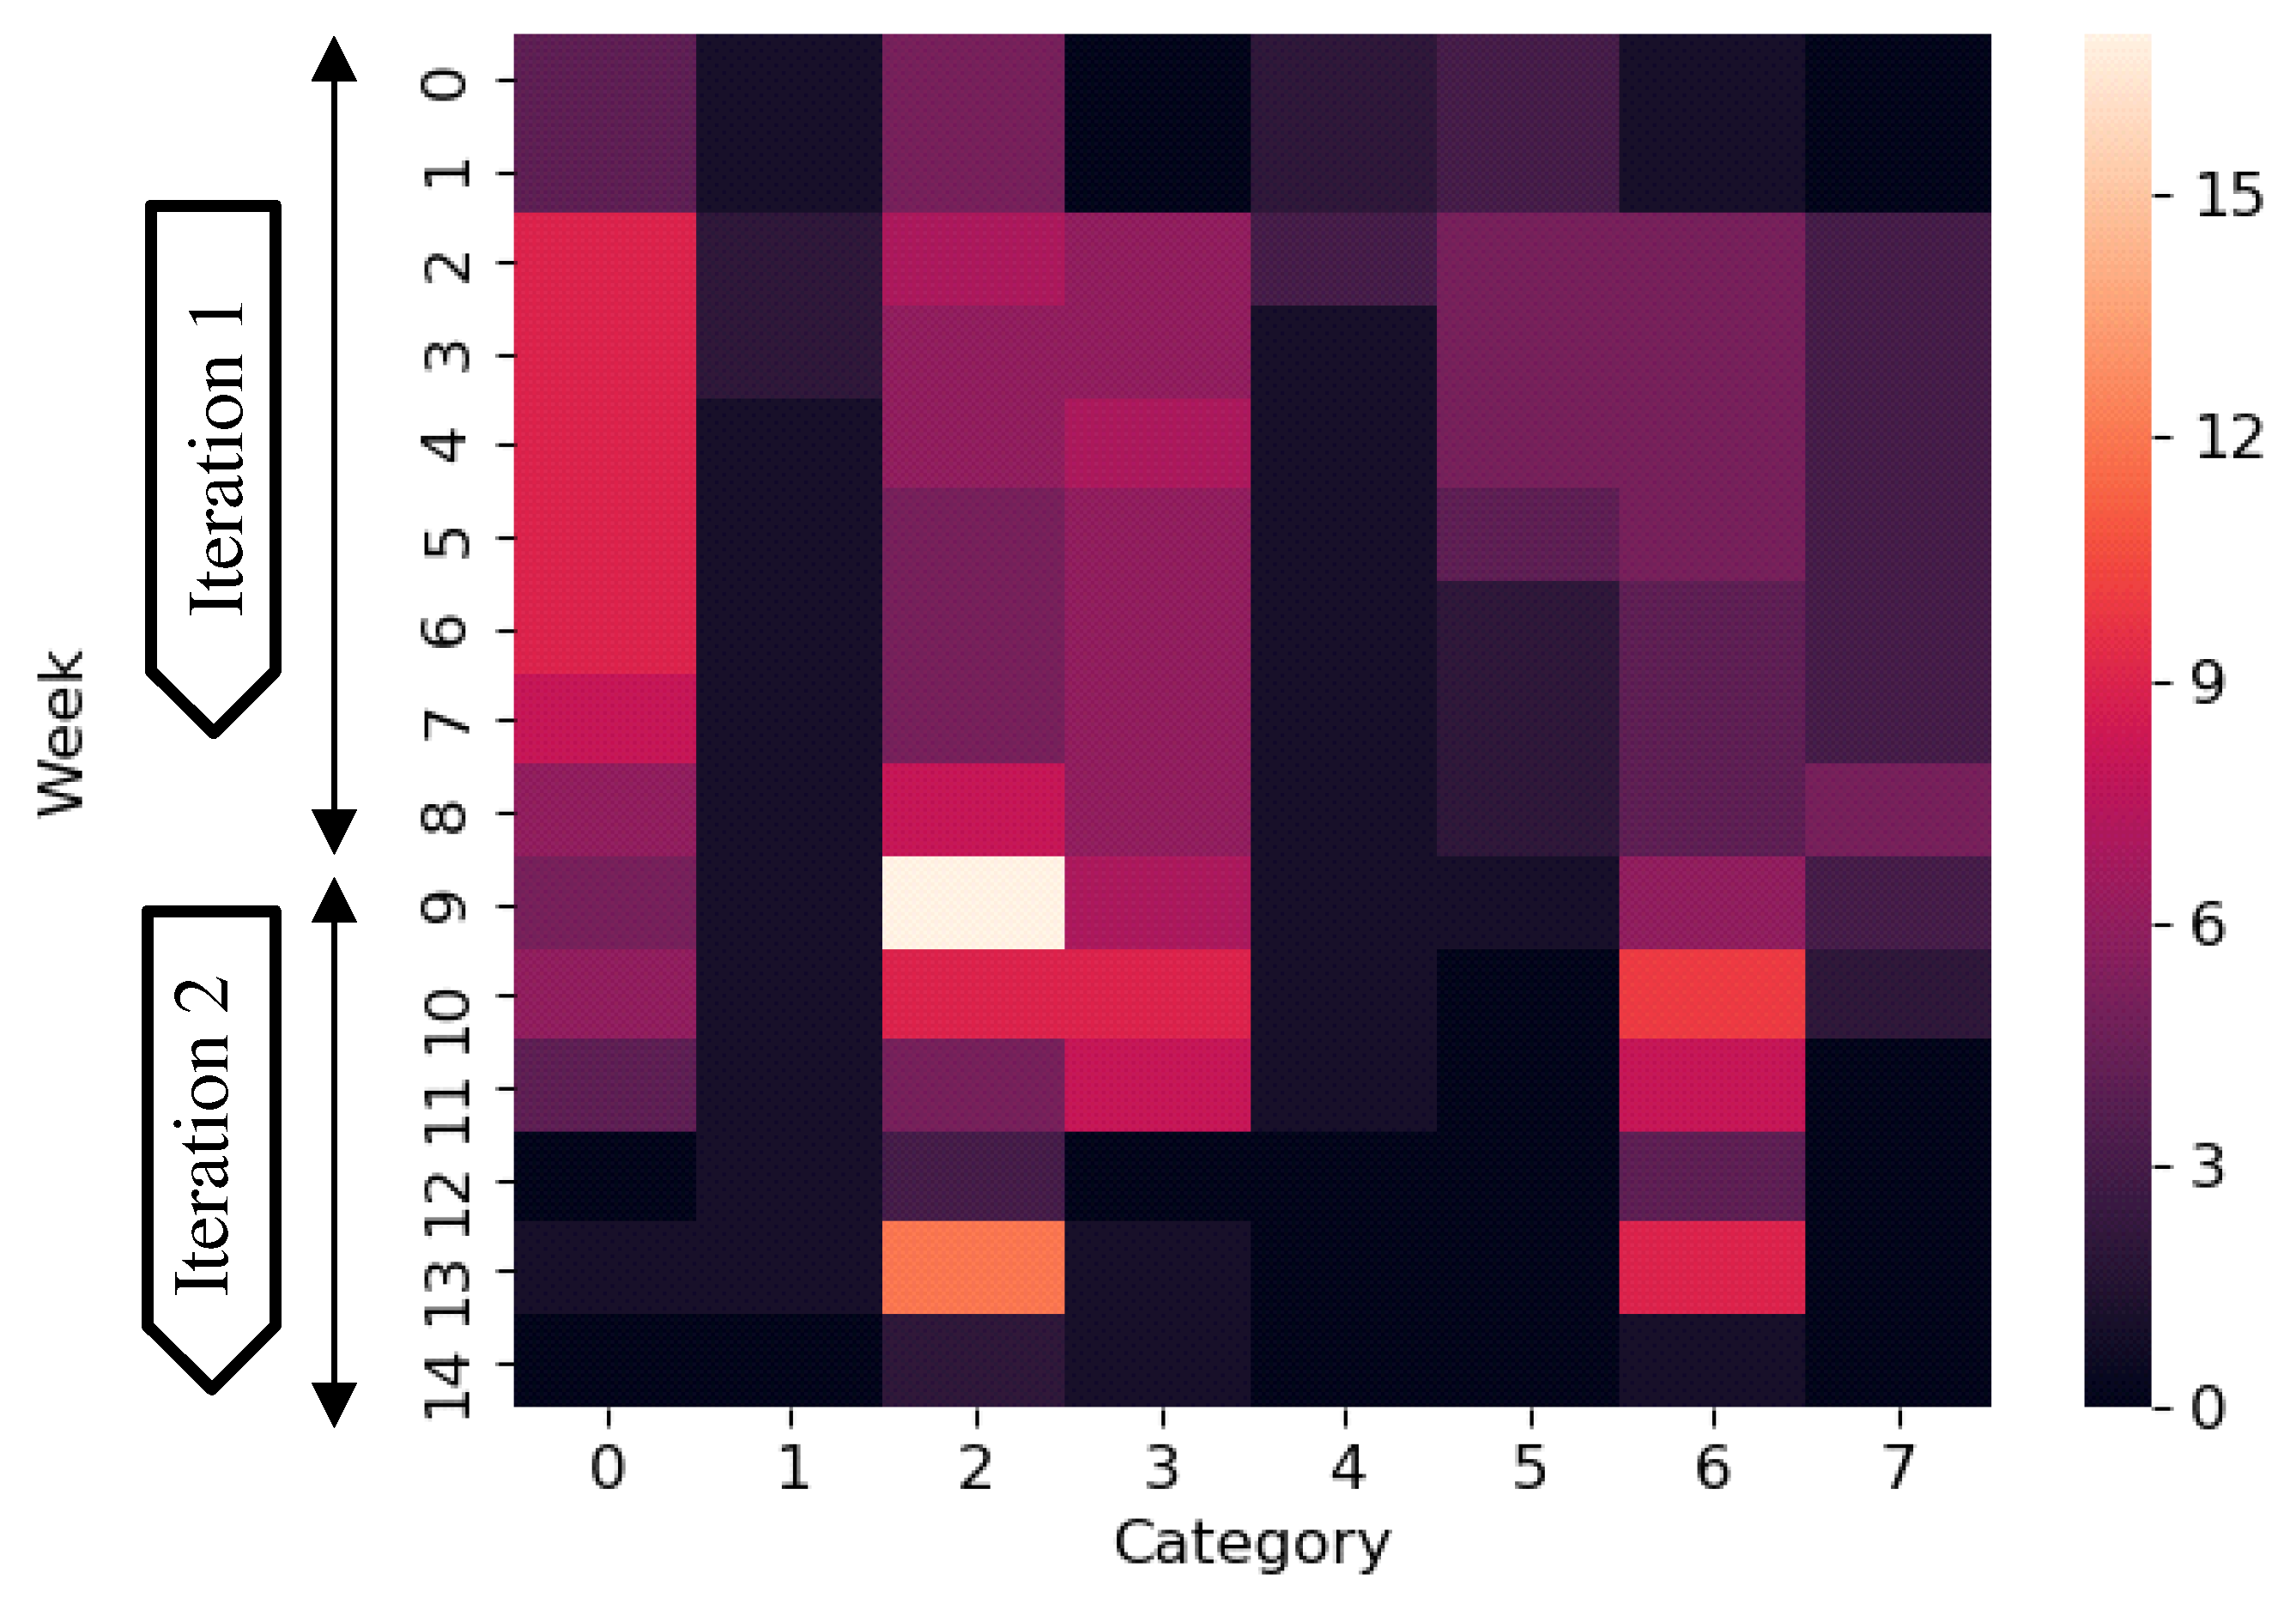
- Step 3.2. To visualize the tickets in each category, count the number of open tickets by category. For example, ticket is open from the second day to the third day, and ticket is open on the third day (Figure 2). Hence, the lifetime vector of category is .
- Step 3.3. To visualize the count data quickly, create a heatmap using the count vector for all categories (Figure 2).
3.4. Ticket Feature Visualization
- Step 4.1. To obtain the features of ticket categories, calculate the average of the term frequency vectors of the tickets per category. For example, the term frequency of category is (Figure 2).
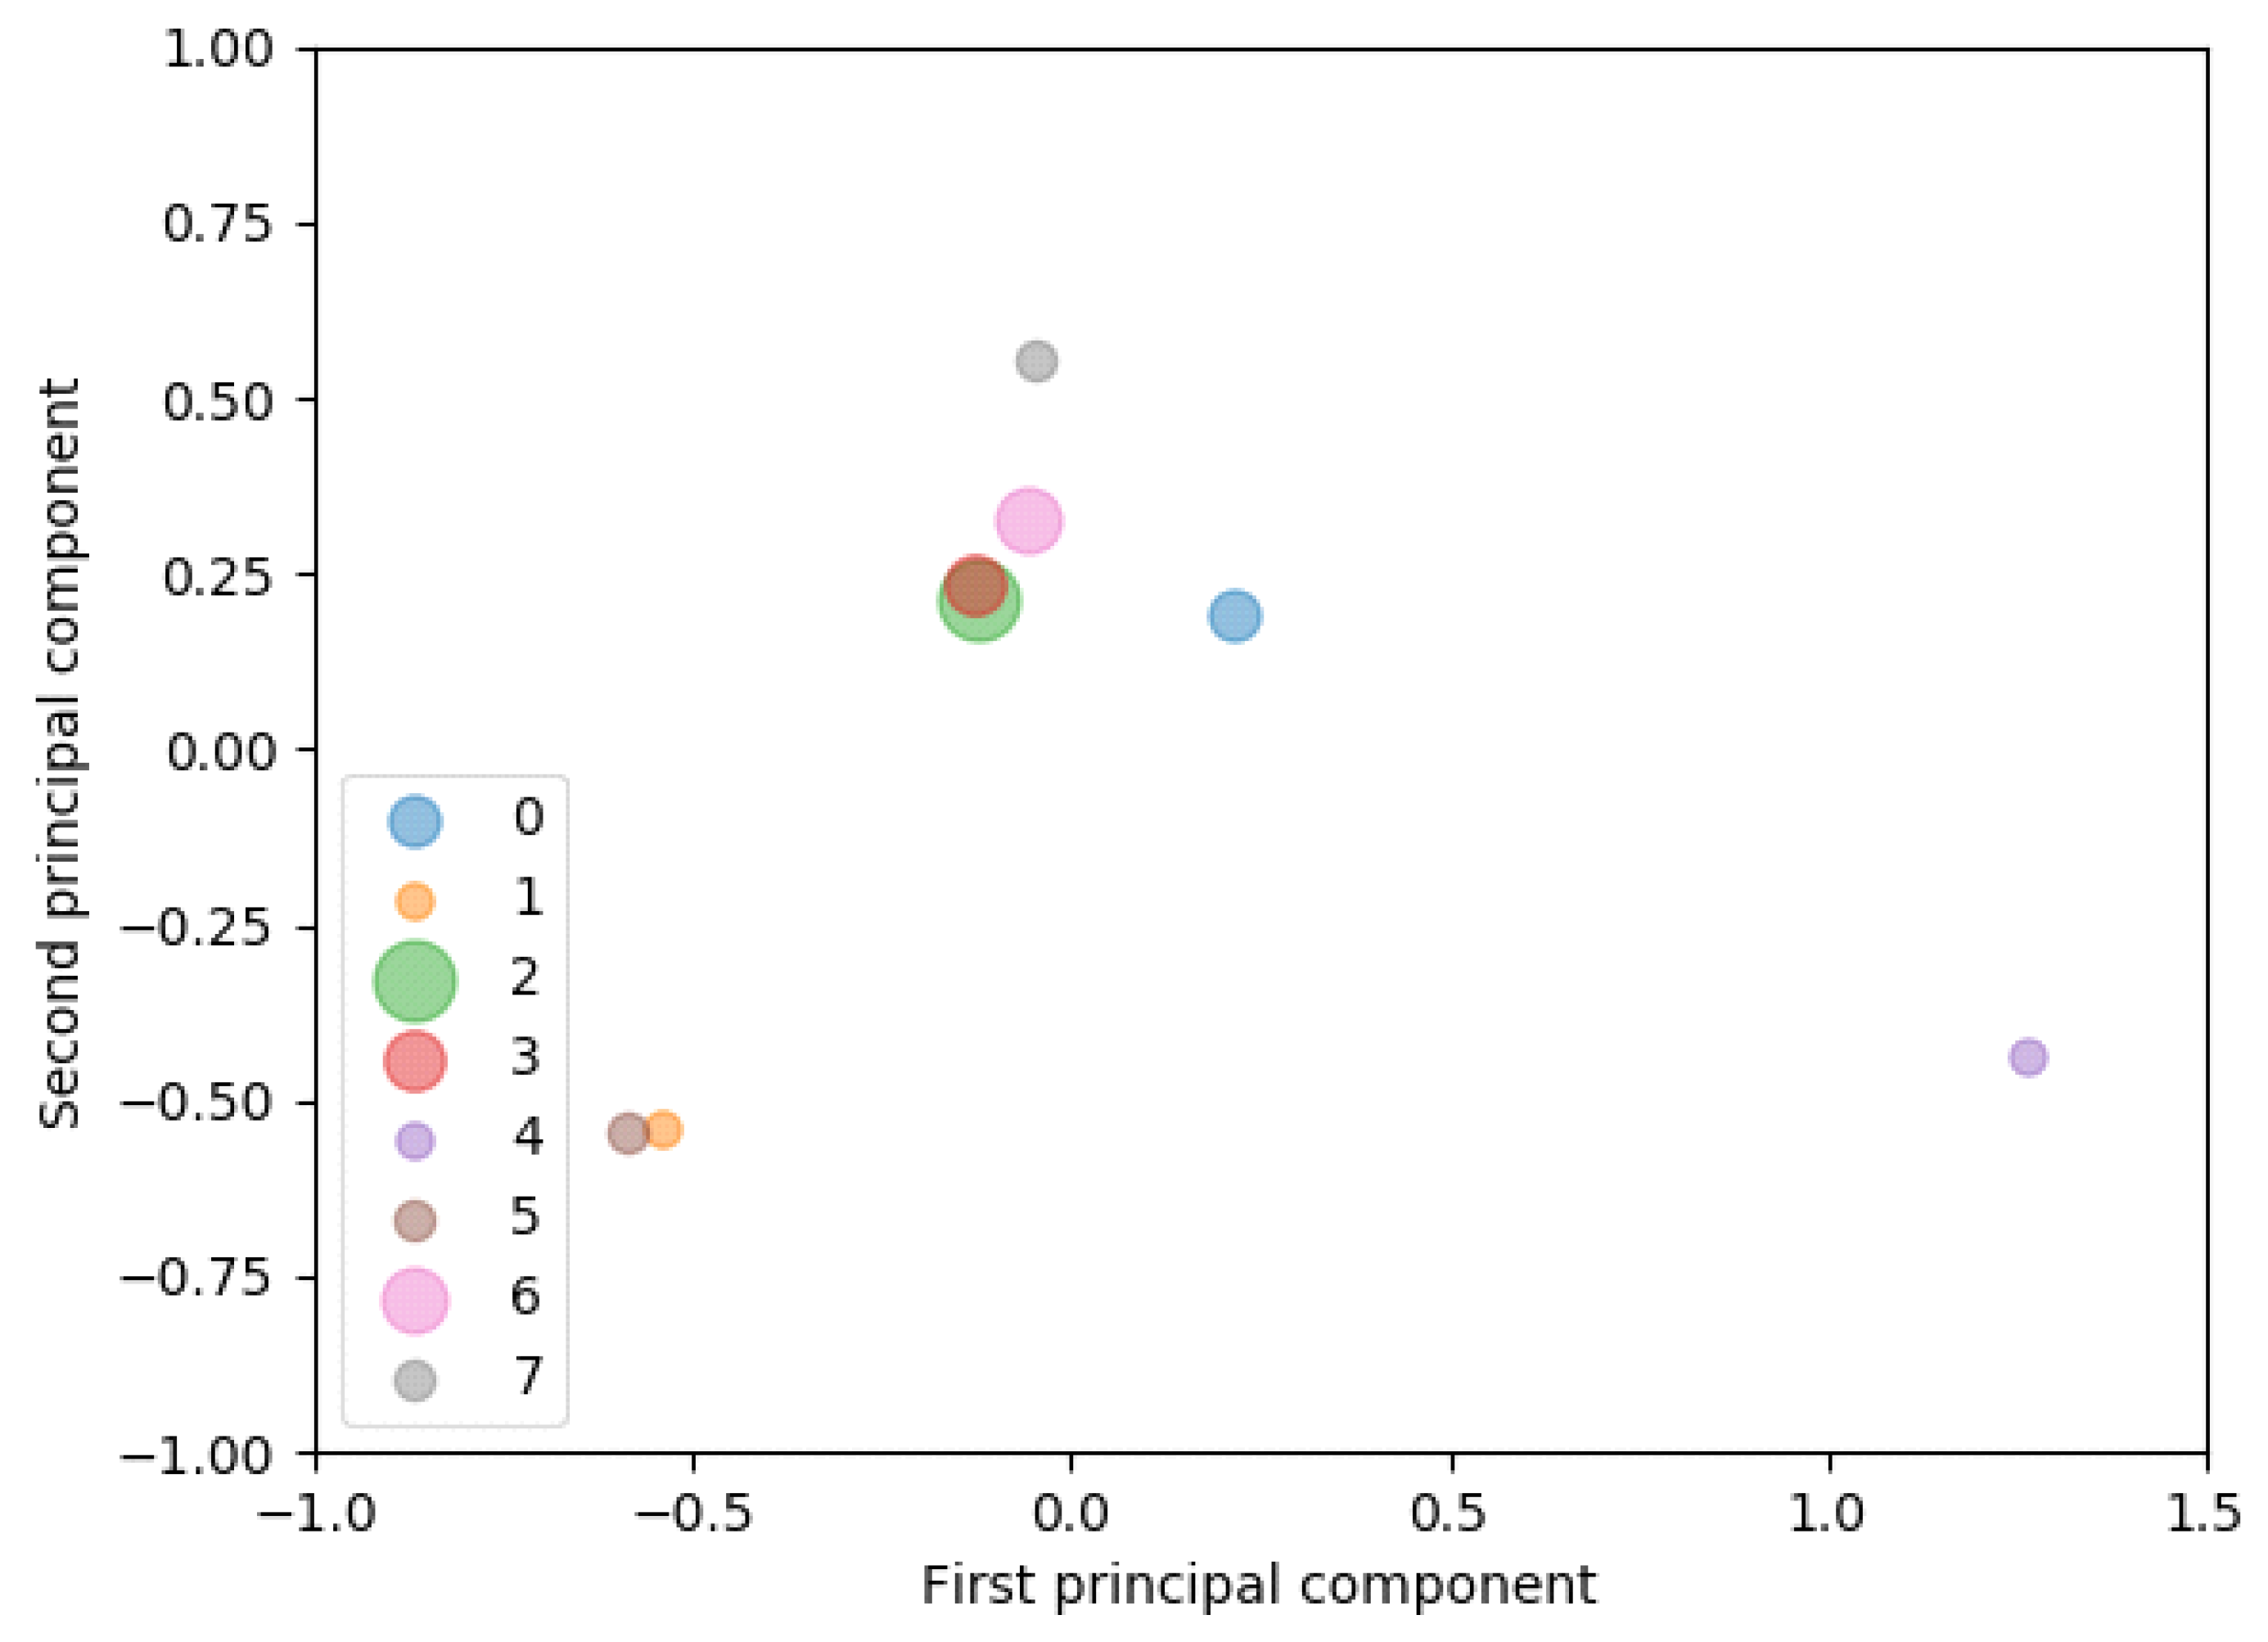
- Step 4.2. To simply visualize the relationships among categories, compress every term frequency vector into a two-dimensional vector by PCA and plot the results in two-dimensional space. For example, four categories are mapped in Figure 2. Categories and have similar features. Then our method creates a heatmap, which indicates the kind of terms appearing in each ticket category using the following steps:
- Step 4.3. To make lists of keywords, select the top clustering terms from each ticket category and manually construct collocations from the extracted terms. It should be noted that terms are not limited to nouns but can include all terms. Then group the collocations and terms. For example, two keywords, “add button” and “sort items”, are constructed, and keyword “UI” and “dialog” are classified into the same group (Figure 2).
- Step 4.4. To visualize the category features independent of the difference in the number of tickets included in the categories, calculate the density of keywords appearing in each group. The keyword density of a category is calculated as follows:
- –
- First, count the number of keywords in all text data of tickets in the category. For example, the keyword “add button” appears once in the title and once in the description of ticket . Hence, the number of keywords in category is two (Figure 2).
- –
- Then multiply the number of keywords by the length of the keyword and divide by the sum length of the text data in the tickets for the category. The length of ticket is nine and that of ticket is eight. Hence, the density of keyword “add button” is .
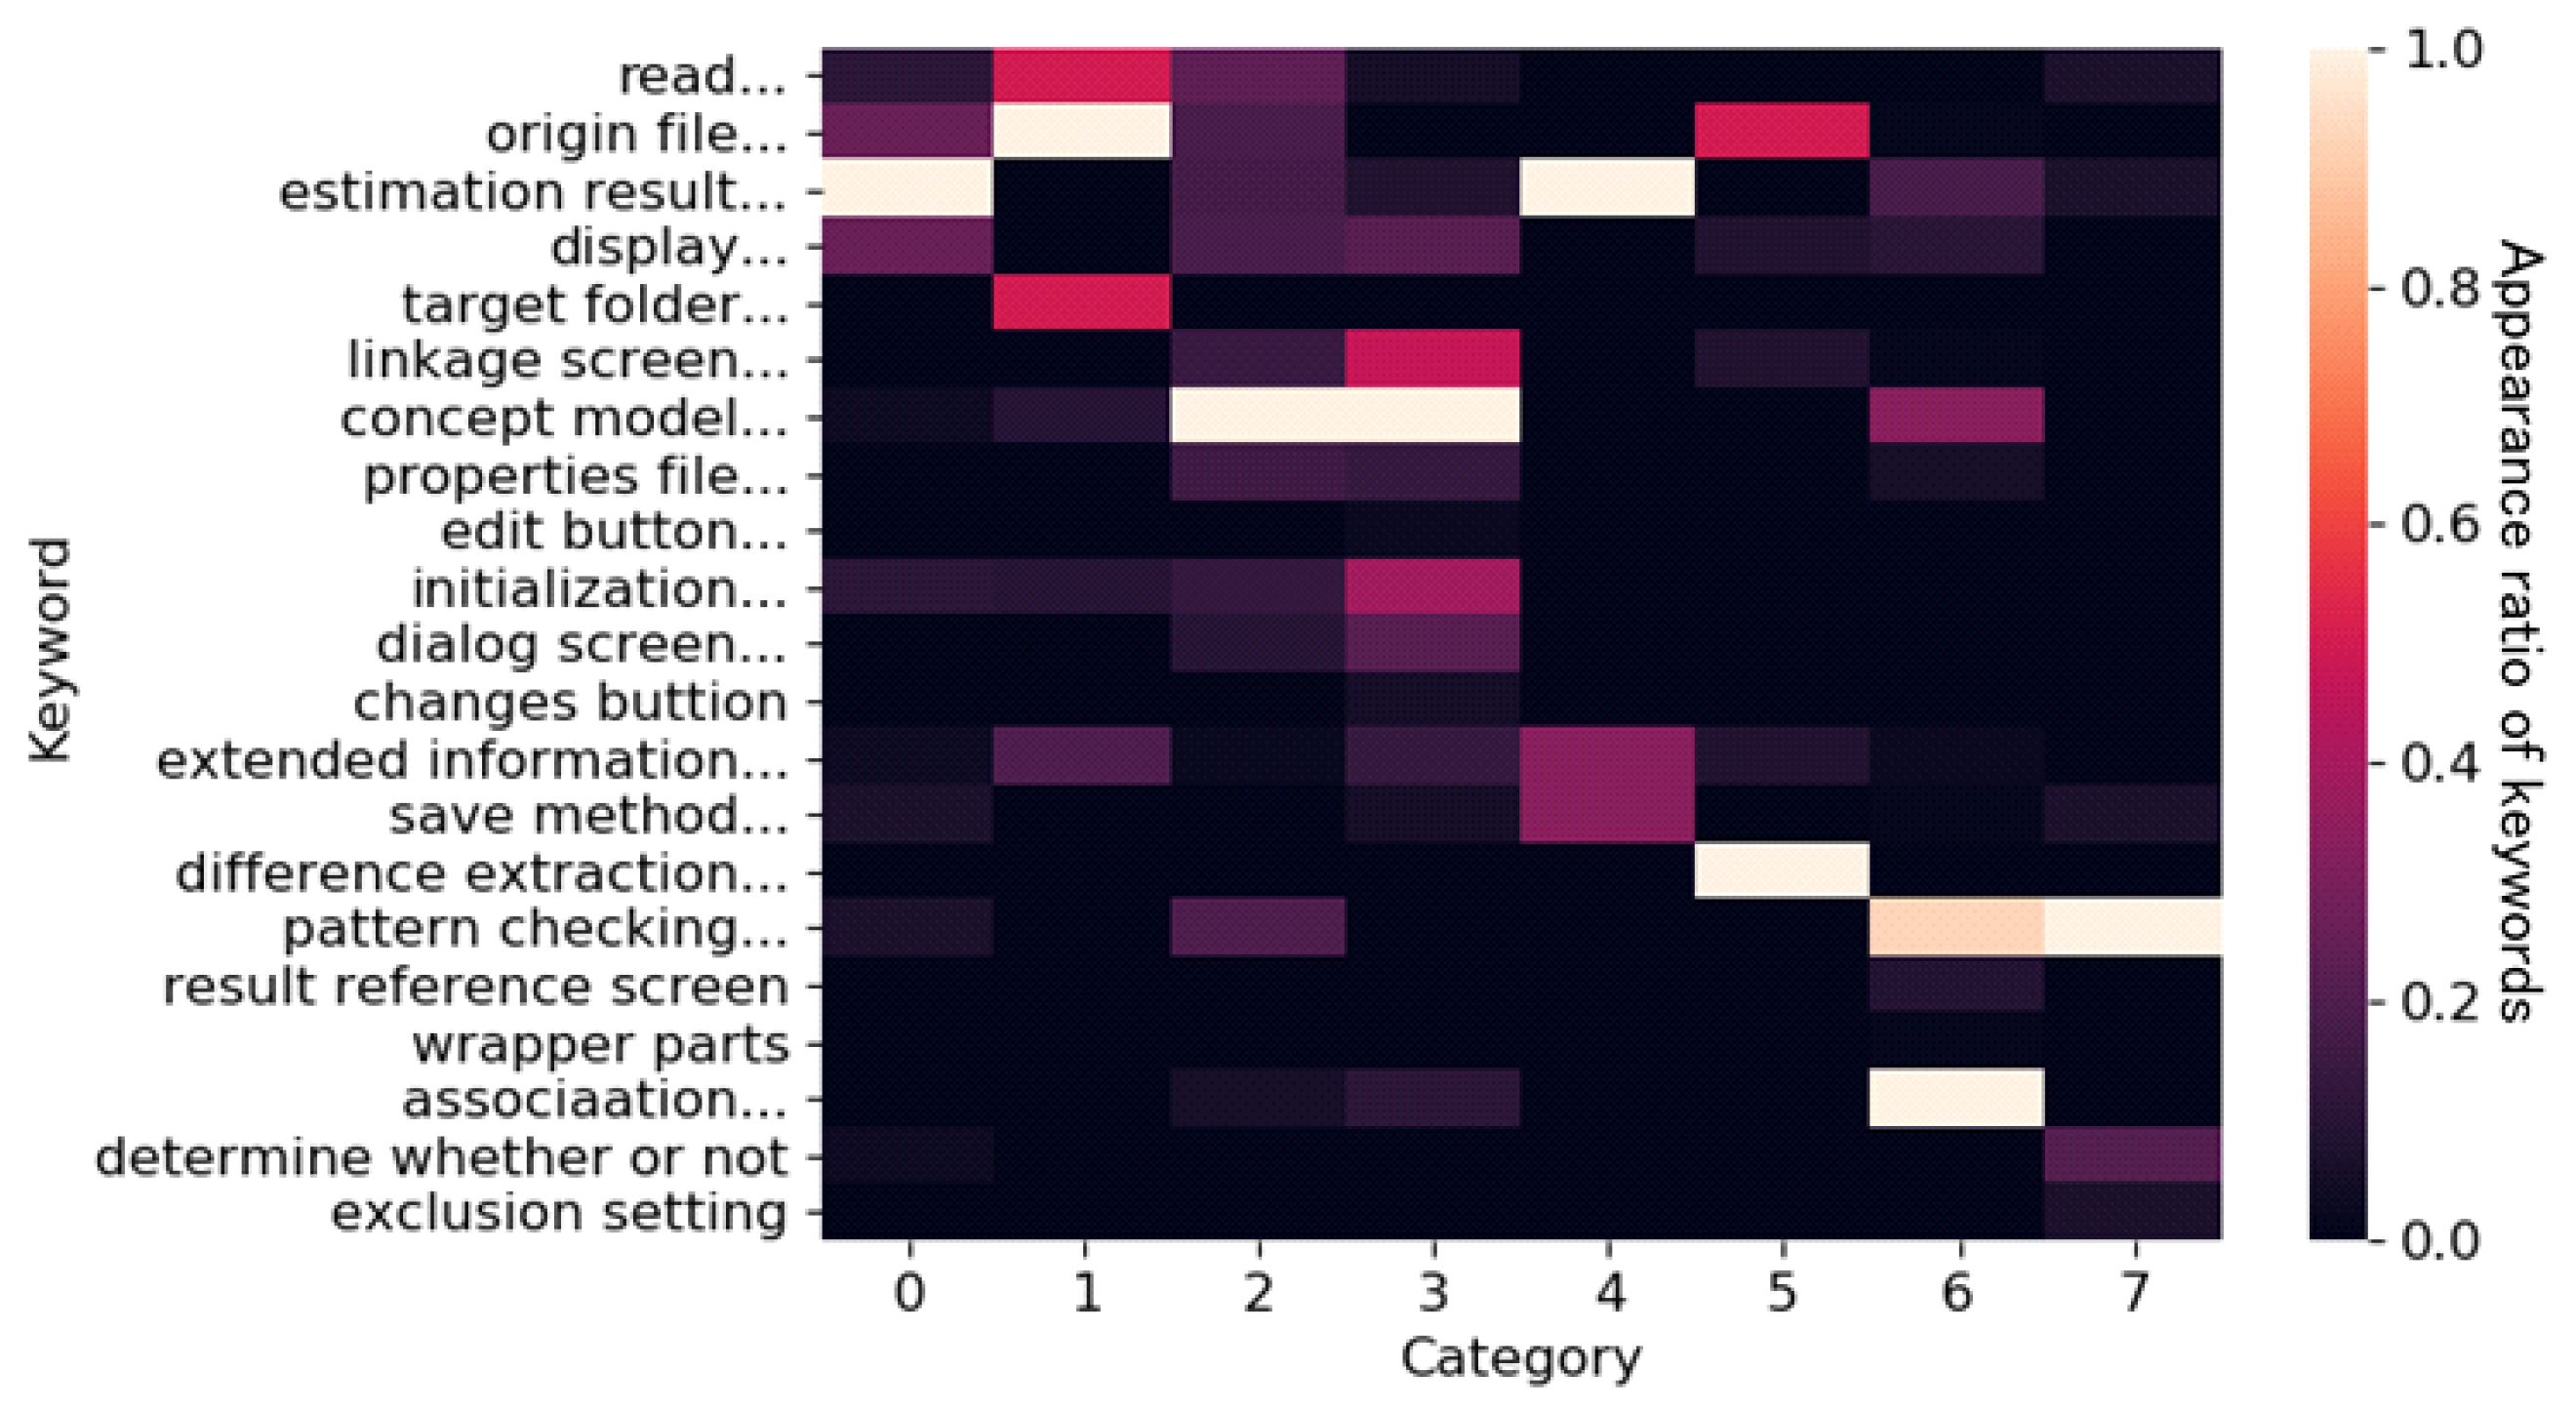
- Step 4.5. To visualize the features of categories quickly, create a heatmap using the keyword density of all categories.
4. Case Study
4.1. Project Overview
4.2. Case Study Procedure
4.3. Results
- (1)
- Data collection and labeling tickets
- (2)
- Ticket vectorization and ticket categorization
- (3)
- Evaluation of ticket categorization
- (4)
- Ticket visualization
- (5)
- Interviews
4.4. Discussion
4.4.1. Does Our Categorization Method Estimate the Number of Ticket Categories and Categorize Tickets Accurately?
4.4.2. Can Our Visualization Method Help New Members Understand the Implemented Features of a Project?
5. Experimental Evaluation
5.1. Experiment Design
- (1)
- Subjects
- (2)
- Methods and inputs
- (3)
- Tasks
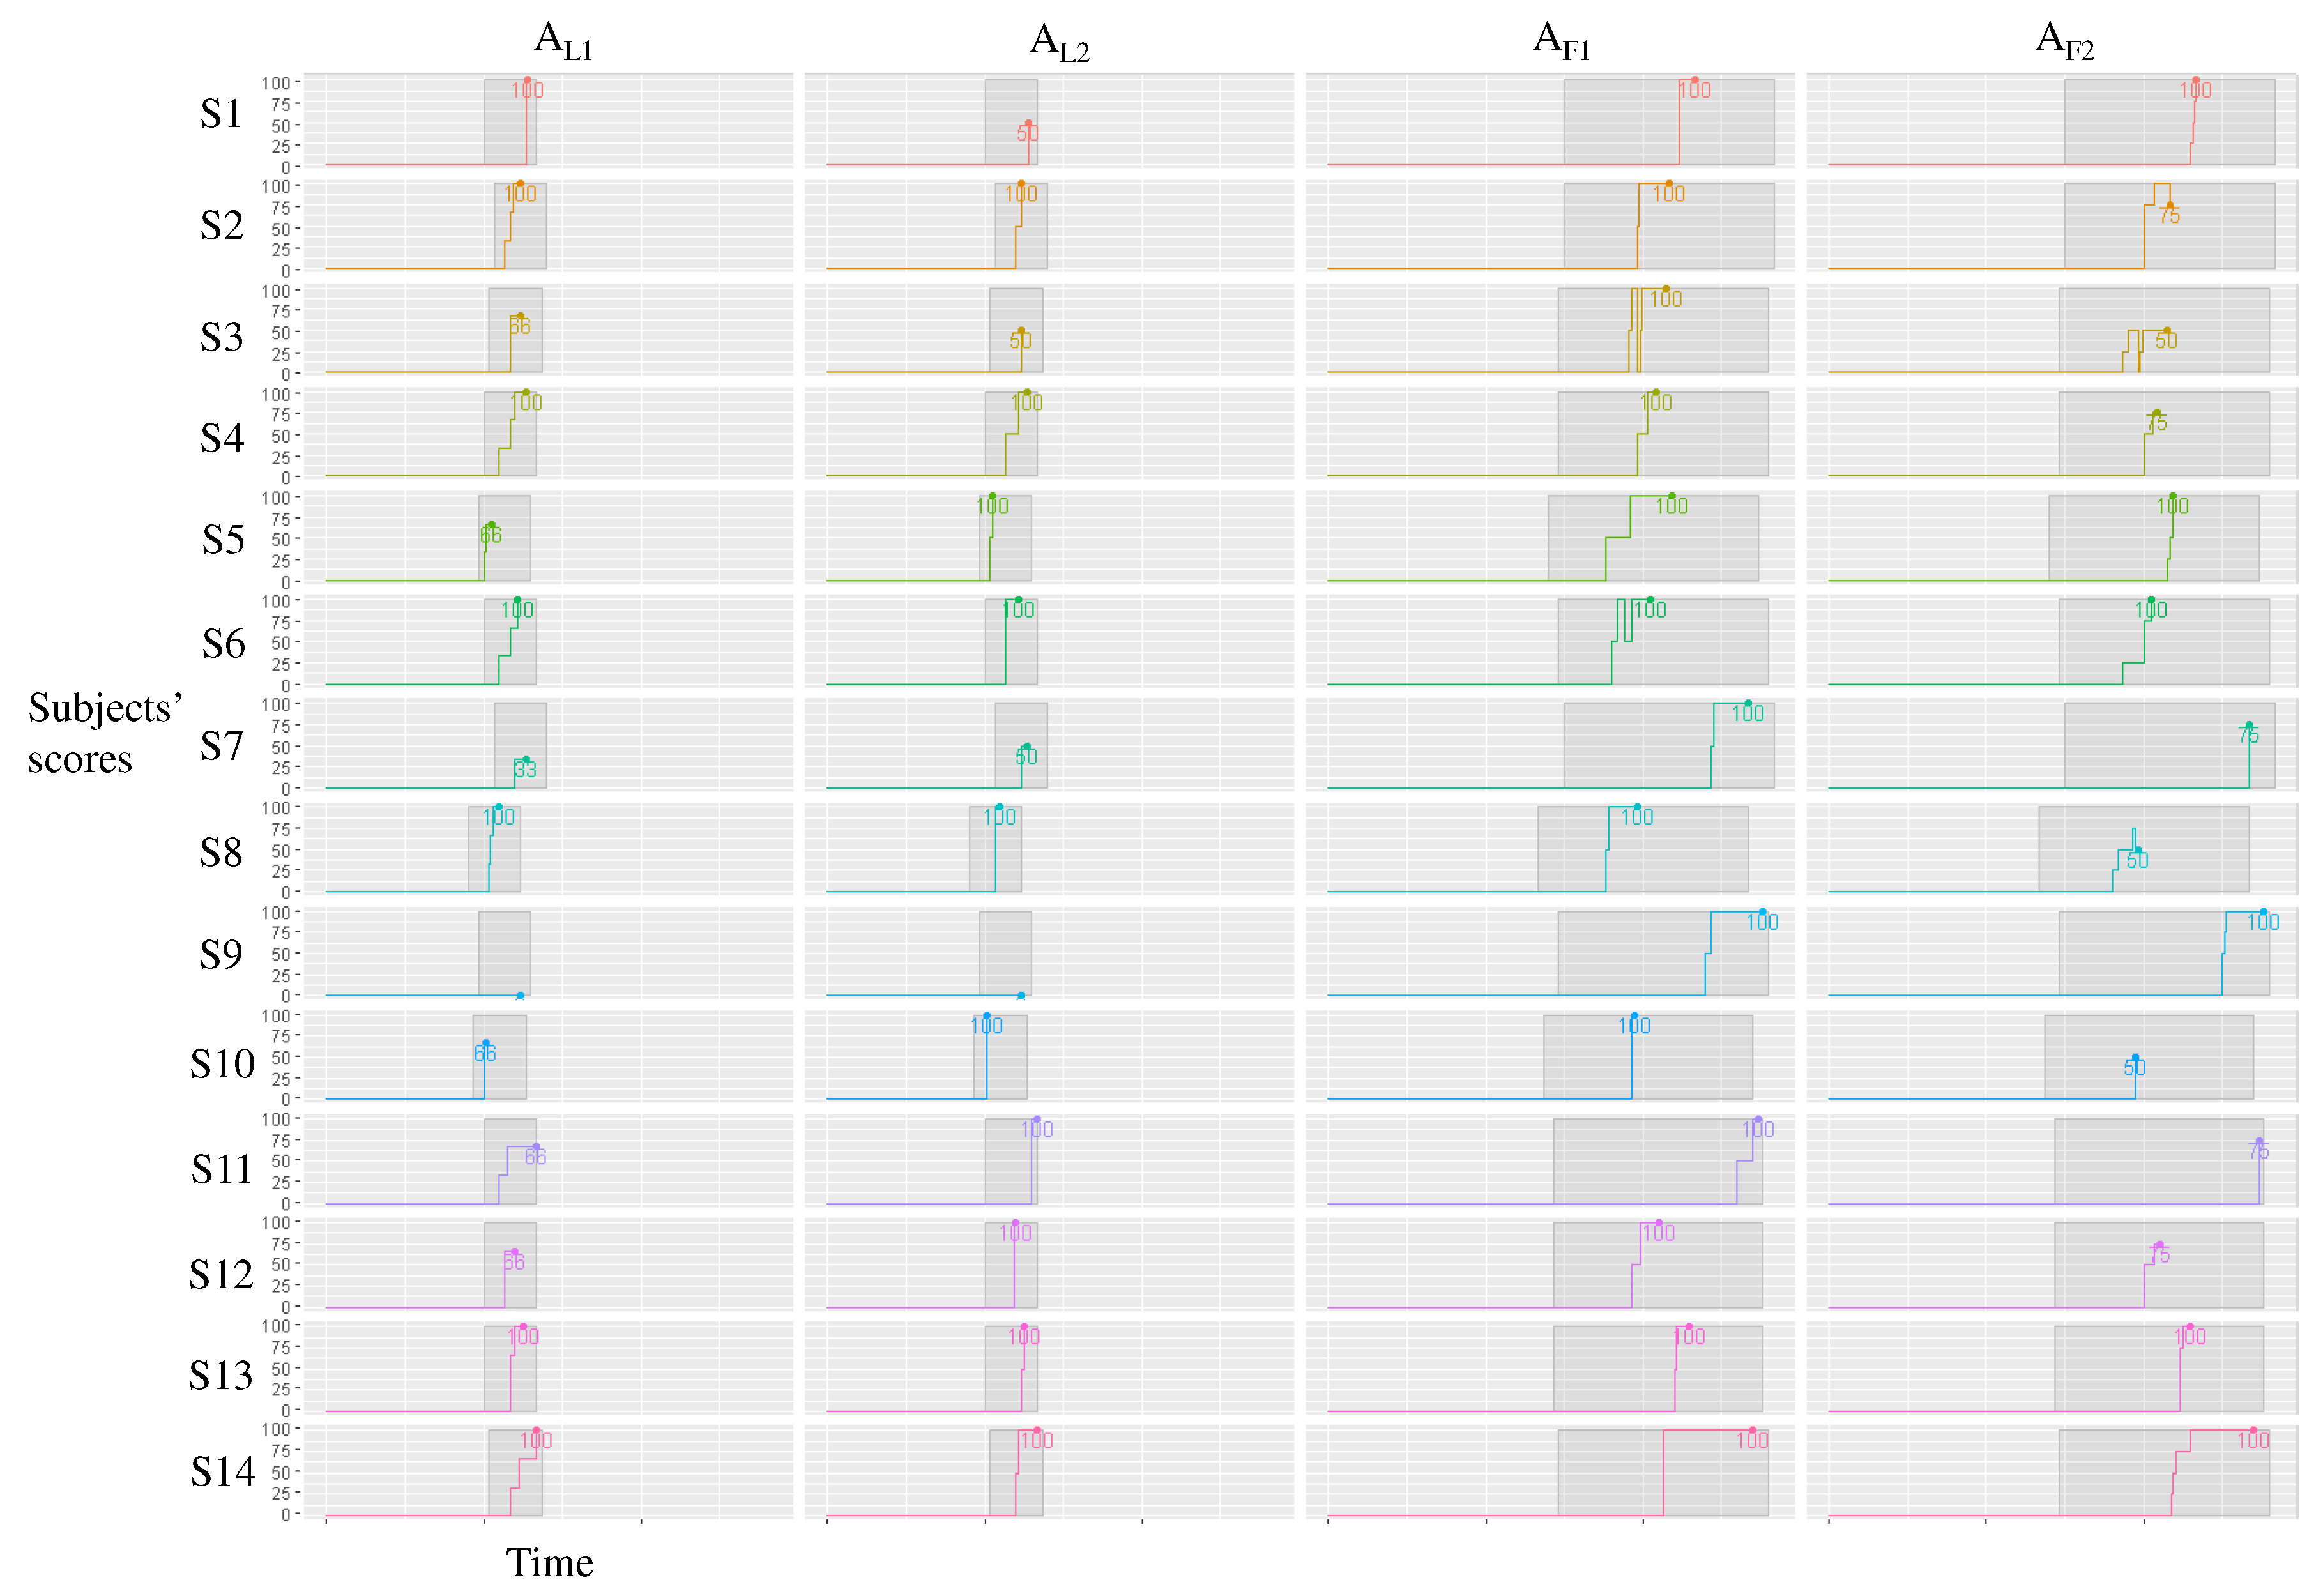
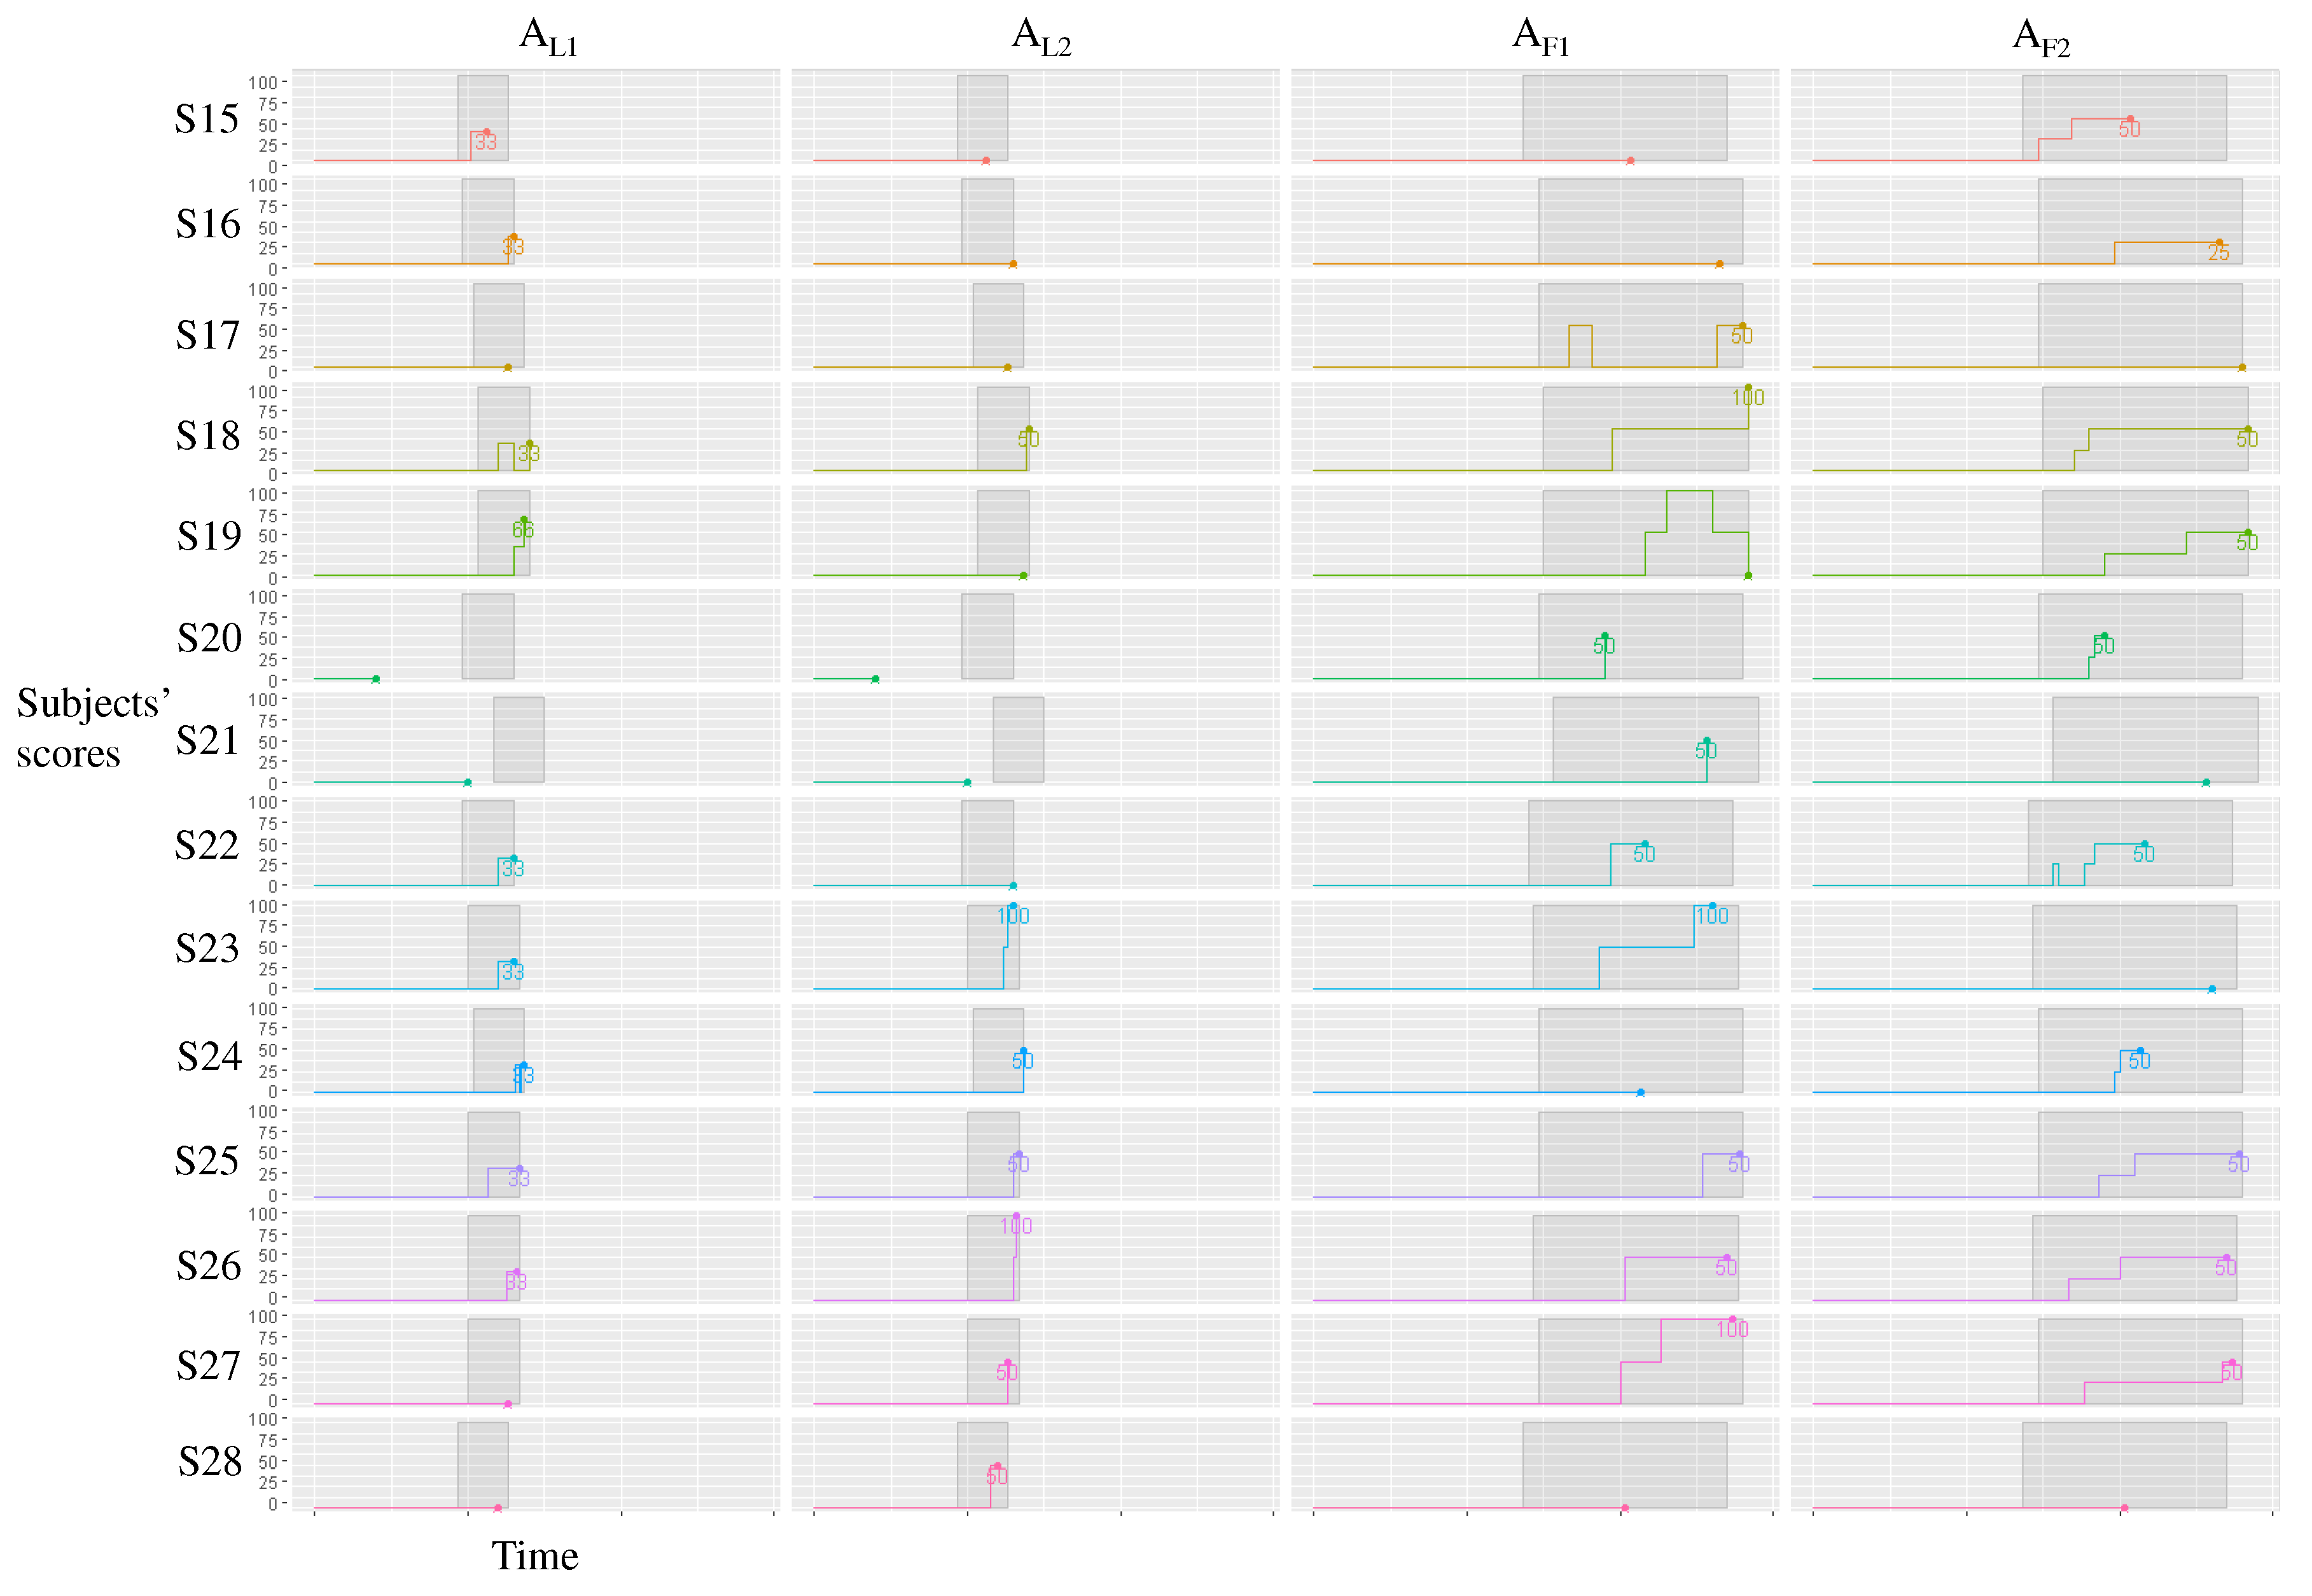
- asked the participants to identify up to three specific weeks where the development was ‘active’. Here, ‘active’ means a busy development state with many unresolved tickets compared with the last time frame. Subjects received 0, 33, 66, or 100 points if they identified zero, one, two, or three correct weeks, respectively.
- asked the participants to identify up to three specific weeks where the development was inactive compared with other weeks. Here, ‘inactive’ means a less busy development state with few unresolved tickets compared with the last time frame. Only 2 of the 14 weeks met this definition. Subjects received 0, 50, or 100 points if they identified zero, one, or two correct weeks, respectively.
- asked the participants to identify up to five specific ‘stable’ features compared with other features. Here, ‘stable’ means that most of tickets related to the feature were resolved as the development progressed. Only 2 of the 13 features met this definition. Subjects received 0, 50, or 100 points if they identified zero, one, or two correct features, respectively.
- asked the participants to identify up to five specific ‘unstable’ features. Here, ‘unstable’ means that most of the tickets related to the feature were unresolved even in the latter half of the development period. Four of 13 features met this definition. Each subject received 0, 25, 50, 75, or 100 points if the subject identified zero, one, two, three, or four correct features, respectively.
- (4)
- Experimental procedure
- The first session took 10 min. It was designed to familiarize the subjects with the target project such as the objective and functionalities of the system. Both group subjects were instructed to read the project document only during the first session. Thus, there was no setting difference in both groups.
- In the second session, subjects performed tasks and within 10 min. The subjects in GE used the heatmaps and the set of tickets, while the GC subjects only used the set of tickets.
- In the third session, subjects performed tasks and within 40 min. The subjects in GE used the heatmaps and the set of tickets, while the GC subjects only used the set of tickets.
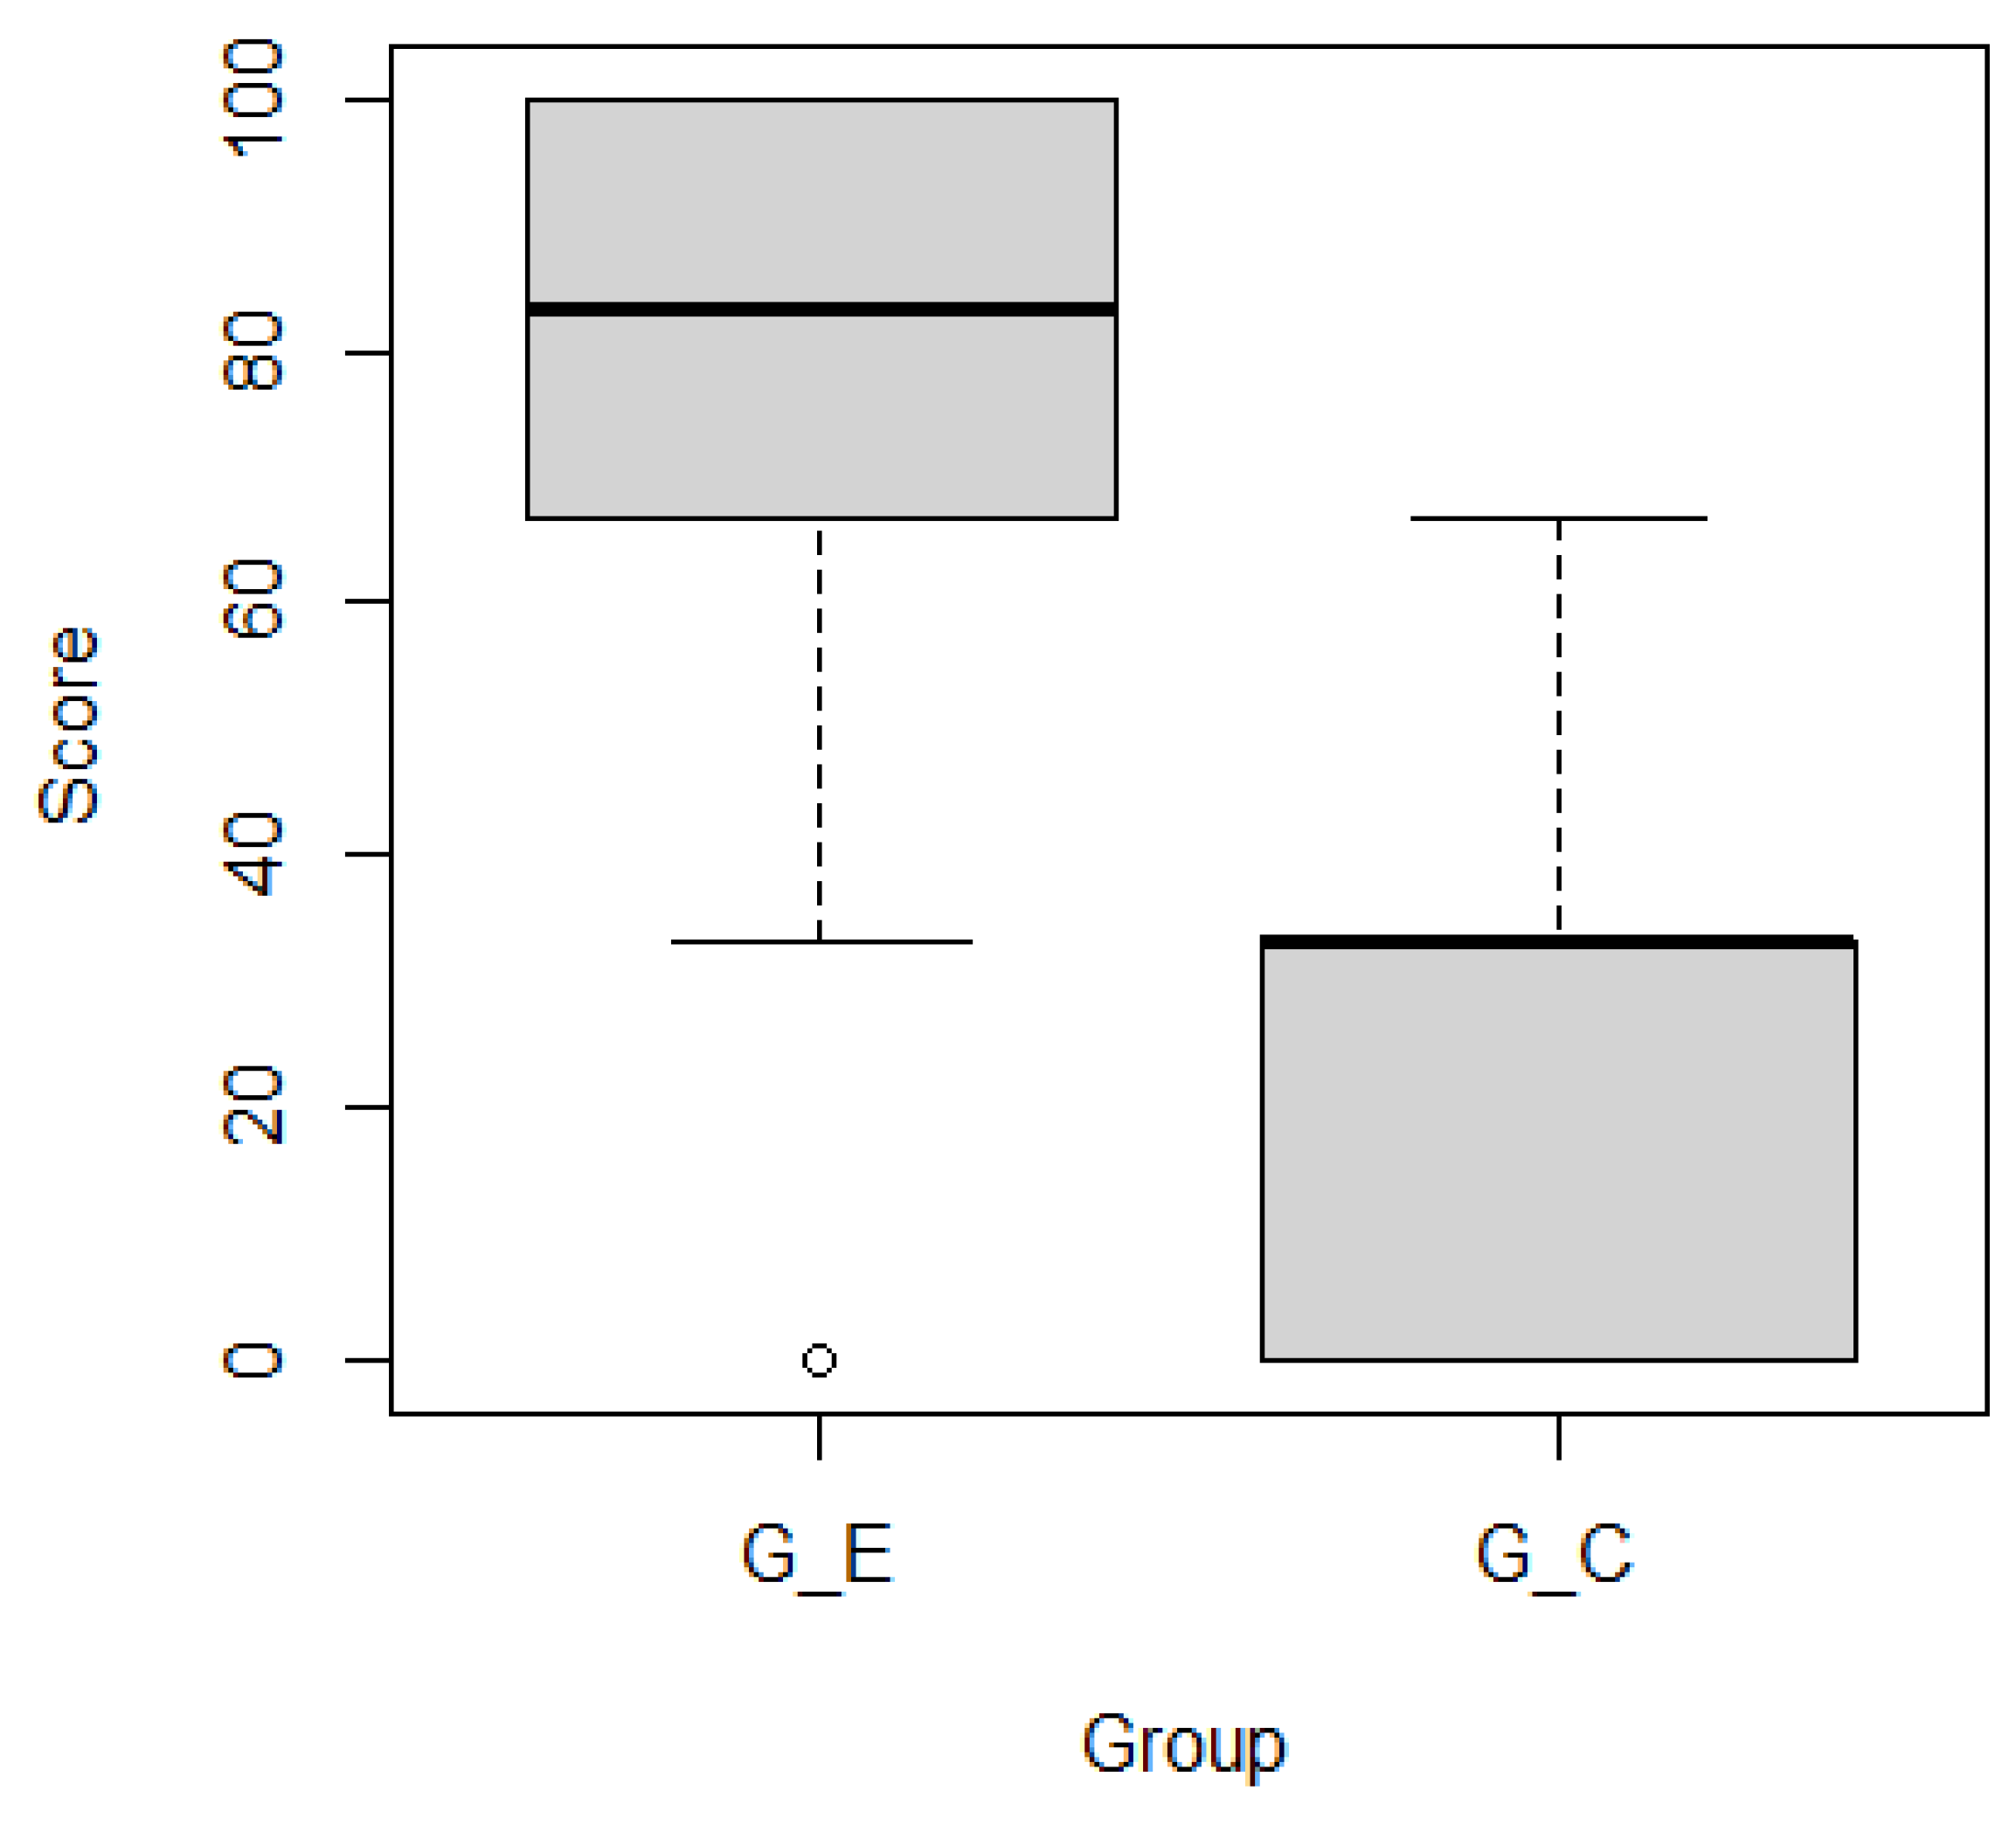
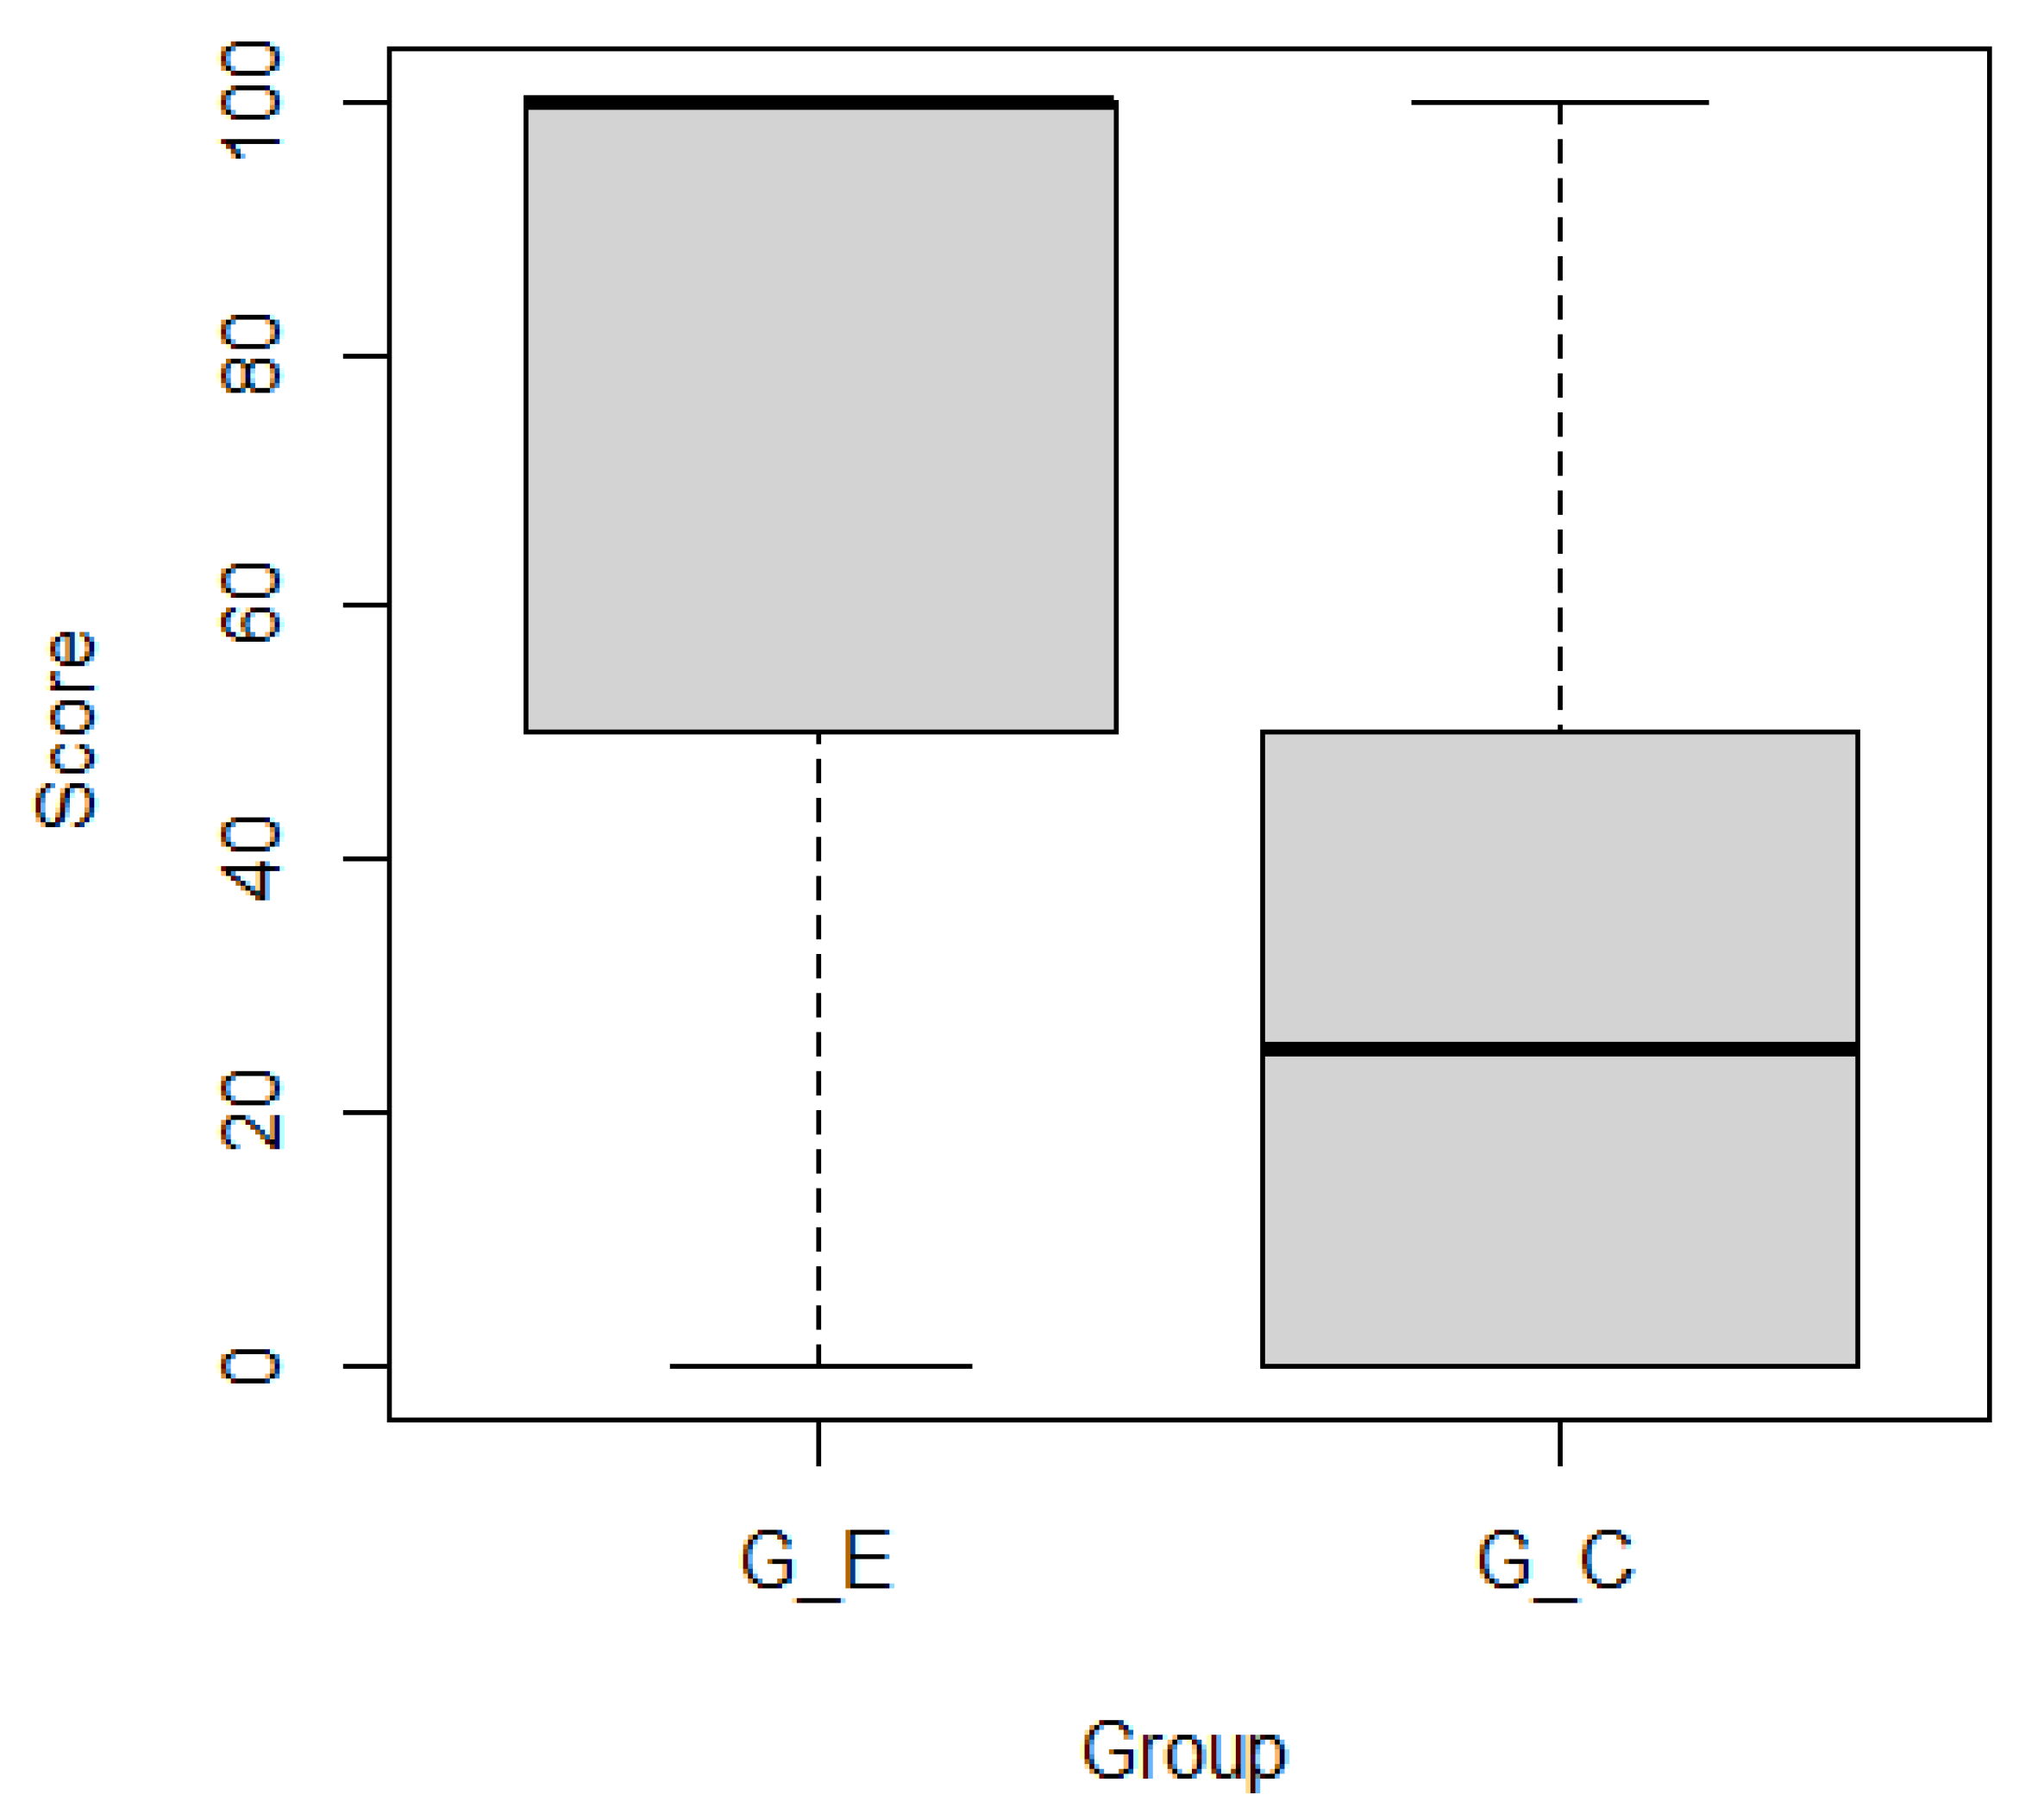
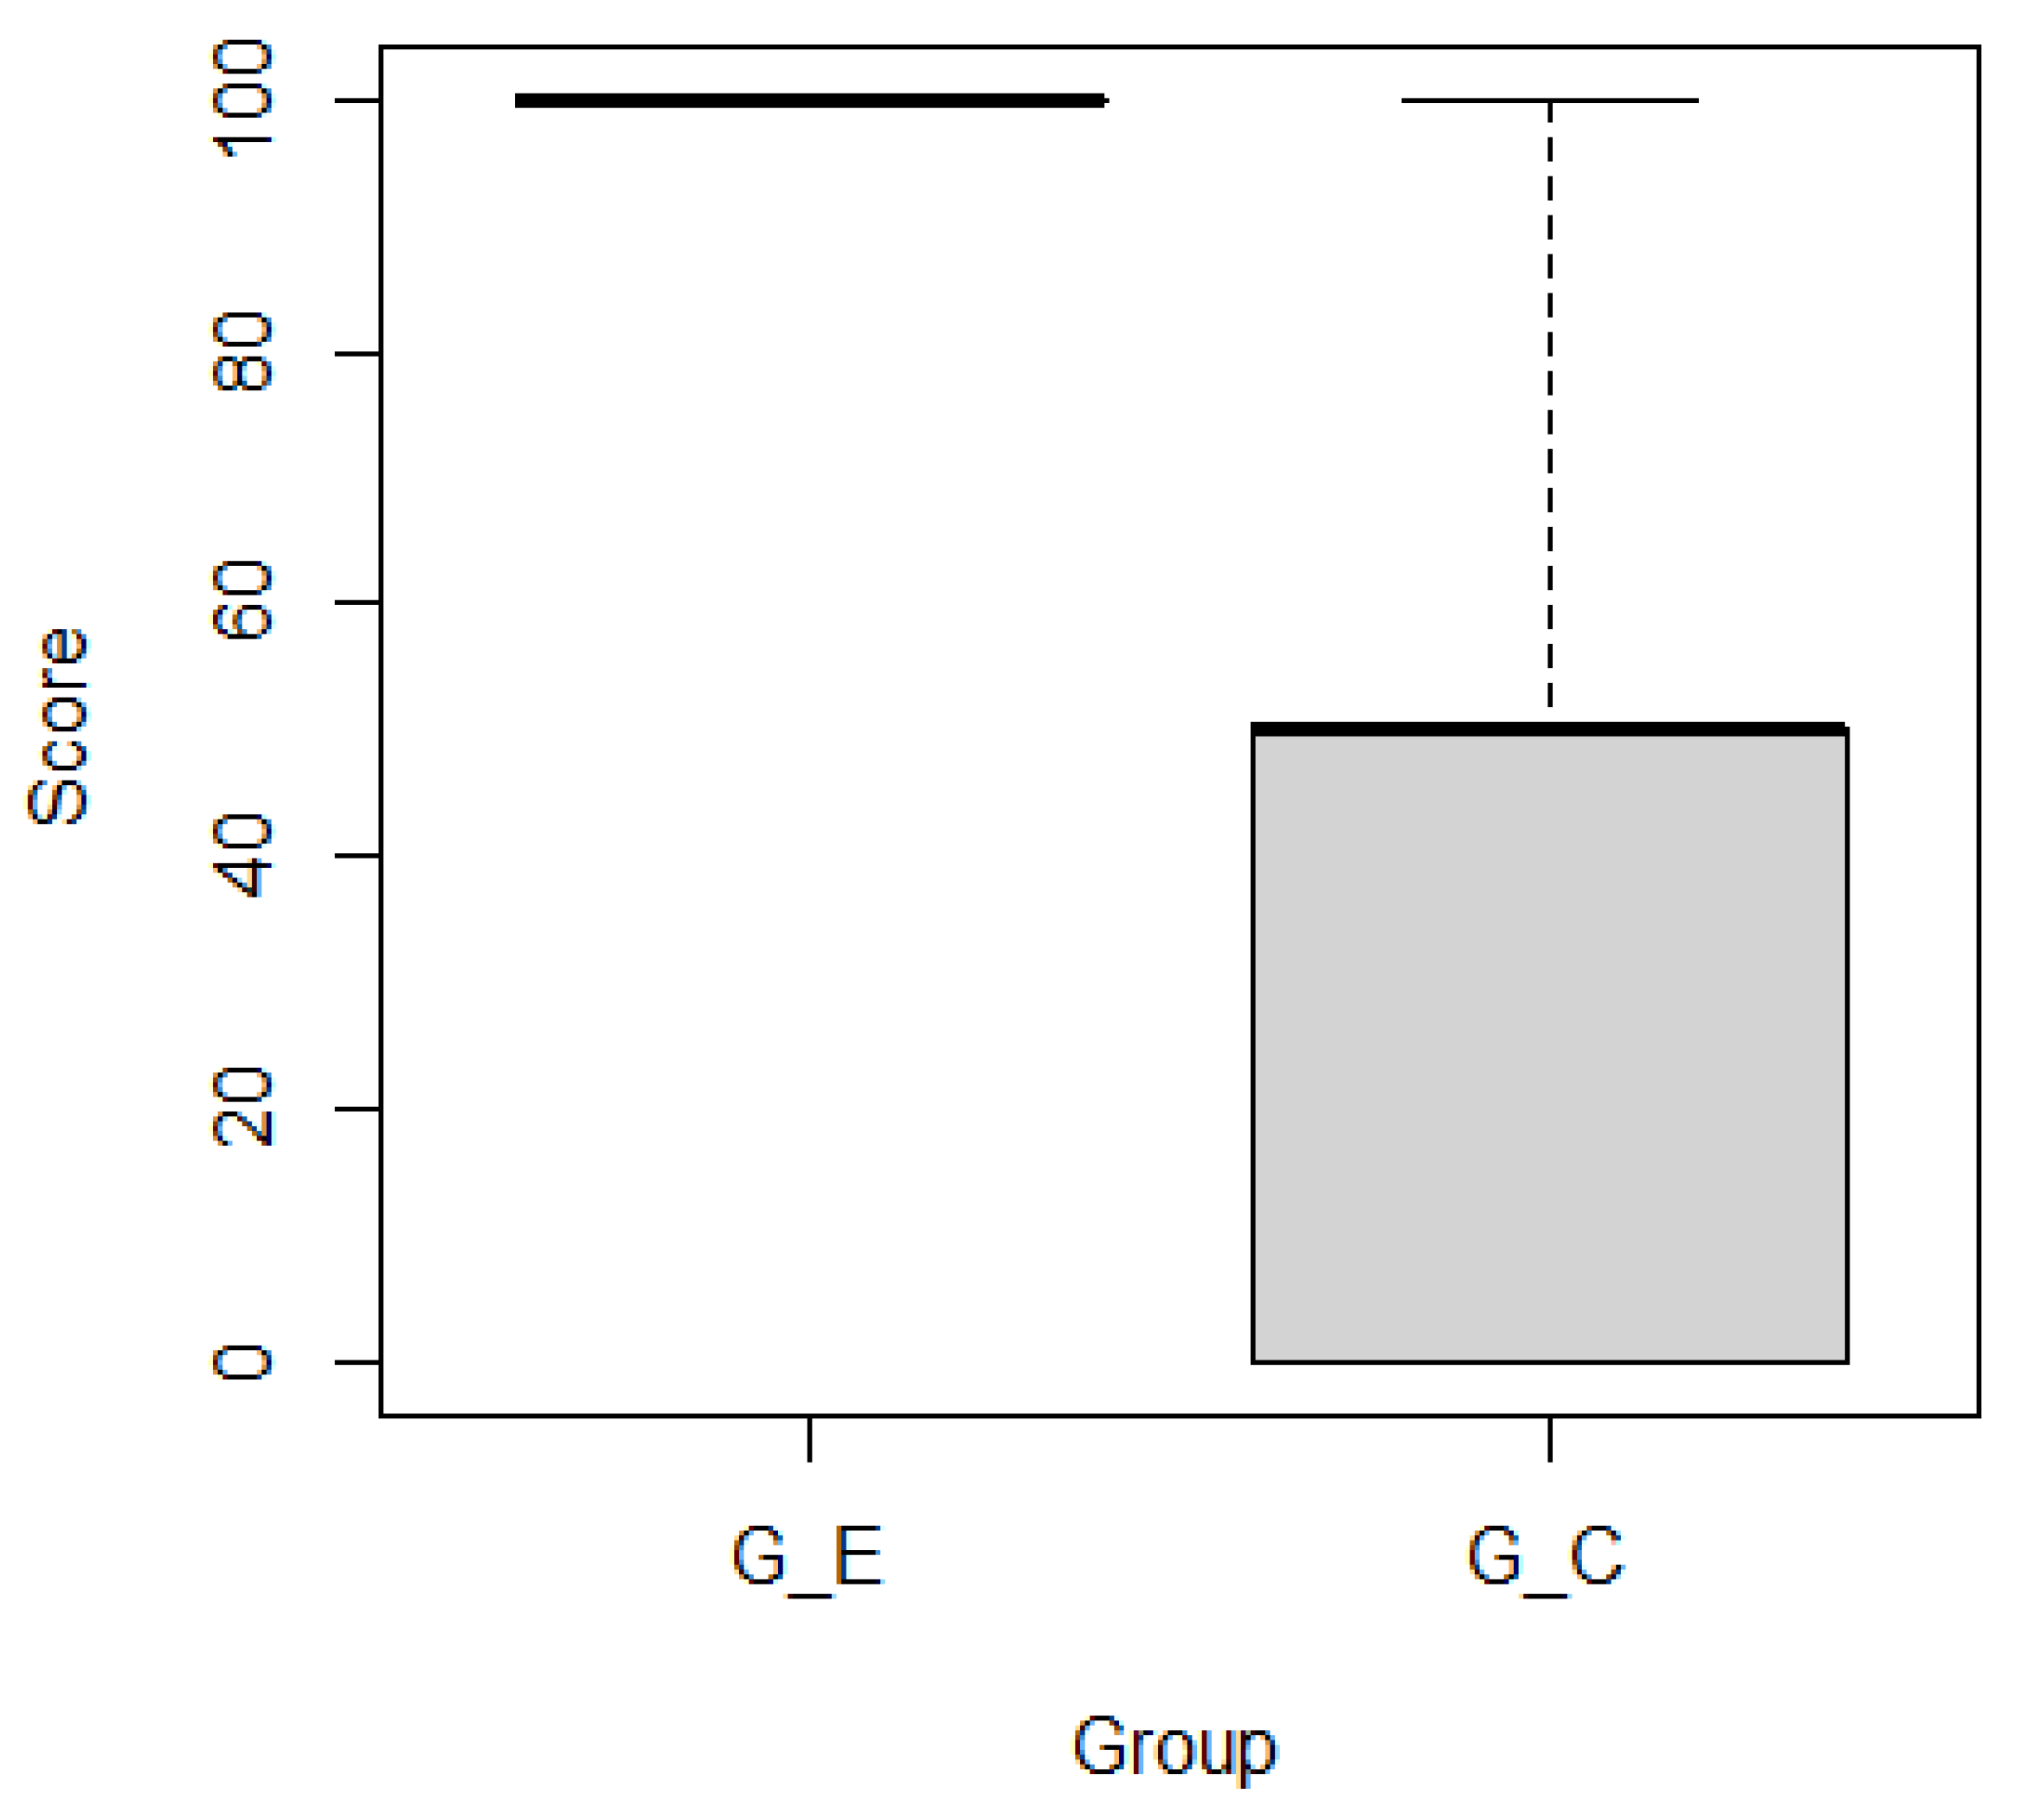
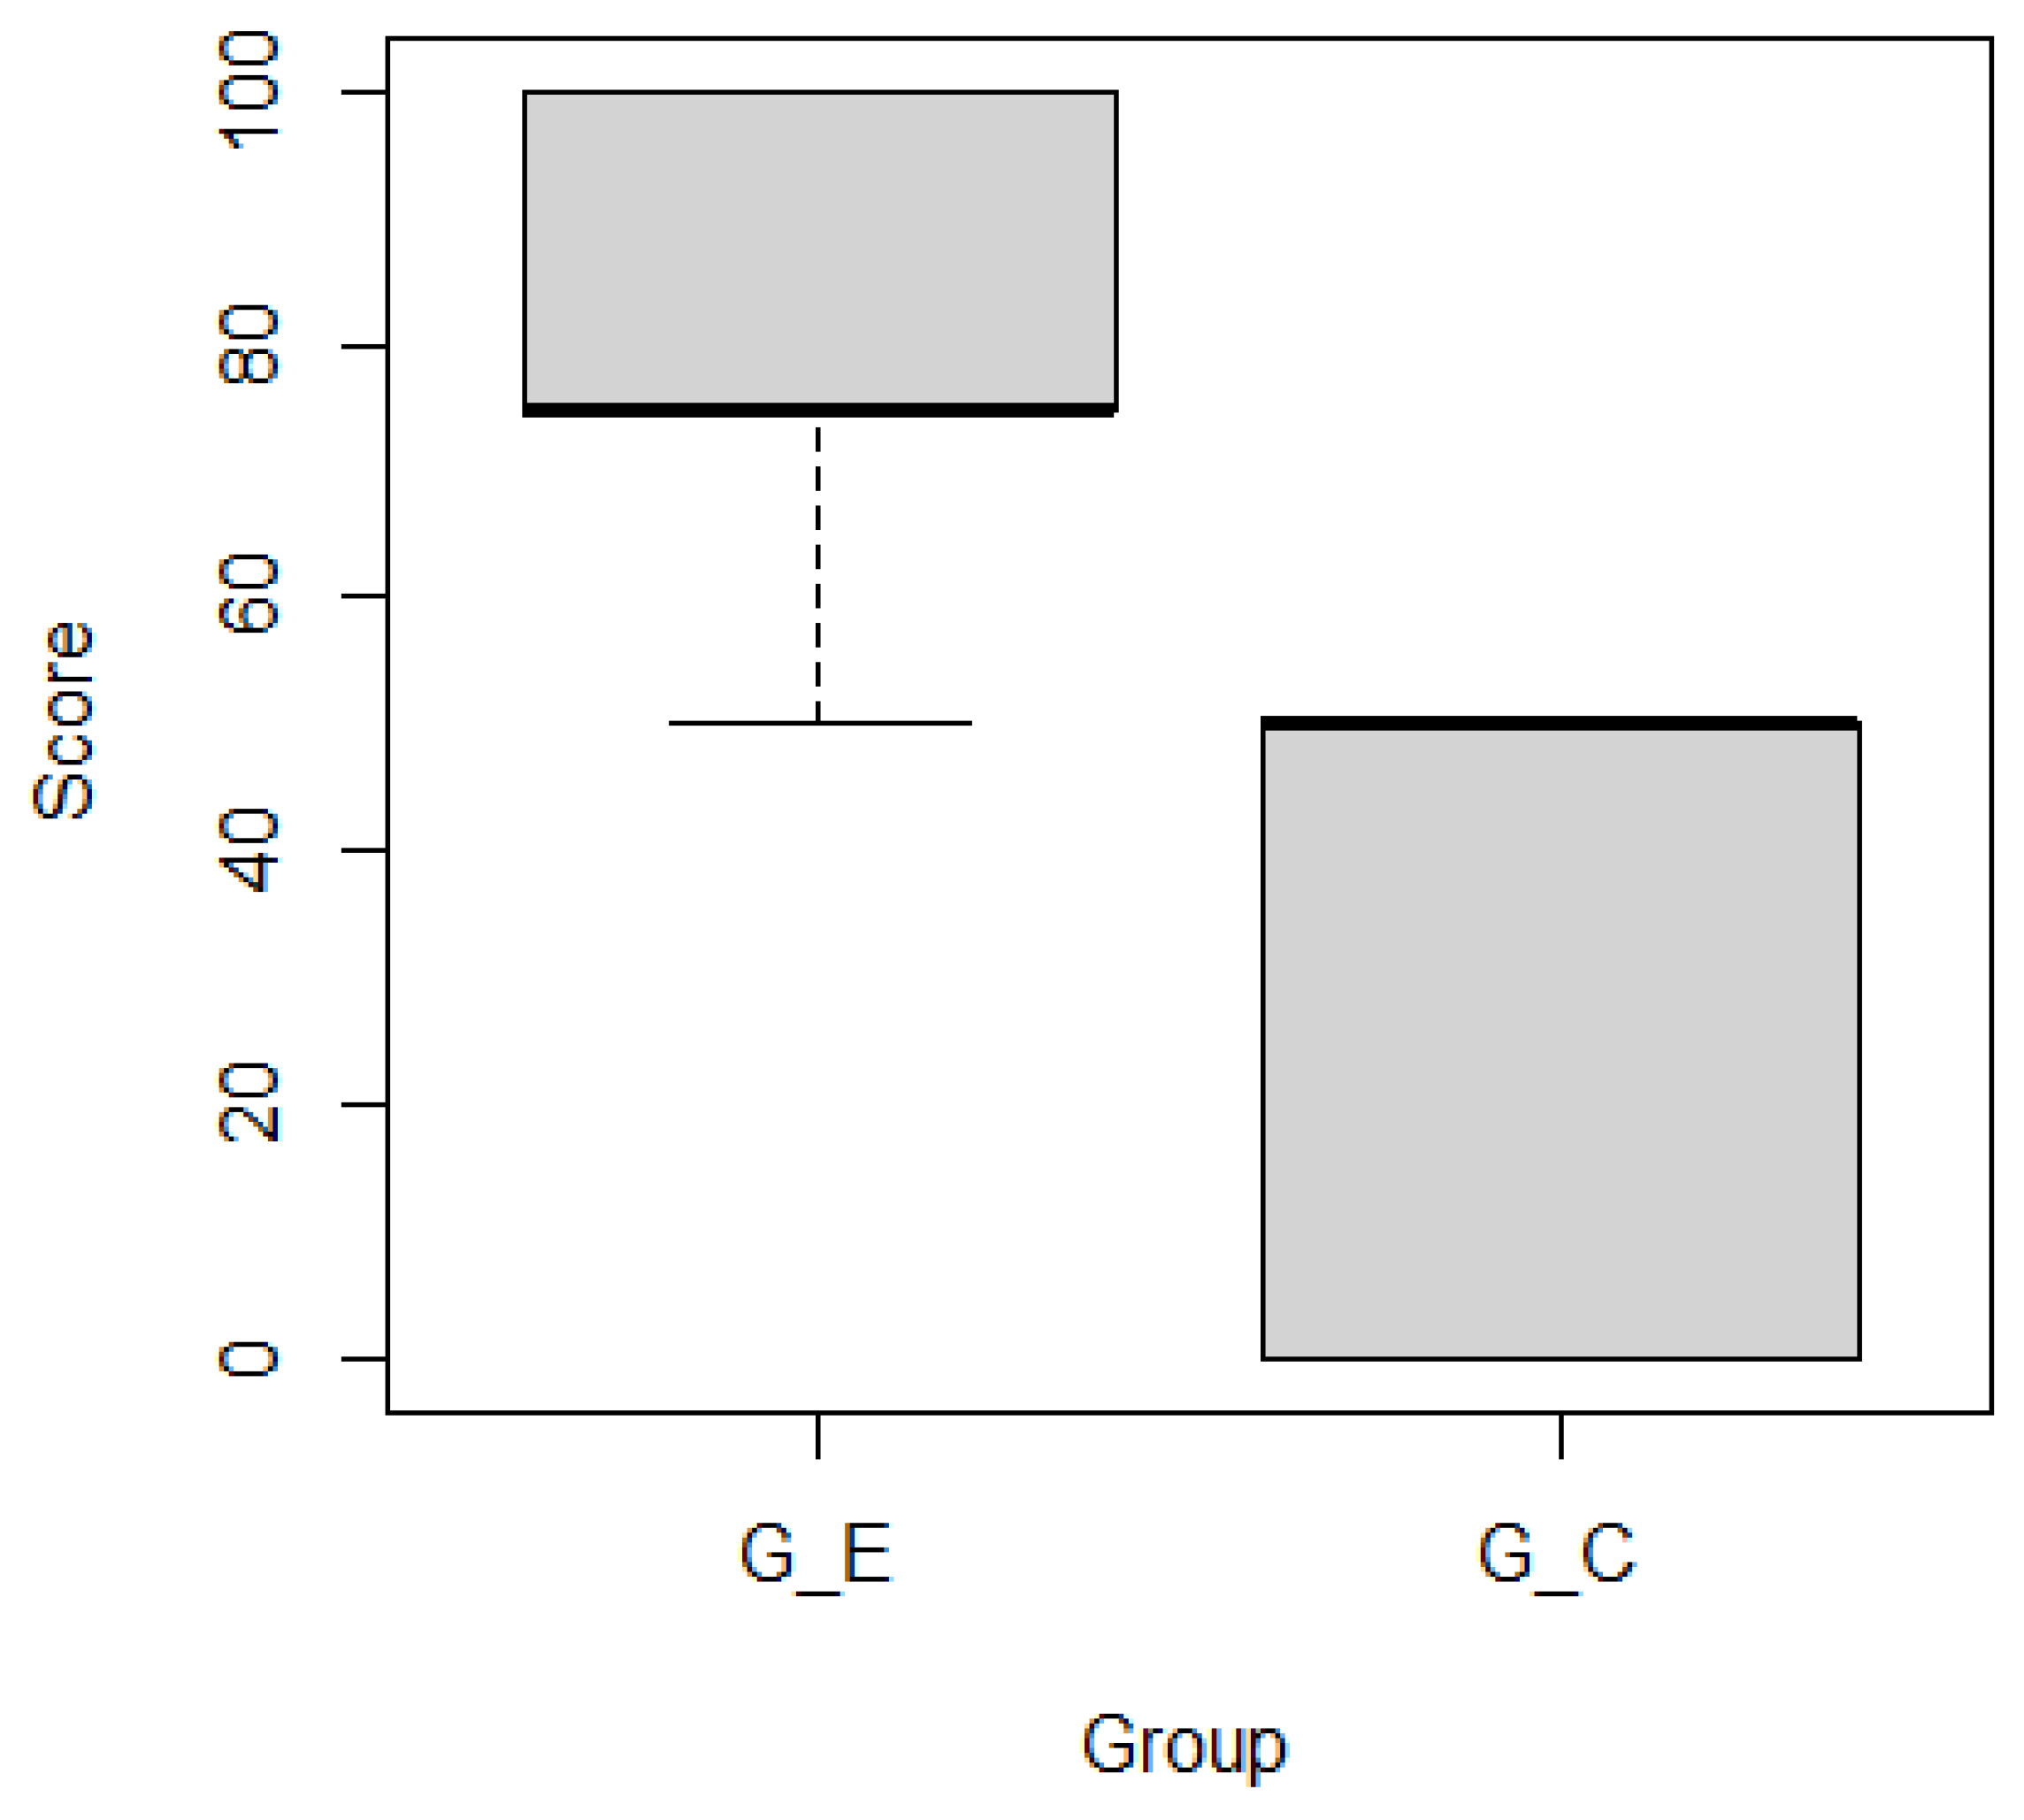
5.2. Results
5.3. Discussion
5.3.1. Does Our Method Improve Project Comprehension?
5.3.2. For Which Tasks Is Our Method Effective?
6. Limitations and Use Cases
6.1. Limitations and Threats to Validity
6.2. Use Cases
- UC1
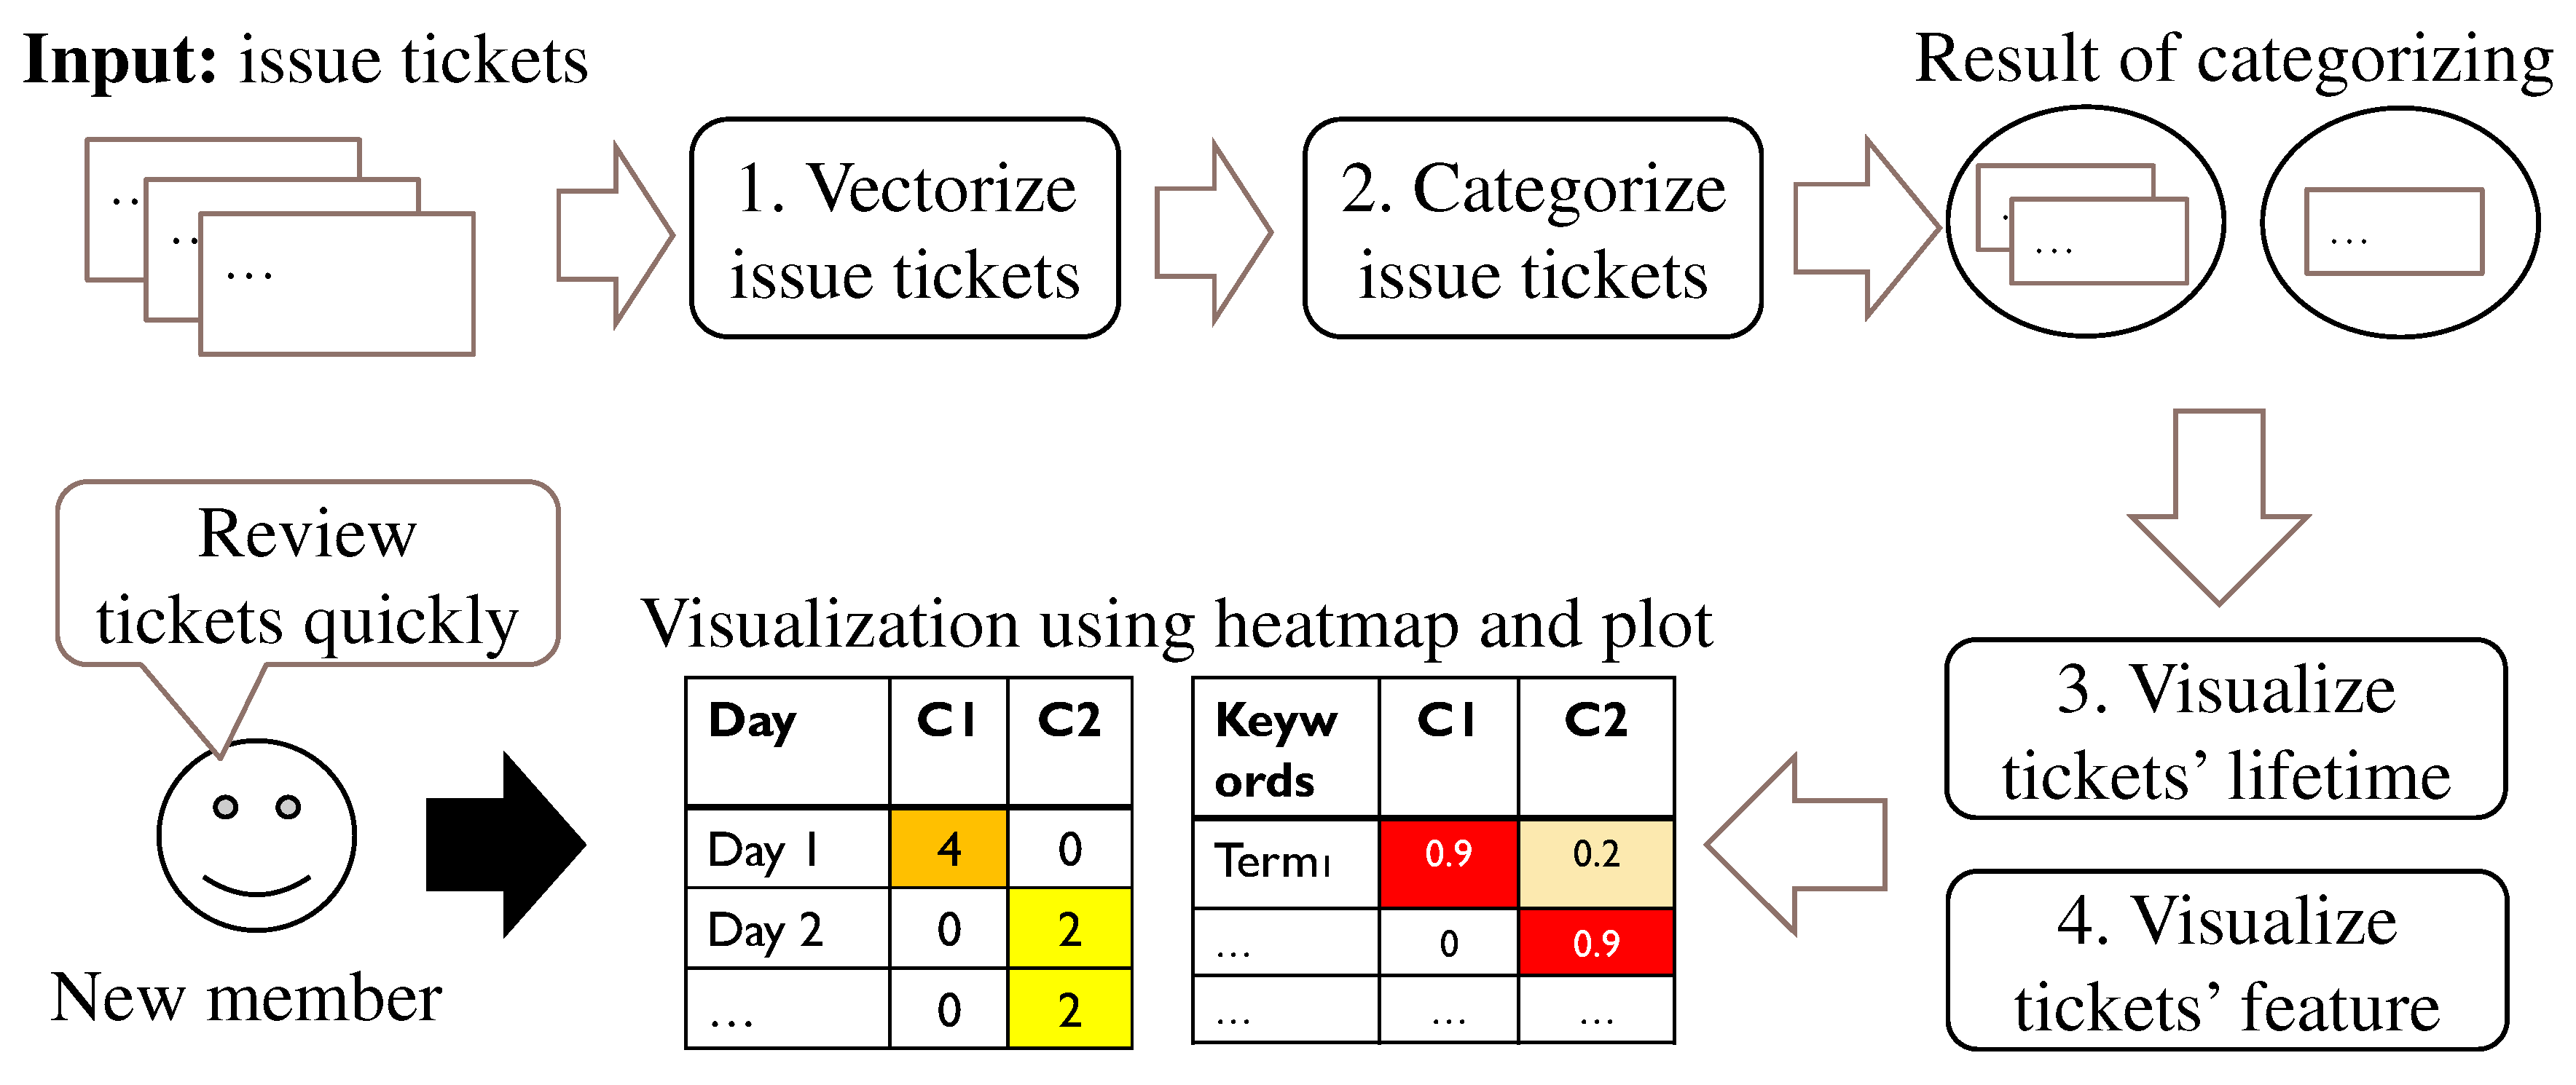
- When new members are assigned to an existing project, our categorization method can help them roughly understand the types and contents of tickets addressed in the target software system development by categorizing tickets automatically with an estimation of the appropriate number of categories. This use case is particularly supported by the answers to research questions RQ1–RQ2.
- UC2
- When new members are assigned to an existing project, our visualization method can help them roughly understand the relationships among the ticket categories, the lifetime and feature of each category addressed in the target development, and support prioritization of the features for the next development. This use case is particularly supported by the answers to research questions RQ2–RQ4.
- UC3
- The results of our case study and experiment can serve as a reference for the software requirements engineering and related community, including practitioners and researchers, for practicing and researching further project comprehension methods and tools. Since the ticket lifetime and feature visualization procedures are somewhat independent from the ticket categorization procedure in our method, researchers may independently extend or replace the categorization method and the visualization method.
7. Conclusions and Future Work
Author Contributions
Funding
Institutional Review Board Statement
Informed Consent Statement
Data Availability Statement
Conflicts of Interest
References
- Park, B.K.; Kim, R.Y.C. Effort Estimation Approach through Extracting Use Cases via Informal Requirement Specifications. Appl. Sci. 2020, 10, 3044. [Google Scholar] [CrossRef]
- Matturro, G.; Barrella, K.; Benitez, P. Difficulties of newcomers joining software projects already in execution. In Proceedings of the 2017 International Conference on Computational Science and Computational Intelligence, Las Vegas, NV, USA, 14–16 December 2017; pp. 993–998. [Google Scholar]
- Steinmacher, I.; Treude, C.; Gerosa, M.A. Let Me In Guidelines for the Successful Onboarding of Newcomers to Open Source Projects. IEEE Softw. 2019, 36, 41–49. [Google Scholar] [CrossRef]
- Meneely, A.; Corcoran, M.; Williams, L.A. Improving developer activity metrics with issue tracking annotations. In Proceedings of the 2010 ICSE Workshop on Emerging Trends in Software Metrics, WETSoM 2010, Cape Town, South Africa, 4 May 2010; Canfora, G., Concas, G., Marchesi, M., Tempero, E.D., Zhang, H., Eds.; ACM: New York, NY, USA, 2010; pp. 75–80. [Google Scholar]
- Mani, S.; Sankaranarayanan, K.; Sinha, V.S.; Devanbu, P.T. Panning requirement nuggets in stream of software maintenance tickets. In Proceedings of the 22nd ACM SIGSOFT International Symposium on Foundations of Software Engineering, (FSE-22), Hong Kong, China, 16–22 November 2014; Cheung, S., Orso, A., Storey, M.D., Eds.; ACM: New York, NY, USA, 2014; pp. 678–688. [Google Scholar]
- Saito, S.; Iimura, Y.; Massey, A.K.; Antón, A.I. How Much Undocumented Knowledge is there in Agile Software Development?: Case Study on Industrial Project Using Issue Tracking System and Version Control System. In Proceedings of the 25th IEEE International Requirements Engineering Conference, RE 2017, Lisbon, Portugal, 4–8 September 2017; Moreira, A., Araújo, J., Hayes, J., Paech, B., Eds.; IEEE Computer Society: Washington, DC, USA, 2017; pp. 194–203. [Google Scholar]
- Saito, S.; Iimura, Y.; Massey, A.K.; Antón, A.I. Discovering undocumented knowledge through visualization of agile software development activities. Requir. Eng. 2018, 23, 381–399. [Google Scholar] [CrossRef]
- Backlog. Available online: https://backlog.com/ (accessed on 9 February 2022).
- Moreno, A.; Iglesias, C.A. Understanding Customers’ Transport Services with Topic Clustering and Sentiment Analysis. Appl. Sci. 2021, 11, 10169. [Google Scholar] [CrossRef]
- Artiles, J.; Gonzalo, J.; Sekine, S. The SemEval-2007 WePS Evaluation: Establishing a benchmark for the Web People Search Task. In Proceedings of the 4th International Workshop on Semantic Evaluations, SemEval@ACL 2007, Prague, Czech Republic, 23–24 June 2007; Agirre, E., Villodre, L.M., Wicentowski, R., Eds.; The Association for Computer Linguistics: Stroudsburg, PA, USA, 2007; pp. 64–69. [Google Scholar]
- Ishizuka, R.; Washizaki, H.; Fukazawa, Y.; Saito, S.; Ouji, S. Categorizing and Visualizing Issue Tickets to Better Understand the Features Implemented in Existing Software Systems. In Proceedings of the 10th International Workshop on Empirical Software Engineering in Practice, IWESEP 2019, Tokyo, Japan, 13–14 December 2019; pp. 25–30. [Google Scholar]
- Misra, S. A Step by Step Guide for Choosing Project Topics and Writing Research Papers in ICT Related Disciplines. In Information and Communication Technology and Applications; Misra, S., Muhammad-Bello, B., Eds.; Springer International Publishing: Cham, Switzerland, 2021; pp. 727–744. [Google Scholar]
- Dekhtyar, A.; Fong, V. RE Data Challenge: Requirements Identification with Word2Vec and TensorFlow. In Proceedings of the 25th IEEE International Requirements Engineering Conference, RE 2017, Lisbon, Portugal, 4–8 September 2017; Moreira, A., Araújo, J., Hayes, J., Paech, B., Eds.; IEEE Computer Society: Washington, DC, USA, 2017; pp. 484–489. [Google Scholar]
- Pingclasai, N.; Hata, H.; Matsumoto, K. Classifying Bug Reports to Bugs and Other Requests Using Topic Modeling. In Proceedings of the 20th Asia-Pacific Software Engineering Conference, APSEC 2013, Ratchathewi, Bangkok, Thailand, 2–5 December 2013; Muenchaisri, P., Rothermel, G., Eds.; IEEE Computer Society: Washington, DC, USA, 2013; Volume 2, pp. 13–18. [Google Scholar]
- Sabetta, A.; Bezzi, M. A Practical Approach to the Automatic Classification of Security-Relevant Commits. In Proceedings of the 2018 IEEE International Conference on Software Maintenance and Evolution, ICSME 2018, Madrid, Spain, 23–29 September 2018; IEEE Computer Society: Washington, DC, USA, 2018; pp. 579–582. [Google Scholar]
- Word2Vec. Available online: https://code.google.com/archive/p/word2vec/ (accessed on 9 February 2022).
- Laurent, P.; Cleland-Huang, J.; Duan, C. Towards Automated Requirements Triage. In Proceedings of the 15th IEEE International Requirements Engineering Conference, RE 2007, New Delhi, India, 15–19 October 2007; IEEE Computer Society: Washington, DC, USA, 2007; pp. 131–140. [Google Scholar]
- Ohkura, K.; Kawaguchi, S.; Iida, H. A Method for Visualizing Contexts in Software Development using Clustering Email Archives. SEC J. 2010, 6, 134–143. [Google Scholar]
- Jain, A.K.; Dubes, R.C. Algorithms for Clustering Data; Prentice-Hall: Hoboken, NJ, USA, 1988. [Google Scholar]
- Mojena, R. Hierarchical Grouping Methods and Stopping Rules: An Evaluation. Comput. J. 1977, 20, 359–363. [Google Scholar] [CrossRef] [Green Version]
- Tibshirani, R.; Walther, G.; Hastie, T. Estimating the number of clusters in a data set via the gap statistic. J. R. Stat. Soc. 2001, 63, 411–423. [Google Scholar] [CrossRef]
- Chen, N.; Lin, J.; Hoi, S.C.H.; Xiao, X.; Zhang, B. AR-miner: Mining informative reviews for developers from mobile app marketplace. In Proceedings of the 36th International Conference on Software Engineering, ICSE ’14, Hyderabad, India, 31 May–7 June 2014; Jalote, P., Briand, L.C., van der Hoek, A., Eds.; ACM: New York, NY, USA, 2014; pp. 767–778. [Google Scholar]
- Yeasmin, S.; Roy, C.K.; Schneider, K.A. Interactive Visualization of Bug Reports Using Topic Evolution and Extractive Summaries. In Proceedings of the 30th IEEE International Conference on Software Maintenance and Evolution, Victoria, BC, Canada, 29 September–3 October 2014; IEEE Computer Society: Washington, DC, USA, 2014; pp. 421–425. [Google Scholar]
- Saito, S.; Iimura, Y.; Takahashi, K.; Massey, A.K.; Antón, A.I. Tracking requirements evolution by using issue tickets: A case study of a document management and approval system. In Proceedings of the 36th International Conference on Software Engineering, ICSE ’14, Companion Proceedings, Hyderabad, India, 31 May–7 June 2014; Jalote, P., Briand, L.C., van der Hoek, A., Eds.; ACM: New York, NY, USA, 2014; pp. 245–254. [Google Scholar]
- Saito, S.; Iimura, Y.; Tashiro, H.; Massey, A.K.; Antón, A.I. Visualizing the effects of requirements evolution. In Proceedings of the 38th International Conference on Software Engineering, ICSE 2016, Austin, TX, USA, 14–22 May 2016; Companion Volume. Dillon, L.K., Visser, W., Williams, L.A., Eds.; ACM: New York, NY, USA, 2016; pp. 152–161. [Google Scholar]
- Wnuk, K.; Regnell, B.; Karlsson, L. Visualization of Feature Survival in Platform-Based Embedded Systems Development for Improved Understanding of Scope Dynamics. In Proceedings of the Third International Workshop on Requirements Engineering Visualization (REV’08), Barcelona, Spain, 8 September 2008; IEEE Computer Society: Washington, DC, USA, 2008; pp. 41–50. [Google Scholar]
- Wnuk, K.; Regnell, B.; Karlsson, L. What Happened to Our Features? Visualization and Understanding of Scope Change Dynamics in a Large-Scale Industrial Setting. In Proceedings of the RE 2009, 17th IEEE International Requirements Engineering Conference, Atlanta, GA, USA, 31 August–4 September 2009; IEEE Computer Society: Washington, DC, USA, 2009; pp. 89–98. [Google Scholar]
- Wnuk, K.; Gorschek, T.; Callele, D.; Karlsson, E.; Ahlin, E.; Regnell, B. Supporting Scope Tracking and Visualization for Very Large-Scale Requirements Engineering-Utilizing FSC+, Decision Patterns, and Atomic Decision Visualizations. IEEE Trans. Softw. Eng. 2016, 42, 47–74. [Google Scholar] [CrossRef]
- Misue, K.; Yazaki, S. Panoramic View for Visual Analysis of Large-Scale Activity Data. In Proceedings of the Business Process Management Workshops—BPM 2012 International Workshops, Tallinn, Estonia, 3 September 2012; Revised Papers; Lecture Notes in Business Information Processing. Rosa, M.L., Soffer, P., Eds.; Springer: Berlin, Germany, 2012; Volume 132, pp. 756–767. [Google Scholar]
- Gotel, O.C.; Marchese, F.T.; Morris, S.J. On Requirements Visualization. In Proceedings of the Second International Workshop on Requirements Engineering Visualization (REV 2007), New Delhi, India, 15–19 October 2007; IEEE Computer Society: Washington, DC, USA, 2007; pp. 1–10. [Google Scholar]
- Zhao, Y.; Dong, J.; Peng, T. Ontology Classification for Semantic-Web-Based Software Engineering. IEEE Trans. Serv. Comput. 2009, 2, 303–317. [Google Scholar] [CrossRef]
- Ankolekar, A.; Sycara, K.P.; Herbsleb, J.D.; Kraut, R.E.; Welty, C.A. Supporting online problem-solving communities with the semantic web. In Proceedings of the 15th international conference on World Wide Web, WWW 2006, Edinburgh, UK, 23–26 May 2006; Carr, L., Roure, D.D., Iyengar, A., Goble, C.A., Dahlin, M., Eds.; ACM: New York, NY, USA, 2006; pp. 575–584. [Google Scholar]
- Witte, R.; Zhang, Y.; Rilling, J. Empowering Software Maintainers with Semantic Web Technologies. In Proceedings of the Semantic Web: Research and Applications, 4th European Semantic Web Conference, ESWC 2007, Innsbruck, Austria, 3–7 June 2007; Lecture Notes in Computer, Science. Franconi, E., Kifer, M., May, W., Eds.; Springer: Berlin, Germany, 2007; Volume 4519, pp. 37–52. [Google Scholar]
- Yates, R.; Power, N.; Buckley, J. Characterizing the transfer of program comprehension in onboarding: An information-push perspective. Empir. Softw. Eng. 2020, 25, 940–995. [Google Scholar] [CrossRef]
- Viviani, G.; Murphy, G.C. Reflections on onboarding practices in mid-sized companies. In Proceedings of the 12th International Workshop on Cooperative and Human Aspects of Software Engineering, CHASE@ICSE 2019, Montréal, QC, Canada, 27 May 2019; Dittrich, Y., Fagerholm, F., Hoda, R., Socha, D., Steinmacher, I., Eds.; ACM: New York, NY, USA, 2019; pp. 83–84. [Google Scholar]
- Steinmacher, I.; Wiese, I.S.; Conte, T.; Gerosa, M.A.; Redmiles, D.F. The hard life of open source software project newcomers. In Proceedings of the 7th International Workshop on Cooperative and Human Aspects of Software Engineering, CHASE 2014, Hyderabad, India, 2–3 June 2014; Sharp, H., Prikladnicki, R., Begel, A., de Souza, C.R.B., Eds.; ACM: New York, NY, USA, 2014; pp. 72–78. [Google Scholar]
- MeCab. Available online: https://taku910.github.io/mecab/ (accessed on 9 February 2022).
- Isotani, H.; Washizaki, H.; Fukazawa, Y.; Nomoto, T.; Ouji, S.; Saito, S. Duplicate Bug Report Detection by Using Sentence Embedding and Fine-tuning. In Proceedings of the IEEE International Conference on Software Maintenance and Evolution, ICSME 2021, Luxembourg, 27 September–1 October 2021; pp. 535–544. [Google Scholar]
- Kanakogi, K.; Washizaki, H.; Fukazawa, Y.; Ogata, S.; Okubo, T.; Kato, T.; Kanuka, H.; Hazeyama, A.; Yoshioka, N. Tracing CVE Vulnerability Information to CAPEC Attack Patterns Using Natural Language Processing Techniques. Information 2021, 12, 298. [Google Scholar] [CrossRef]
- Filatova, E.; Hatzivassiloglou, V. A Formal Model for Information Selection in Multi-Sentence Text Extraction. In Proceedings of the COLING 2004, 20th International Conference on Computational Linguistics, Geneva, Switzerland, 23–27 August 2004; pp. 397–403. [Google Scholar]


| Item | Description |
|---|---|
| Title | Add Button |
| Description | Add Button on a dialog |
| Assignee | Bob |
| Issue date | yyyy/mm/02 |
| Updated date | yyyy/mm/03 |
| Comment 1 | Fix dialog |
| #Categories | Purity | Inverse Purity | |
|---|---|---|---|
| 4 | 0.056 | 0.891 | 0.582 |
| 6 | 0.533 | 0.574 | 0.551 |
| 8 | 0.557 | 0.513 | 0.533 |
| 10 | 0.573 | 0.461 | 0.510 |
| Company Affiliation | Role | Goal |
|---|---|---|
| Inside | Software engineer Requirement engineer | To determine the types of software features |
| Customer | To elucidate the software features | |
| Outside | Software engineer |
Publisher’s Note: MDPI stays neutral with regard to jurisdictional claims in published maps and institutional affiliations. |
© 2022 by the authors. Licensee MDPI, Basel, Switzerland. This article is an open access article distributed under the terms and conditions of the Creative Commons Attribution (CC BY) license (https://creativecommons.org/licenses/by/4.0/).
Share and Cite
Ishizuka, R.; Washizaki, H.; Tsuda, N.; Fukazawa, Y.; Ouji, S.; Saito, S.; Iimura, Y. Categorization and Visualization of Issue Tickets to Support Understanding of Implemented Features in Software Development Projects. Appl. Sci. 2022, 12, 3222. https://doi.org/10.3390/app12073222
Ishizuka R, Washizaki H, Tsuda N, Fukazawa Y, Ouji S, Saito S, Iimura Y. Categorization and Visualization of Issue Tickets to Support Understanding of Implemented Features in Software Development Projects. Applied Sciences. 2022; 12(7):3222. https://doi.org/10.3390/app12073222
Chicago/Turabian StyleIshizuka, Ryo, Hironori Washizaki, Naohiko Tsuda, Yoshiaki Fukazawa, Saori Ouji, Shinobu Saito, and Yukako Iimura. 2022. "Categorization and Visualization of Issue Tickets to Support Understanding of Implemented Features in Software Development Projects" Applied Sciences 12, no. 7: 3222. https://doi.org/10.3390/app12073222