
Robot Swarms Decide under Perception Errors in Best-of-N Problems


Information Technology Group, Department of Social Sciences, Wageningen University and Research, Hollandseweg 1, 6706 KN Wageningen, The Netherlands
Appl. Sci. 2022, 12(6), 2975; https://doi.org/10.3390/app12062975
Submission received: 12 January 2022
/
Revised: 2 March 2022
/
Accepted: 11 March 2022
/
Published: 15 March 2022
(This article belongs to the Special Issue Artificial Intelligence within Robot Swarms)
Abstract
:Robot swarms have been used extensively to examine best-of-N decisions; however, most studies presume that robots can reliably estimate the quality values of the various options. In an attempt to bridge the gap to reality, in this study, we assume robots with low-quality sensors take inaccurate measurements in both directions of overestimating and underestimating the quality of available options. We propose the use of three algorithms for allowing robots to identify themselves individually based on both their own measurements and the measurements of their dynamic neighborhood. Within the decision-making process, we then weigh the opinions of robots who define themselves as inaccurately lower than others. Our research compares the classification accuracy of the three algorithms and looks into the swarm’s decision accuracy when the best algorithm for classification is used.
1. Introduction
Collective decision making is a wide-spread phenomena across both natural [1,2,3] and artificial systems [4,5,6]. In artificial systems, it has been intensively studied in the context of robot swarms, where a group of robots needs to establish an agreement while performing a particular task. For robot swarms, a large number of collective decision-making problems are defined in the form of consensus [7,8], in which robots must agree on one of the available options. For a finite and discrete set of options, the problem is formulated as a discrete consensus problem. Nevertheless, when the quality of the options varies, the problem becomes a best-of-n problem [9,10]. In best-of-n problems, robots are supposed to explore their environment looking for the available options, and measuring their quality values in a phase known as the exploration phase. The exploration phase is typically followed by an exploitation phase in which robots interact with their local neighborhoods to exchange their measurements and/or opinions and attempt to reach an agreement by following a particular voting approach. Many works have focused on consensus achievement in best-of-N decisions. In [11], the authors contributed a literature review on design methodologies in collective decision-making problems, in which they discussed best-of-N decisions in terms of option quality and cost. In [12], the authors investigate the impact of the population size and the number of options on the consensus speed in best-of-N decisions. In [13], the authors consider Byzantine robots in best-of-N decision problem. Robot can show arbitrarily faulty behavior or malicious behavior. The authors of [14] investigate the relative time invested by swarm individuals in option discovery and in signaling behaviors when generalizing the best-of-N problems to consider options. Finally, the work presented in [15] paves the way for exploiting Bayesian algorithms to design collective decision making in robot swarms. The authors design a Bayesian algorithm to help robots judge the spatial distribution of a particular feature in a 2D environment. They show, by means of the accuracy-speed trade-off, that robots with fewer observations can help improve decision accuracy by reducing spatial correlations. In general, Bayesian algorithms for decision making in robot swarms can be a promising approach to deal with faulty measurements. Despite the large number of works focusing on consensus achievement in collective decision-making problems, very few assume individual perception flaws—i.e., errors while measuring the quality of the discovered options. As perception is the foundation of cognition since it provides the necessary input for the decision-making processes [16,17,18], perceptional errors may result in wrong decisions. In our study, robots’ perceptional errors occur in two forms: (i) perceiving a higher quality value or (ii) perceiving a lower quality value of a discovered option.
We assume a robot swarm that consists of three populations: accurate robots, overestimating robots, and underestimating robots. The overestimating robots are robots those for which their sensors generate erroneous measurements by increasing the quality value of the encountered option. On the contrary, underestimating robots are robots for which their sensors generate erroneous measurements by decreasing the quality value of the encountered option. Such inaccurate measurements can result from noisy sensor inputs, robot’s malfunctioning logic, or intended intrusions [19,20].
We consider a site selection problem as our best-of-n problem. In a site selection problem, robots need to select the best site (option) out of n sites (in our case n = 2). Sites are implemented in a 2D physical environment, in which robots explore and come back to a shared area referred to as the nest in order to communicate their findings and attempt to reach a consensus on the best site. The two sites (A and B) are assumed to have numeric qualities . In this study, we aim to investigate the following research questions: (i) are robots able to classify themselves in terms of their measuring accuracy; (ii) which of the classifying algorithms performs best; and (iii) are robots able to achieve consensus under erroneous measurements? Moreover, in the case of a consensus, what is the chance of converging to the best option?
The behavior of the robots is designed as a combination of a basic and an extended model. The basic models describes robot exploration and exploitation behaviors, whereas the extended model describes the different algorithms used by the robots to classify themselves in terms of their measuring accuracy and to marginalize the opinion of non-accurate robots. Our results report the classification accuracy of the three suggested algorithms for different swarm sizes and different population compositions for a particular size. We also investigate the accuracy of the resultant collective decision for two cases: (a) Measurement errors can occur at one site (here site B), and (b) measurement errors can occur at both sites A and B, when robot uses classification vs. no classification. Our results highlight the cases when classification has a clear impact on the accuracy of the swarm’s decision. Finally, our findings highlight the model parameters to which the classification algorithm is highly sensitive.
2. The Robot’s Basic Behavioral Model
In this section, we present the microscopic model used by the robot to discover new sites, evaluate them, share this information, and make a vote (i.e., an opinion) by fusing the robot’s measurements with the information received from its neighbors. Figure 1 shows a state machine of the robot’s behavior. Robots start in the “leave nest” state and leave the nest to visit the “explore” state, which enables robots to look around for new sites.
As soon as a robot encounters site , it starts evaluating the site’s quality by taking measurements, where a measure is sampled as follows:
, where is the actual quality value of the site and is the robot’s erroneous parameter—a configurable parameter. is zero for accurate robots and a positive (negative) real number for overestimating (underestimating) robots. is the standard deviation of the measurement distribution. The robot starts leaving the site as soon as it has collected its measurements. The measurements are sampled with a time difference of , which allow the robot to change location and measure a far-enough position. Robots apply a combination of behaviors, and the nest is marked with lights; hence, the robots apply a combination of antiphototaxis/phototaxis and obstacle avoidance behavior to leave and return to the nest.
When the robot reaches the nest, it transits to the “disseminate” state. This state consists of two phases: (i) a mix-up phase and (ii) a communicate phase. In the mix-up phase, the robot performs a random walk in the nest for a predefined period to avoid clusters of robots with the same opinion to build up—i.e., these are robots returning from the same site which they have visited in the last exploration trip. When is over, the robot starts communicating its measurements of the quality of the site that it has visited in its last exploration trip while continuing its random walk in the nest. Preserving the random walk, enables robots to change their local neighborhood and helps to further mix up the swarm and accelerates the spread of information [21,22].
When disseminating, the robot sends a message that includes two pieces of information: (i) the site it is committed to (at the beginning, this is the site the robot has visited during its last exploration trip), and (ii) the quality value estimated by the robot using its measurements that it has taken when visiting the site. The robot receives information from its neighborhood messages of the same structure and uses these messages to compute the average quality value of each of the two sites as follows:
where is the number of the robot’s neighbors who have visited site during their last exploration trip. Afterwards, the robot compares the average values computed using in Equation (2) for the two sites as . We introduce parameter as a configurable threshold for the evaluation bias ( equal for both sites):
- In case , which means that the difference in the sites’ qualities is negligible, the robot adapts the opinion of the majority in its neighborhood. Additionally, the robot updates the quality value of the site it has committed to with the average , where is the site chosen by the majority in the robot’s neighborhood. Finally, the robot keeps track of the quality of the site it has not chosen by saving it average quality.
- In case , which means that the difference in the sites’ qualities is distinguishable, the robot commits to the site with the higher quality value. Additionally, it updates the quality value of both sites using the averages computed in Equation (2).
- In the case where only one site is communicated in the robot’s neighborhood, the robot commits to that site and updates its quality value using Equation (2).
One final condition needs to be verified before a robot can update its opinion using its social network: This is having the neighborhood size above a given threshold . This condition is exploited to improve the accuracy of for each of the available sites. It mitigates the side effects of an asynchronous start of the dissemination phase, which may introduce a rapid switch in the opinion of the robots.
3. The Extended Robot’s Behavioral Model
We extend the basic behavioral model by adding a classification state, as in Figure 2. This state is used by the robots to classify themselves as belonging to one of the three populations: accurate, overestimating, or underestimating. The robots access this state after returning to the nest and spending in performing a random walk to mix up robots arriving from each site. It also occurs before transiting to the dissemination state. Hence, when the robots access the dissemination state, there is a high likelihood that they have already classified themselves. Robots exploit the classification process to assign a higher weight to opinions shared by accurate robots in comparison to those shared by overestimating/underestimating robots, aiming to improve the quality of the decision-making process. Finally, we propose that when the number of interactions exceeds a predefined threshold , robots from any population shift their classification to accurate. The reasoning behind this heuristic is that if a large enough sample of opinions is combined with larger weights awarded to accurate robots, the opinion will eventually trend toward accuracy.
Initially, when entering the classification state, all robots classify themselves as “unknown”. This classification is shared with the robot’s neighborhood, and it helps to filter out the opinion of the sender, when it has not classified itself yet. The classification state lasts for to grant robots enough time to classify themselves. In this study, we propose different algorithms for robots to classify themselves. In the following, we describe the used algorithms, and we compare them in terms of their classification accuracy.
- The distance-based algorithm: Following this algorithm, at each time step the robot collects the quality values measured by its neighbors who have visited the same site. It calculates the difference between the quality it has measured and the neighbors’ measurements, which is referred to as distance . is the difference between the measure taken by robot i and its neighbor j of the same site.Robot i stores the computed distance paired with the ID of the sender (i.e., robot j). Robot i repeats this computation and stores the distances for all its neighbors who have visited the same site. Storing sender IDs helps the robot to avoid considering the same sender more than once.When the period is expired, every robot has a record of all the neighbors it met during and who measured the quality of the same site. It exploits this record to compute the average distance between its own measurement and the neighbors’ measurements—i.e., how far the robot’s measurement is from its neighbors’ one on average—as follows:where is the number of neighbors robot i encountered during and who have visited the same site as robot i.In order for robot i to classify itself, it checks average distance against a given range :
- -
- : Robot i considers itself as an accurate robot;
- -
- : Robot i considers itself as an underestimating robot;
- -
- : Robot i considers itself as an overestimating robot.
A clear downside of the distance-based approach is the need for global knowledge (i.e, the parameter ) to be shared at the individual level.Differently from the distance-based algorithm, the following two algorithms enable robots to reconstruct the distribution of the quality values of the two sites and by relying on local information. Similarly to the distance-based algorithm, during the period of , robot i collects the quality values measured by its neighbors who have visited the same site. Robot i then exploits these measurements to predict the quality distribution of that particular site. The two investigated algorithms are as follows: - The k-means clustering algorithm: K-means clustering is a clustering algorithm that aggregate data in k groups based on specific similarities [23]. The parameter k tells the algorithm in how many clusters to split the data points. In our study, we have three populations; hence, we set and this piece of information is known by individual robots. The k-means algorithm initializes the means of the three clusters using the data collected during the period of . This divides the range of the collected data evenly by using the minimum and the maximum of the collected data as follows.The algorithm loops over the quality values collected by the robot and assigns each value to the cluster for which its mean has the smallest absolute distance to that value. Once the algorithm has looped over all collected values, it recomputes the means of the three clusters by using the average value over the added data. It repeats this procedure until the means of the three clusters stop to change or until a predefined number of iterations is reached.Afterwards, robots use the generated distribution with the three clusters to classify themselves, i.e., accurate if their opinion belongs to the cluster in the middle, overestimating if their opinion belongs to the cluster with the largest mean, and underestimating if their opinion belongs to the cluster with the smallest mean. The one clear downside of the k-mean algorithm is the prerequisite of parameter k—i.e., robots need to know upfront the number of populations. Additionally, when setting, e.g., , the algorithm will cluster the data in three groups, even when less populations are present. To handle this downside, we introduce in the following—the DBSCAN clustering algorithm.
- The density-based algorithm for discovering clusters (DBSCAN): This algorithm [24] iterates over all values collected by the robot during the period of . For each value, it creates an adjacent list that includes all other values for which its distance to the considered value is less than a configurable parameter . The generated adjacent lists represent potential distribution clusters. Once this is performed, the algorithm iterates over each value that is not classified yet and assigns it—and recursively the members of its adjacent list—to the proper cluster. Values that do not have an adjacent list of at least values are considered as noisy data points and, hence, ignored.Since DBSCAN generates data clusters with no a prior knowledge on the number of clusters, it may output a more accurate number of clusters than the k-mean algorithm. However, when the number of generated clusters is one or two, it becomes challenging for the robots to classify themselves. In case of three clusters, the robots for which its opinions belong in the middle cluster classify themselves as the accurate ones. While robots’ whose opinions belong in the cluster with the largest(lowest) mean classify themselves as overestimating(underestimating). When DBSCAN outputs more than three clusters, robots classify themselves as accurate as long as their opinions do not belong in the most-left (cluster with the lowest mean) or most-right(cluster with the largest mean) clusters. The choice of parameters and plays a key role in the performance (e.g., the accuracy) of the DBSCAN algorithm.
4. Simulations
The simulated environment consists of a 2D arena divided into three regions: two sites (A and B) and a nest in the middle of the two sites. Figure 3 shows a snapshot of the arena in which the best-of-n decision problem is implemented. We add lights above the nest in the middle of the arena to enable robots to use phototaxis and antiphototaxis behaviors while navigating form and towards the nest.
As mentioned in the robot’s basic and extended behavioral models and illustrated in both Figure 1 and Figure 2, all robots start in the exploration state and with no commitment to any of the two sites (options). They leave the nest to explore the arena by performing antiphototaxis behavior. Robots use random walks [25] to search for the different sites. Once a robot encounters a site, it starts inspecting its quality value by taking measurements. After that, the robot exploits phototaxis behavior to navigate back to the nest. In the nest, robots communicate the information they have collected in order to achieve a consensus optimally on the site with the highest quality value. Our experiments are divided in two main sets: (i) In the first set, we enable measurement errors to occur at Site A (red) only, and (ii) we enable measurement errors to occur at both sites A and B. This can be mapped to real scenarios where the sites are characterized with specific access conditions.
We have performed a set of preliminary experiments to finetune the parameter values of the basic behavioral model. Table 1 holds the used values.
As the accuracy of the classification algorithm does not change by varying the number of sites at which robots may obtain erroneous measurements, we examine the accuracy of the classification algorithms using the following set: (i)—errors in measurements can occur at site A only. Differently, investigating the accuracy of the emergent swarm’s decision may depend on the number of sites where inaccurate measurements can occur. Therefore, we consider both sets (i) and (ii) of experiments when examining the accuracy of the collective decision under both conditions of using a classification algorithm vs. no classification. For this investigation, we select the classification algorithm that results in the best accuracy.
5. Results
5.1. Classification Accuracy
In this section, we investigate the classification accuracy of the three algorithms by applying the extended model presented in Section 3. Each of these algorithms enables robots to classify themselves as accurate, overestimation, or underestimating after exploring site A. For Site B (as mentioned in experiments set (i)), all robots measure the site’s quality accurately. That is , where and .
We investigate four swarm sizes for each algorithm: 210, 150, 90, and 30 robots. For a swarm size of 210, we examine different population configurations, shifting from one dominant population to equal populations (see Table 2).
For the distance-based algorithm, our findings show that the system is highly sensitive to variations in swarm size with as the goodness of linear fit. This decrease can be explained by a decrease in neighborhood size, which impacts the size of the measurements sample used by the robot to decide which population it belongs to. For large swarm sizes (210 in our simulations), the algorithm’s accuracy declines only when a single population of robots participates in the site selection task, unless it is the population of accurate robots. Surprisingly, when two populations are recognized, the distance-based approach remains accurate in the majority of cases. We believe that maintaining such an accurate classification is due to the use of global knowledge of parameter by individual robots.
For the k-means algorithm, we set k = 3 for all experiments, and the maximum number of iterations is set to 100. In general, k-mean performs less accurately than the distance-based algorithm. Its accuracy drops specifically when the swarm has two or less robot populations. The reason for this low performance is that the acquired data are forced to be dispersed in three clusters (k = 3), regardless of the actual number of populations. Classification accuracy shows linear decline with a swarm size with as the goodness of linear fit.
For the DBSCAN, we set and (the threshold used to build the adjacent list) for all experiments. If is set too small, it becomes difficult in small swarms to encounter measurements that are within distance from each other; similarly, if is set too large, it becomes difficult to map the collected data to the correct number of populations. DBSCAN classification accuracy decreases anytime the accurate population is minor or absent, as in this case, robots that are not accurate classify themselves as accurate. Thus, when the swarm is composed of two populations or less, DBSCAN performs well only when the accurate population is one of the swarm populations, and the majority of robots belong to that population. Finally, DBSCAN classification accuracy decreases linearly with swarm size, with as the goodness of linear fit.
5.2. Consensus Accuracy
5.2.1. Experiments Set I: Measurement Errors Can Occur Only at Site A
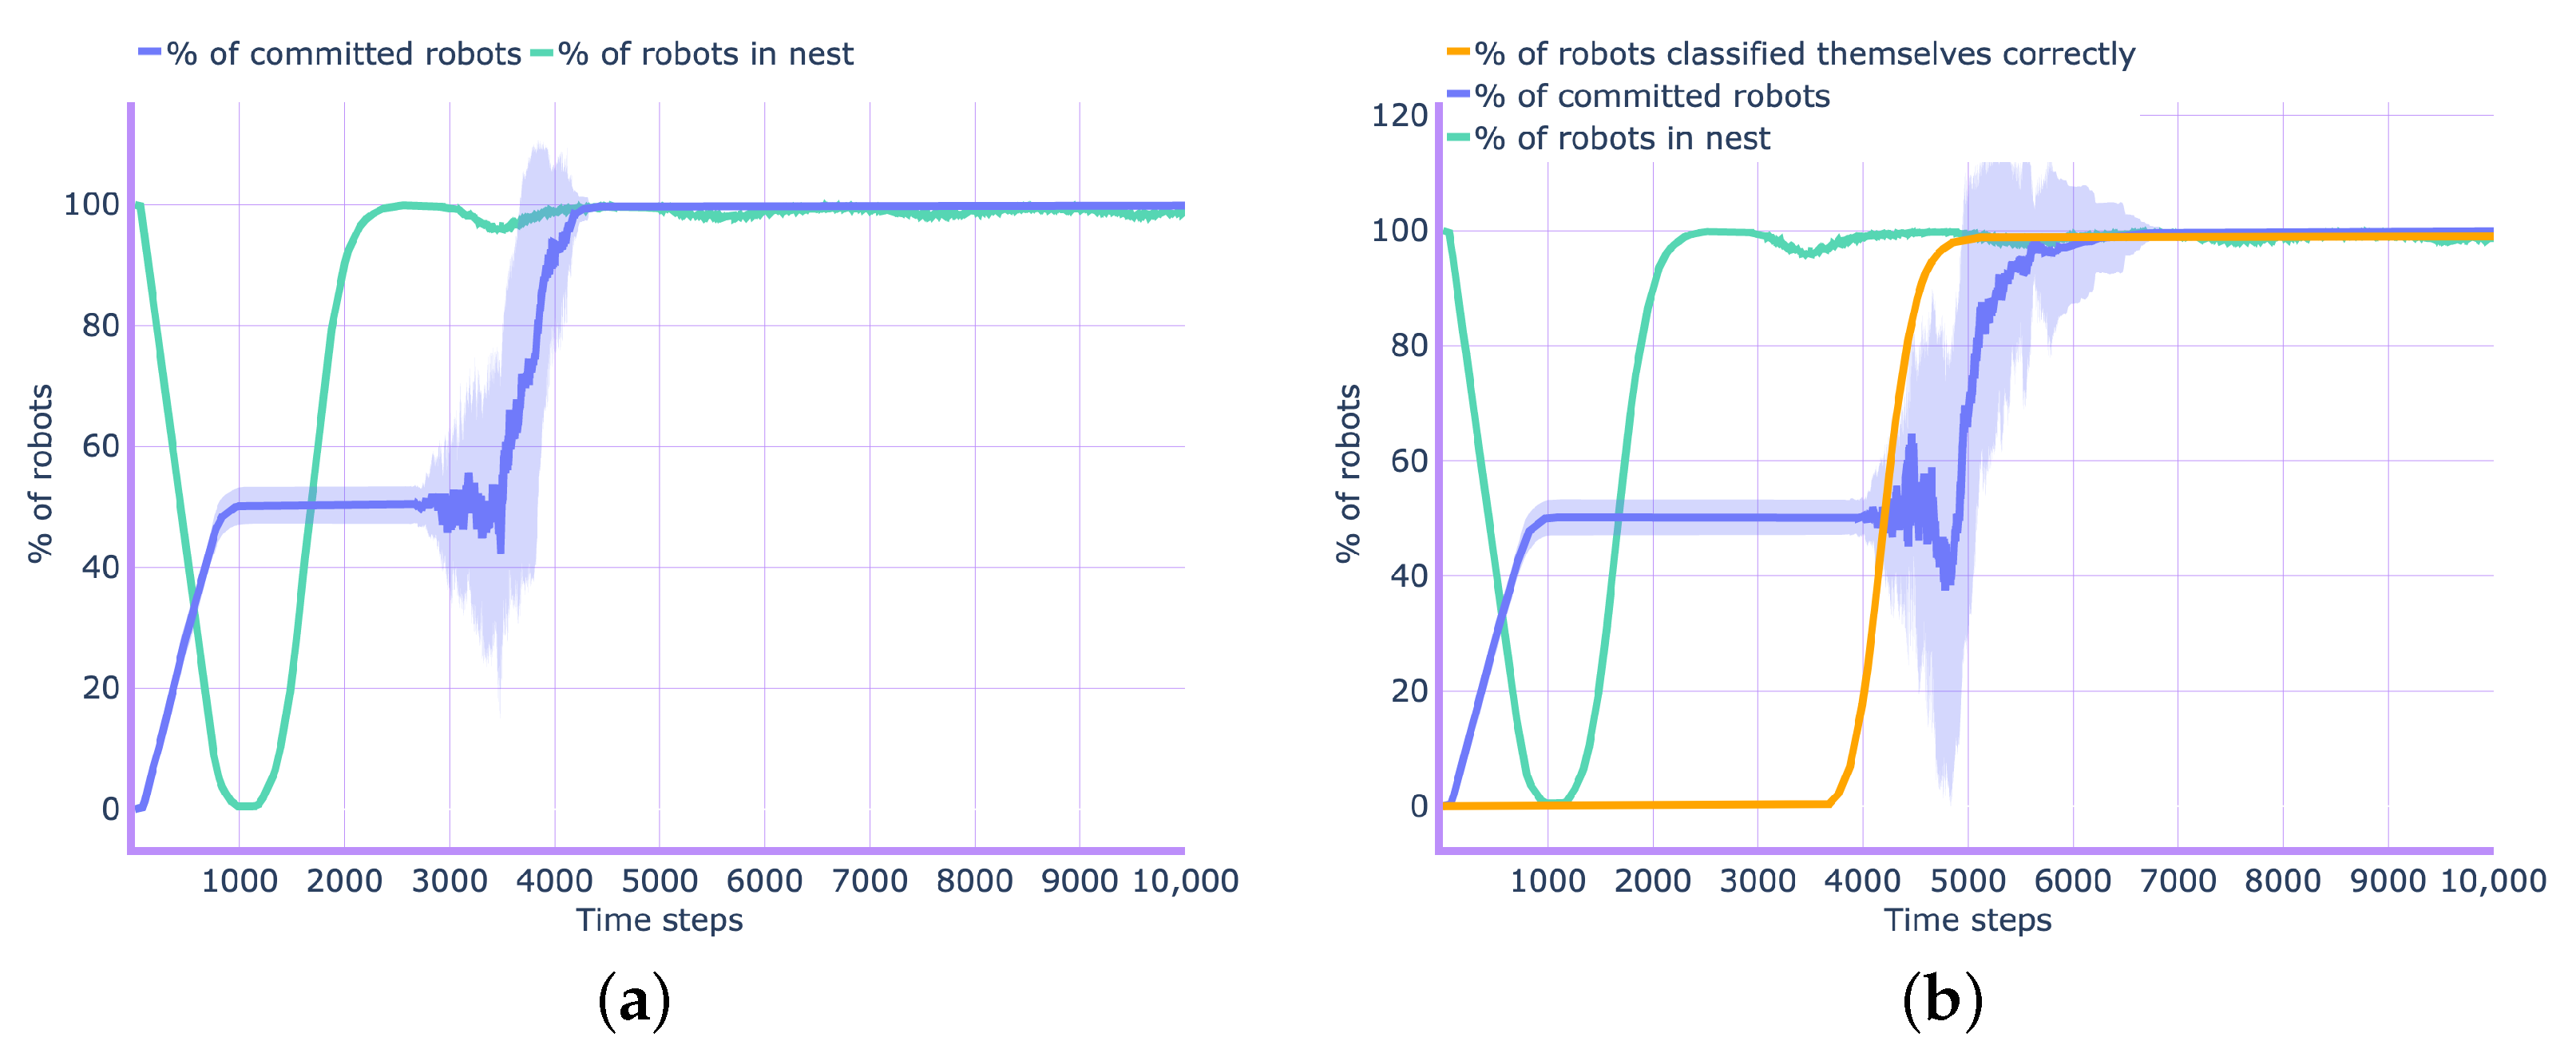
For this set of experiments, we select the swarm size of 210 robots. Figure 4 depicts the evolution of collective decision over time for the configuration of equal populations—i.e., . In Figure 4a, we show the results when the basic behavioral model is applied, while in Figure 4b, we show the results when the distance-based algorithm for robot classification is used (when the extended model is applied). We select the distance-based algorithm as it is the one with the highest performance in terms of classification accuracy for most swarm configurations. When using the distance-based algorithm, the opinions exchanged are weighed based on the robot’s class, i.e., the opinion of a robot that has classified itself as accurate weighs twice higher than an opinion of a robot that has classified itself differently. As we can see from Figure 4a,b, the speed to achieve a consensus drops when applying the distance-based algorithm (approximately 4000 vs. approximately 5500 ts). This is due to the time spent by the robots in the classification phase (see Figure 2). In terms of decision accuracy, the basic behavioral model was able to achieve decision accuracy without exploiting any robot classification, whereas the distance-based algorithm achieved decision accuracy with the help of classifying robots and assigning a higher weight to the opinion of accurate robots.
Next, we examine the accuracy of the collective decision for different compositions of the swarm of 210 robot. The results are reported in Table 3 as the percentage at which the swarm committed to any of the two sites. Site B (green) has a higher quality value than site A (red), as we can see in Table 1. As we can notice from the results summarized in Table 3, for both the basic behavioral model and the distance-based algorithm, the swarm converges on the site with the highest quality value (i.e., site B) in one of the following cases: (a) the overestimating population is absent; hence, no robots will overshoot the quality value of site A and, therefore, site B, which has in fact a higher quality value that dominates. (b) The overestimating population is smaller than the summation of the underestimating and the accurate populations. In such cases, the decision accuracy drops in comparison to (a); however, it stays above for both approaches (with and without classification). For the cases that we tested and where the overestimating population is larger than the summation of the underestimating and accurate populations, the distance-based algorithm outperformed the basic behavioral model in terms of decision accuracy and stays about .
5.2.2. Experiments Set II
In this set of experiments, we allow measurement errors to occur at both sites (A and B)—i.e., a robot belongs to a particular population e.g., the overestimating population will overestimate the quality value of any site it visits during its exploration trip.
Figure 5 depicts the evolution of collective decision over time for the configuration of equal populations—i.e., . In Figure 5a, we show the results when the basic behavioral model is applied, while in Figure 5b, we show the results when the distance-based algorithm for robot classification is used (when the extended model is applied). As we can observe, the difference is minor between these results and the ones obtained when measurement errors were allowed only at site A. One remarkable difference (especially in the case (a) of the basic model) is a smaller standard deviation around the number of committed robots. This results from enabling the entire swarm to measure with errors, hence contributing to a larger sample of the random variable—i.e., the quality measure. Another difference is the faster convergence time of the collective decision in comparison to the case when errors were allowed only at site B only. Similarly, the speed to achieve a consensus drops when applying the distance-based algorithm due to the time spent by the robots in the classification phase. In terms of decision accuracy, the basic behavioral model was able to achieve decision accuracy without exploiting any robot classification, whereas the distance-based algorithm achieved only decision accuracy.
Next, we examine the accuracy of the collective decision for different compositions of the swarm of 210 robot. The results are reported in Table 4 as the percentage at which the swarm committed to any of the two sites. Different from the case where the measurement errors were only enabled at site A (red), when these are allowed at both sites, the results summarized in Table 4 show an improvement in the decision accuracy for similar population compositions. The improvement is observed particularly when using the basic behavioral model. This counterintuitive result can be explained as the population evaluating site A splits into overestimating, underestimating, and accurate instead of only accurate. Hence, both the parts of accurate and underestimating will reinforce the commitment to site B instead of site A, contributing to the shift of the collective decision to the higher-in-quality site—i.e., site B.
Finally, our results show a high sensitivity of the distance-based algorithm to parameter . is used as a lower-bound of number of interactions, above which a non-accurate robot starts to classify itself as accurate. In order to illustrate the role of parameter , we run the decision experiment after disabling the use of this parameter. Consequently, overestimating and underestimating robots do not have the chance to classify themselves as accurate at any time of the experiment. Furthermore, opinions of overestimating or underestimating robots are weighted by zero, and only opinions of robots who have classified themselves as accurate are considered. In order to be able to apply this approach, we need the accuracy of the classification to be high enough. Therefore, we consider the population composition of as the classification accuracy for this composition using the distance-based algorithm as (see Table 2). Our results show an increase in the accuracy of the swarm decision from of , revealing the critical role of the parameter in spreading inaccurate measurements across the swarm.
6. Conclusions
In this study, we have investigated the emergence of collective decisions in best-of-N problems, when robots are subject to perception errors. Most works which investigated best-of-N decisions in robot swarms assumed robots to perform accurate quality measurements of the available options. Nevertheless, reality diverges from this assumption as real robots are mostly associated with perception errors. Taking that into consideration, we have proposed three algorithms to help robots classify themselves into one of the three populations: overestimating, underestimating, and accurate. These populations can be mapped to robots in real scenarios with high-quality sensors vs. low-quality sensors. The algorithms we have exploited are as follows: (i) the distance-based algorithm, (ii) the k-means algorithm, and density-based algorithm for discovering clusters (DBSCAN).
We have compared the performance of the three algorithms in terms of their classification accuracy using different swarm sizes and various population compositions. Our results showed that classification accuracy drops with decreasing swarm size; also, for a specific size, the different population compositions play a key role in the resultant classification accuracy. In general, the distance-based algorithm performed best in regards to classification accuracy across the different swarm sizes and compositions.
After testing the classification accuracy of the three algorithms, we selected the best-performing algorithm and tested the accuracy of the collective decision when using classification (the distance-based algorithm) vs. no classification (the basic behavioral model). We have examined the decision accuracy for two cases: (a) measurement errors can occur at one site (here site B), and (b) measurement errors can occur at both sites A and B. When measurement errors are allowed at site B only (the site with the highest quality value), overestimating robots or accurate robots need to represent the majority of the swarm to converge with a high likelihood at the best option (i.e., site B). Moreover, using the distance-based algorithms by the robots to classify themselves results in a higher decision accuracy than when no classification is used. For the case where measurement errors were allowed at both sites, using the distance-based classification algorithm drops the decision accuracy below the one resulting from the basic behavioral model. These counterintuitive results can be explained as the population evaluating site A splits into overestimating, underestimating, and accurate instead of only accurate. Hence, both the parts of accurate and underestimating will reinforce the commitment to site B instead of site A, contributing to the shift of the collective decision to the higher-in-quality site. Our study sheds light on the realistic assumption of measurement errors while the robots evaluate their environment to make best-of-N decisions.
Funding
This research received no external funding.
Institutional Review Board Statement
Not applicable.
Informed Consent Statement
Not applicable.
Data Availability Statement
Not applicable.
Acknowledgments
The authors would like to thank Mathias Annot for his contribution to the first versions of this work and the help with setting up the experiments.
Conflicts of Interest
The author declares no conflict of interest.
References
- Seeley, T.D. Honeybee Democracy; Princeton University Press: Princeton, NJ, USA, 2010. [Google Scholar]
- Sasaki, T.; Pratt, S.C. Groups have a larger cognitive capacity than individuals. Curr. Biol. 2012, 22, R827–R829. [Google Scholar] [CrossRef] [PubMed] [Green Version]
- Couzin, I.D.; Ioannou, C.C.; Demirel, G.; Gross, T.; Torney, C.J.; Hartnett, A.; Conradt, L.; Levin, S.A.; Leonard, N.E. Uninformed individuals promote democratic consensus in animal groups. Science 2011, 334, 1578–1580. [Google Scholar] [CrossRef] [PubMed] [Green Version]
- Bose, T.; Reina, A.; Marshall, J.A. Collective decision-making. Curr. Opin. Behav. Sci. 2017, 16, 30–34. [Google Scholar] [CrossRef] [Green Version]
- Rausch, I.; Reina, A.; Simoens, P.; Khaluf, Y. Coherent collective behaviour emerging from decentralised balancing of social feedback and noise. Swarm Intell. 2019, 13, 321–345. [Google Scholar] [CrossRef]
- Valentini, G.; Brambilla, D.; Hamann, H.; Dorigo, M. Collective perception of environmental features in a robot swarm. In Proceedings of the International Conference on Swarm Intelligence, Brussels, Belgium, 7–9 September 2016; Springer: Berlin/Heidelberg, Germany, 2016; pp. 65–76. [Google Scholar]
- Bogacz, R.; Brown, E.; Moehlis, J.; Holmes, P.; Cohen, J.D. The physics of optimal decision making: A formal analysis of models of performance in two-alternative forced-choice tasks. Psychol. Rev. 2006, 113, 700. [Google Scholar] [CrossRef] [PubMed]
- Heitz, R.P. The speed-accuracy tradeoff: History, physiology, methodology, and behavior. Front. Neurosci. 2014, 8, 150. [Google Scholar] [CrossRef] [Green Version]
- Pais, D.; Hogan, P.M.; Schlegel, T.; Franks, N.R.; Leonard, N.E.; Marshall, J.A. A mechanism for value-sensitive decision-making. PLoS ONE 2013, 8, e73216. [Google Scholar] [CrossRef] [PubMed] [Green Version]
- Nauta, J.; Simoens, P.; Khaluf, Y. Group size and resource fractality drive multimodal search strategies: A quantitative analysis on group foraging. Phys. A Stat. Mech. Its Appl. 2022, 590, 126702. [Google Scholar] [CrossRef]
- Valentini, G.; Ferrante, E.; Dorigo, M. The best-of-n problem in robot swarms: Formalization, state of the art, and novel perspectives. Front. Robot. AI 2017, 4, 9. [Google Scholar] [CrossRef] [Green Version]
- Lee, C.; Lawry, J.; Winfield, A. Negative updating combined with opinion pooling in the best-of-n problem in swarm robotics. In Proceedings of the International Conference on Swarm Intelligence, Rome, Italy, 29–31 October 2018; Springer: Berlin/Heidelberg, Germany, 2018; pp. 97–108. [Google Scholar]
- Strobel, V.; Castelló Ferrer, E.; Dorigo, M. Managing Byzantine Robots via Blockchain Technology in a Swarm Robotics Collective Decision Making Scenario. 2018. Available online: http://hdl.handle.net/1721.1/115883 (accessed on 25 May 2018).
- Reina, A.; Marshall, J.A.; Trianni, V.; Bose, T. Model of the best-of-N nest-site selection process in honeybees. Phys. Rev. E 2017, 95, 052411. [Google Scholar] [CrossRef] [PubMed] [Green Version]
- Ebert, J.T.; Gauci, M.; Mallmann-Trenn, F.; Nagpal, R. Bayes bots: Collective Bayesian decision-making in decentralized robot swarms. In Proceedings of the 2020 IEEE International Conference on Robotics and Automation (ICRA), Paris, France, 31 May–31 August 2020; pp. 7186–7192. [Google Scholar]
- Rausch, I.; Khaluf, Y.; Simoens, P. Collective decision-making on triadic graphs. In Complex Networks XI: Proceedings of the 11th Conference on Complex Networks CompleNet 2020; Springer: Berlin/Heidelberg, Germany, 2020; pp. 119–130. [Google Scholar]
- Khaluf, Y.; Simoens, P. Collective sampling of environmental features under limited sampling budget. J. Comput. Sci. 2019, 31, 95–110. [Google Scholar] [CrossRef]
- Khaluf, Y.; Simoens, P.; Hamann, H. The neglected pieces of designing collective decision-making processes. Front. Robot. AI 2019, 6, 16. [Google Scholar] [CrossRef] [PubMed] [Green Version]
- Canciani, F.; Talamali, M.S.; Marshall, J.A.; Bose, T.; Reina, A. Keep calm and vote on: Swarm resiliency in collective decision making. In Proceedings of the Workshop Resilient Robot Teams of the 2019 IEEE International Conference on Robotics and Automation (ICRA 2019), Montreal, QC, Canada, 20–24 May 2019; p. 4. [Google Scholar]
- Khaluf, Y.; Hamann, H. Modulating interaction times in an artificial society of robots. In Proceedings of the Conference on Artificial Life (ALIFE)-How Can Artificial Life Help Solve Societal Challenges? Newcastle upon Tyne, UK, 29 July–2 August 2019; MIT: Cambridge, MA, USA, 2019; pp. 372–379. [Google Scholar]
- Khaluf, Y.; Rausch, I.; Simoens, P. The impact of interaction models on the coherence of collective decision-making: A case study with simulated locusts. In Proceedings of the International Conference on Swarm Intelligence, Rome, Italy, 29–31 October 2018; Springer: Berlin/Heidelberg, Germany, 2018; pp. 252–263. [Google Scholar]
- Nauta, J.; Simoens, P.; Khaluf, Y. Memory Induced Aggregation in Collective Foraging. In Proceedings of the International Conference on Swarm Intelligence, Barcelona, Spain, 26–28 October 2020; Springer: Berlin/Heidelberg, Germany, 2020; pp. 176–189. [Google Scholar]
- Hartigan, J.A.; Wong, M.A. Algorithm AS 136: A k-means clustering algorithm. J. R. Stat. Soc. Ser. C (Appl. Stat.) 1979, 28, 100–108. [Google Scholar] [CrossRef]
- Ester, M.; Kriegel, H.P.; Sander, J.; Xu, X. A density-based algorithm for discovering clusters in large spatial databases with noise. In Proceedings of the KDD’96: Second International Conference on Knowledge Discovery and Data Mining, Portland, OR, USA, 2–4 August 1996; Volume 96, pp. 226–231. [Google Scholar]
- Nauta, J.; Van Havermaet, S.; Simoens, P.; Khaluf, Y. Enhanced foraging in robot swarms using collective Lévy walks. In Proceedings of the ECAI2020, the 24th European Conference on Artificial Intelligence, Online, 29 August–8 September 2020; Volume 325. [Google Scholar]
Figure 1.
Robot’s behavior described as a finite state machine.

Figure 2.
The extended robot’s behavioral model described as a finite state machine.

Figure 3.
Snapshot of the site selection arena in ARGoS environment.

Figure 4.
The emergence of the collective decision: (a) when robots follow the basic behavioral model and (b) when robots classify themselves using the distance-based algorithm. We simulate a swarm of 70 objective, 70 underestimating, and 70 overestimating robots. Errors in measurements can occur at site A (red) only.

Figure 5.
The emergence of collective decision: (a) when robots follow the basic behavioral model, and (b) when robots classify themselves using the distance-based algorithm. We simulate a swarm of the following: 70 objective, 70 underestimating, and 70 overestimating robots, where Errors in measurements can occur at both sites A and B.


Table 1.
The selected parameter values for both the basic and extended behavioral models.
| mean of quality value of site A | ||
| mean of quality value of site B | ||
| standard deviation of quality value of sites A and B | ||
| robot’s erroneous parameter for sites A and B | ||
| minimum number of robot’s on-site measurements | 50 | |
| parameter used to differentiate between a symmetric and a non-symmetric decision | 50 | |
| minimum number of neighbors required by the robot to update its opinion | 5 | |
| period used to mix up robots in nest after exploration and before dissemination | 1250 ts | |
| period used to collect data by the robots as input for their classification algorithm | 1250 ts | |
| a robot’s interaction threshold after which robots from any population shift their classification to accurate | 50 |
Table 2.
The different swarm sizes and population configurations used to examine the classification accuracy of the three proposed algorithms.
Table 2.
The different swarm sizes and population configurations used to examine the classification accuracy of the three proposed algorithms.
| Swarm Size | Population Composition | Distance-Based | k-Means | DBSCAN |
|---|---|---|---|---|
| 70 A, 70 U, 70 O | ||||
| 90 A, 90 U, 30 O | ||||
| 90 A, 30 U, 90 O | ||||
| 30 A, 90 U, 90 O | ||||
| 210 robots | 105 A, 105 U, 0 O | |||
| 105 A, 0 U, 105 O | ||||
| 0 A, 105 U, 105 O | ||||
| 210 A, 0 U, 0 O | ||||
| 0 A, 210 U, 0 O | ||||
| 0 A, 0 U, 210 O | ||||
| 150 robots | 50 A, 50 U, 50 O | |||
| 90 robots | 30 A, 30 U, 30 O | |||
| 30 robots | 10 A, 10 U, 10 O |
Table 3.
Comparing the accuracy of consensus accuracy when using the basic behavioral model vs. the distance-based algorithm for different swarm compositions. Errors in measurements can occur only at site A (red).
Table 3.
Comparing the accuracy of consensus accuracy when using the basic behavioral model vs. the distance-based algorithm for different swarm compositions. Errors in measurements can occur only at site A (red).
| Population Composition | Basic Model | Distance-Based Algorithm | ||
|---|---|---|---|---|
| % Site A | % Site B | % Site A | % Site B | |
| 105 A, 105 U, 0 O | 0% | 100% | 0% | 100% |
| 210 A, 0 U, 0 O | 0% | 100% | 0% | 100% |
| 0 A, 210 U, 0 O | 0% | 100% | 0% | 100% |
| 30 A, 120 U, 60 O | 30% | 70% | 46% | 54% |
| 70 A, 70 U, 70 O | 33.33% | 66.67% | 23% | 77% |
| 60 A, 120 U, 30 O | 43% | 57% | 50% | 50% |
| 105 A, 0 U, 105 O | 46% | 54% | 50% | 50% |
| 90 A, 90 U, 30 O | 46.66% | 53.34% | 26% | 74% |
| 60 A, 30 U, 120 O | 53% | 47% | 40% | 60% |
| 0 A, 105 U, 105 O | 73% | 27% | 46% | 54% |
Table 4.
Comparing the accuracy of consensus accuracy when using the basic behavioral model vs. the distance-based algorithm for different swarm compositions. Errors in measurements can occur at both sites A and B.
Table 4.
Comparing the accuracy of consensus accuracy when using the basic behavioral model vs. the distance-based algorithm for different swarm compositions. Errors in measurements can occur at both sites A and B.
| Population Composition | Basic Model | Distance-Based Algorithm | ||
|---|---|---|---|---|
| % Site A | % Site B | % Site A | % Site B | |
| 105 A, 105 U, 0 O | 7% | 93% | 16% | 84% |
| 210 A, 0 U, 0 O | 0% | 100% | 0% | 100% |
| 0 A, 210 U, 0 O | 0% | 100% | 0% | 100% |
| 30 A, 120 U, 60 O | 33% | 67% | 63% | 37% |
| 70 A, 70 U, 70 O | 36% | 64% | 40% | 60% |
| 60 A, 120 U, 30 O | 23% | 77% | 53% | 47% |
| 105 A, 0 U, 105 O | 7% | 93% | 33% | 67% |
| 90 A, 90 U, 30 O | 57% | 43% | 46% | 54% |
| 60 A, 30 U, 120 O | 20% | 80% | 30% | 70% |
| 0 A, 105 U, 105 O | 47% | 53% | 60% | 40% |
Publisher’s Note: MDPI stays neutral with regard to jurisdictional claims in published maps and institutional affiliations. |
© 2022 by the author. Licensee MDPI, Basel, Switzerland. This article is an open access article distributed under the terms and conditions of the Creative Commons Attribution (CC BY) license (https://creativecommons.org/licenses/by/4.0/).
Share and Cite
MDPI and ACS Style
Khaluf, Y. Robot Swarms Decide under Perception Errors in Best-of-N Problems. Appl. Sci. 2022, 12, 2975. https://doi.org/10.3390/app12062975
AMA Style
Khaluf Y. Robot Swarms Decide under Perception Errors in Best-of-N Problems. Applied Sciences. 2022; 12(6):2975. https://doi.org/10.3390/app12062975
Chicago/Turabian StyleKhaluf, Yara. 2022. "Robot Swarms Decide under Perception Errors in Best-of-N Problems" Applied Sciences 12, no. 6: 2975. https://doi.org/10.3390/app12062975
Note that from the first issue of 2016, this journal uses article numbers instead of page numbers. See further details here.