Article

Health Risk from Toxic Metals in Wild Rice Grown in Copper Mining-Impacted Sediments

1
West Orange High School, West Orange, NJ 07052, USA
2
Department of Civil, Environmental and Ocean Engineering, Stevens Institute of Technology, Hoboken, NJ 07030, USA
3
Department of Biological Sciences, Michigan Technological University, Houghton, MI 49931, USA
*
Author to whom correspondence should be addressed.
Appl. Sci. 2022, 12(6), 2937; https://doi.org/10.3390/app12062937
Submission received: 11 February 2022 / Revised: 11 March 2022 / Accepted: 11 March 2022 / Published: 13 March 2022
(This article belongs to the Section Environmental Sciences)

Abstract

:
Northern wild rice is of great dietary and cultural importance to the Native American population in the Upper Peninsula of Michigan. Millions of tons of mine tailings were discharged into Lake Superior and other inland lakes during the copper mining boom in the early 20th century in this area. This includes L’Anse Bay, located within the Keweenaw Bay Indian Community (KBIC) reservation. Since wild rice restoration is being encouraged by the KBIC, we investigated the distribution of toxic metals in sediments, water, and wild rice and their potential impact on human health from two locations. Sand Point sloughs on L’Anse Bay and a nearby inland lake, Lake Plumbago, were sampled for sediment, water, and wild rice, and the potential human health risk from dietary exposure to toxic metals in wild rice was assessed. Arsenic stood out as the element that had the highest bioaccumulation at both locations. Risk calculations showed that the hazard index (HI) value for wild rice seeds from both sites was high. Data indicate both carcinogenic and non-carcinogenic risks for As from wild rice in Sand Point sloughs and Lake Plumbago, and carcinogenic risks for Cd and Cr at Lake Plumbago.

1. Introduction

Northern wild rice (Zizania palustris L.) is a native wetland grass that grows in abundance in the Great Lakes region of North America [1]. Wild rice is known for its nutritional value due to its high protein content, in addition to minerals, vitamins, and antioxidants [2]. Wild rice is of great cultural significance to many Native American tribes, who are said to have settled in the Great Lakes region because of its wide distribution along the coast of the Great Lakes, other inland lakes, rivers, and sloughs. Wild rice was a major component of the diet of the native people in this region. Besides its economic and cultural importance, wild rice played an important ecological role in wetlands as a food source for several wildlife species [3].
However, wild rice beds have declined over time. Wild rice requires shallow, clear water to grow and a hard freeze during winter for the seeds to germinate in spring. Logging and mining activities resulted in the establishment of river dams, dredging, and draining of the wetlands [1]. In addition, nutrient run-off, flooding, invasive weeds, and climate change have continued to impact wild rice beds. The increasing number of extreme weather events occurring in this region could also be impacting wild rice yields.
In the late 19th and early 20th centuries, the Upper Peninsula of Michigan was a major center for copper mining, generating millions of tons of mine tailings called stamp sands [4]. These metal-rich tailings were discharged into the shores of Lake Superior and other inland lakes in the region, severely impacting the aquatic ecosystem. These tailings produced a 10 to 90 km halo of metal-enriched sediments around the Keweenaw Peninsula, extending into Lake Superior [5]. The fine and coarse fractions of stamp sands gradually migrated toward L’Anse Bay, which is located within the L’Anse Indian Reservation and belongs to the Keweenaw Bay Indian Community (KBIC). The stamp sands adversely impacted the benthic organisms and aquatic food webs [5]. Several reports indicated elevated levels of toxic metals including As, Cd, Cd, Cr, Ni, Zn, Pb, and Fe, in addition to Cu, which is the major contaminant [6,7,8].
These toxic metals exist and accumulate in both water and sediment. The suspension of sediment or metals released from sediments can lead to higher concentrations of metals in water systems. Bioaccumulated toxic metals in animals and humans result in detrimental health effects [9]. While the human health impacts of toxic element uptake and accumulation by white rice are widely studied, understanding the uptake and accumulation of metals by wild rice is limited. Nriagu and Lin (1995) used commercially available wild rice in the U.S. to analyze metal content and reported high concentrations of Fe, Cu, and Zn, and moderately elevated levels of Pb, Cd, and As [10]. A similar study reported elevated levels of Pb and Cu in wild rice sold in Canada [11]. Elevated levels of As and Pb were reported in a study carried out using wild rice harvested from various locations in north-central Wisconsin by Bennett et al. 2000 [12]. Since increasing efforts are being made to restore the wild rice beds in the stamp sand-impacted Keweenaw Bay area, it is important to study the distribution of toxic metals in the Keweenaw Bay sediments and wild rice growing on them vis-à-vis their potential impacts on human health. In this study, our objective was to (1) investigate the concentrations of toxic metals in the sediments, porewater, water column, and wild rice grown in the Sand Point sloughs and a nearby inland lake, Lake Plumbago, in the Upper Peninsula of Michigan, where wild rice restoration and harvesting is increasingly being encouraged by the KBIC, and (2) assess the extent of potential human health risk from dietary exposure to the toxic metals in wild rice.

2. Materials and Methods

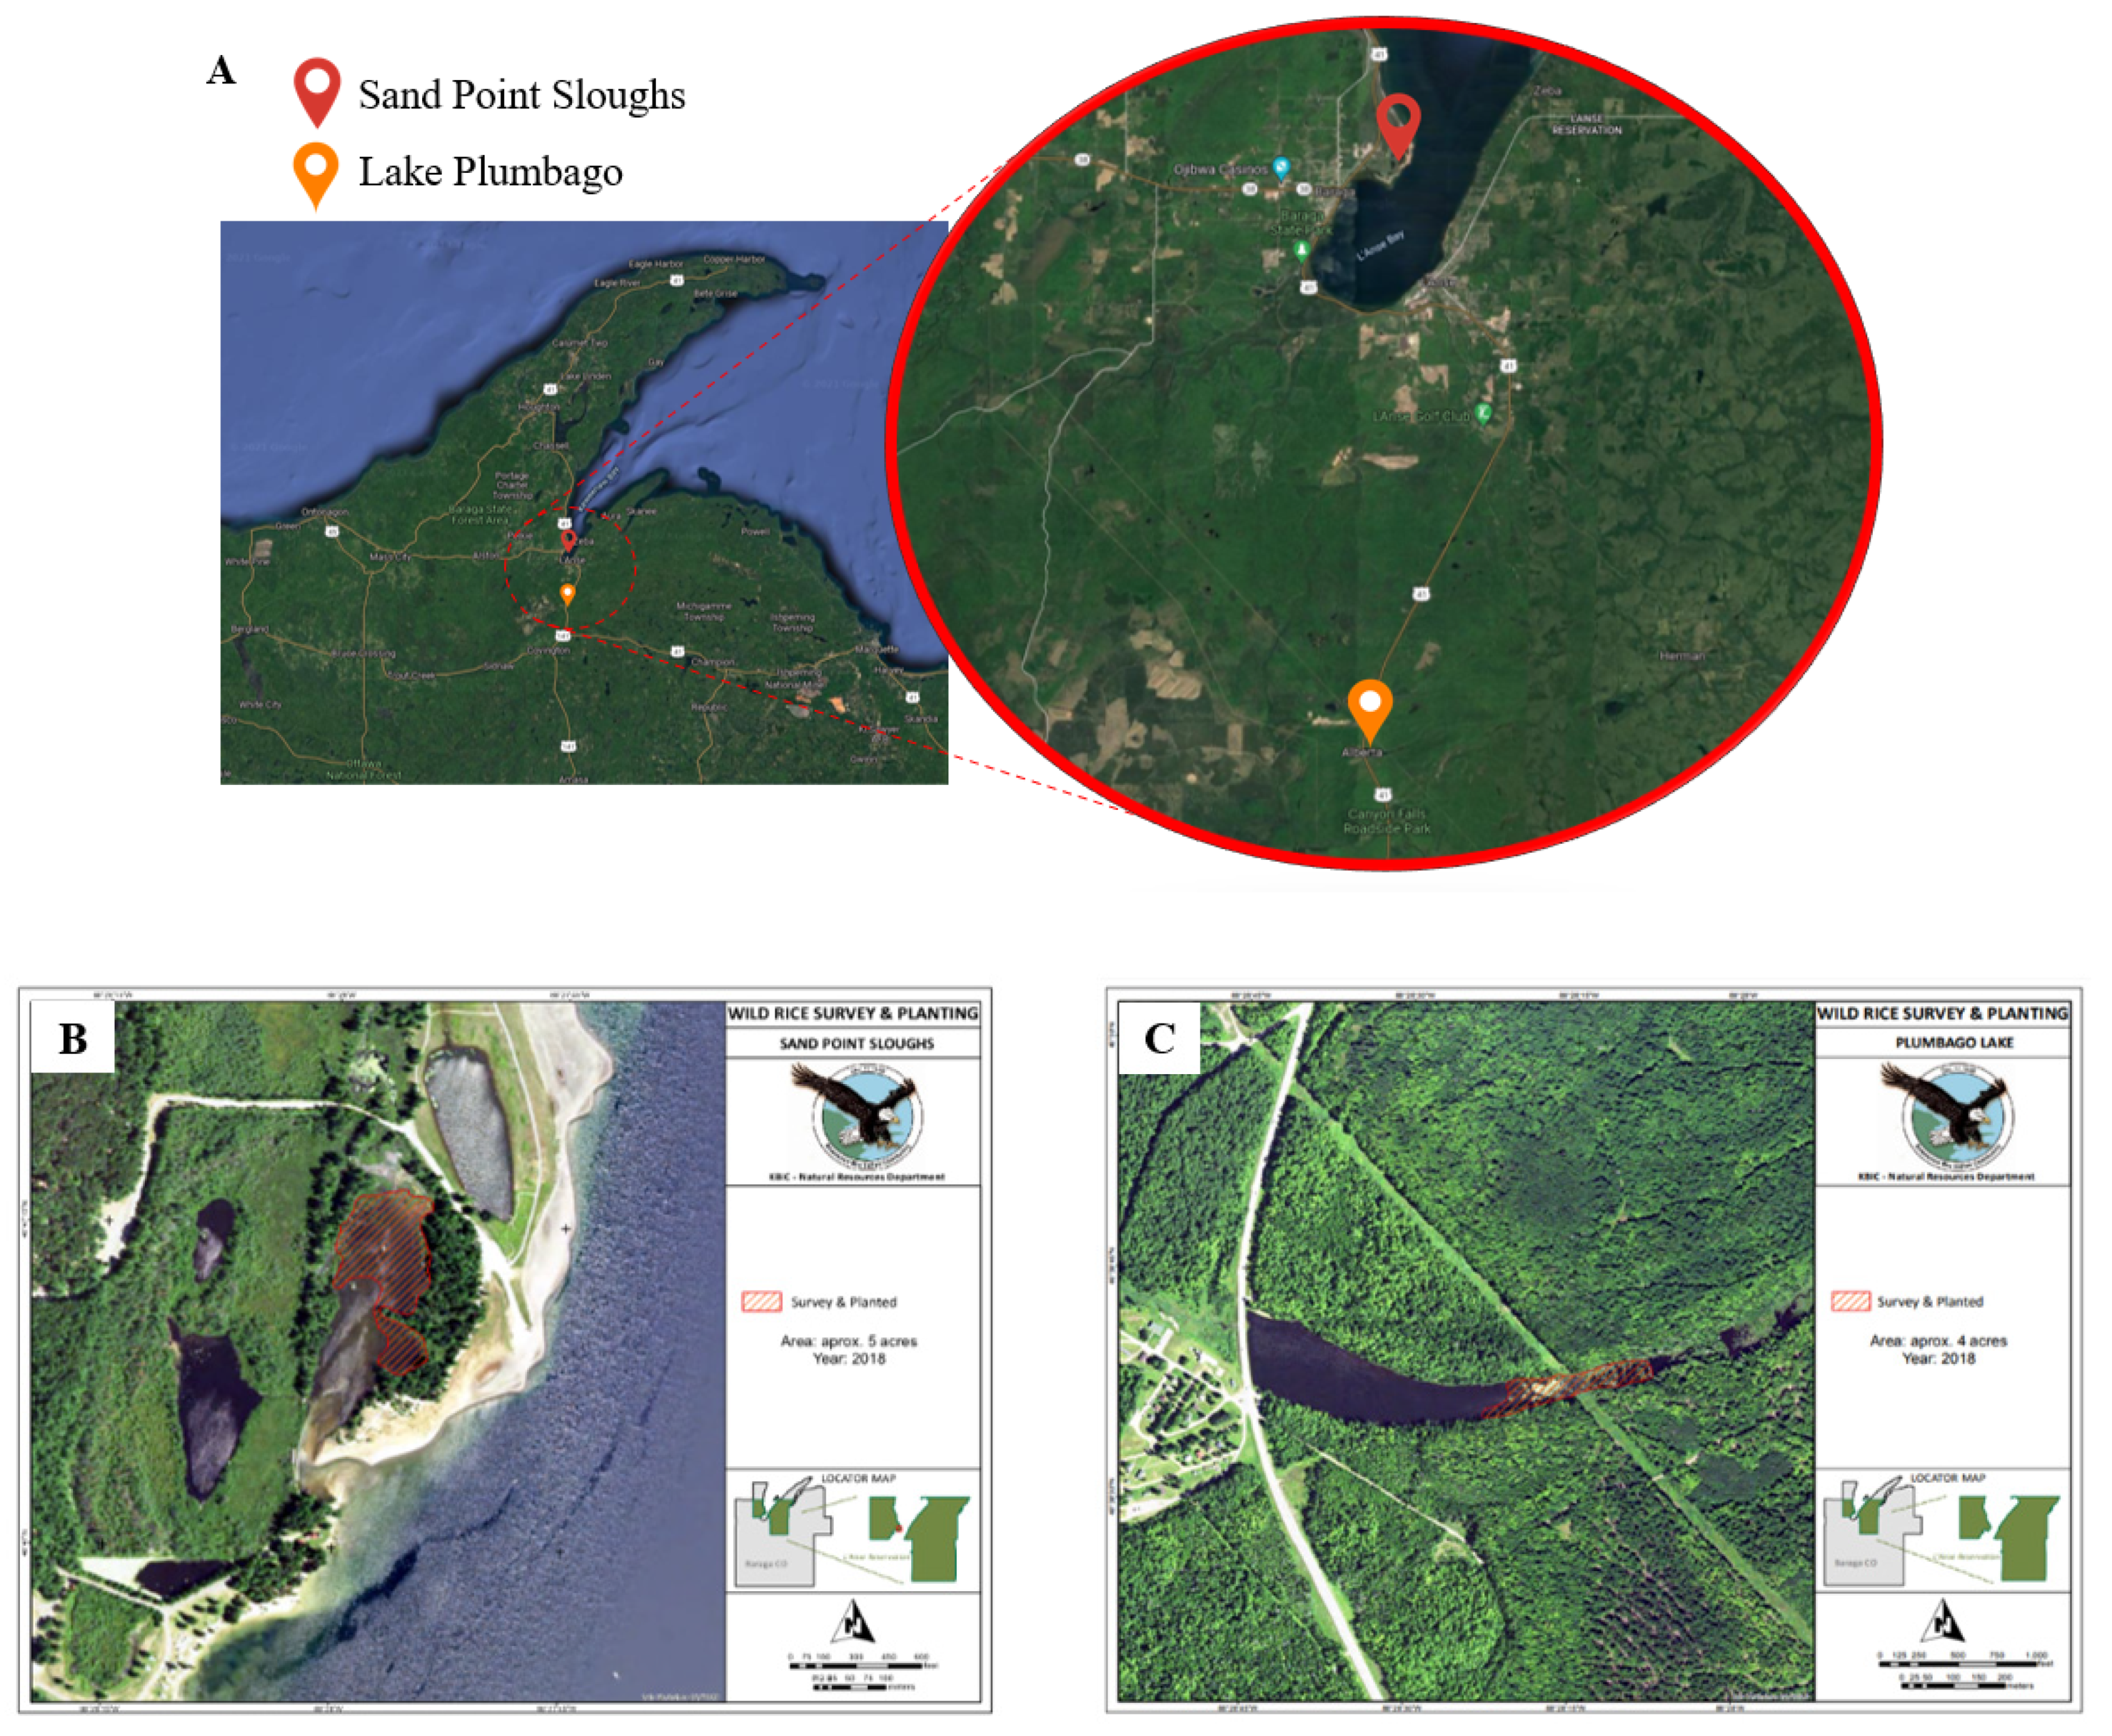
2.1. Sample Collection and Metal Analysis

Surface water, sediment, and wild rice plant samples were collected from two locations, Sand Point Sloughs and Lake Plumbago (Figure 1), an inland lake away from Keweenaw Bay, in July 2021. The sample collection points were decided based on recommendations from the representatives of Keweenaw Bay Indian Community (KBIC). These locations correspond to wild rice harvesting by the Ojibwe community every year. Sand Point sloughs are wetlands on Keweenaw Bay in Lake Superior. Substantial stamp sand deposits were reported to have migrated to Sand Point [13], whereas Lake Plumbago is an inland lake in Alberta, MI that is further from the main stamp sand deposits, hence it is not expected to be contaminated with mine tailings. Nine sediment samples were collected from Sand Point Sloughs and six samples were collected from Lake Plumbago using a sediment corer to a depth of 6 inches. The sediment samples were transported to the lab and refrigerated at 4 °C until analysis. Porewater was collected by centrifuging the sediment samples at 3500× g for 15 min and decanting the supernatant. Nine and six water samples were also collected from the same locations as the sediment samples from the overlying water column at Sand Point and Lake Plumbago, respectively. The water samples were acidified with HNO3 immediately after collection. The samples were placed in ice and transported to the lab, where they were refrigerated at 4 °C. The sediment, water, and pore water samples collected from both locations were combined and analyzed as composite samples.
Wild rice samples were collected from the two locations in September 2021 once the wild rice grains were ripe and ready for harvest. Entire plants were uprooted, cleaned with tap water, followed by deionized water, and dried using paper towels. Roots, shoots, and seeds were separated, weighted, and dried in paper bags for 48 h at 65 °C. The plants were weighed again after they were dry.
Acid-digestion of the sediment, plant, and water samples was carried out using USEPA standard 3050 B method [14]. Following digestion, the samples were analyzed in triplicate using Inductively Coupled Plasma-Optical Emission Spectroscopy (ICP-OES, Agilent Technologies 5100, USA). The Quality Assurance/Quality Control protocols in Soil Sampling Quality Assurance User’s Guide and Acid Digestion of Sediments, Sludges, and Soils were followed for sampling and analysis in this study [14,15]. External commercial ICP metal standard solutions and an internal Yttrium standard were utilized to ensure accuracy of analysis. The concentrations of external standard solutions were set as 0, 0.01, 0.02, 0.05, 0.1, 0.2, 0.5, 1, 2, 5, 10, and 20 mg/L for each metal. The internal Yttrium standard was set as 1 mg/L. The wavelengths used for Al, As, Cd, Co, Cr, Cu, Hg, Mn, Ni, Pb, and Zn in ICP-OES were 396.152, 188.980, 226.502, 238.892, 267.716, 324.754, 184.887, 257.610, 231.604, 220.353, and 213.857 nm, respectively.

2.2. Risk Assessment

2.2.1. Hazard Quotient

Hazard quotient (HQ) is a measure to estimate the non-carcinogenic health risk from exposure to contaminants. The HQ was calculated as per USEPA Region III risk-based concentration table [16]. The following equation was used to estimate the HQ:
H Q = E F × E D × I R × C B W × A T n × R f D × 0.001
where EF is the exposure frequency (365 days/year), ED is the exposure duration (30 years). IR is the ingestion rate of wild rice (350 g/person/day) [17], C is the average elemental concentration in wild rice seeds (mg/kg), BW is the average body weight (70 kg). These figures were used according to USEPA [16], where the average exposure time for non-carcinogens (ATn) is assumed to be 365 days/year for 30 years (10,950 days). The oral reference dose (RfD) values for the metals were obtained from the Integrated Risk Information System (IRIS) [16,18]. The RfD values for As, Cr, Cd, Cu, Hg, and Zn are 0.0003, 0.003, 0.0005, 0.04, 0.0001, and 0.3, respectively.

2.2.2. Hazard Index

Hazard Index (HI) was used to denote the total non-carcinogenic health risk due to exposure to various toxic metals. It was calculated as the sum of HQ of individual metals mentioned above, based using the following equation:
HI = HQ(As) + HQ(Cr) + HQ(Cd) + HQ(Cu) + HQ(Hg) + HQ(Zn)

2.2.3. Target Cancer Risk

Target cancer risk (TR) was used to indicate health risk due to exposure to carcinogenic metals. The estimation for TR was carried out according to USEPA Region III Risk-Based Concentration Table [16] using the following equation:
T R = E F × E D × I R × C B W × A T c × S F × 0.001
where ATc is the average time of carcinogenic exposure (365 days/year for 70 years); ATc = 25,550 days. The carcinogenic slope factor (SF) values were incorporated from USEPA 2011 [16]. Since the SF for As, Cd, and Cr are known, the target cancer risk was estimated for these three metals.

2.3. Data Analysis

The mean and standard deviations for the concentrations of the toxic metals in water, pore water, sediment, and wild rice tissue samples were calculated. The statistical significance of differences in the mean concentration of metals between the two sampling locations was analyzed by performing Tukey–Kramer HSD test using JMP®, Pro 15. SAS Institute Inc., Cary, NC, USA, 1989–2021.

3. Results and Discussion

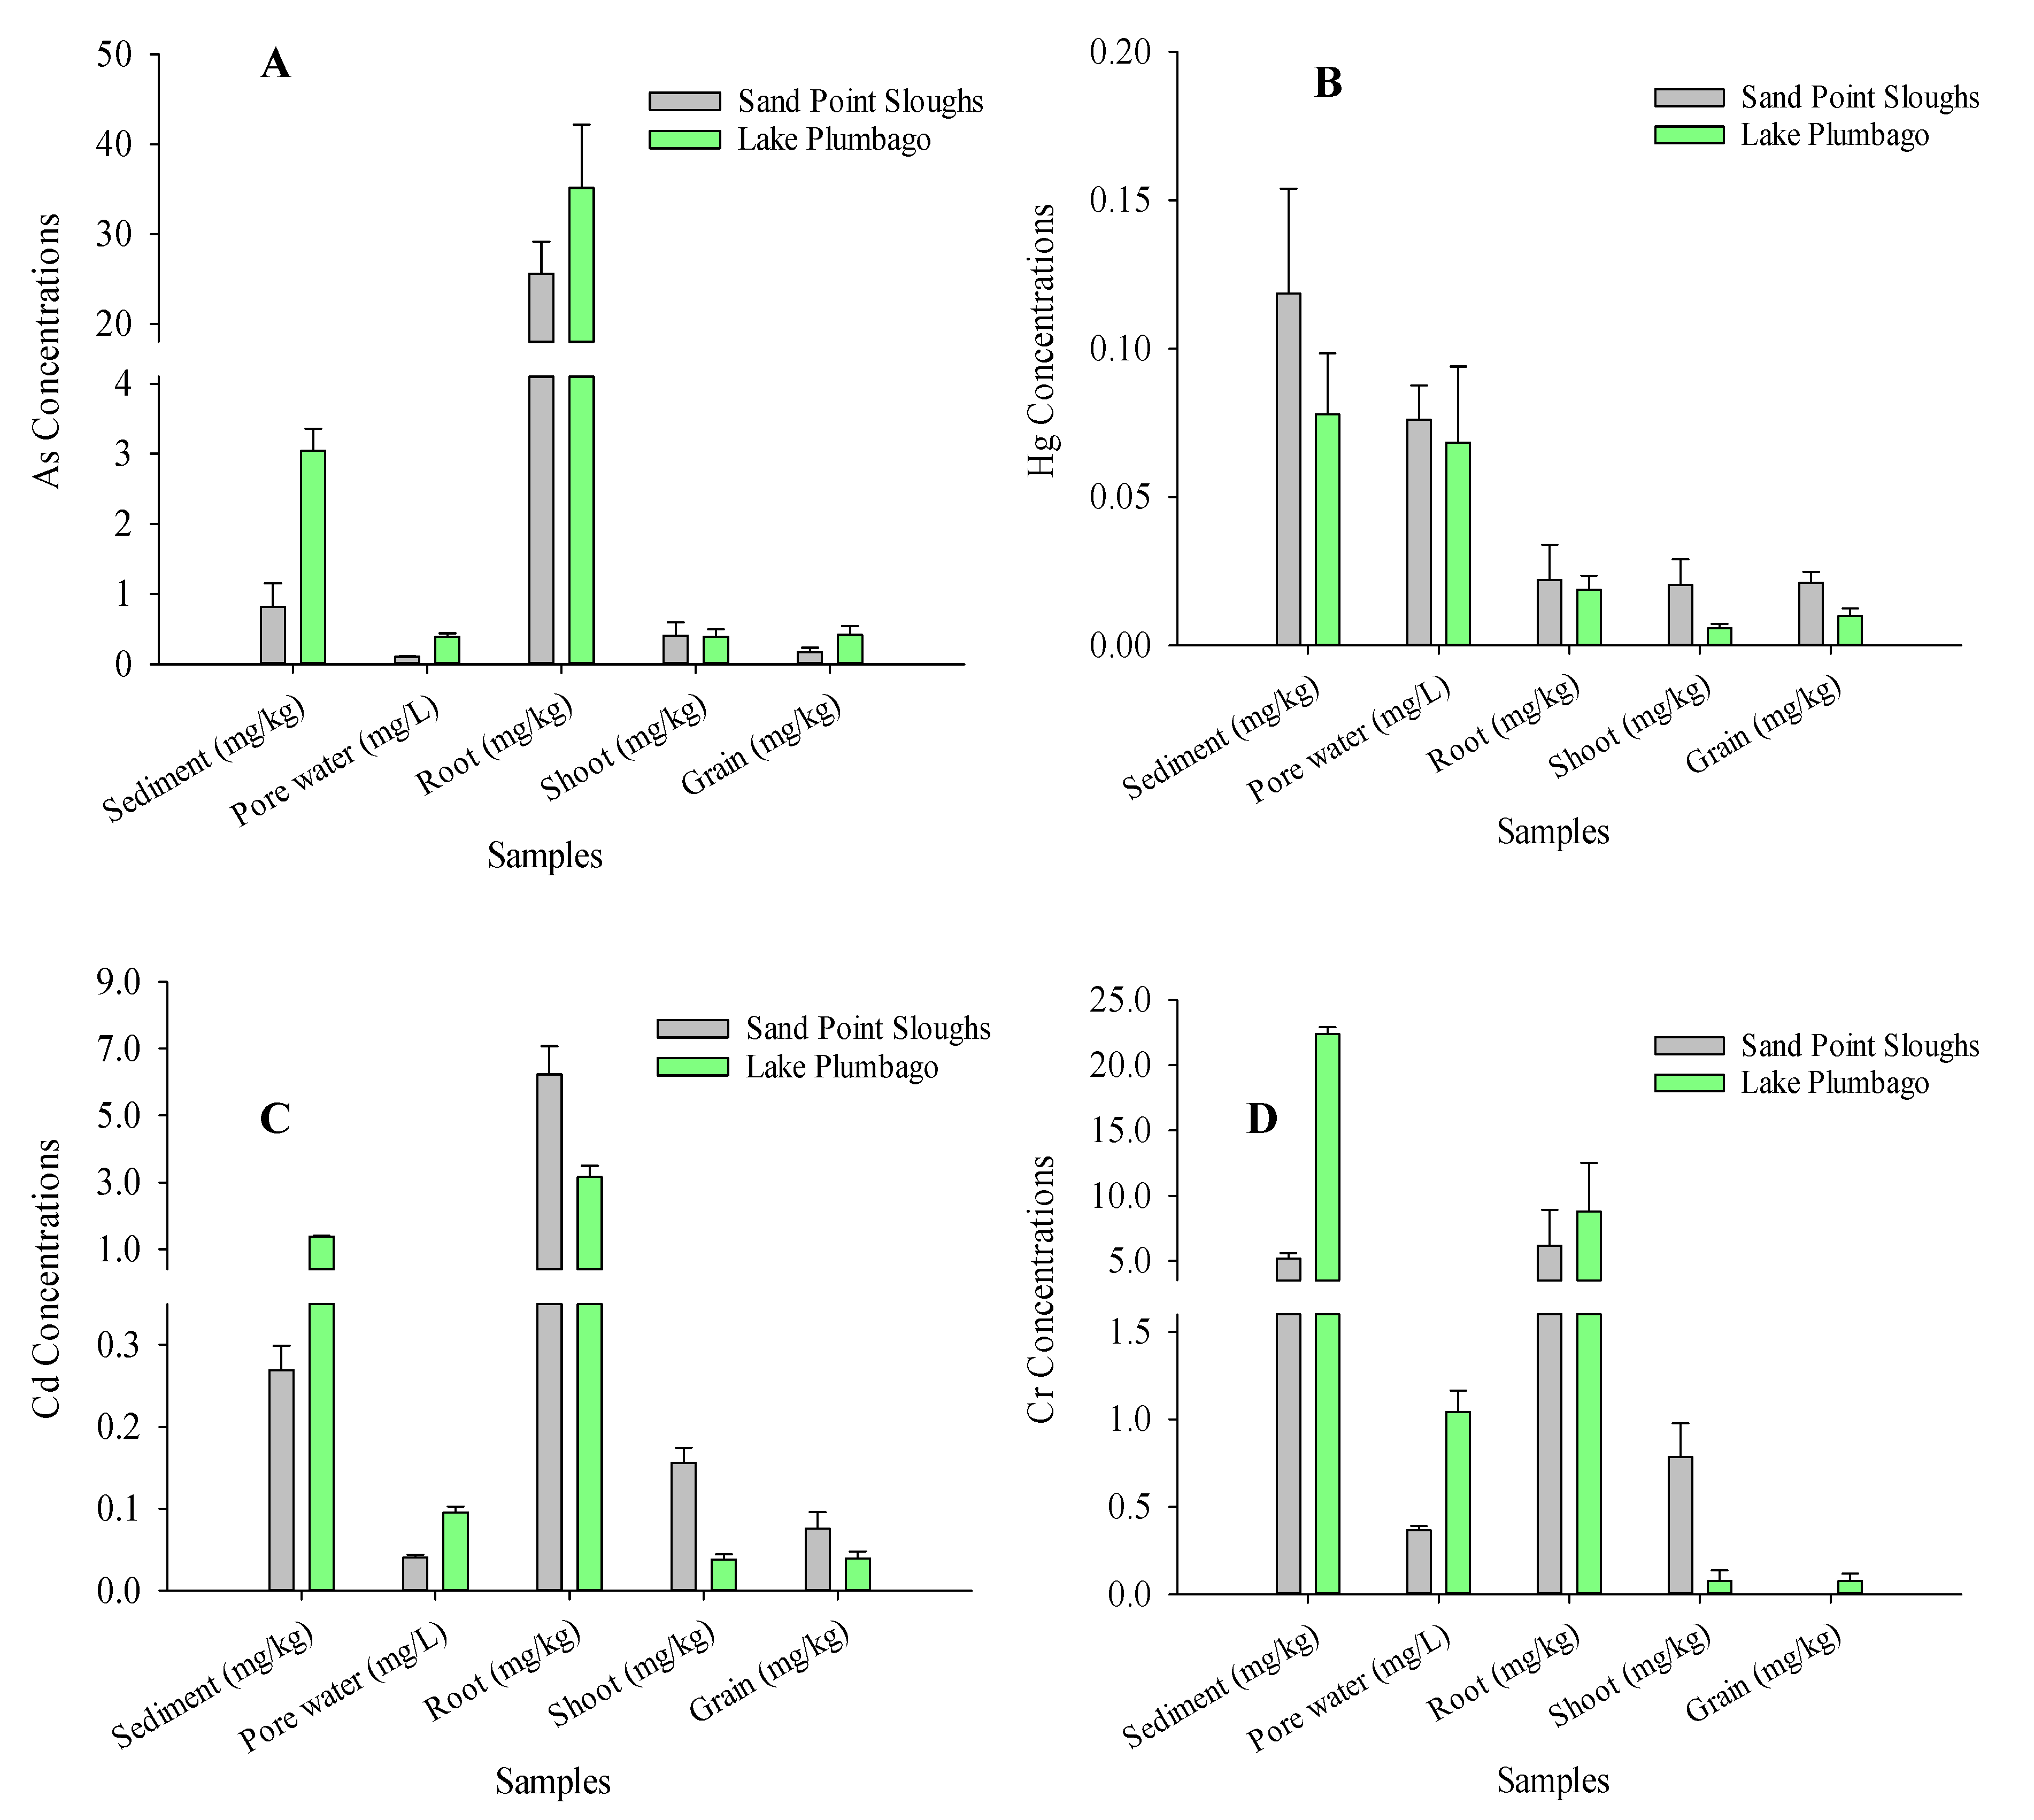
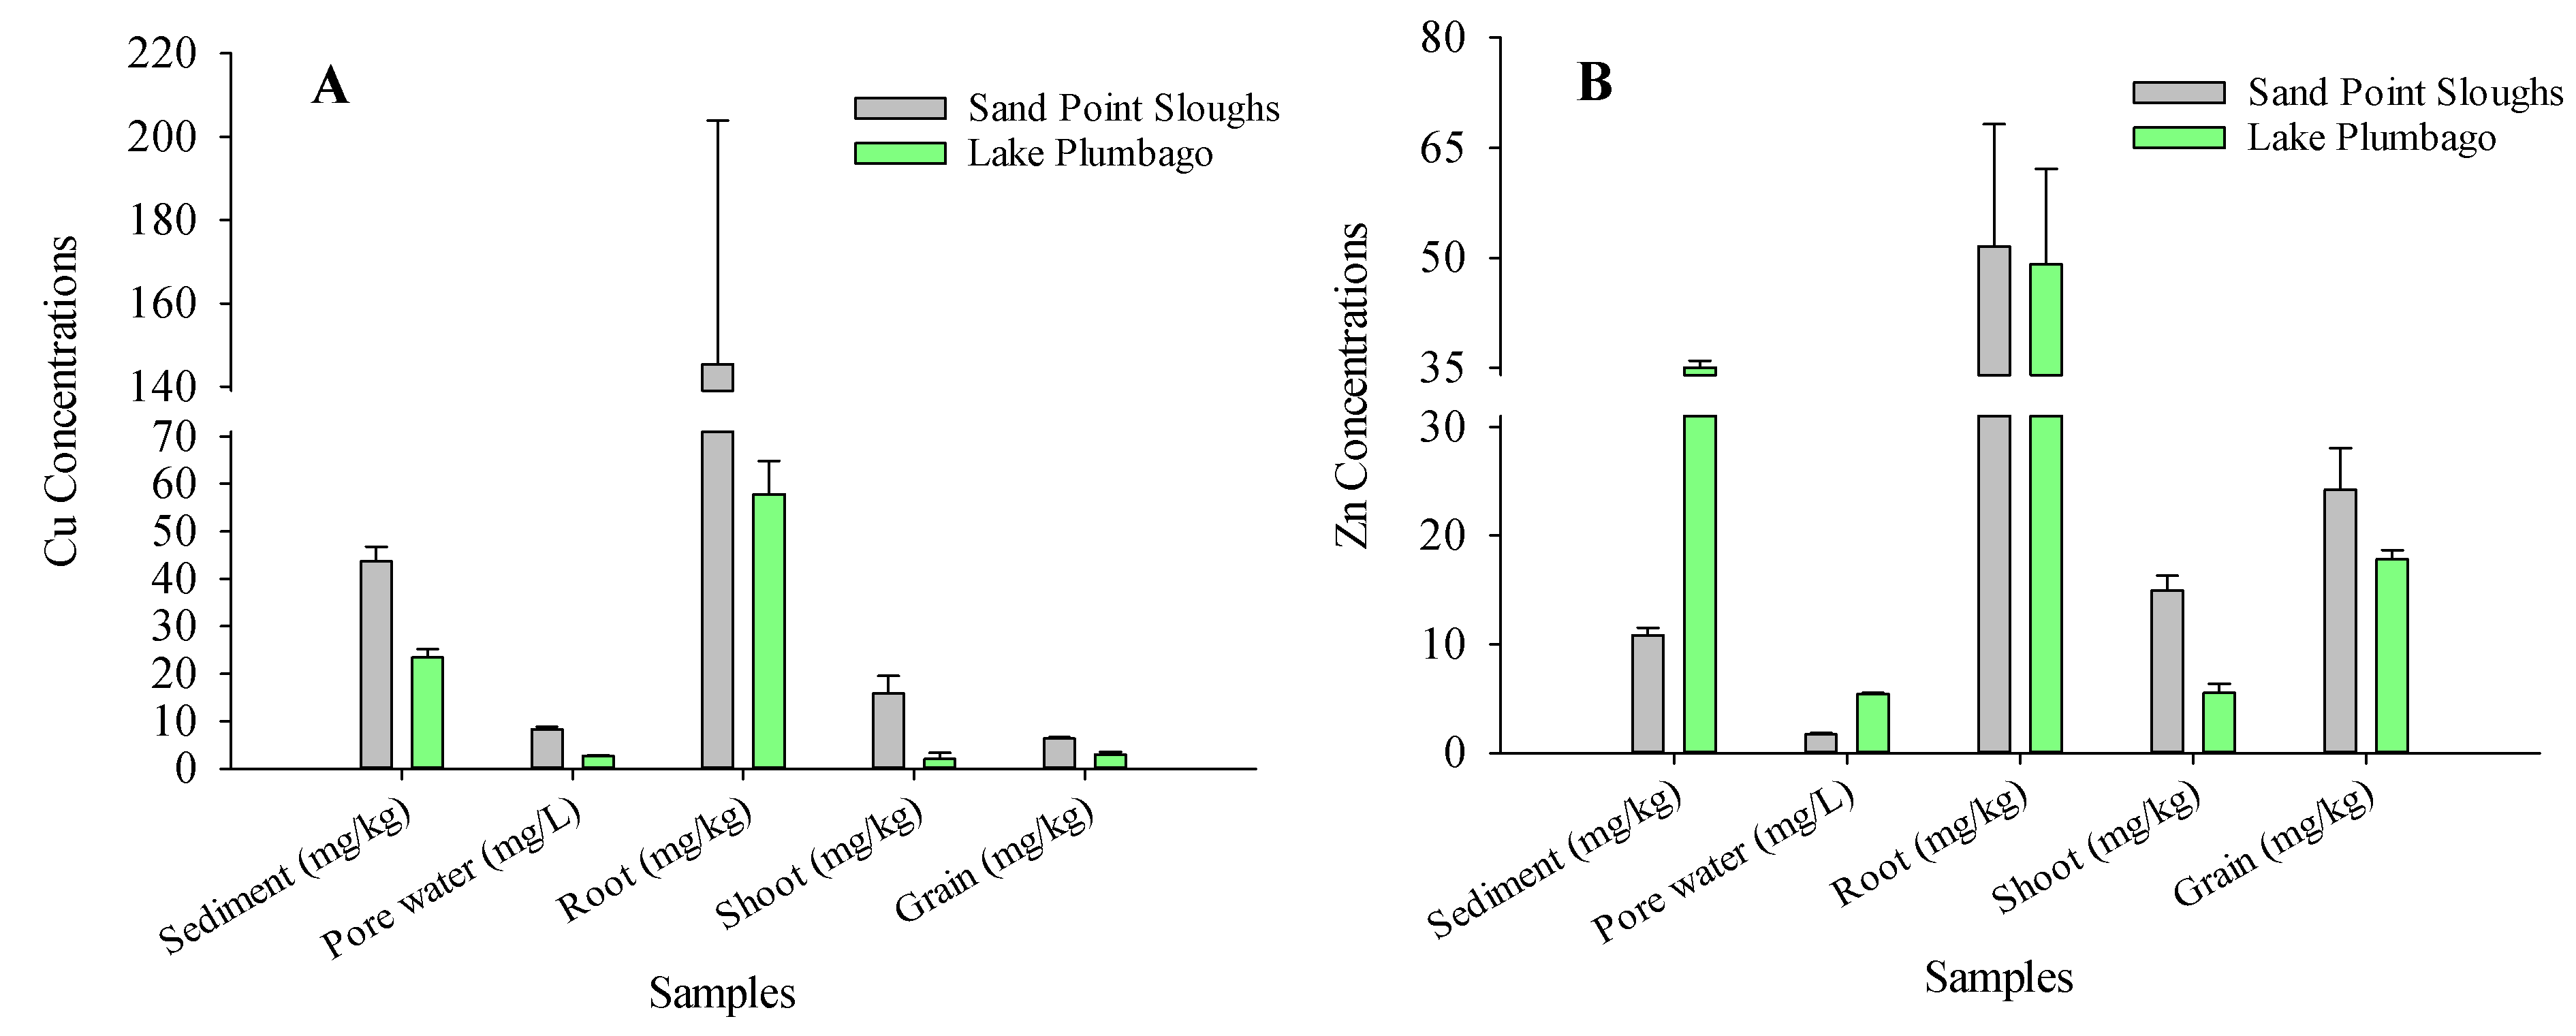
3.1. Distribution of Toxic Metals in the Water Column, Porewater, Sediment, and Wild Rice

The toxic element content of the sediment, water, porewater, and wild rice plant samples are shown in Table 1. The results for the Sand Point sediment samples are broadly in agreement with previous reports of stamp sand and sediment analysis reported for the L’Anse and Keweenaw Bay areas [6,7,8]. The stamp sand discharged by Mass Mills in Keweenaw Bay during the first two decades of the 20th century has continued to migrate south toward L’Anse Bay, the largest Indian reservation in Michigan [5]. The Sand Point site is located at the entrance to L’Anse Bay and is expected to contain stamp sand deposits in the sediments. As seen in Table 1, the levels of toxic metals were below sediment quality guidelines (SQGs), except for Cu. SQGs for the protection of sediment-dwelling organisms in freshwater ecosystems include a variety of measurements that are grouped under threshold effect concentration (TEC), below which adverse effects are not expected to occur [19]. TECs include threshold effect levels (TELs), effect range low values (ERLs), or lowest effect levels (LELs). While the TEL value for Cu is 35.7 ppm, the Sand Point sediment samples had a mean value of 43.7 ppm of Cu. However, the values for all other toxic metals in the Sand Point sediments were below TELs [16]. Since Lake Plumbago is an inland lake with no direct connection to Lake Superior, high levels of toxic metals were not expected in the sediments. Interestingly, the average Cd levels (1.38 ppm) exceeded the TEL value of 0.596 ppm in Lake Plumbago. In addition, As levels were 3.7 fold, Cr 4.3 fold, Mn 8.6 fold, Ni 5.2 fold, and Pb 6.7 fold higher compared to those of Sand Point sediments. Because of the legacy of mining in the area, most of the studies on sediment and water contamination reported so far were carried out on Keweenaw and L’Anse Bays. To our knowledge, no such study has been carried out on other inland lakes where wild rice restoration is practiced.
On examination of the toxic element levels in porewater, the Probable Effect Quotient (PEQ) values (calculated as total element concentrations/Probable Effect Concentration of element) were all well below one for both Sand Point and Lake Plumbago samples. This indicates that the probability of toxic effects on benthic organisms in the lab from these samples would be negligible [20].

3.2. Toxic Metal Uptake and Accumulation in Wild Rice

Toxic metals have the potential to bioaccumulate and biomagnify as they are transferred via the food chain. Uptake of toxic metals by aquatic plants and algae poses a major risk to ecological and human health. Wild rice is not only an important food source for the KBIC, but it also constitutes a major part of the diet of migrating waterfowl and other wildlife in the area [21]. Our study showed that the toxic element concentrations in wild rice roots in descending order were: Al > Mn > Cu > Zn > Pb > As > Cd > Cr > Ni > Co (Table 1) in samples collected from the Sand Point site. In the wild rice samples collected from Lake Plumbago, the toxic metal levels in the roots were Al > Mn > Cu > Zn > As > Ni > Cr > Pb > Cd (Table 1). Very low levels of Hg (0.02 mg/kg) were also detected in wild rice roots collected from both sites. In the shoot samples, the range of accumulation was very similar to that of the root samples at both locations (Table 1). On the other hand, in the wild rice seed samples from both locations, the toxic metal levels were in the order of Al > Mn > Zn > Cu > As (Table 1). While trace levels of Hg were found in the wild rice seeds from both locations, Pb and Co were not detected in the seeds (Table 1).
The bioaccumulation of individual toxic metals was examined for the metals As, Hg, Cd, and Cr (Figure 2), as well as Cu and Zn (Figure 3). For As, we observed a large uptake by the roots, with a bioaccumulation factor (BF) of 243.4 (Table 2, Figure 3A) for the wild rice samples from Sand Point, whereas the BF in shoots and seeds were 0.36 and 1.1, respectively. For the rice samples collected from Lake Plumbago, the BFs were lower in roots, shoots, and seeds (89.9, 1, and 1.1, respectively). BF value greater than one indicates bioaccumulation potential, which is seen in wild rice seed samples from both sites. Although the As levels were higher in the porewater in Lake Plumbago, the BFs in plant parts were lower, compared to those of the Sand Point samples. In contrast, the trace levels of Hg detected in the sediment and porewater showed no potential for plant uptake and bioaccumulation in wild rice in either location (Table 2, Figure 2B) because the BFs for all samples were below one. For Cd, while the BF for the Sand Point wild rice roots and shoots were 152.8 and 3.8, respectively, the value for seeds was below one. Similarly, for samples from Lake Plumbago, the BF for root samples was high (33.0) and the BF for shoots was below 1, while the BF for seeds was 1.9 (Table 2, Figure 2C). For Cr, seeds from both locations had BF values <1, while the roots showed high bioaccumulation (Table 2, Figure 2D). For two other toxic metals found in abundance, the BFs for Cu in Sand Point and Lake Plumbago root samples were 17.5 and 21.6, respectively (Table 2, Figure 3A). However, the BFs for shoot and seed samples from both locations were much lower. While for Sand Point wild rice samples, the BF for shoot samples was 1.9, the seed BF value was below one. For Lake Plumbago samples, the BF value for the shoot was below one, while for the seed samples it was 1.12 (Table 2, Figure 3A). For Zn, bioconcentration factors for wild rice plants from both locations were high (Table 2, Figure 3B). While for the Sand Point samples, the BFs for roots, shoots, and seeds were 29.9, 8.7, and 14, respectively, the BFs for wild rice harvested from Lake Plumbago were 9.1, 1.0, and 3.3 (Table 2, Figure 3B). As mentioned earlier, there are very few studies that examined the uptake, translocation, and bioconcentration of toxic metals in wild rice. According to a previous report by Bennett et al. [12] where wild rice plant tissue samples from four different locations in Northern Wisconsin were tested for the presence of toxic metals, As, Cd, Cr, Pb, and Se accumulated in the roots, whereas Cu and Zn were the highest in seeds. Interestingly, the study reported that Pb was low in roots, but was accumulated in the leaves and seeds [12]. Out of the four locations Bennett et al. [12] sampled, three had no known sources of contamination, whereas the fourth location was close to a Chlor-alkali plant that was the largest source of atmospheric Hg in Wisconsin. Despite sampling from sites not known to be contaminated, high levels of As, Pb, and Hg were reported in roots and seeds, which could indicate the presence of these metals in the sediments or the atmosphere. However, Bennett et al. [12] did not analyze sediment or water samples, so the bioconcentration factor could not be compared. However, the mean level of Cu they reported in wild rice seeds was 5.27 mg/kg, whereas a mean value of 9.0 mg/kg was reported by Nriagu and Lin [10] in store-bought wild rice. The average values of Cu in wild rice seeds from Sand Point and Lake Plumbago were 6.34 and 3.01 mg/kg, respectively, (p = 0.0016). Since Cu levels in the sediment (43.65 mg/kg) and roots (145 mg/kg) at the Sand Point location were high, these data indicate that translocation of Cu within the wild rice is low. The Lake Plumbago sediments had approximately half the level of Cu (23.47 mg/kg) compared to the Sand Point site (p = 0.0009); the Cu concentration in the roots was 57.83 mg/kg, and the corresponding level of the metal in the wild rice seeds was also approximately half that of the Sand Point site samples. The uptake of Zn by wild rice was high, and BF values in seeds were 14.0 and 3.3 for Sand Point and Lake Plumbago seed samples, respectively (Table 2). The average concentrations of Zn in wild rice seeds from Sand Point and Lake Plumbago were 24.18 and 17.79 mg/kg, respectively, (p = 0.0488). This value is similar to Nriagu and Lin’s [9] report of 23 mg/kg, but lower than those reported by Bennett et al. [11], which was 43.9 mg/kg. For Cd, the mean values were 0.08 and 0.04 mg/kg in wild rice seeds at the Sand Point and Lake Plumbago sites, respectively, (p = 0.0337). The level of Cd in wild rice seeds at the Sand Point site was higher than that reported earlier by Bennett et al. [12] and Nriagu and Lin [10], 0.021 and 0.053 mg/kg, respectively. The most concerning element was As, with average levels in seeds for the Sand Point and Lake Plumbago samples being 0.17 and 0.42 mg/kg, respectively, (p = 0.0292). These values are higher than those reported by Bennett et al. [12] (0.11 mg/kg) and Nriagu and Lin [10] (0.066 mg/kg). The high levels of toxic metals found in Sand Point samples were expected, but those found in the Lake Plumbago samples were surprising.

3.3. Human Health Risk Assessment

A human health risk assessment was performed to understand the potential life-long non-carcinogenic and carcinogenic risks from a diet of wild rice. Potential non-carcinogenic risk calculations due to exposure to toxic metals through the ingestion of wild rice were performed according to USEPA [16]. The mean HQ values were in the order of As (2.13) > Hg (0.12) > Cd (0.09) > Cr (0.07) > Cu (0.07) > Zn (0.01) for Lake Plumbago wild rice seed samples. Out of the metals tested, As had the highest value of 2.13, but for all other metals, the values were well below one, indicating minimal non-carcinogenic risk from daily consumption of wild rice. For the Sand Point samples, the non-carcinogenic risk from As was also the highest (1.12). The HQ values were in the order of As (1.12) > Cd (0.2) > Hg (0.18) > Zn (0.06) > Cu (0.04). Similar to the Lake Plumbago wild rice seed samples, the values were well below one, except for As. The combined non-carcinogenic effects of multiple toxic metals were obtained by calculating the HI values, which is the summation of all the individual HQs [22]. The HI values for the toxic metals in wild rice seeds from both sites were high, 2.50 for Lake Plumbago, and 1.61 for the Sand Point site (Figure 4). The high HI values indicate that although the individual metals are at levels low enough to pose no health risk other than As, the combined set of toxic metals poses a considerable non-carcinogenic risk to human health.
Carcinogenic risk for the toxic metals As, Cr, and Cd was calculated according to USEPA, 2019 [18]. The mean risk levels from As for rice seed samples from Sand Point and Lake Plumbago were 2.16 × 10⁻⁴ and 4.11 × 10⁻⁴, respectively (Table 3). For Cr, the risk from oral ingestion of wild rice seed samples from Lake Plumbago was 4.47 × 10⁻⁵. The Cr level in rice seed samples from the Sand Point site was below the detection limit. For Cd, the carcinogenic risk levels were 7.23 × 10⁻⁶ and 1.62 × 10⁻⁵ from wild rice seeds harvested from Lake Plumbago and Sand Point, respectively. According to USEPA [16] the regulatory values for As, Cr, and Cd are 1 × 10⁻⁶ to 1 × 10⁻⁴, so the consumption of rice seeds from both locations poses a lifetime cancer risk for As and Cd, whereas, for Cr, only the Lake Plumbago wild rice seeds pose a carcinogenic risk.
Exposure to toxic metals, namely As, Cd, and Cr, through diet, poses excess cancer risk in the population. While Cu, Zn, Cr, Pb, and As can cause non-carcinogenic health effects such as liver, kidney, and neurological disorders, chronic exposure to low doses of As, Cr and Cd can pose an excess cancer risk. Exposure to Cr was shown to increase the lifetime risk of various types of cancer, depending on the type of exposure [23]. Chronic dietary exposure to low levels of Cd has been associated with an increased risk of breast cancer [24]. Chronic dietary exposure to As is very well documented and is known to cause numerous health impacts, including dermal, respiratory, cardiovascular, gastrointestinal, reproductive effects, and many types of cancer, including skin, bladder, liver, kidney, etc. [25].
In addition to its dietary and cultural importance, wild rice also has a significant influence over the food web in Keweenaw Bay as a source of food for waterfowl, muskrats, etc. as seen from the results of this study, while the levels of the individual toxic metals in wild rice are low, the HI values indicate that the toxic metals pose a combined non-carcinogenic risk. Arsenic is the exception and stands out as the element that poses the highest non-carcinogenic risk at both locations. Arsenic is known to have the potential to bioaccumulate in white rice, which is grown in standing water under anoxic conditions. This is also true for lake sediments containing wild rice beds. These sediments are known to be anoxic, resulting in As existing mainly as arsenite [As(III)] [26]. Arsenite has higher mobility in plants compared to arsenate [As(V)], which could explain its accumulation in wild rice grains.
The carcinogenic risk from three toxic metals, As, Cd, and Cr, was also elevated in the wild rice grains. While we hypothesized that the wild rice from the Sand Point site could pose an elevated health risk, the wild rice from Lake Plumbago, an inland lake not connected to Lake Superior, was not expected to have elevated levels of toxic metals. Interestingly, health risk data indicate that wild rice grains from Lake Plumbago pose a carcinogenic risk from As, Cd, and Cr. In comparison, wild rice grains from Sand Point pose a carcinogenic risk from As alone. There is a serious lack of data regarding the ecological and health risks due to northern wild rice in Michigan.

4. Conclusions

Increasing efforts are being made to restore the wild rice beds in the stamp sand-impacted Keweenaw Bay area. This paper reports the distribution of toxic metals in sediment, water, and wild rice in Sand Point sloughs on the Bay and a nearby inland lake, Lake Plumbago. Lake Plumbago had unexpectedly higher As, Cr, Mn, Ni, and Pb concentrations in sediments than Sand Point sloughs. Human health risk assessment showed wild rice grains posed carcinogenic risks for As, Cd, and Cr from Lake Plumbago, while the carcinogenic risk was indicated only for As from Sand Point sloughs wild rice grains. This study underlines the urgent need for more comprehensive health risk assessment studies for wild rice grown in the Upper Peninsula of Michigan to fully understand the impact of uptake and bioaccumulation of toxic metals by wild rice.

Author Contributions

Conceptualization, R.D.; Methodology, R.D. and M.W.; Investigation, R.D.S. and M.W.; Analysis, R.D.S., Z.Z.; Writing—original draft preparation, R.D.S., R.D.; Writing—editing, Z.Z., M.W.; Supervision, R.D.; Project administration, R.D. All authors have read and agreed to the published version of the manuscript.

Funding

This research was funded by the National Science Foundation—Research Experiences for Undergraduates (NSF-REU) project, Award Number 2050739.

Institutional Review Board Statement

Not applicable.

Informed Consent Statement

Not applicable.

Data Availability Statement

The data presented in this study are available on request from the corresponding author.

Acknowledgments

We thank Brooke Carter and Samantha Haynes for help with water and sediment sample collection. We are grateful to Evelyn Ravindran, Erin Johnston, and Kyle Seppanen (KBIC) for their help with site visits, sample collection, and providing background information. We also thank Valoree Gagnon (MTU) for helping liaise with KBIC. We acknowledge Smitha Rao, the PI of the NSF-REU project for funding acquisition and conceptualization of the REU project.

Conflicts of Interest

The authors declare no conflict of interest.

References

  1. Barton, A.J. Manoomin: The Story of Wild Rice in Michigan, 1st ed.; Michigan State University Press: East Lansing, MI, USA, 2018. [Google Scholar]
  2. Yu, X.; Chu, M.; Chu, C.; Du, Y.; Shi, J.; Liu, X.; Liu, Y.; Zhang, H.; Zhang, Z.; Yan, N. Wild rice (Zizania spp.): A review of its nutritional constituents, phytochemicals, antioxidant activities, and health-promoting effects. Food Chem. 2020, 33, 1272. [Google Scholar] [CrossRef] [PubMed]
  3. Biesboer, D.D. The Ecology and Conservation of Wild Rice, Zizania palustris L., in North America. Acta Limnol. Bras. 2019, 31, e102. [Google Scholar] [CrossRef] [Green Version]
  4. Sidhu, V.; Sarkar, D.; Datta, R. Effects of biosolids and compost amendment on chemistry of soils contaminated with copper from mining activities. Environ. Monit. Assess. 2016, 188, 176. [Google Scholar] [CrossRef] [PubMed]
  5. Kerfoot, W.C.; Urban, N.; Jeong, J.; MacLennan, C.; Ford, S. Copper-rich ‘‘Halo” off Lake Superior’s Keweenaw Peninsula and how Mass Mill tailings dispersed onto tribal lands. J. Great Lakes Res. 2020, 46, 1423–1443. [Google Scholar] [CrossRef]
  6. Kerfoot, W.C.; Robbins, J.A. Nearshore regions of Lake Superior: Multielement signatures of mining discharges and a test of Pb-210 deposition under conditions of variable sediment mass flux. J. Great Lakes Res. 1999, 25, 697–720. [Google Scholar] [CrossRef]
  7. Kerfoot, W.C.; Harting, S.L.; Rossmann, R.; Robbins, J.A. Anthropogenic copper inventories and mercury profiles from Lake Superior: Evidence for mining impacts. J. Great Lakes Res. 1999, 25, 663–682. [Google Scholar] [CrossRef]
  8. Kerfoot, W.C.; Hobmeier, M.M.; Regis, R.; Raman, V.K.; Brooks, C.N.; Shuchman, R.; Sayers, M.; Yousef, F.; Reif, M. Lidar (light detection and ranging) and benthic invertebrate investigations: Migrating tailings threaten Buffalo Reef in Lake Superior. J. Great Lakes Res. 2019, 45, 872–887. [Google Scholar] [CrossRef]
  9. Bussan, D.; Harris, A.; Douvris, C. Monitoring of selected trace elements in sediments of heavily industrialized areas in Calcasieu Parish, Louisiana, United States by inductively coupled plasma-optical emission spectroscopy (ICP-OES). Microchem. J. 2019, 144, 51–55. [Google Scholar] [CrossRef]
  10. Nriagu, J.O.; Lin, T.-S. Trace metals in wild rice sold in the United States. Sci. Total Environ. 1995, 172, 223–228. [Google Scholar] [CrossRef]
  11. Pip, E. Cadmium, copper and lead in wild rice from central Canada. Arch. Environ. Contam. Toxicol. 1993, 24, 179–181. [Google Scholar] [CrossRef] [PubMed]
  12. Bennett, J.P.; Chiriboga, E.; Coleman, J.; Waller, D.M. Heavy metals in wild rice from northern Wisconsin. Sci. Total Environ. 2000, 24, 261–269. [Google Scholar] [CrossRef]
  13. Kerfoot, W.C.; Hobmeier, M.M.; Swain, G.; Regis, R.; Raman, V.K.; Brooks, C.N.; Grimm, A.; Cook, C.; Shuchman, R.; Reif, M. Coastal Remote Sensing: Merging Physical, Chemical, and Biological Data as Tailings Drift onto Buffalo Reef, Lake Superior. Remote Sens. 2021, 13, 2434. [Google Scholar] [CrossRef]
  14. USEPA. Test Methods for Evaluating Solid Waste, 3rd ed.; SW 846, Office of Solid Waste and Emergency Response; USEPA: Washington, DC, USA, 1996.
  15. Barth, D.S.; Mason, B.J.; Starks, T.H.; Brown, K.W. Soil Sampling Quality Assurance User’s Guide, 2nd ed.; EPA/600/8-89/046; U.S. EPA: Washington, DC, USA, 1989.
  16. USEPA. Regional Screening Level (RSL) Summary Table: November 2011. Available online: http://www.epa.gov/regshwmd/risk/human/Index.htm (accessed on 20 January 2014).
  17. Mahr, C.N. Mercury Uptake by Wild Rice Plants in Northern Minnesota. Doctoral Thesis, University of Minnesota, Minneapolis, MN, USA, 2015. [Google Scholar]
  18. USEPA. Integrated Risk Information System. 2019. Available online: http://www.epa.gov/IRIS/ (accessed on 14 October 2016).
  19. MacDonald, D.D.; Ingersoll, C.G.; Berger, T.A. Development and Evaluation of Consensus-Based Sediment Quality Guidelines for Freshwater Ecosystems. Arch. Environ. Contam. Toxicol. 2000, 39, 20–31. [Google Scholar] [CrossRef] [PubMed]
  20. Besser, J.M.; Brumbaugh, W.G.; Allert, A.L.; Poulton, B.C.; Schmitt, C.J.; Ingersoll, C.J. Ecological impacts of lead mining on Ozark streams: Toxicity of sediment and pore water. Ecotox. Environ. Saf. 2009, 72, 516–526. [Google Scholar] [CrossRef] [PubMed]
  21. Ravindran, E.; Nankervis, P.; Sepannen, K. Keweenaw Bay Indian Community Waterfowl Index Report and Wild Rice Report; KBIC Natural Resources Department: L’Anse, MI, USA, 2014.
  22. Na Nagara, V.; Sarkar, D.; Luo, Q.; Biswas, J.K.; Datta, R. Health Risk Assessment of Exposure to Trace Elements from Drinking Black and Green Tea Marketed in Three Countries. Biol. Trace. Elem. Res. 2021, 1–13. [Google Scholar] [CrossRef] [PubMed]
  23. Wilbur, S.; Abadin, H.; Fay, M.; Yu, D.; Tencza, B.; Ingerman, L.; Klotzbach, J.; James, S. Toxicological Profile for Chromium—Health Effects; Agency for Toxic Substances and Disease Registry (US): Atlanta, GA, USA, 2012. Available online: https://www.ncbi.nlm.nih.gov/books/NBK158851/ (accessed on 3 September 2012).
  24. Satarug, S.; Garrett, S.H.; Sens, M.A.; Sens, D.A. Cadmium, environmental exposure, and health outcomes. Environ. Health Perspect. 2010, 118, 182–190. [Google Scholar] [CrossRef] [PubMed]
  25. Liu, X.; Song, Q.; Tang, Y.; Li, W.; Xu, J.; Wu, J.; Wang, F.; Brookes, P.C. Human health risk assessment of heavy metals in soil–vegetable system: A multi-medium analysis. Sci. Total Environ. 2013, 463–464, 530–540. [Google Scholar] [CrossRef] [PubMed]
  26. Pastor, J.; Dewey, B.; Johnson, N.W.; Swain, E.R.; Monson, P.; Peters, E.B.; Myrbo, A. Effects of sulfate and sulfide on the life cycle of Zizania palustris in hydroponic and mesocosm experiments. Ecol. Appl. 2017, 27, 321–336. [Google Scholar] [CrossRef] [PubMed]
Figure 1. Sampling locations of Sand Point sloughs and Lake Plumbago in Michigan (Google Maps, retrieved July 2021). (A). Locations of Sand Point sloughs and Lake Plumbago, (B). Specific sampling area at Sand Point sloughs, (C). Specific sampling area at Lake Plumbago.
Applsci 12 02937 g001
Figure 2. Total element concentrations in Sand Point sloughs and Lake Plumbago sediment, porewater, and wild rice samples. The concentrations are expressed as mg/kg for sediment and plant samples and mg/L in water samples. (A). Arsenic, (B). Mercury, (C). Cadmium, and (D). Chromium. Data are reported as mean ± S.D. (n = 3).
Applsci 12 02937 g002
Figure 3. Total element concentrations in Sand Point sloughs and Lake Plumbago sediment, porewater, and plant samples. The concentrations are expressed as mg/kg for sediment and plant samples and mg/L in water samples. (A). Copper, (B). Zinc. Data are reported as mean ± S.D. (n = 3).
Applsci 12 02937 g003
Figure 4. Hazard Index (HI) values indicate non-carcinogenic health risk due to exposure to toxic elements from the ingestion of wild rice seeds obtained from Lake Plumbago and Sand Point sloughs.
Applsci 12 02937 g004
Table 1. Total toxic elements concentrations of sediment, water, porewater, and wild rice samples from Sand Point sloughs and Lake Plumbago.
Samples and LocationsAlAsCdCoCrCuHgMnNiPbZn
Sediment (mg/kg)Sand Point Sloughs2000 (146) 10.82 (0.33)0.27 (0.03)0.19 (0.02)5.20 (0.40)43.65 (3.10)0.12 (0.04)40.43 (2.78)3.37 (0.30)0.93 (0.17)10.84 (0.68)
Lake Plumbago1217 (136)3.05 (0.31)1.38 (0.03)0.26 (0.07)22.40 (0.53)23.47 (1.78)0.08 (0.02)347 (5)17.53 (0.17)6.13 (0.13)35.08 (0.89)
TEL of SQGs 2-5.90.596 37.335.70.174-1835123
Pore Water (mg/L)Sand Point Sloughs132 (9)0.11 (0.01)0.04 (0.00)BDL 30.37 (0.02)8.32 (0.58)0.08 (0.01)4.42 (0.26)0.26 (0.01)0.14 (0.01)1.72 (0.12)
Lake Plumbago480 (55)0.39 (0.05)0.10 (0.01)0.09 (0.01)1.04 (0.12)2.68 (0.20)0.07 (0.03)144 (2)1.39 (0.10)0.49 (0.04)5.40 (0.14)
Wild Rice Root (mg/kg)Sand Point Sloughs2158 (932)25.60 (3.56)6.23 (0.84)1.76 (0.21)6.18 (2.77)145 (59)0.02 (0.01)179 (62)4.48 (1.94)37.09 (8.57)51.54 (16.71)
Lake Plumbago4457 (1869)35.16 (6.99)3.16 (0.33)BDL8.78 (3.70)57.83 (7.03)0.02 (0.00)2289 (118)15.91 (3.99)6.12 (1.49)49.15 (13.00)
Wild Rice Shoot  (mg/kg)Sand Point Sloughs274 (113)0.40 (0.19)0.16 (0.02)BDL0.78 (0.19)15.83 (3.77)0.02 (0.01)79.64 (11.37)0.59 (0.28)0.26 (0.17)14.95 (1.35)
Lake Plumbago74.48 (32.34)0.39 (0.11)0.04 (0.01)BDL0.08 (0.06)2.11 (1.26)0.01 (0.00)275 (54)0.14 (0.07)BDL5.54 (0.83)
Wild Rice Grain  (mg/kg)Sand Point Sloughs111 (25)0.17 (0.07)0.08 (0.02)BDLBDL6.34 (0.35)0.02 (0.00)122 (35)BDLBDL24.18 (3.88)
Lake Plumbago70.58 (21.39)0.42 (0.13)0.04 (0.01)BDL0.08 (0.04)3.01 (0.54)0.01 (0.00)226 (73)0.32 (0.16)BDL17.79 (0.87)
Notes: 1 Mean values are displayed followed by standard deviations in parentheses; 2 TEL of SQGs = Threshold effect level in sediment quality guidelines (SQGs) for metals in freshwater ecosystems; 3 BDL = Below Detection Limit.
Table 2. Bioconcentration factor of toxic elements in various parts of wild rice plants from Sand Point sloughs and Lake Plumbago.
Samples and LocationsAlAsCdCrCuHgMnNiPbZn
Wild Rice Root (mg/kg)Sand Point Sloughs16.3 (5.91) 1243.38 (52.99)152.81 (8.82)16.85 (6.55)17.47 (5.87)0.29 (0.11)40.59 (11.69)17.38 (6.54)257.93 (39.33)29.89 (7.58)
Lake Plumbago9.29 (2.88)89.89 (29.29)33.04 (0.9)8.42 (2.62)21.59 (3.32)0.27 (0.04)15.85 (0.57)11.44 (2.1)12.41 (2.13)9.11 (2.64)
Wild Rice Shoot (mg/kg)Sand Point Sloughs2.07 (0.46)243.38 (52.99)3.83 (0.15)2.14 (0.39)1.90 (0.32)0.27 (0.08)18.02 (1.54)2.28 (0.96)1.79 (1.07)8.67 (0.16)
Lake Plumbago0.16 (0.05)1 (0.4)0.4 (0.04)0.07 (0.05)0.79 (0.48)0.08 (0.01)1.9 (0.34)0.1 (0.04)N/A 21.03 (0.18)
Wild Rice Grain (mg/kg)Sand Point Sloughs0.84 (0.25)1.59 (0.52)0.41 (0.06)N/A0.76 (0.1)0.28 (0.09)27.48 (9.64)N/AN/A14.02 (3.28)
Lake Plumbago0.15 (0.03)1.06 (0.46)1.87 (0.64)0.07 (0.03)1.12 (0.23)0.14 (0.02)1.57 (0.48)0.23 (0.1)N/A3.3 (0.25)
Notes: 1 Mean values are displayed followed by standard deviations in parentheses; 2 N/A = non-detectable levels of trace elements.
Table 3. Excess cancer risk (R) values for As, Cr, and Cd from the ingestion of wild rice grains growing in Lake Plumbago and Sand Point sloughs.
Carcinogenic Risk (R)
MetalsLake PlumbagoSand Point
As4.11 × 10−42.16 × 10⁻⁴
Cr4.47 × 10−5-
Cd7.23 × 10−61.62 × 10⁻⁵
Publisher’s Note: MDPI stays neutral with regard to jurisdictional claims in published maps and institutional affiliations.

