Article

Modeling the Impact of Extreme Droughts on Agriculture under Current and Future Climate Conditions Using a Spatialized Climatic Index

by
Dorothée Kapsambelis
1,2,*,
David Moncoulon
1,
Martine Veysseire
3,
Jean-Michel Soubeyroux
4 and
Jean Cordier
2
1
Caisse Centrale de Réassurance (CCR) Department R&D Modeling Cat & Agriculture, 157 Boulevard Haussmann, 75008 Paris, France
2
Agrocampus Ouest, Economie et Gestion, SMART-LERECO, 65 rue de Saint-Brieuc, 35000 Rennes, France
3
Meteo-France, Direction des Services Méteorologiques, 42 Avenue Gaspard-Coriolis, CEDEX 1, 31057 Toulouse, France
4
Meteo-France, Direction de la Climatologie et des Services Climatiques, 42 Avenue Gaspard-Coriolis, CEDEX 1, 31057 Toulouse, France
*
Author to whom correspondence should be addressed.
Appl. Sci. 2022, 12(5), 2481; https://doi.org/10.3390/app12052481
Submission received: 16 December 2021 / Revised: 21 February 2022 / Accepted: 23 February 2022 / Published: 27 February 2022
(This article belongs to the Special Issue Geohazards: Risk Assessment, Mitigation and Prevention)

Abstract

:
Extreme droughts have a strong impact on agricultural production. In France, the 2003 drought generated records of yield losses at a national scale for grassland (more than 30%) and for cereals (more than 10% for soft winter wheat and winter barley). These extreme events raise the question of farm resilience in the future. Studying them makes it possible to adapt risk management policy to climate change. Therefore, the objective of this paper was to analyze the frequency and the intensity of extreme drought in 2050 and their impact on crop yield losses (grassland and cereals) in France. We used the DOWKI (Drought and Overwhelmed Water Key Indicator) meteorological index based on a cumulative water anomaly, which can explain droughts and their consequences on agricultural yield losses at a departmental scale. Then, using the ARPEGE-Climat Model developed by Meteo-France, DOWKI was projected in 2050 and grassland, soft winter wheat, and winter barley yield losses were simulated. The results compare the frequency and intensity of extreme droughts between the climate in 2000 and 2050. Our results show that the frequency of extreme droughts (at least as intense as in 2003) doubled in 2050. In addition, the yield losses due to 10-year droughts increased by 35% for grassland and by more than 70% for cereals.

1. Introduction

1.1. Consequences of Climate Change on Agriculture

Agriculture in France represents an important economic activity (leading producer in the European Union). In 2014, of the EUR 373 billion of gross agricultural products (GAP) produced in the European Union, France produced EUR 67 billion, representing 18% of the GAP [1,2]. France is the main producer of wheat and cattle in the European Union, and these two activities cover a large part of its utilized agricultural land [3]. In 2003, a severe drought caused a massive decrease in agricultural production and income (30% of the production was lost [4]), despite the rise in prices that some crops experienced [5]. Grassland yields were also greatly reduced and public support (via the Calamity Fund System) was necessary to allow farmers to get through the year, especially in the milk production community. These elements indicate that despite technological progress, crop production remains highly dependent on water resources and climatic conditions. In this context, increasing our scientific knowledge of the intensity and frequency of these extreme droughts is necessary to evaluate their impact on agricultural production.
There is a global consensus in the scientific community that the climate will be very different in the middle of the 21st century [6,7,8,9]. The main cause of climate change is the increase in atmospheric concentrations of several greenhouses gases as a result of human activity [10,11]. Several models are used in the community to study different scenarios of climate change and its consequences on agriculture. The following studies highlight several important points:
  • Annual temperatures are expected to increase [12,13]. As a consequence, the crop-growing period will be shorter and the grain protein concentration will decrease [14,15]. In addition, a high frequency of severe drought events during summer periods is to be expected [7,11,16]. These events may cause crop yield reduction or stagnation (depending on areas and species) [17,18]. Some studies show that in the Mediterranean region, yields could greatly decrease compared to historical yield trends [2,19].
  • A decrease in annual precipitation, especially in the Mediterranean region, such as the South of France, will contribute to an increase in winter droughts [11].
  • Many studies highlight that cereal crops (in particular wheat and corn, which are the most studied crops) will experience a decrease in yield due to an increased number of days above 30 °C [12,13,18,20,21,22,23].
  • Other studies underline that high temperatures have direct and indirect negative impacts on dairy production [24,25] by affecting animal health and grassland yields, in particular.
Finally, several studies demonstrate that heat waves like the 2003 one, which particularly affected crop yields, will be more frequent in the future [2,6,26,27,28].
Extreme drought events are difficult to study because there are by definition rare events that occur very infrequently, so an archive of historical data may contain just a few extreme events [29]. The IPCC defines the concept of “extreme” as “the occurrence of a value of a weather or climate variable above (or below) a threshold value near the upper (or lower) ends (‘tails’) of the range of observed values of the variable” [8]. Thus, the notion of an extreme drought event is dependent on the value of the climatic index chosen to characterize the climate. Therefore, the link between the climate index and the impact on agriculture (yield losses) has to be explicit. However, annual yield losses are due to a set of phenomena (diseases, climatic events, changes in cropping practices) and it is not easy to assess the weight of one phenomenon independently. The best-known drought indicators are:
  • Standardized Precipitation Index (SPI) developed by [30] and based on precipitation data to determine the exact period and duration of meteorological droughts. The values of the index are fitted to a log-logistic distribution for standardization.
  • Standardized Precipitation Evaporation Index (SPEI) developed by [31] and based on the difference between precipitation and reference evapotranspiration (ET0).
These indicators characterize meteorological and hydrological droughts, which are not necessarily similar to agricultural droughts. Although many indices have been developed to analyze the evolution of droughts, the direct relation between these indices and crop yield has not been frequently investigated. Some studies have been conducted in China, in the United States, and in Europe comparing the SPEI, PDSI (Palmer–Drought Severity Index), and SPI indices for the detection of agricultural droughts [32,33]. The best correlations are obtained with SPEI. In addition, in Canada, a study was carried out to analyze the correlation between grassland losses linked to droughts and certain agro-climatic indices like PDSI and SPI. The results indicate that the coefficients of determination remained very low with all indices [34]. Other drought indices have been developed for specific territory, such as ARID to study the link between water stress and plant growth in the United States [35]. Thus, some studies show that an index developed with the parameter of precipitation alone, like SPI, is not sufficient to explain the variability in crop production due to drought, particularly for extreme events like the one in 2003 [36,37], because this drought was characterized by an increase in evapotranspiration rates [38]. At the French country scale, one indicator used to analyze the effect of the climate change on agriculture is the Standardized Soil Water Index (SSWI) [39]. This indicator represents the useful water reserve of the soil, or water availability for plants. Water deficit and temperature are parameters commonly used to study the climate effect on agricultural crops [40,41].

1.2. Objectives of This Study

In the paper, we propose an evaluation of the frequency and intensity of extreme droughts in current climate and future climate conditions (year 2050). Our methodology is based on a simple drought index [42] correlated to crop yield losses that can be projected into the future using a global climate model—for instance, the ARPEGE-Climat Model from Meteo-France.
Based on this method, the objectives are to:
  • Analyze the climate and its evolution between the years 2000 and 2050;
  • Detect extreme events and analyze their frequency and intensity;
  • Simulate their consequences on crop yield losses.
The model is applied to three crop categories: grasslands, soft winter wheat, and winter barley.
This study aims to provide insight on the following issues:
  • Do the historic records contain the most extreme events and, if not, how can we characterize them?
  • What is the probability of occurrence in the current climate conditions?
  • Will the intensity and/or frequency of these events evolve in the future?

2. Materials and Methods

2.1. Modeling Extreme Droughts and Their Consequences on Yield Losses

2.1.1. DOWKI Computation on the SAFRAN Reanalysis

We used the DOWKI, which characterizes extreme events of drought and excess water. DOWKI is (1) simple to compute, (2) purely meteorological, and (3) independent of crop categories. It can be compared to yield losses for several types of crops and on large areas. DOWKI is a cumulative efficient rain anomaly, computed on a 10-day time step, between the current year value and the historical average. It is computed for the growing period of a given crop, and starts at 0 on 1 January. It is expressed in mm. Its equation for drought event characterization is as follows:
E R N C i , n = [ ( P i 1 , n P E T i 1 , n ) ( P i 1 , P P E T i 1 , P ¯ ) ] + [ ( P i , n P E T i , n ) ( P i , P P E T i , P ¯ ) ]   D O W K I d r o u g h t   c ,   n = min   E R N C i 0 i j , c , n
where E R N C i , n is the cumulative rain anomaly computed in decade i for year n. P is the precipitation and PET is the potential evapotranspiration. ( P i 1 , P P E T i 1 , P ¯ ) represents the average of the difference between P and PET computed for all i-1 10-day periods in period P (historical period). DOWKI is an annual value and is computed by taking the minimum of the values of ERNC for any 10-day period between i0 (first 10-day period) and ij (final 10-day period).
In [42], DOWKI was computed for representative meteorological stations at the departmental scale to match with available yield loss data, and we showed model uncertainties as we simulated all the crops losses. One notable limitation is the climate measure at a single point over the department. On the one hand, this measure is not necessarily representative of the climate over the whole territory of the department. On the other hand, the crop parcels were not necessarily located at the climate measuring point (meteorological station point). In this second case precisely, this would mean that we measured the hazard but not the agricultural risk. In this paper, we computed DOWKI on the SAFRAN-Grid—8 km × 8 km over the French metropolitan area for two reasons:
  • To reduce the uncertainties of the model;
  • To match with the output scale of the ARPEGE-Climat model using a quantile–quantile downscaling method on the SAFRAN daily reanalysis data (1981–2010 for rainfall and 1989–2018 for potential evapotranspiration).
After computing DOWKI on the SAFRAN grid, we crossed the SAFRAN reanalysis grid with the Graphic Plot Register (GPR) shown in Figure 1. To compute an index value by department, we calculated the DOWKI average values in each cell of the department where the crop was present. This methodology allowed us to measure climate risk specifically on crop production since we integrated the hazard parameter (DOWKI value) and crop vulnerability (the DOWKI computation corresponds to on the crop vulnerability period and the agricultural parcel location).

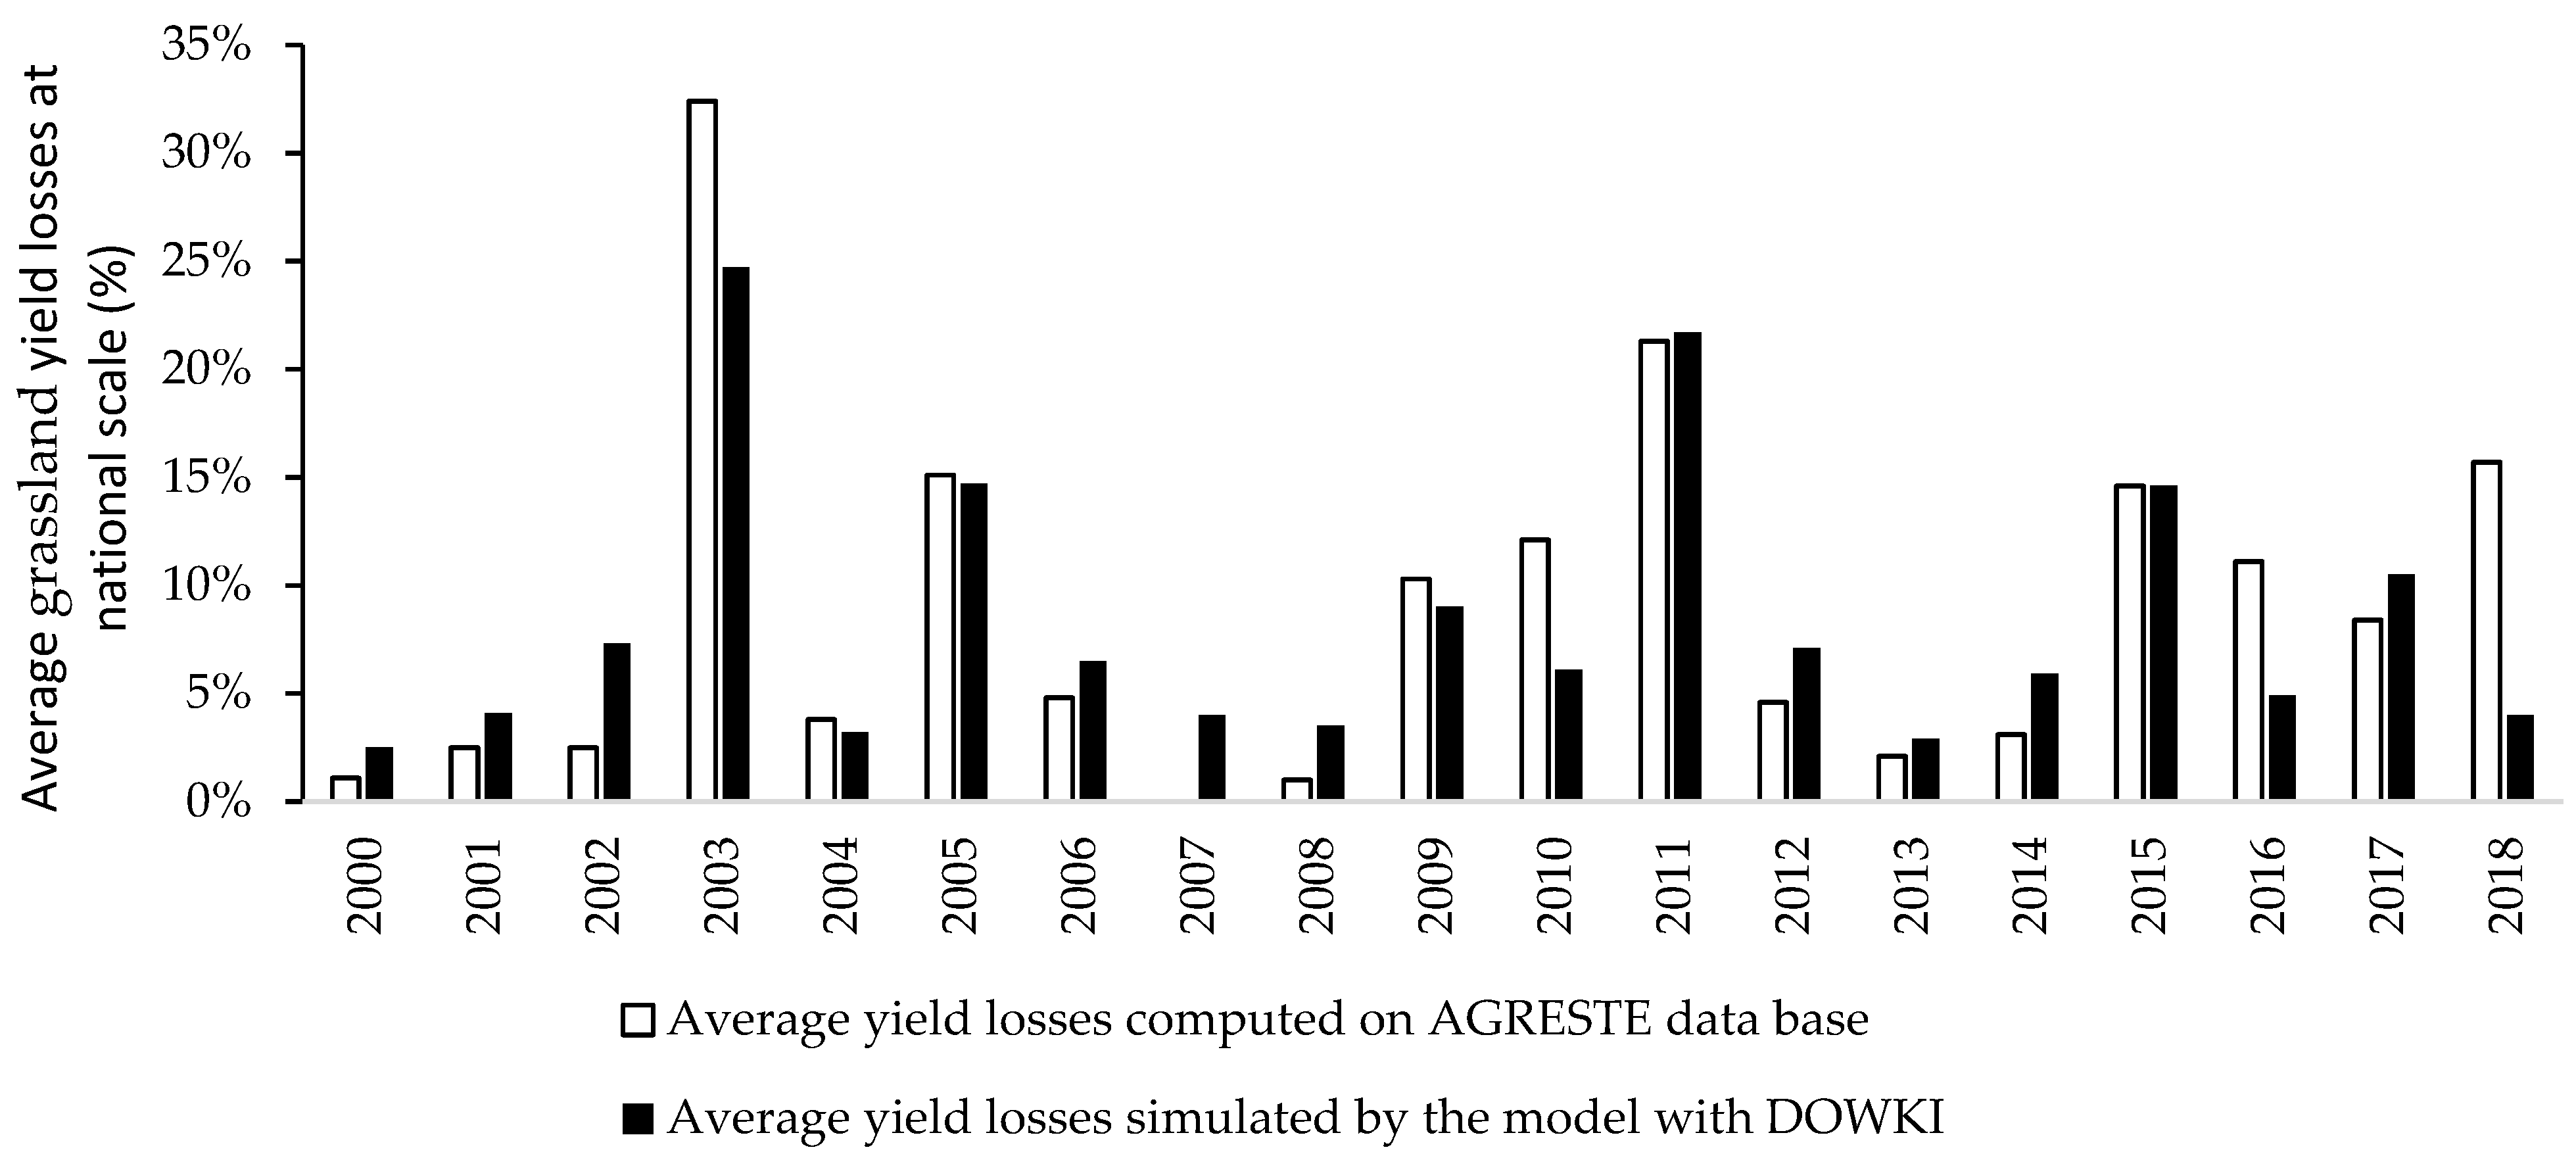
2.1.2. Computing Yield Losses

We used the AGRESTE database (https://agreste.agriculture.gouv.fr, accessed date: 5 March 2019), which refers to yield by crop and department in the historical period (1989–2018 for soft winter wheat and winter barley and 2000–2018 for grassland) with one value by year and by crop produced and declared on a given surface. Yield losses for the n-th year were computed by comparing the annual yield with a yield reference defined by the Olympic average over 5 years. This methodology is used in agricultural public policies like crop insurance [43]. The crop yield loss computation using the Olympic average is presented here:
Y i e l d   l o s s c , n = Y i e l d c , n ( n 5 n 1 y i e l d c M a x ( n 5 n 1 y i e l d c ) M i n ( n 5 n 1 y i e l d c ) ) ( n 5 n 1 y i e l d c M a x ( n 5 n 1 y i e l d c ) M i n ( n 5 n 1 y i e l d c ) )
In which c is the culture and n is the year.
Figure 2 represents yield losses for soft winter wheat, winter barley, and grassland on the French farm scale for the historical period 2000–2018. Over this period, yields were affected by several events:
  • The most significant soft winter wheat and winter barley yield losses were registered for the 2016 excess water event (27% and 17%, respectively) and the 2003 drought (14% and 16%, respectively).
  • The most important grassland yield losses were registered for the 2003 drought (32%) and the 2011 drought (21%).
Cereals seem to be sensitive to two natural extreme hazards—excess water and droughts—and grassland specifically to droughts. Over the historical period, there were two extreme drought events: in 2003 and in 2011. These two years saw largescale severe droughts, the worst droughts in 30 years. On average, these two events caused 25% crop losses for grassland and 10% crop losses for soft winter wheat. In order to characterize the extreme events in the future, we used these two extreme droughts as a reference.

2.1.3. Analyzing the Link between DOWKI and Yield Losses

DOWKI values and yield losses were computed for each department over the historical period 2000–2018. This calibration matrix of 1800 values was used to study the statistical relationships between the index value and the yield losses.
The index values were classified using 50 mm steps. For each class we calculated the number of yield loss values exceeding 0% and the average yield loss value.
The parameters of the model were:
  • The period over which the annual value of the index was computed. This period corresponded to the vulnerability period of the crop and was different for each crop;
  • The extreme event threshold at the departmental scale;
  • The minimum cultivation area to be taken into account to rule out small areas in which yields are very volatile.
These parameters were optimized using an experimental design, which consisted of computing a high number of calibration processes with different values for each parameter. The size of the experimental design was (pn), with p being the number of parameters (here, p = 4) and n being the number of values for each parameters (here, n = 10). In our case study, the number of calibration processes was pn = 10,000. The experimental design was evaluated by analyzing the following parameters:
  • Average error at the national scale over the entire historical period;
  • Average error at the departmental scale over the entire historical period.
This experimental design allowed us to select the best parameters by minimizing both errors. The best parameters are presented in Table 1. A specific experimental design with the same 4 parameters was run for each crop studied. Thus, a selection of the best parameters for grassland, soft winter wheat, and winter barley was made. The following table gives these parameter values.
For soft winter wheat, two climatic regions were defined—the North and South of France—to improve the calibration results.

2.2. Modelling Climate Scenarios with ARPEGE-Climat

2.2.1. General Methodology

Unlike most climatic projections, here the ARPEGE-Climat was not used to simulate a continuous period between 2000 and 2050 but to simulate a 400-year-long time series with year 2000 climate forcing and with year 2050 climate forcing under an RCP 8.5 scenario. The objective was to collect a large panel of possible meteorological situations, but not ones that necessarily occurred, for these two target years. These 400 years had to be interpreted as possible realizations of a given targeted year. With 400 possible realizations for the year 2000 and the year 2050, we had at our disposal a large series of data. Then, it was possible to analyze extreme events and to estimate probabilities of occurrence.
Meteorological data such as precipitations and potential evapotranspiration were the outputs of this model for the climate in 2000 and the climate in 2050. The results were analyzed on an 8 km × 8 km grid for the whole French territory.

2.2.2. Targeting the Year 2050

The year 2050 was chosen for this study as the target year for our climatic projections. This mid-term target year, 30 years in the future, will allow us to analyze the consequences of climate change on crop production and support public policy decisions. Under the financial context, insurers are able to make projections of their market in 2050. The target year 2100—widely used by climatologists to study the impact of climate change—is too far in the future to make serious hypotheses on the evolution of agriculture, landscapes, economy, and risk management policies.

2.2.3. Choice of RCP 8.5

The Representative Concentration Pathway 8.5 scenario (RCP 8.5) is characterized by increasing greenhouse gas concentration levels (>1370 eq-CO2 in 2100). This scenario is the most extreme and corresponds to a radiative forcing of +5 W/m2 in 2050 (only +4 W/m2 for RCP 4.5) [7]. The RCP 8.5 scenario represents a “pessimistic” or “conservative” vision of what the climate could be like in 2050. In this scenario, the energy demand is high, with the highest greenhouse gas emissions, corresponding to a high population and modest technological improvements. In France, RCP 8.5 corresponded to a temperature increase of 2.2 °C in 2050 compared to the 1976–2005 period, and a temperature increase of 1.7 °C for RCP 4.5 in 2050 [44,45]. According to the IPCC, RCP 8.5 corresponds today to historical paths since 1992.

2.2.4. ARPEGE-Climat Model Description and Parameterization

The numerical model ARPEGE is a global and spectral general circulation model developed for an “operational numerical weather forecast” by Meteo-France in collaboration with the ECMWF (European Centre for Medium-Range Weather Forecasts). ARPEGE-Climat became the atmospheric part of the CNRM earth-modelling system, which couples different components of the climate system (atmosphere, ocean, land surface, sea ice). The ARPEGE grid can be tilted and stretched by changing the position of the pole and by increasing the horizontal resolution over an area of interest. This zoom ability allows regional climate to be studied with ARPEGE-Climat.
In our case, ARPEGE-Climat had the pole in Germany (9.97° E, 50.00° N). The spatial resolution over Europe was about 20 km. The time step of the model was 600 s (10 min).
The exchanges between atmosphere and soil were taken into account by the specific SVAT (Soil Vegetation Atmosphere Transfer) module SURFEX (V7) implemented in ARPEGE-Climat.
The climate forcing allowed the climate to be kept stationary using fixed parameters:
  • Fixed greenhouse gases concentrations accorded with the choice of Representative Concentration Pathway (RCP) for the fixed year (here, 2000 or 2050);
  • Stationary sea-surface temperature series (adapted to each RCP with a quantile mapping method);
  • Fixed stratospheric ozone concentrations;
  • Fixed aerosol concentrations.

2.2.5. Model Outputs

The archive held model outputs over Europe and North Africa at stretched and tilted grid points in ARPEGE at an hourly step time for 36 near-surface parameters and at a 3-hour time step for 5 altitude parameters at 9 different levels. Then, data were generally interpolated on user-specific grids.

2.2.6. Downscaling and Post-Processing

We needed precipitation and potential evapotranspiration for metropolitan France. Precipitation could be directly extracted and interpolated on the 8 km × 8 km SAFRAN grid. Potential evapotranspiration was computed at a daily step time according to the Penman–Monteith formula, with 2 m temperature, sea level pressure, 2 m specific humidity, 10 m wind speed, surface downwards global short-wave radiation, and surface long-wave radiation. These parameters were retrieved and interpolated on the 8 km × 8 km SAFRAN grid.
The imperfections of the models induced biases in the outputs and downscaling, and interpolation is not a perfect method. Therefore, we removed the biases with 30 years of the climatic reference database SAFRAN (SIM2 reanalysis).
The precipitation and the parameters used to compute the potential evapotranspiration were generally corrected with the quantile mapping method. A specific method was developed at Meteo-France for global radiation. Last, potential evapotranspiration was corrected with the quantile-mapping method.

2.3. Uncertainty Analysis

The simulation results using a model chain like ours carried important uncertainties that needed to be evaluated and taken into account in the confidence interval of the results. Different uncertainties were contained in our model chain: climatic model uncertainties, index uncertainties, and damage model uncertainties.
As seen in its definition above, the DOWKI index computation is deterministic with no addition of uncertainties between the input data (P and PET) and index value. The hazard uncertainties were thus contained in the values of P and PET provided by the ARPEGE-Climat values and the downscaling process. To evaluate these uncertainties contained in the input data, we relied on two hypotheses:
  • The simulation of 400 repeats of the same target year (years 2000 and 2050) will include a large part of the climatic uncertainty;
  • The comparison between the target year 2000 produced by ARPEGE-Climat and the historical reanalysis of SAFRAN in the 2000–2018 period will complete this analysis.
The most important uncertainty lay in the crop yield loss simulations using DOWKI values and the damage model. As seen during the calibration process, false positives and false negatives induced model errors. We decided to take this uncertainty into account in the confidence interval by simulating each climate year in the ARPEGE-Climat model 100 times: For each of the 100 repeats of the same year, a yield loss value was randomly chosen within the index class at the department scale. This method allowed the confidence interval (for example, quantiles 10 and 90) to be estimated for each year and department.

3. Results

3.1. Historical Reanalysis

The relationship between the DOWKI values and yield losses for grassland is illustrated in Figure 3. The damage model is the statistical relation between climatic index and yield losses at the department scale. It is a combination of two predictive models:
  • Prediction of the occurrence of a claim, i.e., yield loss exceeding 5% at the department scale;
  • Prediction of the yield loss value at the department scale.
When a DOWKI value exceeded −475 mm, the departmental yield loss was equal to 42% with a probability of occurrence close to 90%. For DOWKI values close to zero, the probability of claims was significantly lower (~30%), as was the yield loss value (10%).
The calibration generated false positives and false negatives not explained by our index. False positives are departments where the index indicated, for a given year, an intense drought but without consistent yield loss. A false negative, on the contrary, is a case where high yield loss could not be explained by the index value. Several hypotheses were formulated to explain these errors (Table 2).
To validate our damage model, back testing was performed by comparing, at the national scale, the observed yield losses and the simulated yield losses (Figure 4).
The back-testing relative error at the national scale was 5.5% for grasslands (14.6% for soft winter wheat and 20.4% for winter barley). The 2011 and 2003 intense droughts were explained by the model with an underestimation of 24% (2003) and overestimation of 2% (2011), but the highest simulated yield losses remained, as expected. The lowest yield losses at the national scale (years 2000, 2001, 2002, and 2008) were overestimated by the model, but the simulated yield losses were still the lowest in the distribution. The two droughts in 2003 and 2011 were characterized by a lack of precipitation and an augmentation of evapotranspiration rates. In addition, for the 2003 drought, record extreme temperatures were experienced during the summer. The main difference between these two droughts is that they did not begin at the same period of the year. The 2011 drought was a spring drought and the extreme values of DOWKI were computed in June. For the 2003 drought, extreme values of DOWKI were computed in August. The DOWKI values were more extreme for grassland than for cereals because the drought lasted all of August and the vulnerability period of cereals is shorter.
The most difficult issue with these model results is the case of the drought in 2018: High yield losses due to an extreme drought that occurred in the northeast region of France were not detected by our model. This was due to multiannual drought cycles. The DOWKI index value was initialized at 0 on 1 January of each simulated year, whereas in 2017, the soils were abnormally dry in December.
As shown in Figure 4, the back testing of the model showed its capacity to simulate extreme drought events and predict the national yield loss.

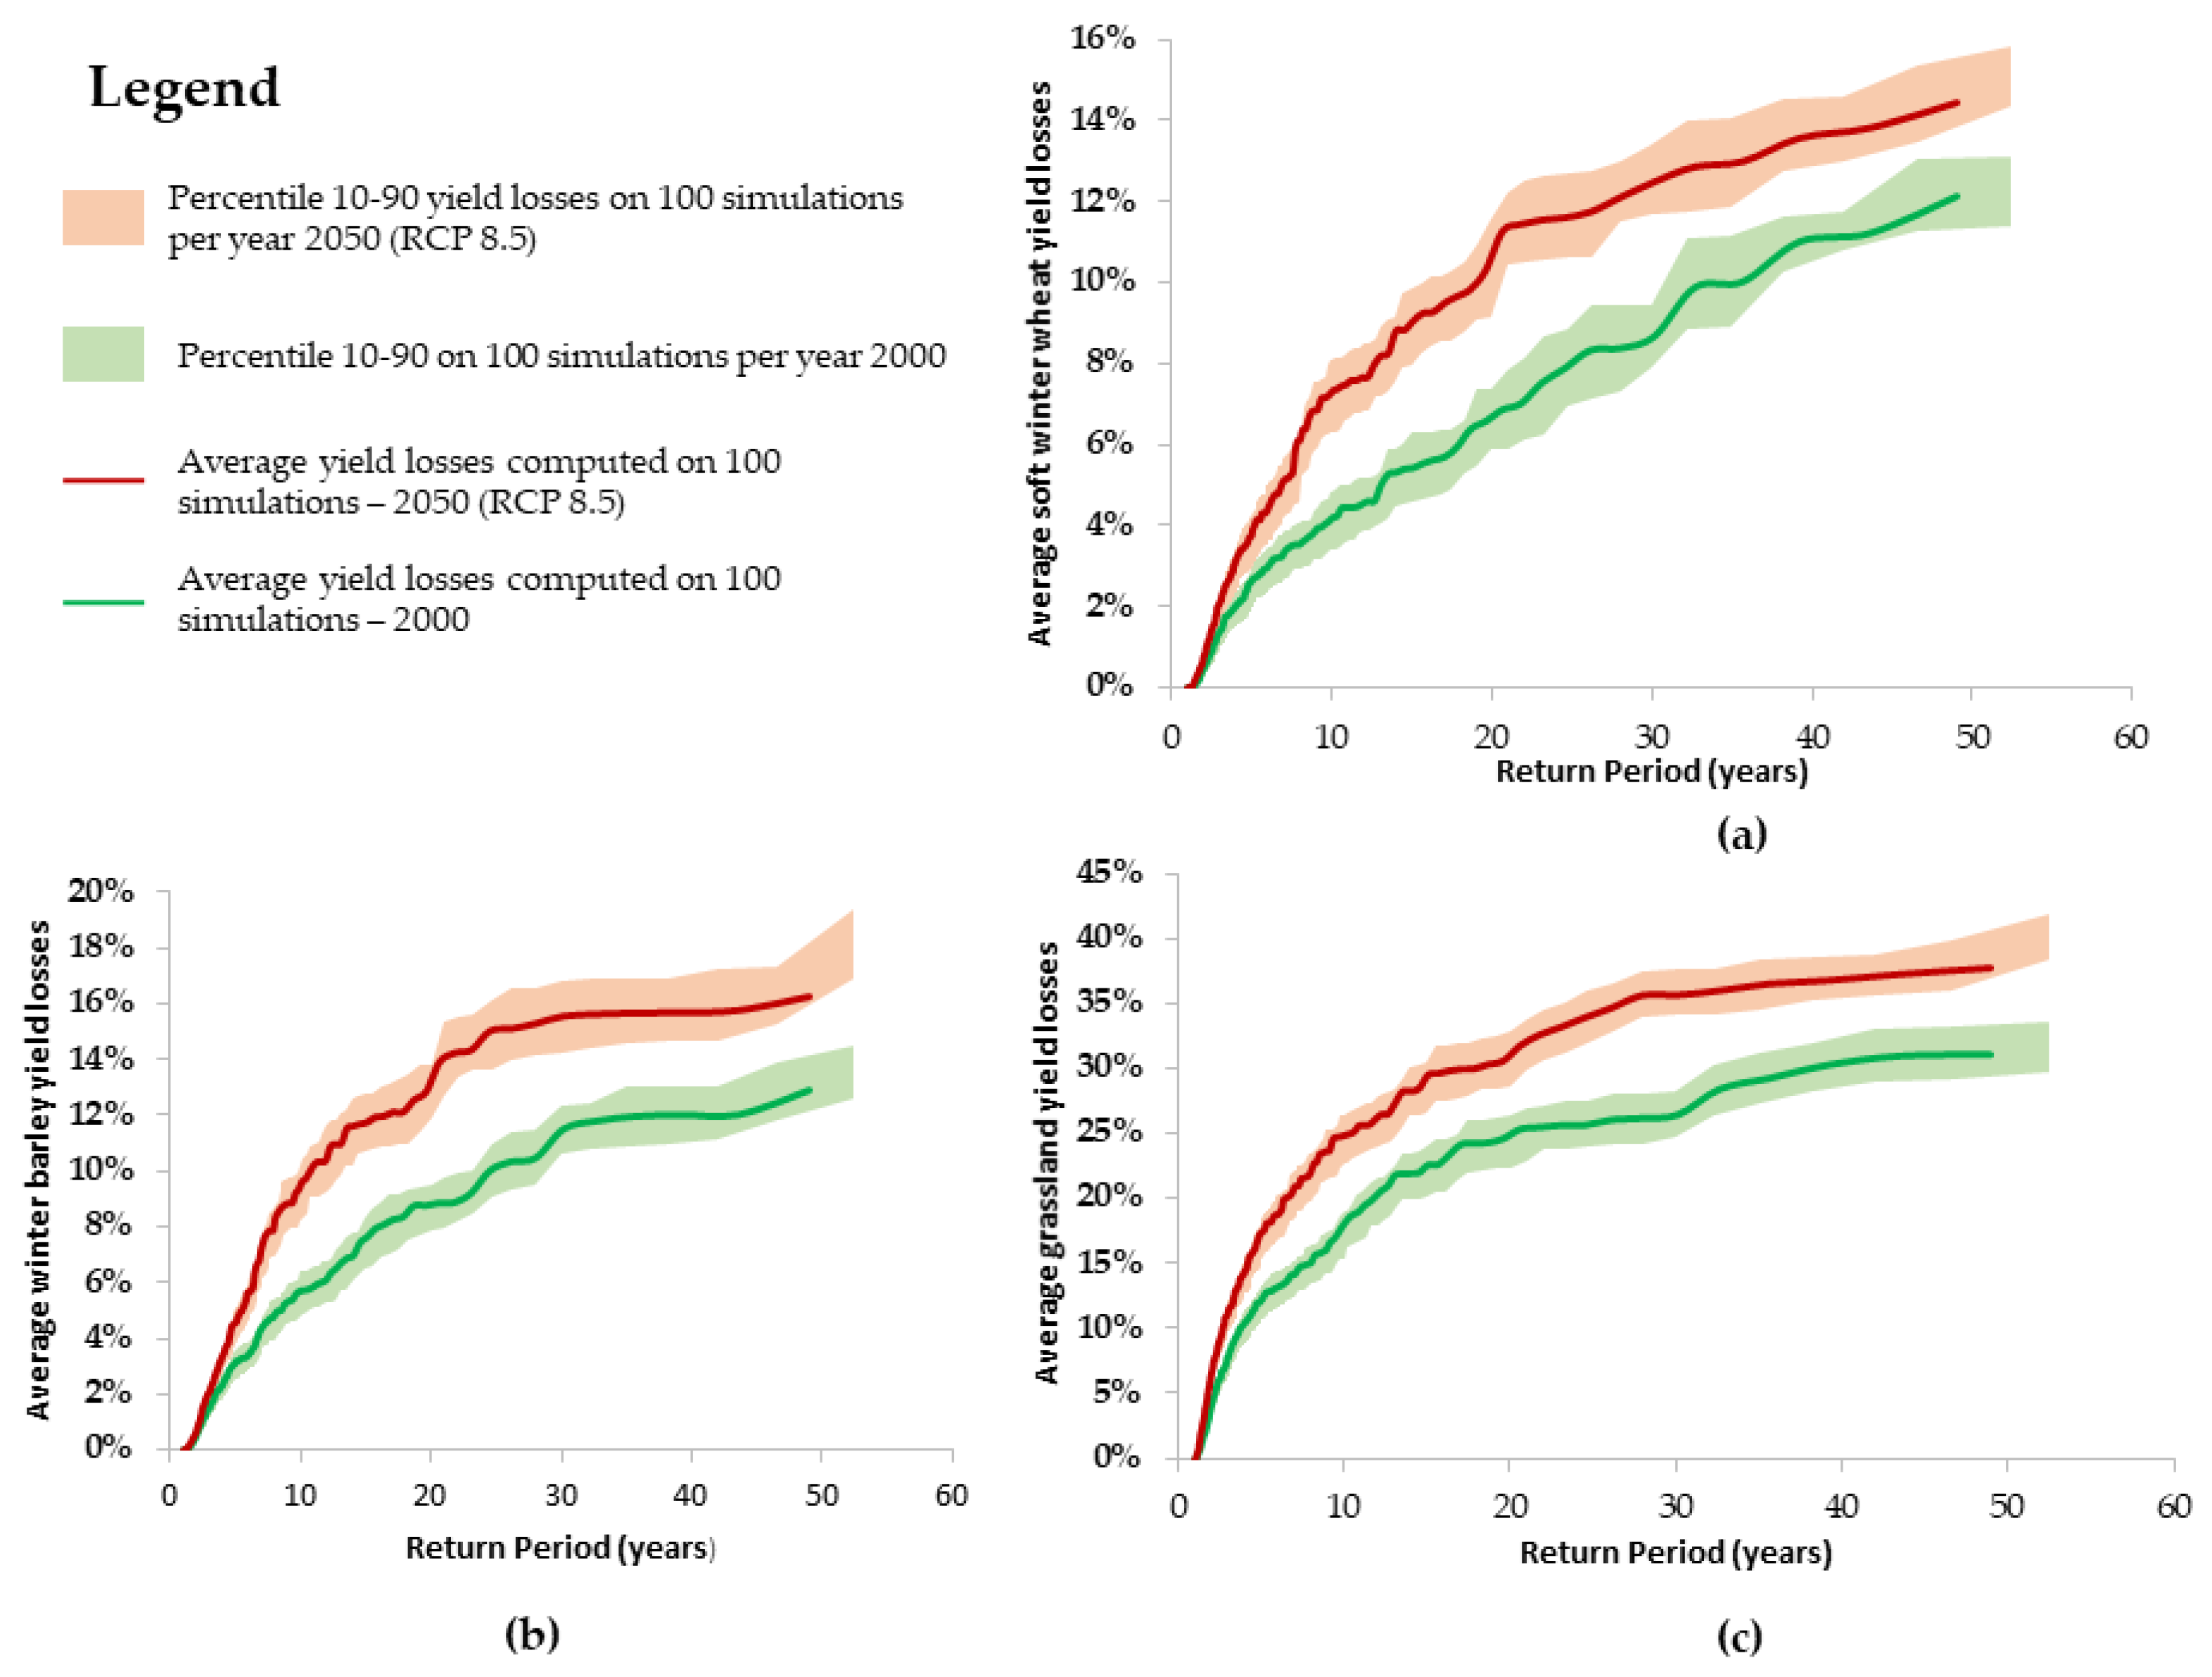
3.2. Agro-Climatic Model Results in 2000 and 2050

3.2.1. Comparison of DOWKI Distributions between 2000 and 2050

Using ARPEGE-Climat, two event sets of 400 years (2000 climate and 2050 climate) were computed. The first issue was to determine whether these distributions were significantly different. The numerous repeats in each target year allowed us to use a statistical test to answer this first question.
We compared the distributions of the annual average national scale DOWKI values with a Wilcoxon–Mann–Whitney non-parametric test commonly used to compare medians of two samples that do not follow a Gaussian distribution. The test rejected the null hypothesis that the two distributions were samples from continuous distributions with equal medians. The p-value was equal to 0.027.

3.2.2. National Analysis

In this first approach, we analyzed the frequency of extreme droughts with an intensity equal or superior to 2003 and 2011 at the national scale. In the current climate distribution, 29 drought events were identified. A quick estimation of the return period of these extreme droughts in current climate was 13 years. This first result is consistent with the 30 years of available historical data (1989–2018), with two extreme droughts (2003 and 2011), giving an empirical return period of 15 years. In the 2050 scenario, 57 extreme drought events were identified with a return period of seven years.
On average, these droughts affected 81.7% of utilized agricultural land (UAL) in 2000 and 86.1% in 2050. All these events were systemic, with a minimum of 61.8% (2000 climate) and 52.7% (2050 climate) of UAL affected by drought.
The annual DOWKI value at the national scale decreased by 40% (DOWKI was equal to −78 mm for the climate in 2000 and −110 mm for the climate in 2050) when comparing the 2000 and 2050 distributions.
At the national scale, the effect of climate change on the frequency of extreme droughts, considering 2003 as the reference, will increase significantly (+100%) between 2020 and 2050, according to the ARPEGE-Climat simulations. These events will remain systemic in the climate in 2050, with at least 50% of the UAL affected by drought.
Beyond the average, Figure 5 illustrates the yield losses (%) at the national scale for soft winter wheat (a), winter barley (b), and grassland (c) with respect to their return period in the current climate and in 2050.
A lot of information can be extracted from Figure 5. When integrating the model uncertainties (percentile 10–90), the empirical cumulative distribution functions (ECDF curves) between the 2000 climate and the 2050 climate did not overlap over 10 years, showing a significant increase in yield losses between 2000 and 2050 for all return periods.
First, the annual average loss will increase in 2050 by:
-
40% for grasslands;
-
47% for winter barley;
-
45% for soft winter wheat.
The yield losses due to 10-year droughts will increase by:
-
35% for grassland;
-
75% for soft winter wheat;
-
79% for winter barley (Table 3).
The results show a more important yield loss increase for cereals than grassland (Table 3) due to 10-year droughts. The whole of France would be impacted by a significant increase in risk in 2050, but the evolution would be even more significant in the northern half of France, where straw cereals are cultivated. Indeed, we analyzed the DOWKI values of 10-year droughts between the 2000 climate and the 2050 climate: A critical increase in the water balance anomaly (30–50%) was registered in the North of France, particularly where cereals are cultivated [46]. In the South of France, for 10-year droughts an increase in the water balance anomaly of 10–30% was recorded [46].
The return period of the highest losses (50-year return period at current climate) will become every 19.6 years for grasslands and winter barley and every 26.1 years for soft winter wheat.
In terms of output and income losses, these droughts will affect the agricultural economy with a loss of:
-
4.5 million metric tons and a deficit of EUR 745 million (with an average price of EUR 168/T) for soft winter wheat;
-
1 million metric tons and a deficit of EUR 163 million (with an average price of EUR 164/T) for winter barley;
-
8.8 million metric tons of dry matter and an indirect deficit of EUR 1.3 billion (with an average price estimated at EUR 150/T of dry matter).

3.2.3. Regional Analysis

Were the evolutions highlighted at the national scale consistent with a geographical study at the departmental scale?
We analyzed the intensity and frequency of extreme droughts at the local level using DOWKI values computed at an 8 km × 8 km scale and crop yield losses simulated at the departmental level.
The results presented in Figure 6a illustrate that the increase in the water deficit will be more significant on average in the South of France (southwest and Mediterranean region). Overall, we observed a worsening water deficit of 30% to 50% throughout France and above 50% in the south.
Brittany, Normandy, and the coastal northern regions showed the lowest evolution of drought index (<30%). In these areas, yield losses for grassland will increase by 30 to 50% on average.
The translation of the DOWKI values in terms of yield losses showed the following results: the northeastern and southeastern parts of France will incur high yield loss increases for straw cereals. Depending on the department, Figure 6b,c shows that the yield losses will increase by 30% to 100% in 2050 for straw cereals. For grasslands, the whole of France will be affected by a significant increase in yield losses of between 30% and 75%.

4. Discussion

4.1. Comparison of the Results with Others Studies

This study shows that significant droughts from the recent past generated high yield losses at the national scale with a systemic impact on the French territory. More extreme events were computed under the current climate in terms of hazard and yield losses. Their probability of occurrence was estimated by our model to be 13 years. Our results show that the frequency of these extreme events will increase in the future to a return period of seven years.
These results are consistent with the ClimSec project [39]; with the study of IPCC [7,44], which focuses on extreme events; and with other European studies using EUROCORDEX models [47,48,49,50]. Climatic projections indicate that droughts will have a severity never before registered in terms of spatial extension and intensity. Other studies point out that the frequency of extreme drought events will strongly increase in the future, leading to a crop yield decrease, including grasslands under the RCP 8.5 scenario in all French territory [26]. In addition, studies focusing on specific countries and analyzing the evolution of droughts using climatic indices show an increase in severe drought in Greece [51], and a decrease in wheat yield due to drought severity [52] and an increase in drought frequency and severity in Spain [53], as well as in others areas like in China [54,55] and the United States [56].
Many studies show that the Mediterranean region appears to be very exposed to droughts in the future [57,58]). Indeed, the different models used at the regional scale (RCM models) to measure the impact of climate change on drought events agree that the droughts will be more intense in southern Europe, especially in the Mediterranean region [7,57,59]. Extreme heat wave studies show that the Mediterranean region will therefore probably record a cumulative water deficit anomaly, but this is, however, more widely throughout France, where the evolution between the climate in 2000 and in 2050 will be the most marked [60,61,62,63].
These extreme events are the most worrying for the sustainability of agricultural production systems because they generate very significant losses at the country level, affecting food security. For example, the extreme drought in 2011 was responsible for losses of more than USD 1 billion for animal production in United States [64]. In the European Union, losses due to the 2003 drought are estimated at EUR 13 billion, including EUR 4 billion for France [65]. Nowadays it is well documented that in many rural areas, small farms do not have the financial capacity to cope with systemic climate shocks [66]. In the future, climate change will increase extreme drought frequency [8,67], which raises the question of the resilience of farm income. The improvement of risk knowledge supports the assessment of the risk management systems currently in place and their sustainability in the context of climate change.

4.2. Limits of This Study

The first limit to this work is the use of a single climate model. It was important for the authors to question the reliability of this climate model. The specificity of our approach was to simulate 400 years of steady-state climate under the conditions of the years 2000 and 2050. Was the variability of other CORDEX-Drias models contained in these 2 × 400 years event sets? CORDEX-Drias simulations between 1985 and 2005 (current climate) and 2040–2060 (climate in 2050) for six different models were compared with ARPEGE-Climat. It appears that the current climate, future climate, and evolution ratio of the six models at the French scale were included in ARPEGE-Climat 400-year outputs, as shown in Figure A1 and Figure A2 in Appendix A. After this validation was complete, it was obvious that obtaining extreme event values was tougher when mixing a short-scale event set from six different models than with the use of ARPEGE-Climat model. This study highlights the relevance of using large-scale event sets to represent the variability of climate, especially for extreme values.
Another limitation is the computation of crop yield losses using the Olympic average. This method allowed us to integrate a certain variability of yields over time. However, the crop yield loss computed was annual and was a sum of different factors, and this explains, in part, the errors in the model. Moreover, crop yields are not stable over time and many authors have shown that the cereal yield in France increased until 1996 and then stagnated or decreased [68,69]. However, the results contrast depending on geographical locations. Many studies have been done to eliminate bias introduced by non-climatic factors in the computation of yield losses [70,71], and it would be interesting to apply this kind of methodology. However, other factors may arise the same year, such as several climatic events. This was the case in 2003. A significant frost occurred in the central region of France, which contains 20% of the cultivated area for soft winter wheat [72]. The effects of frost accumulated with those of drought, which partly explains the significant crop losses and our difficulty in simulating it using a drought index.
Finally, this study was conducted with other elements being equal by definition. It did not take into account agricultural adaptation to climate change. The cultivated area for each crop modeled was the same in 2050. Our methodology was to project yield losses based on the relation between index values and historical yield losses. Therefore, cultivation of resistant varieties to extreme drought were not included in these results.

5. Conclusions

This paper analyzed the intensity and frequency of extreme agricultural droughts in 2050. For this purpose, the analysis focused on three crops: soft winter wheat, winter barley, and grassland. A new meteorological index was developed, which represents a cumulative water anomaly and is correlated to the yield losses. The model created simulated the crop yield losses at the departmental scale from the index values. Then, the index was projected in 2050 using the ARPEGE-Climat model from Meteo-France. The results compared the intensity and frequency of extreme droughts between the climate in 2000 and the climate in 2050 and show that the yield losses due to 10-year drought increased by 35% for grassland and by more than 70% for cereals.
Within the frameworks of both (1) the new CAP program (2023–2027) and (2) the French risk management scheme reform, these numbers are useful to alert and inform political stakeholders to the consequences of climate change, at the national and regional scale, on grassland and cereals. Our results show that to calibrate a risk management scheme and to be able to estimate the national farm exposure in the mid-term, the evolution of climatic extremes has to be taken into account. Insurers, reinsurers, public funds, and farmers (individually and globally) are exposed at different levels to the increase in climatic events in the next 30 years.
Insurance and reinsurance solvability is linked to the capacity to face extreme losses and, by definition, to the capacity to model the frequency/intensity curve. Nevertheless, as shown in this paper, this frequency/intensity curve cannot be considered stationary over the next 30 years. Under this condition, pricing treaties to allow loss balance in the mid-term have to integrate a mix between current and future losses.
The next step will be to integrate risk management scenarios in our model and to estimate the losses for the different stakeholders. A public–private partnership is a promising route to face systemic extreme events when insurance mutualization is to be reconsidered. Today, in France, the crop insurance diffusion rate is 30% for cereals and less than 2% for grasslands [73]. In this respect, after the occurrence of an extreme event at the national scale, the State must intervene to support farmers’ resiliency. A significant increase in the diffusion rates is one way to achieve sustainable agriculture in the context of increasing risks.
Agriculture has always been able to adapt to the changing climate. However, considering pessimistic scenarios like RCP 8.5 and the fast increase in extreme droughts, risk management policies must support national agricultural production during the adaptation period.

Author Contributions

Validation, J.C. and J.-M.S.; writing—original draft, D.K., D.M. and M.V. All authors have read and agreed to the published version of the manuscript.

Funding

This research received no external funding.

Institutional Review Board Statement

Not applicable.

Informed Consent Statement

Not applicable.

Data Availability Statement

Data used for yield are available in https://agreste.agriculture.gouv.fr (accessed on 20 January 2022).

Acknowledgments

The authors want to thank Elizabeth Harader-Coustau for helping with the revision of the manuscript and Lea Boittin for the English corrections. We also want to thank our anonymous reviewers for their valued advice on the structure of the paper and the addition of complementary studies.

Conflicts of Interest

The authors declare no conflict of interest.

Appendix A

Using a single climatic model can generate bias in the results. This section presents the multi-model study. To analyze it with an objective approach, the data from five climatic models were downloaded (IPSL-CM5A, CNRM-CERFACS-ALADIN, NCC, MPI, MOHC-HadGEM2) using:
  • The years 1985–2005 for the current climate;
  • The years 2040–2060 for the future climate according to RCP 8.5.
The parameters we analyzed were the annual average DOWKI values for the French territory and the evolution of the annual average between 2000 and 2050 for each model.
To compare the DRIAS models with ARPEGE on the same basis, we randomly chose a set of 20 years in the current climate and 20 years in the future climate 100 times in the ARPEGE event set.
The distribution of the 100 values for ARPEGE for the annual average values and the evolution of the annual average values were compared. As shown in Figure A1 and Figure A2 below, we can see that the 400 years of ARPEGE simulations contained the annual average values of the five models and their evolution.
Figure A1. Distribution of the 100 average annual DOWKI values from ARPEGE in black. The limits of the box plot represent percentiles 10–90 and the error bars represent percentiles 5–95. The average is also represented by a bar in the boxplot. The average annual DOWKI values computed in 5 models are represented in color. The two distributions are computed for the climate in 2000 and the climate in 2050.
Applsci 12 02481 g0a1
Figure A2. Distribution of the evolution between the climate in 2000 and the climate in 2050 of the annual average values of DOWKI from ARPEGE-Climat in black. The limits of the boxplot represent percentiles 10–90 and the error bars represent percentiles 5–95. The average of the 100 values is also represented by a bar in the boxplot. The evolution of the average annual DOWKI values between the climate in 2000 and the climate in 2050 computed in 5 other climate models are represented in color.
Applsci 12 02481 g0a2
We can thus consider that ARPEGE, with a long-range simulation of 400 years, takes into account more uncertainties than the five DRIAS models.

References

  1. Ministère de l’Agriculture et de l’Alimentation. AGRESTE-Chiffres et Données. Statistique Agricole Annuelle 2018–2019; Ministère de l’Agriculture et de l’Alimentation: Paris, France, 2020; p. 64. [Google Scholar]
  2. Bindi, M.; Olesen, J. The Responses of Agriculture in Europe to Climate Change. Reg. Environ. Chang. 2010, 11, 151–158. [Google Scholar] [CrossRef]
  3. Ministère de l’Agriculture et de l’Alimentation. Mémento de La Statistique Agricole 2020|Agreste, La Statistique Agricole; Ministère de l’Agriculture et de l’Alimentation: Paris, France, 2020. [Google Scholar]
  4. COPA COGECA. Assessment of the Impact of the Heat Wave and Drought of the Summer 2003 on Agriculture and Forestry; Committee of Agricultural Organisations in the European Union and General Committee for Agricultural cooperation in the European Union: Brussels, Belgium, 2003; pp. 1–15. [Google Scholar]
  5. Amigues, J.P.; Debaeke, P.; Itier, B.; Lemaire, G.; Seguin, B.; Tardieu, F.; Thomas, A. Sécheresse et Agriculture. Réduire La Vulnérabilité de L’agriculture à Un Risque Accru Du Manque d’eau; INRA: Paris, France, 2006; p. 72. [Google Scholar]
  6. Ciais, P.; Reichstein, M.; Viovy, N.; Granier, A.; Ogée, J.; Allard, V.; Aubinet, M.; Buchmann, N.; Bernhofer, C.; Carrara, A. Europe-Wide Reduction in Primary Productivity Caused by the Heat and Drought in 2003. Nature 2005, 437, 529–533. [Google Scholar] [CrossRef] [PubMed]
  7. IPCC. Climate Change 2014: Impacts, Adaptation, and Vulnerability. Part A: Global and Sectoral Aspects; Cambridge University Press Cambridge: Cambridge, UK, 2014; p. 1132. [Google Scholar]
  8. IPCC. Managing the Risks of Extreme Events and Disasters to Advance Climate Change Adaptation; Cambridge University Press: Cambridge, UK, 2012; p. 582. [Google Scholar]
  9. IMFREX. Impact Des Changements Anthropiques Sur La Fréquence Des Phénomènes Extrêmes de Vent de Température et de Précipitations, Rapport final. 2002; 49.
  10. IPCC. Climate Change 2007: Impacts, Adaptation and Vulnerability. Contribution of Working Group II to the Fourth Assessment Report of the Intergovernmental Panel on Climate Change; Cambridge University Press: Cambridge, UK; New York, NY, USA, 2007; p. 976. [Google Scholar]
  11. Vert, J.; Schaller, N.; Villien, C.; Portet, F.; Mahé, T.; Sergent, A.-S.; Alexandre, S.; Nathalie, B.; Cloppet, E.; Dhôte, J.-F.; et al. Agriculture, Forêt et Climat: Vers des stratégies d’adaptation Centre d’étude et de prospectives; Ministère de l’Agriculture et de l’Alimentation: Paris, France, 2013. [Google Scholar]
  12. Asseng, S.; Foster, I.; Turner, N.C. The Impact of Temperature Variability on Wheat Yields. Glob. Chang. Biol. 2011, 17, 997–1012. [Google Scholar] [CrossRef]
  13. Alexandrov, V.; Eitzinger, J.; Cajic, V.; Oberforster, M. Potential Impact of Climate Change on Selected Agricultural Crops in North-Eastern Austria. Glob. Chang. Biol. 2002, 8, 372–389. [Google Scholar] [CrossRef]
  14. Asseng, S.; Milroy, S.P. Simulation of Environmental and Genetic Effects on Grain Protein Concentration in Wheat. Eur. J. Agron. 2006, 25, 119–128. [Google Scholar] [CrossRef]
  15. Spiertz, J.H.J. The Influence of Temperature and Light Intensity on Grain Growth in Relation to the Carbohydrate and Nitrogen Economy of the Wheat Plant. Neth. J. Agric. Sci. 1977, 25, 182–197. [Google Scholar] [CrossRef]
  16. Vicente-Serrano, S.M.; Lopez-Moreno, J.-I.; Beguería, S.; Lorenzo-Lacruz, J.; Sanchez-Lorenzo, A.; García-Ruiz, J.M.; Azorin-Molina, C.; Morán-Tejeda, E.; Revuelto, J.; Trigo, R. Evidence of Increasing Drought Severity Caused by Temperature Rise in Southern Europe. Environ. Res. Lett. 2014, 9, 044001. [Google Scholar] [CrossRef]
  17. Brisson, N.; Levrault, F. Livre Vert du Projet CLIMATOR: 2007–2010: Changement Climatique, Agriculture et Forêt en France: Simulations D’impacts sur les Principales Espèces; ADEME: Angers, France, 2012; ISBN 978-2-35838-278-6. [Google Scholar]
  18. Porter, J.R.; Gawith, M. Temperatures and the Growth and Development of Wheat: A Review. Eur. J. Agron. 1999, 10, 23–36. [Google Scholar] [CrossRef]
  19. Ciscar, J.-C.; Iglesias, A.; Feyen, L.; Szabo, L.; Van Regemorter, D.; Amelung, B.; Nicholls, R.; Watkiss, P.; Christensen, O.B.; Dankers, R.; et al. Physical and Economic Consequences of Climate Change in Europe. Proc. Natl. Acad. Sci. USA 2011, 108, 2678–2683. [Google Scholar] [CrossRef] [PubMed] [Green Version]
  20. Schlenker, W.; Roberts, M.J. Nonlinear Temperature Effects Indicate Severe Damages to U.S. Crop Yields under Climate Change. Proc. Natl. Acad. Sci. USA 2009, 106, 15594–15598. [Google Scholar] [CrossRef] [PubMed] [Green Version]
  21. Semenov, M. Simulation of Extreme Weather Events by a Stochastic Weather Generator. Clim. Res. 2008, 35, 203–212. [Google Scholar] [CrossRef] [Green Version]
  22. Teixeira, E.I.; Fischer, G.; van Velthuizen, H.; Walter, C.; Ewert, F. Global Hot-Spots of Heat Stress on Agricultural Crops Due to Climate Change. Agric. For. Meteorol. 2013, 170, 206–215. [Google Scholar] [CrossRef]
  23. Challinor, A.J.; Watson, J.; Lobell, D.B.; Howden, S.M.; Smith, D.R.; Chhetri, N. A Meta-Analysis of Crop Yield under Climate Change and Adaptation. Nat. Clim. Chang. 2014, 4, 287–291. [Google Scholar] [CrossRef]
  24. André, G.; Engel, B.; Berentsen, P.B.M.; Vellinga, T.V.; Oude Lansink, A.G.J.M. Quantifying the Effect of Heat Stress on Daily Milk Yield and Monitoring Dynamic Changes Using an Adaptive Dynamic Model. J. Dairy Sci. 2011, 94, 4502–4513. [Google Scholar] [CrossRef] [PubMed]
  25. Dikmen, S.; Hansen, P.J. Is the Temperature-Humidity Index the Best Indicator of Heat Stress in Lactating Dairy Cows in a Subtropical Environment? J. Dairy Sci. 2009, 92, 109–116. [Google Scholar] [CrossRef] [Green Version]
  26. Jacobs, C.; Berglund, M.; Kurnik, B.; Dworak, T.; Marras, S.; Mereu, V.; Michetti, M. Climate Change Adaptation in the Agriculture Sector in Europe; European Environment Agency (EEA): Copenhagen, Denmark, 2019. [Google Scholar]
  27. Fink, A.H.; Brücher, T.; Krüger, A.; Leckebusch, G.C.; Pinto, J.G.; Ulbrich, U. The 2003 European Summer Heatwaves and Drought -Synoptic Diagnosis and Impacts: European Heatwave—Impacts. Weather 2004, 59, 209–216. [Google Scholar] [CrossRef] [Green Version]
  28. Van der Velde, M.; Tubiello, F.N.; Vrieling, A.; Bouraoui, F. Impacts of Extreme Weather on Wheat and Maize in France: Evaluating Regional Crop Simulations against Observed Data. Clim. Change 2012, 113, 751–765. [Google Scholar] [CrossRef] [Green Version]
  29. Tank, A.M.G.K.; Können, G.P. Trends in Indices of Daily Temperature and Precipitation Extremes in Europe, 1946–1999. J. Clim. 2003, 16, 3665–3680. [Google Scholar] [CrossRef]
  30. McKee, T.B.; Doesken, N.J.; Kleist, J. The Relationship of Drought Frequency and Duration to Time Scales. In Proceedings of the Eighth Conference on Applied Climatology, Anaheim, California, 17–22 January 1993; American Meteorological Society: Boston, MA, USA, 1993; pp. 179–184. [Google Scholar]
  31. Vicente-Serrano, S.; Beguería, S.; Lopez-Moreno, J. A Multiscalar Drought Index Sensitive to Global Warming: The Standardized Precipitation Evapotranspiration Index. J. Clim. 2010, 23, 1696–1718. [Google Scholar] [CrossRef] [Green Version]
  32. LIU, X.; Zhu, X.; Pan, Y.; Li, S.; Liu, Y.; Ma, Y. Agricultural Drought Monitoring: Progress, Challenges, and Prospects. J. Geogr. Sci. 2016, 26, 750–767. [Google Scholar] [CrossRef] [Green Version]
  33. Tian, L.; Yuan, S.; Quiring, S.M. Evaluation of Six Indices for Monitoring Agricultural Drought in the South-Central United States. Agric. For. Meteorol. 2018, 249, 107–119. [Google Scholar] [CrossRef]
  34. Quiring, S.M.; Papakryiakou, T.N. An Evaluation of Agricultural Drought Indices for the Canadian Prairies. Agric. For. Meteorol. 2003, 118, 49–62. [Google Scholar] [CrossRef]
  35. Woli, P.; Jones, J.W.; Ingram, K.T.; Fraisse, C.W. Agricultural Reference Index for Drought (ARID). Agron. J. 2012, 104, 287–300. [Google Scholar] [CrossRef]
  36. Beguería, S.; Vicente-Serrano, S.M.; Reig, F.; Latorre, B. Standardized Precipitation Evapotranspiration Index (SPEI) Revisited: Parameter Fitting, Evapotranspiration Models, Tools, Datasets and Drought Monitoring. Int. J. Climatol. 2014, 34, 3001–3023. [Google Scholar] [CrossRef] [Green Version]
  37. Potop, V.; Možný, M.; Soukup, J. Drought Evolution at Various Time Scales in the Lowland Regions and Their Impact on Vegetable Crops in the Czech Republic. Agric. For. Meteorol. 2012, 156, 121–133. [Google Scholar] [CrossRef]
  38. Rebetez, M.; Mayer, H.; Dupont, O.; Schindler, D.; Gartner, K.; Kropp, J.P.; Menzel, A. Heat and Drought 2003 in Europe: A Climate Synthetis. Ann. For. Sci. 2006, 63, 569–577. [Google Scholar] [CrossRef] [Green Version]
  39. Vidal, J.-P.; Martin, E.; Franchistéguy, L.; Habets, F.; Soubeyroux, J.-M.; Blanchard, M.; Baillon, M. Multilevel and Multiscale Drought Reanalysis over France with the Safran-Isba-Modcou Hydrometeorological Suite. Hydrol. Earth Syst. Sci. Discuss. 2010, 14, 459–478. [Google Scholar] [CrossRef] [Green Version]
  40. Gate, P. Le Blé Face Au Changement Climatique. Perspect. Agric. 2007, 336, 20–56. [Google Scholar]
  41. Ben-Ari, T.; Adrian, J.; Klein, T.; Calanca, P.; Van der Velde, M.; Makowski, D. Identifying Indicators of Extreme Wheat and Maize Yield Losses. Agric. For. Meteorol. 2016, 220, 130–140. [Google Scholar] [CrossRef]
  42. Kapsambelis, D.; Moncoulon, D.; Cordier, J. An Innovative Damage Model for Crop Insurance, Combining Two Hazards into a Single Climatic Index. Climate 2019, 7, 125. [Google Scholar] [CrossRef] [Green Version]
  43. Ministère de l’Agriculture, de l’Agroalimentaire et de la Foret, Ministère de l’Economie et des Finances. Cahier Des Charges Applicable Aux Entreprises D’assurance Pour La Prise En Charge Partielle de Primes et Cotisations D’assurance Récolte 2016. Pris En Application Des Articles 1, 2 et 10 Du Décret Fixant Pour Les Années 2016–2020 Les Modalités D’application de L’article L. 361-4 Du Code Rural et de La Pêche Maritime En Vue de Favoriser Le Développement de L’assurance Contre Certains Risques Agricoles; Ministère de l’Agriculture et de l’Alimentation: Paris, France, 2016. [Google Scholar]
  44. IPCC. Climate Change 2021: The Physical Science Basis. Contribution of Working Group I to the Sixth Assessment Report of the Intergovernmental Panel on Climate Change; Cambridge University Press: Cambridge, UK, 2021. [Google Scholar]
  45. IPCC. Regional Fact Sheet—Europe; Cambridge University Press: Cambridge, UK; New York, NY, USA, 2021. [Google Scholar]
  46. Kapsambelis, D.; Moncoulon, D.; Cordier, J. Modélisation de l’impact des sécheresses et excès d’eau sur les productions végétales à horizon 2050. In Rapport Scientifique CCR 2021; CCR: Paris, France, 2021; pp. 62–66. [Google Scholar]
  47. Forzieri, G.; Feyen, L.; Russo, S.; Vousdoukas, M.; Alfieri, L.; Outten, S.; Migliavacca, M.; Bianchi, A.; Rojas, R.; Cid, A. Multi-Hazard Assessment in Europe under Climate Change. Clim. Chang. 2016, 137, 105–119. [Google Scholar] [CrossRef] [Green Version]
  48. Jacob, D.; Petersen, J.; Eggert, B.; Alias, A.; Christensen, O.B.; Bouwer, L.M.; Braun, A.; Colette, A.; Déqué, M.; Georgievski, G.; et al. EURO-CORDEX: New High-Resolution Climate Change Projections for European Impact Research. Reg. Env. Chang. 2014, 14, 563–578. [Google Scholar] [CrossRef]
  49. Russo, S.; Dosio, A.; Graversen, R.G.; Sillmann, J.; Carrao, H.; Dunbar, M.B.; Singleton, A.; Montagna, P.; Barbola, P.; Vogt, J.V. Magnitude of Extreme Heat Waves in Present Climate and Their Projection in a Warming World. J. Geophys. Res. Atmos. 2014, 119, 12500–12512. [Google Scholar] [CrossRef] [Green Version]
  50. Spinoni, J.; Vogt, J.V.; Naumann, G.; Barbosa, P.; Dosio, A. Will Drought Events Become More Frequent and Severe in Europe? Int. J. Climatol. 2018, 38, 1718–1736. [Google Scholar] [CrossRef] [Green Version]
  51. Loukas, A.; Vasiliades, L.; Tzabiras, J. Climate Change Effects on Drought Severity. Adv. Geosci. 2008, 17, 23–29. [Google Scholar] [CrossRef] [Green Version]
  52. Mavromatis, T. Drought Index Evaluation for Assessing Future Wheat Production in Greece. Int. J. Climatol. 2007, 27, 911–924. [Google Scholar] [CrossRef]
  53. Gaitán, E.; Monjo, R.; Pórtoles, J.; Pino-Otín, M.R. Impact of Climate Change on Drought in Aragon (NE Spain). Sci. Total Environ. 2020, 740, 140094. [Google Scholar] [CrossRef] [PubMed]
  54. Zhang, Q.; Zhang, J. Drought Hazard Assessment in Typical Corn Cultivated Areas of China at Present and Potential Climate Change. Nat. Hazards J. Int. Soc. Prev. Mitig. Nat. Hazards 2016, 81, 1323–1331. [Google Scholar] [CrossRef]
  55. Sun, C.X.; Huang, G.; Fan, Y.; Zhou, X.; Lu, C.; Wang, X.Q. Drought Occurring with Hot Extremes: Changes under Future Climate Change on Loess Plateau, China. Earth’s Future 2019, 7, 587–604. [Google Scholar] [CrossRef] [Green Version]
  56. Strzepek, K.; Yohe, G.; Neumann, J.; Boehlert, B. Characterizing Changes in Drought Risk for the United States from Climate Change. Environ. Res. Lett. 2010, 5, 044012. [Google Scholar] [CrossRef]
  57. Beniston, M.; Stephenson, D.B.; Christensen, O.B.; Ferro, C.A.; Frei, C.; Goyette, S.; Halsnaes, K.; Holt, T.; Jylhä, K.; Koffi, B. Future Extreme Events in European Climate: An Exploration of Regional Climate Model Projections. Clim. Chang. 2007, 81, 71–95. [Google Scholar] [CrossRef] [Green Version]
  58. Blenkinsop, S.; Fowler, H.J. Changes in European Drought Characteristics Projected by the PRUDENCE Regional Climate Models. Int. J. Climatol. 2007, 27, 1595–1610. [Google Scholar] [CrossRef]
  59. Vidal, J.P.; Martin, E.; Kitova, N.; Najac, J.; Soubeyroux, J.-M. Evolution of Spatio-Temporal Drought Characteristics: Validation, Projections and Effect of Adaptation Scenarios. Hydrol. Earth Syst. Sci. 2012, 16, 2935–2955. [Google Scholar] [CrossRef] [Green Version]
  60. Deque, M. Frequency of Precipitation and Temperature Extremes over France in an Anthropogenic Scenario: Model Results and Statistical Correction According to Observed Values. Glob. Planet. Chang. 2007, 57, 16–26. [Google Scholar] [CrossRef]
  61. Planton, S.; Déqué, M.; Chauvin, F.; Terray, L. Expected Impacts of Climate Change on Extreme Climate Events. Geoscience 2008, 340, 564–574. [Google Scholar] [CrossRef]
  62. Soubeyroux, J.M.; Vidal, J.-P.; Najac, J.; Kitova, N.; Blanchard, M.; Dandin, P.; Martin, E.; Pagé, C.; Habets, F. Projet ClimSec. Impact du Changement Climatique en FRANCE sur la Sécheresse et l’eau du Sol. Rapport Final; irstea: Gennes, France, 2011; p. 73. [Google Scholar]
  63. Soubeyroux, J.-M.; Kitova, N.; Blanchard, M.; Vidal, J.P.; Martin, E.; Dandin, P. Caractérisation Des Sècheresses Des Sols En France et Changement Climatique: Résultats et Applications Du Projet ClimSec. La Météorologie 2012, 78, 21–30. [Google Scholar] [CrossRef] [Green Version]
  64. Hatfield, J.; Takle, G.; Grotjahn, R.; Holden, P.; Izaurralde, R.C.; Mader, T.; Marshall, E.; Liverman, D.; Melillo, J.M.; Richmond, T.C.; et al. Chapter 6: Agriculture. Climate Change Impacts in the United States: The Third National Climate Assessment; Melillo, J.M., Richmond, Terese (T.C.), Yohe, G.W., Eds.; U.S. Global Change Research Program: Sydney, NSW, Australia, 2014. [Google Scholar] [CrossRef]
  65. Létard, V.; Flandre, H.; Lepeltier, S. La France et les Français Face à la Canicule: Les Leçons D’une Crise; Rapport d’information au Sénat: Paris, France, 2004. [Google Scholar]
  66. Dercon, S. Growth and Shocks: Evidence from Rural Ethiopia. J. Dev. Econ. 2004, 74, 309–329. [Google Scholar] [CrossRef]
  67. Christidis, N.; Stott, P.A.; Brown, S.; Hegerl, G.C.; Caesar, J. Detection of Changes in Temperature Extremes during the Second Half of the 20th Century. Geophys. Res. Lett. 2005, 32. [Google Scholar] [CrossRef] [Green Version]
  68. Brisson, N.; Gate, P.; Gouache, D.; Charmet, G.; Oury, F.-X.; Huard, F. Why Are Wheat Yields Stagnating in Europe? A Comprehensive Data Analysis for France. Filed Crops Res. 2010, 119, 201–212. [Google Scholar]
  69. Peltonen-Sainio, P.; Jauhiainen, L.; Laurila, I.P. Cereal Yield Trends in Northern European Conditions: Changes in Yield Potential and Its Realisation. Field Crops Res. 2009, 110, 85–90. [Google Scholar] [CrossRef]
  70. Harsányi, E.; Bashir, B.; Alsilibe, F.; Alsafadi, K.; Alsalman, A.; Széles, A.; Bácskai, I.; Juhász, C.; Ratonyi, T.; Mohammed, S. Impact of Agricultural Drought on Sunflower Production across Hungary. Atmosphere 2021, 12, 1339. [Google Scholar] [CrossRef]
  71. Mokhtar, A.; He, H.; Alsafadi, K.; Mohammed, S.; Ayantobo, O.; Elbeltagi, A.; Abdelwahab, O.; Hongfei, Z.; Quan, Y.; Abdo, H.; et al. Assessment of the Effects of Spatiotemporal Characteristics of Drought on Crop Yields in Southwest China. Int. J. Climatol. 2021, 1–20. [Google Scholar] [CrossRef]
  72. Ministère de l’Agriculture et de l’Alimentation. Conjoncture Agreste 2003. Ministère de l’Agriculture et de l’Alimentation: Paris, France, 2003; p. 3. [Google Scholar]
  73. CCR. Note de Synthèse Sur Le Suivi de l’aide à l’assurance Multirisques Climatique Pour l’exercice 2019 Par CCR Pour Le Ministère de l’Agriculture et de l’Alimentation; CCR: Paris, France, 2003; p. 43. [Google Scholar]
Figure 1. Crossing the SAFRAN-grid with Graphic Plot Register for DOWKI computation at the departmental scale.
Applsci 12 02481 g001
Figure 2. Crop yield losses (%) for grassland, soft winter wheat, and winter barley at the national scale computed over the historical period 2000–2018 with the AGRESTE database.
Applsci 12 02481 g002
Figure 3. Damage function for grassland yield loss simulations: frequency of claims, percentiles 10 and 90, and average of yield losses according to the DOWKI values.
Applsci 12 02481 g003
Figure 4. Average grassland yield losses at the national scale (%) computed in the AGRESTE database and simulated by the model with DOWKI values.
Applsci 12 02481 g004
Figure 5. Average yield losses and percentile 10–90 on 100 simulations for the year 2000 and the year 2050 (RCP 8.5) for (a) soft winter wheat, (b) winter barley, and (c) grassland.
Applsci 12 02481 g005
Figure 6. Annual average evolution between the climate in 2000 and in 2050 of (a) DOWKI values, (b) yield losses of soft winter wheat, (c) yield losses of winter barley, and (d) grassland.
Applsci 12 02481 g006
Table 1. Best parameters used for the calibration of the model by crop.
ParametersAnnual Index Period ComputationExtreme Event ThresholdMinimum Cultivation Area
Grassland3rd 10 days in April–2nd 10 days in September−200 mm2 × 104
Winter barley3rd 10 days in April–1st 10 days in August−200 mm2 × 104
Soft winter wheat North of France3rd 10 days in April–1st 10 days in August −200 mm9 × 104
Soft winter wheat South of France3rd 10 days in April–1st 10 days in August−200 mm1.1 × 104
Table 2. False positives and false negatives.
False PositivesFalse Negatives
Adaptation of agricultural practices: modifying the sowing period or harvest period, choice of varietiesDevelopment and propagation of disease
Protection measures (irrigation)Combination of several climatic events, including droughts
Table 3. Average yield losses at the national scale for soft winter wheat, winter barley, and grassland for 10-year droughts for the climate in 2000 and the climate in 2050.
10-Year DroughtsAverage Yield Losses at the National Scale—Climate in 2000Average Yield Losses at the National Scale—Climate in 2050
Soft winter wheat4.2%7.4%
Winter barley5.3%9.5%
Grassland18.5%25.0%
Publisher’s Note: MDPI stays neutral with regard to jurisdictional claims in published maps and institutional affiliations.

