Article

Raman Spectroscopy of Individual Cervical Exfoliated Cells in Premalignant and Malignant Lesions

by
Mariana Sarai Silva-López
1,
César Arturo Ilizaliturri Hernández
2,
Hugo Ricardo Navarro Contreras
1,
Ángel Gabriel Rodríguez Vázquez
1,
Alejandra Ortiz-Dosal
3 and
Eleazar Samuel Kolosovas-Machuca
1,*
1
Coordinación para la Innovación y Aplicación de la Ciencia y la Tecnología (CIACYT), Universidad Autónoma de San Luís Potosí, 550-2a Sierra Leona Ave, San Luis Potosí 78210, Mexico
2
CIACYT-Facultad de Medicina, Universidad Autónoma de San Luís Potosí, 550-2a Sierra Leona Ave, San Luis Potosí 78210, Mexico
3
Doctorado Institucional en Ingeniería y Ciencia de Materiales (DICIM-UASLP), Universidad Autónoma de San Luis Potosí, 550 Sierra Leona Ave, San Luis Potosí 78210, Mexico
*
Author to whom correspondence should be addressed.
Appl. Sci. 2022, 12(5), 2419; https://doi.org/10.3390/app12052419
Submission received: 15 January 2022 / Revised: 19 February 2022 / Accepted: 21 February 2022 / Published: 25 February 2022
(This article belongs to the Topic Biomedical Photonics)

Abstract

:
Cervical cancer is frequent neoplasia. Currently, the diagnostic approach includes cervical cytology, colposcopy, and histopathology studies; combining detection techniques increases the sensitivity and specificity of the tests. Raman spectroscopy is a high-resolution technique that supports the diagnosis of malignancies. This study aimed to evaluate the Raman spectroscopy technique discriminating between healthy and premalignant/malignant cervical cells. We included 81 exfoliative cytology samples, 29 in the “healthy group” (negative cytology), and 52 in the “CIN group” (premalignant/malignant lesions). We obtained the nucleus and cytoplasm Raman spectra of individual cells. We tested the spectral differences between groups using Permutational Multivariate Analysis of Variance (PERMANOVA) and Canonical Analysis of Principal Coordinates (CAP). We found that Raman spectra have increased intensity in premalignant/malignant cells compared with healthy cells. The characteristic Raman bands corresponded to proteins and nucleic acids, in concordance with the increased replication and translation processes in premalignant/malignant states. We found a classification efficiency of 76.5% and 82.7% for cytoplasmic and nuclear Raman spectra, respectively; cell nucleus Raman spectra showed a sensitivity of 84.6% in identifying cervical anomalies. The classification efficiency and sensitivity obtained for nuclear spectra suggest that Raman spectroscopy could be helpful in the screening and diagnosis of premalignant lesions and cervical cancer.

1. Introduction

Cervical cancer is one of the most common neoplasia worldwide, with 659,847 new cases and 311,000 deaths per year [1]. Approximately 85% of these deaths occurred in limited-resource regions of the world. In 11 countries, cervical cancer is the leading cause of cancer deaths, and in 12 countries, it is the second cause of cancer deaths among women [2]. Each year in the Americas, an estimated 83,200 women are newly diagnosed, and 35,680 women die from this disease, with a significant proportion (52%) of patients under 60 years of age [3]. Cervical cancer is a disease with disorganized tissue growth due to the continuous proliferation of abnormal cells that can invade and destroy the tissues of the cervix. Some factors predispose a woman to cervical cancer, such as a high number of pregnancies, early onset of sexual life, immunosuppression, and smoking. However, a factor strictly necessary for developing the neoplasm is the continuous presence of persistent infection with high-risk Human Papillomavirus (HPV) [4]. HPV has tropism towards epithelial cells and causes infections in the skin (condylomas or warts) and mucous membranes (cervical lesions and cancer). There are more than 200 known HPV genotypes. They are classified as low-risk HPV (LR-HPV) and high-risk or oncogenic HPV (HR-HPV), depending on whether their infection can lead to cancer development [5,6,7,8,9]. Early diagnosis prevents mortality by detecting early-stage premalignant lesions or cervical intraepithelial neoplasia (CIN). The term CIN refers to cervical dysplasia, divided into 3 grades, 1, 2, and 3, where CIN1 corresponds to mild dysplasia or squamous intraepithelial lesions of low grade, CIN2 is a moderate dysplasia, and CIN3 defines severe dysplasia or cancer in situ (CIS), or squamous intraepithelial lesions of high grade [10,11]. The tests currently used to diagnose cervical dysplasia and cancer include Papanicolaou (Pap), colposcopy, and histopathology. These tests rely on the identification of cellular abnormalities caused by viral infection. The Pap test, also known as cervical cytology, is considered routine and initial screening. This test allows the identification of cytological abnormalities in the cervix from observing a sample of cells obtained from a cervical scraping with a cytobrush [10]. Colposcopy allows directly observing the cervix to identify premalignant lesions or cancer. Conversely, the gold standard in cervical cancer diagnosis is a biopsy (histopathology), which presents a specificity of 97–99% and a sensitivity of 90% [11]. The combination of tests improves detection, and therefore a better prognosis is expected.
In recent years, good results have been obtained in terms of specificity and sensitivity by Raman spectroscopy in detecting different types of cancer [12]. Raman spectroscopy is a dispersion technique that provides many molecule’s chemical and structural fingerprints, allowing their precise identification. The sample material is analyzed without special preparations or modification along the surface on which the analysis is carried out [13]. This technique is based on measuring the light scattered through a material or target sample when a monochromatic light beam strikes it. When exposing the sample to the beam of light, the molecules of this acquire energy and move to higher energy levels, producing vibrational and rotational movements that depend on the composition of the molecules and the strength of bonds between them, producing a characteristic spectral image [14]. In the spectrum produced, each band corresponds to a component of the sample; the position, intensity, displacement, and change in the shape of the bands provide structural information about the sample [15].
A previous study evaluated in vitro cervical tissue Raman spectra in different conditions. They reported that the overall accuracy of Raman spectroscopy for determining if a patient had cervical disease was higher than 99%. They also found subtle spectral differences between normal cervical epithelium and mild HPV changes (low-grade lesions), mainly in the region of 1334 cm−1 and 1082 cm−1, bands associated with the content of cellular DNA [15].
Other studies have described spectral differences using HPV positive and HPV negative cell lines. HPV negative (C33A) cells and HPV-positive (HeLa and SiHa) cells showed differences at amide I and amide III region, reporting a Raman spectroscopy classification efficiency of ~95 [16,17].
Many of the studies reported in the literature have focused on cell pellets instead of individual cells. There are also studies that explored Raman spectroscopic approach to discriminate malignant exfoliated cervical cell pellets. There has been reported a classification efficiency of about 79% and 78% for normal and abnormal smear, respectively, comparable to Pap test [18]; in the spectrum of normal cervical cells, bands corresponding to amide I, CH2 stretches, and ring proteins such as phenylalanine (1660, 1450 and 1002 cm−1) predominate; on the contrary, in the spectrum of abnormal cells, a predominance of heme and fibrin bands is observed (1620 and 1570 cm−1) [18]. Some studies have examined individual cells and explored the biochemical patterns in cervical cells’ nucleus and cytoplasm. Raman spectroscopy applied to exfoliated cervical cells may discriminate specific biochemical patterns identifying cell types, premalignant stages, and cancer [16,18,19].
Other studies have evaluated the bands corresponding to specific cellular components, such as the one carried out in 2020, in which the decrease in the intensity of bands corresponding to glycogen in cervical cells infected with HPV was observed, which was associated with an increase in energy needs for viral protein synthesis and replication [20]. In a recent study (2021), spectral differences were obtained that allowed discriminating between samples with active and non-active HPV infection, which was based predominantly on changes such as the increase in the intensity of nucleic acid bands (1485 and 1580 cm−1) and decreased glycogen bands (1334 and 1380 cm−1), changes caused by overexpression of viral proteins in cells with active viral infection [21].
In a study by Wang et al. (2021), spectral differences between cervical tissue of different grades of CIN, squamous cell carcinoma, and adenocarcinoma were elucidated, observing Raman bands corresponding to lipids, amino acids, collagen, and cytosine of greater intensity depending on the degree of inflammation of the tissue, being greater in high-grade lesions and cancer [22].
Another study compared spectral characteristics between cervical tissue infected with HPV and tissue from invasive carcinoma using SERS, with gold nanoparticles as substrate (Supplemental Material) [23]. Spectral differences were reported in the region 920–1140 cm−1 (lower intensity in carcinogenic vs. HPV). SERS signals of DNA and amide III bands in cancer tissue are stronger than VPH tissue. Invasive carcinoma also shows an increment in the intensity of the nucleic acids bands and amide II and III region at 1228 and 1254 cm−1 and 1558 cm−1. The increment in nucleic acids and proteins is a reflection of an increased proliferation rate in tumor cells. They differentiate the presence of cervical cancer at an early stage [23]. In another SERS approach, AuNP 40–45 nm were mixed with cervical exfoliated cells CIN 1,2, and 3. Authors found spectral differences and an average diagnostic accuracy of 94%, 74%, and 92% of the three clinical grades CIN1, CIN2, and CIN3 [24]. SERS has also been proposed for the identification of cancer stages and the presence of biomarkers using nanotags [25].
In this study, we aimed to examine whether Raman spectroscopy may be applied to distinguish healthy and CIN cells in cervical exfoliation samples.

2. Materials and Methods

2.1. Cervical Sample Collection

We collected samples of cervical exfoliation from 81 women attending the Dr. Pedro Bárcenas Hiriart Family Medicine Clinic and Simplified Surgery Center (CMF + CECIS) in San Luis Potosí, S.L.P., Mexico; in the Preventive Medicine and the Dysplasia Units. Before taking samples, the patients were informed about the project’s aim. For those accepting to participate in the study, written informed consent was obtained. The Research Ethics Committee of the Institute for Security and Social Services for the State Workers (ISSSTE) Clinic in San Luis Potosí approved the protocol (registration number 006-18 C.I). This study was performed according to the scientific and ethical principles regarding human experimentation established by the Declaration of Helsinki, the Good Clinical Practice Guidelines for human studies, the Nuremberg Code general charter of patients’ rights; in addition to the recommendations issued by the Federal Law on the protection of personal data held by individuals and NOM-012-SSA3-2012, and Official Mexican Standard NOM-004-SSA3-2012, of clinical records. Twenty-nine samples were obtained from healthy patients, which, according to pathology reports, were negative for cervical lesions. The remaining 52 samples were positive for lesion (30 CIN1, 13 CIN2, and 9 CIN3/CIS), so they were included in the “CIN” group, which indicates the presence of a cervical lesion of any grade. Samples for this study were collected from patients before receiving treatment. The cervical exfoliation samples were obtained using a cytobrush and placed in a glass vial containing 20 mL of PreservCyt® Solution (Hologic, Inc., Marlborough, MA, USA) to preserve the sample and stored at 4 °C until processing.

2.2. Sample Preparation

We gently centrifuged an aliquot of the cervical cytology sample (at 600 g) to avoid lysis of the cells. In this process, we obtained a pellet. Excess blood in the sample may interfere with the Raman spectrum; thus, the samples were first inspected and scored for blood in samples using a visual pathology/cytology scale: grade 0 no blood presence, grade 1 corresponding to low blood, grade 2, heavy blood, and grade 3, excessive blood [26]. Then, we remove blood from the samples. We treated Grade 0 and 1 samples with H2O2 for 30 s, neutralizing the effect with PreservCyt (a methanol-based fixative solution, consisting of a mixture of water and methanol, 40–70% and 30–60%, respectively) [26]. Grade 2 and 3 samples were treated with red blood cell lysis buffer for 15 min, followed by two-time cycles of saline wash and centrifugation; then, pellets were treated with H2O2. According to this evaluation, 22 samples in the premalignant/malignant group (CIN2 and CIN3 samples) received treatment with erythrocyte (RBC) lysis buffer and H2O2 (30%) to eliminate any residual blood that could interfere with the measurement. The samples corresponding to normal cells and CIN1 29 samples (healthy group) and 30 samples (CIN1 group) were treated only with H2O2.
We spread the cell pellet on glass slides. We obtained the Raman spectrum using the XploRA plus Raman system (Jobin Yvon Technology) with an Olympus BX41 built-in microscope (model BX41TF). Measurement conditions in the Raman spectrophotometer were like those described by Behl I. et al. [27]. The objective used for the detection of the Raman spectrum was 100×. We used a 532 nm laser to excite the Raman scattering response; the acquisition time was 30 s for 2 accumulations. Full laser beams were applied to the sample, focusing on a field of ~1 µm; the spectrometer gating was 1200 groves/mm. The Raman signals were calibrated and recorded using a LO optical phonon spectrum (with silicon mode at 520.7 cm1). For each sample, 3 measurements of both the cytoplasm and the nucleus were obtained in different regions of interest from 8 to 10 different cells depending on the sample quality (in some samples, the number of cells present was low, in which case we obtained measurements of at least 3 cells). The spectral region selected for the study was 800–1800 cm1 since it constitutes the fingerprint region for most biological samples [28]. We used LabSpec 6 software (Horiba Scientific, Ltd., Kyoto, Japan) to control the spectrophotometer and visualize the Raman spectra.

2.3. Data Analysis

Raman spectra were processed using the Vancouver Raman Algorithm program (BC Cancer Agency & the University of British Columbia, Vancouver, BC, Canada) to remove background fluorescence. We performed the spectra analysis using OriginPro 2016 64Bit (Graphing and analysis, OriginLab Corporation, Northampton, MA, USA), where the data were normalized. We obtained the resulting spectrum for each sample, calculating the average of both cytoplasm and nucleus spectra and then the average spectrum for each study group. Permutational Multivariate Analysis of Variance (PERMANOVA) was used to analyze the associated variability of bands (or signals) within the two study groups (“Healthy” and “CIN”) and then tested for statistically significant differences (the analysis was based on Euclidean distances and 9999 permutations). When we identified significant differences in the patterns (p < 0.05), we chose the similarity percentage (SIMPER) subroutine to identify bands that contributed the most to the observed differences (up to 50%). Metric multidimensional scaling (MDS) plots and bootstrap averages (centroids and 95% confidence levels of 9999 permutations) were constructed to display clustering patterns among spectra identified by the PERMANOVA.
Conversely, the Canonical Analysis of Principal Coordinates (CAP) with cross-validation and test significance using permutations (n = 9999) was used to construct a predictive model of classification (discriminant analysis and canonical correlation, δ) of the spectra for the two groups: healthy and CIN patients. This was based on the main spectral characteristics verified from the PERMANOVA analysis and the percentage of correct and incorrect classification of the samples based on the pathology results (the gold standard for diagnosis of this neoplasia). This analysis was performed for both the Raman spectra from the cytoplasm and the nucleus. Multivariate analyses were performed using the PRIMER 7 + PERMANOVA add-on software package v7.0.13 and v1.0.6 (PRIMER-E, Auckland, New Zealand).

3. Results

Representative Raman spectra of the cytoplasm and cervical cell nuclei obtained from cervical exfoliation samples from healthy and CIN patients are shown in Figure 1A,B.
The intensity of the Raman scattering in the cytoplasm and nucleus was increased in CIN patients compared to healthy patients. The main differences were in bands corresponding to proteins and nucleic acids. In the Raman spectra obtained from the cytoplasm of CIN patients compared to healthy patients, several characteristic bands stood out: 1077 cm−1 (symmetric PO2 stretching of DNA), 1105 cm−1 (cytosine), 1320 cm−1 (guanine (RNA/DNA), -CH groups in protein and carbohydrates), 1440 cm−1 (CH2 proteins and lipid bending), 1546 cm−1 (amide II), 1600 cm−1 (adenine, guanine), and 1603 cm−1 (C=C phenylalanine and tyrosine bond).
The Raman spectra were normalized using the highest band of the entire set of samples as the reference value, corresponding to a high-grade lesion (Raman shift of 1440 cm−1, in cytoplasm and nucleus). The nucleic acid bands of CIN patients also present increased intensities at 861 cm−1 (phosphate group), 1320 cm−1 (RNA/DNA guanine), and 1603 cm−1 (adenine and guanine). In addition, some bands corresponded to Raman assignments of lipids and carbohydrates (1396 and 1440 cm−1), and another band at 1546 cm−1 and 1650 cm−1 corresponded to Amide II and Amide I, collagen, and protein, respectively [13,28,29,30].
Conversely, when analyzing the spectra corresponding to the nucleus, the bands in which their intensity increased were similar to those of the cytoplasmic spectra. Still, some frequently appear red-shifted and correspond to proteins and lipids. Raman frequencies, as well as the molecular characteristics assigned to them, are shown in Table 1.
The SIMPER analysis yielded the main bands contributing to 50% of the statistical significance. Some can be seen to increase in intensity in Figure 1A. These bands were: 1077, 1108, 1320, 1440, 1546, 1603, and 1608 cm−1. Table 1 summarizes the Raman assignment of all observed bands, whether in the cytoplasm or the nucleus. In addition, the differences in the spectra obtained from the cell nucleus were significant (Pseudo F = 4.60, p = 0.0039). The bands contributing 50% of the significant difference were the following: 861, 1323, 1394, 1440, 1574, 1600, and 1648 cm−1 (Figure 1B).
Figure 2 shows two graphs corresponding to MDS and bootstrap averages of the Raman cytoplasm and nucleus spectra of the two groups of patients studied: healthy patients (blue) and patients with a cervical lesion or CIN (red).
In both graphs, the groups are separate and distinct. There is more significant variability in CIN samples (red) compared to healthy patient samples (blue). This could be due to two interrelated factors. The first could indicate that samples originating from a high-grade lesion such as CIN2 or CIN3/CIS and reflects the infection of HPV in the affected cervical cells, as indicated by the increasing variability in the spectral response, that is, higher dispersion due to more significant impact at the cellular-molecular level given the infection status of the cells. A second factor contributing to the variability is that patients with lesions were grouped in a single group, and samples with high-grade lesions may exhibit more variability than the CIN1 samples, a lesion in which minor cell abnormalities are expected to occur. A narrower dispersion is observed in the group of samples from healthy patients (blue), where there are no cellular abnormalities due to the absence of the HPV effect.
When carrying out the discriminant analysis (CAP, Figure 3), similar predictive power or correct classification of the samples in healthy and CIN patients was obtained for both the cytoplasm (76.5%, δ = 0.567, p = 0.0002) and the nucleus (82.7%, δ = 0.767, p = 0.0001).
For the cytoplasmic samples, of the total number of patients who were true negatives (29 healthy from the histopathology) in the healthy group, Raman spectroscopy identified 23, 79.3% of correct classification from the CAP analysis. In contrast, 13 patients of 52 from the CIN were classified by CAP analysis as (false) negatives (incorrectly classified as healthy). From the histopathology results, some samples had some degree of lesion. Overall, the percentage of incorrect classification was 23.5%. Conversely, the analysis of the nuclei showed successes and errors in both healthy and CIN patients in their derived taxonomy. Of the 29 healthy patients, 6 were classified as affected (79.3% correct); as for the patients with CIN, 8 were incorrectly classified as healthy (15.4%), while 44 of 52 patients with CIN (results according to histopathology) were correctly classified with the presence of a cervical lesion (84.6%). The results are shown in Table 2. We include a comparative analysis with other reports in Supplemental Material.
If the patients with the disease are classified into subgroups based on the different degrees of the cervical lesion (CIN1, CIN2, and CIN3/CIS) and the healthy patients are subdivided into two subgroups: no HPV detected and those with viral latency (presence of HPV but no abnormalities in cervical tissue), higher intensity is observed in bands corresponding to proteins, lipids, and nucleic acids in patient samples presenting cervical lesions (CIN) compared to bands of the Raman spectra of healthy patients and those with viral latency.
Similar results were obtained for both the Raman spectra obtained from the cytoplasm and the nucleus, Figure 4A,B.
The bands with differences in intensity between groups correspond to protein and lipid components, like collagen and amide (Raman bands at 1320, 1396, 1440, and 1546 cm−1). Other essential differences are presented for DNA/RNA components such as cytosine, guanine, adenine, and thymine in the Raman bands 1320 and 1603 cm−1.
Therefore, it is necessary to increase the number of samples for each study group to obtain a better comparison and thus to be able to establish a fingerprint for healthy patients and another for different degrees of cervical lesions.

4. Discussion

When comparing the spectra of cervical samples of healthy patients with those of patients with cervical lesions, we observed differences in some bands, which mainly involve an increased intensity in the spectra for CIN patients. Furthermore, the increase in Raman spectroscopy band intensity was proportional to the degree of lesion present, the intensity being greater in CIN2 and CIN3/CIS lesions than in CIN1. In the literature, similar differences have already been reported in the Raman spectra of samples from healthy and cervical cancer patients, with increased intensities in the latter; most studies have focused on cell lines such as CaSki or HeLa or have used cell pellets instead of individual cells [17,18,31].
In the present study, bands that mark differences between samples of healthy patients and patients with a cervical lesion are those that correspond to lipid and protein cellular components (1077, 1396, 1440, 1546, 1603, 1650 cm−1) and nucleic acids (861, 1105, 1323, 1600 cm−1). Our Raman results were spectrally very similar in the cytoplasm and the nucleus. Previous studies reported Raman fingerprints for healthy cervical cells [13,28]. In a study conducted by Kearney et al. [19] in spectra from a high-grade lesion, a higher signal was obtained for nucleic acids (1485 and 1580 cm−1) in the nucleus and nucleic acids and proteins (1450 and 1650 cm−1) in the cytoplasm.
In our study, the Raman spectra analyzed derive from the cytoplasm and nucleus of individual cervical exfoliated cells of the squamous epithelium’s intermediate and superficial stratum. The superficial cells are 40–60 µm in diameter and are flattened, thin, and generally polygonal in outline; for its part, the nucleus is circular, small (~6 µm), and located in the center of the cell. On the other hand, the intermediate cells are of very similar size or a little smaller than the superficial cells; their shape is more rounded, cytoplasm slightly thicker than that of the superficial cells; the nucleus is central, rounded, and its size is ~8 µm. In the presence of any premalignant lesion (CIN), cellular changes occur that vary depending on the degree of lesion present, being more evident and to a greater extent in high-grade lesions; some of the changes are nuclear increase that results in an alteration of the nucleus/cytoplasm ratio, anisonucleosis, or irregular nuclear contour [32]. The intermediate and superficial cells are in a state of differentiation compared to parabasal and basal cells. The lower layers of the squamous epithelium are stem cells where HPV entry occurs and the infection begins. These cells are in the process of maturation, where the highest expression of HPV oncogenes E6/E7 and other late HPV [33] genes occur. The E6/E7 proteins inhibit critical cellular processes of DNA damage repair or its regulation by interfering with the functions of tumor suppressor genes such as pRB through E7 activity or by degrading proteins that activate signaling cascades involved in the repair of damaged DNA before the synthesis or replication of higher amounts of mutated genetic material, via the effects of E6 on p53 [34,35]. In addition to the higher expression of E6/E7 genes in the intermediate and superficial cells, an increased expression of late genes also occurs, such for the genes encoding L1 and L2 proteins, which form the viral capsid [36,37]. Therefore, there is an increase in the transcription, translation, and assembly of viral proteins in these cells. The results obtained in this study show that the increased signals in Raman spectroscopy bands of samples from patients with cervical lesions corresponded to proteins originating from the increased expression of genes that interfere with the repair and control processes of protein synthesis, as well as increased expression of genes encoding the viral structural proteins.
The increase in viral protein expression plays an essential role in the activation of factors that stimulate the proliferation of epithelial cells of the basal stratum, allowing the dysregulated growth of the epithelium and thus, extending the lesion [37,38]. These metabolic alterations explain the Raman spectra obtained.
In this study, bands corresponding to proteins had augmented intensity, which correlated to the degree of the cervical lesion. For example, the band intensity was higher in CIN2 and CIN3/CIS than in CIN1 because CIN2 and CIN3/CIS are higher degree lesions, where there is a higher expression of viral genes and therefore, the concentration of proteins, increasing the intensity of the corresponding bands in the Raman spectra. The intensity of protein bands increases in the nucleus since the virion assembly is carried out in this compartment. Therefore, the proteins are concentrated after their translation and before assembly [37,38].
The increment in the intensity of the bands corresponding to guanine and adenine, components of DNA and RNA, in the Raman spectra of samples from patients presenting both nuclear and cytoplasmic lesions, could be due to the synthesis of viral DNA (a circular, double-stranded form of DNA virus) [37,38]. In the nuclear compartment of the lower basal and suprabasal layers, this synthesis proceeds more slowly, with viral episomal replication occurring from 50 to 100 copies per cell. Still, in the upper layers of intermediate and superficial cells, the synthesis of the viral genome is increased (up to 1000 copies per cell) [37]. As the severity of the lesion progresses, as in CIN3/CIS (cancer in situ), the virus can insert part of its genome into that of the host cell (promoter P67, E6, and E7, which occurs in the nucleus), thus allowing higher viral expression and malignization [38].
Conversely, in the cytoplasm, the increased intensity of the nucleic acid bands in the Raman spectra could be explained because adenine and guanine are components of the viral DNA and RNA, which is expressed in the cells as mRNA. In the HPV-infected cells, in addition to the production of healthy cellular proteins, viral mRNA is also expressed and leads to new viral proteins [38].
The CIN group shows higher dispersion signals, indicating that both low and high-grade lesion patients were included in the same group. The HPV virus’ effects on the epithelium cells also cause changes at the intracellular level.
According to the discriminant analysis, the powers of classifying a sample as healthy or presenting a CIN using the measurements obtained from the cytoplasm or nucleus were 76.5% and 82.7%, respectively. It is essential to underline that in our study, the measurements and results obtained derived directly from individual cell compartments, that is, the cytoplasm and nucleus of single cells. Our findings are similar to previous studies, such as by Rubina Shaik. et al., where the measurements on cell pellets achieved an efficiency of classification of ~79% [18]. In our study, the classification efficiency in the nuclear measurements was near 80% (see Supplementary Material).
In contrast to our study findings, Rubina S. et al. in 2015 and Woolford L. in 2017 [16,39] reported a more substantial classification efficiency. However, while the authors used cell lines in these studies, our study was carried out on clinical samples. Furthermore, other studies, including that by Zheng C. et al. (2019), report excellent precision (~93.0%), despite the type of sample used for the spectroscopy measurements, tissue and not cells [40].
The percentage of incorrect classification provided by the SIMPER analysis in this study was attributed to “healthy patients” with low-grade cervical lesions or CIN1, a stage where there are still no marked differences at the molecular/cellular level compared with the present non-affected cell. Nonetheless, good classification power was achieved for samples from patients with CIN, with good sensitivity (84.6%, nucleus).
It is important to note that Raman spectroscopy included in the multivariate analysis (PERMANOVA, SIMPER, and CAP analysis) of the nuclear spectra observed from healthy and CIN patients resulted in a specificity of 79.3% and a sensitivity of 84.6% (Table 2). In addition, the predictive power obtained from the Raman measurements of both the cytoplasm and the nucleus (76.5% and 82.7%, respectively) is similar to those previously reported in studies conducted on cell pellets (~79%).
Comparing the Raman spectra by separating the samples into five groups, healthy, viral latency, CIN1, CIN2, and CIN3/CIS, there is a corresponding increase in the intensity in bands of samples from cervical lesion compared to the spectra of healthy patients and with viral latency.
Significant differences were found in the intensity of some bands in the spectra from samples with cervical lesions compared to the spectra of healthy samples and those with viral latency. Furthermore, this increase in the intensity of some bands seems to be proportional to the degree of a cervical lesion, being more intense in CIN2 and CIN3.
The spectra corresponding to viral latency in Figure 4A,B are very similar to that of healthy samples. The objective of separating the spectra of healthy samples from those of viral latency was to determine if in the viral latency state there would be cellular changes due to the viral action that could be expressed in the Raman spectrum even when no morphological cellular modifications were observed through cytological diagnostic methods. However, even when the virus is present, it does not necessarily cause visible damage to cervical tissue. As we show in these figures, no significant spectral differences were observed when comparing the spectra of samples from healthy patients with those of viral latency (Figure 4A,B).
In this study, we observe differences in band intensities in Raman spectra of patients with a cervical lesion, particularly in high-grade lesion samples, compared to healthy patients. Additionally, the potential of the Raman spectroscopy technique to correctly classify cytology or cervical exfoliation samples into healthy patients and CIN patients, that is, with some degree of the cervical lesion, was evaluated. The collection and analysis of the Raman spectra used to assess the cytoplasm and nucleus of single cervical cell preparations were performed on 81 samples. The sensitivity and the classification power were 75% and 76.5%; respectively, according to the PERMANOVA and SIMPER analysis of the Raman spectrum bands obtained from the cytoplasm, and 84.6% and 82.7%, respectively, according to the examination of the spectra of the cell nucleus. These results were similar to the sensitivity reported for the Pap test (74–96%) and the classification efficiency of Raman studies on cell pellets (~79%). In addition, Raman spectroscopy showed good sensitivity (84.6%), which would encourage its application in the future as a support method to existing diagnostic approaches for the detection of cervical lesions, thus reducing the false-negative rate and avoiding delays in diagnosis and therefore in treatment and prognosis. The application of this technique in the detection of CINs and cervical cancer would have the advantage of being carried out on cervical exfoliation, which is a type of sample that is obtained routinely in the initial screening in the diagnosis; therefore, it is possible to perform the two studies, Papanicolaou and Raman measurements, from a single sample. It should be highlighted that this study was carried out on individual cells of patient samples, and the Raman measurements were taken directly from the cytoplasmic and nuclear cellular compartments, which allowed to define spectral differences corresponding to the components and processes in healthy cervical cells and those cells with abnormalities due to viruses. Finally, this approach allows performing the test on cervical exfoliation samples and obtaining the Raman spectra without destroying the sample and without complicated preparation processes.
There are some limitations in this study. The quality of the cervical sample is critical to conduct proper Raman measurements, and this partially depends on the trained personnel that obtains the smear. The presence of blood in the specimen is a major cause of errors in the spectral analysis. Bleeding was observed during the obtention of a cancerous sample but also in non-malignant conditions. Spectra of abnormal specimens show heme and fibrin features, and this can lead to false interpretations [19]. To solve this problem, samples with little or no evidence of blood were treated with H2O2, and samples with the macroscopic presence of blood were treated with red blood corpuscles lysis buffer in an attempt to eliminate the risk of misinterpretations in the spectral analysis.
Another limitation is the sample size. It is necessary to increase the number of samples for each study group to obtain a better comparison and thus to be able to establish a fingerprint for healthy cells and for different degrees of cervical lesions.

5. Conclusions

Raman spectroscopy is a technique that could correctly classify cytology or cervical exfoliation samples of patients with premalignant/malignant lesions. The collection and analysis of the Raman spectra used to assess the cytoplasm and nucleus of single cervical cell preparations was performed. We found spectral differences in vibrational modes of carbohydrates, proteins, lipids, and nucleic acids. The differences in proteins (bands at 914, 942, 1243, 1440, 1648 cm−1) and in nucleic acids (bands at 992, 1077, 1323, 1574, 1600 cm−1) probably reflect the increased expression of oncogenes and oncoproteins in cancer cervical cells. On the discriminant analysis, cytoplasm spectra allow a classification efficiency of 76.5%. Our findings suggest that Raman spectroscopy of the nucleus of individual cervical cells may represent an objective screening method with a specificity of 79.3%, a sensitivity of 84.6%, and predictive power of 82.7% for identifying patients with cervical premalignant and malignant lesions. The application of this technique has the advantage that the destruction of the sample or complicated preparation processes are not necessary. Another advantage is that, since it is being carried out on cervical exfoliation samples, obtained routinely in cancer screening, it is possible to perform Pap and Raman measurements from a single sample. The measurements recorded in the cytoplasm and nucleus of individual cells allowed to define spectral differences corresponding to the components of cell biochemical processes in an objective, fast, and reproducible way. Further research is needed to encourage single-cell Raman spectroscopy application in the future as a support method to existing diagnostic approaches, reducing false-negative rates of current screening methods and avoiding delays in diagnosis and treatment of cervical cancer, thus improving prognosis.

Supplementary Materials

The following supporting information can be downloaded at: https://www.mdpi.com/article/10.3390/app12052419/s1, Table S1: Raman Spectroscopy Studies on Cervical Cells for Cervical Cancer Diagnosis. References [41,42,43] are cited in the supplementary materials.

Author Contributions

Conceptualization, E.S.K.-M., Á.G.R.V. and H.R.N.C.; methodology, M.S.S.-L., E.S.K.-M. and H.R.N.C.; software, C.A.I.H.; validation, M.S.S.-L., C.A.I.H. and E.S.K.-M.; formal analysis, C.A.I.H.; investigation, M.S.S.-L. and A.O.-D.; resources, E.S.K.-M., Á.G.R.V. and H.R.N.C.; data curation, M.S.S.-L. and C.A.I.H.; writing—original draft preparation, M.S.S.-L.; writing—review and editing, A.O.-D. and E.S.K.-M.; visualization, A.O.-D.; supervision, E.S.K.-M., Á.G.R.V. and H.R.N.C.; project administration, E.S.K.-M., Á.G.R.V. and H.R.N.C.; funding acquisition, E.S.K.-M., Á.G.R.V. and H.R.N.C. All authors have read and agreed to the published version of the manuscript.

Funding

M.S.S.-L. and A.O.-D. acknowledge the financial support of CONACYT through a Ph.D. scholarship 479977. This document was edited for correct English language usage by qualified native English-speaking editors at AIP Author Services using UASLP funds. This research did not receive any specific grant from funding agencies in the public, commercial, or not-for-profit sectors.

Institutional Review Board Statement

The study was approved by the Institutional Review Board and the Research Ethics Committee of the Institute for Security and Social Services for the State Workers (ISSSTE) Clinic in San Luis Potosí (protocol code 006-18 CI). This study was conducted in accordance with the scientific and ethical principles regarding human experimentation established by the Declaration of Helsinki, the Good Clinical Practice Guidelines for human studies, the Nuremberg Code general charter of patients’ rights; in addition to the recommendations issued by the Federal Law on the protection of personal data held by individuals and NOM-012-SSA3-2012, and Official Mexican Standard NOM-004-SSA3-2012, of clinical records, as stated in Material and Methods section.

Informed Consent Statement

Informed consent was obtained from all subjects involved in the study.

Data Availability Statement

Not applicable.

Acknowledgments

We thank the module of preventive medicine and dysplasia, “Pedro Bárcenas Hiriart,” for allowing us to carry out the investigation protocol and obtaining samples and to the Laboratory of Human and Viral Genomics for allowing the use of its facilities. The authors acknowledge to Laboratorio Nacional de Análisis Físicos, Químicos y Biológicos-LANAFQB-UASLP where the Raman measurements for this study were performed. M.S.S.-L. acknowledges the financial support of CONACYT through a Ph.D. scholarship 479977. This document was edited for correct English language usage by qualified native English-speaking editors at AIP Author Services using University funds. This research did not receive any specific grant from funding agencies in the public, commercial, or not-for-profit sectors.

Conflicts of Interest

The authors declare no conflict of interest. Authors declare that they have no known competing financial interests or personal relationships that could have influenced the work reported in this paper.

References

  1. World Health Organization. WHO Technical Guidance and Specifications of Medical Devices for Screening and Treatment of Precancerous Lesions in the Prevention of Cervical Cancer. 2020. Available online: https://www.who.int/publications-detail/9789240002630 (accessed on 5 February 2020).
  2. Bhatla, N.; Singhal, S. Primary HPV screening for cervical cancer. Best Pract. Res. Clin. Obs. Gynaecol. 2020, 65, 98–108. [Google Scholar] [CrossRef]
  3. Pan American Health Organization. Plan of Action for Cervical Cancer. Prevention and Control 2018–2030. 2018. Available online: https://www.paho.org/en/documents/plan-action-cervical-cancer-prevention-and-control-2018-2030 (accessed on 20 February 2020).
  4. Wuerthner, B.A.; Avila-Wallace, M. Cervical cancer: Screening, management, and prevention. Nurse Pract. 2016, 41, 18–23. [Google Scholar] [CrossRef]
  5. Ramos, I.R.; Meade, A.D.; Ibrahim, O.; Byrne, H.J.; McMenamin, M.; McKenna, M.; Malkin, A.; Lyng, F.M. Raman spectroscopy for cytopathology of exfoliated cervical cells. Faraday Discuss. 2016, 187, 187–198. [Google Scholar] [CrossRef] [Green Version]
  6. Gravitt, P.E.; Peyton, C.L.; Alessi, T.Q.; Wheeler, C.M.; Coutlée, F.; Hildesheim, A.; Schiffman, M.H.; Scott, D.R.; Apple, R.J. Improved Amplification of Genital Human Papillomaviruses. J. Clin. Microbiol. 2000, 38, 357–361. [Google Scholar] [CrossRef]
  7. Sichero, L.; Picconi, M.A.; Villa, L.L. The contribution of Latin American research to HPV epidemiology and natural history knowledge. Braz. J. Med. Biol. Res. 2020, 53, 1–10. [Google Scholar] [CrossRef] [Green Version]
  8. Gustavsson, I.; Aarnio, R.; Myrnäs, M.; Hedlund-Lindberg, J.; Taku, O.; Meiring, T.; Wikström, I.; Enroth, S.; Williamson, A.-L.; Olovsson, M.; et al. Clinical validation of the HPVIR high-risk HPV test on cervical samples according to the international guidelines for human papillomavirus DNA test requirements for cervical cancer screening. Virol. J. 2019, 16, 107. [Google Scholar] [CrossRef] [Green Version]
  9. Wai, K.C.; Strohl, M.P.; Van Zante, A.; Ha, P.K. Molecular diagnostics in human papillomavirus-related head and neck squamous cell carcinoma. Cells 2020, 9, 500. [Google Scholar] [CrossRef] [Green Version]
  10. Cibas, E.S. Cervical, and Vaginal Cytology. In Cytology Diagnostic Principles and Clinical Correlates; Elsevier: Amsterdam, The Netherlands, 2009; Chapter 1; pp. 1–57. [Google Scholar]
  11. Bhatla, N.; Singhal, S.; Saraiya, U.; Srivastava, S.; Bhalerao, S.; Shamsunder, S.; Chavan, N.; Basu, P.; Purandare, C.N. Screening and management of preinvasive lesions of the cervix: Good clinical practice recommendations from the Federation of Obstetric and Gynecologic Societies of India (FOGSI). J. Obstet. Gynaecol. Res. 2020, 46, 201–214. [Google Scholar] [CrossRef]
  12. Auner, G.W.; Koya, S.K.; Huang, C.; Broadbent, B.; Trexler, M.; Auner, Z.; Elias, A.; Mehne, K.C.; Brusatori, M.A. Applications of Raman spectroscopy in cancer diagnosis. Cancer Metastasis Rev. 2018, 37, 691–717. [Google Scholar] [CrossRef] [Green Version]
  13. Lyng, F.M.; Traynor, D.; Ramos, I.R.M.; Bonnier, F.; Byrne, H.J. Raman spectroscopy for screening and diagnosis of cervical cancer. Anal. Bioanal. Chem. 2015, 407, 8279–8289. [Google Scholar] [CrossRef] [Green Version]
  14. Novikova, T. Optical techniques for cervical neoplasia detection. Beilstein J. Nanotechnol. 2017, 8, 1844–1862. [Google Scholar] [CrossRef] [Green Version]
  15. Keller, M.; Kanter, E.M.; Lieber, C.A.; Majumder, S.K.; Hutchings, J.; Ellis, D.L.; Beaven, R.B.; Stone, N.; Mahadevan-Jansen, A. Detecting temporal and spatial effects of epithelial cancers with Raman spectroscopy. Dis. Markers 2008, 25, 323–337. [Google Scholar] [CrossRef] [Green Version]
  16. Rubina, S.; Krishna, C.M. Raman spectroscopy in cervical cancers: An update. J. Cancer Res. Ther. 2015, 11, 10–17. [Google Scholar]
  17. Ostrowska, K.M.; Malkin, A.; Meade, A.; O’Leary, J.; Martin, C.; Spillane, C.; Byrne, H.J.; Lyng, F.M. Investigation of the influence of high-risk human papillomavirus on the biochemical composition of cervical cancer cells using vibrational spectroscopy. Analyst 2010, 135, 3087–3093. [Google Scholar] [CrossRef] [Green Version]
  18. Rubina, S.; Amita, M.; Kedar, K.D.; Bharat, R.; Krishna, C.M. Raman spectroscopy study on the classification of cervical cell specimens. Vib. Spectrosc. 2013, 68, 115–121. [Google Scholar] [CrossRef]
  19. Kearney, P. Raman spectral signatures of cervical exfoliated cells from liquid-based cytology samples. J. Biomed. Opt. 2017, 22, 105008. [Google Scholar] [CrossRef] [Green Version]
  20. Sitarz, K.; Czamara, K.; Bialecka, J.; Klimek, M.; Zawilinska, B.; Szostek, S.; Kaczor, A. HPV Infection Significantly Accelerates Glycogen Metabolism in Cervical Cells with Large Nuclei: Raman Microscopic Study with Subcellular Resolution. Int. J. Mol. Sci. 2020, 21, 2667. [Google Scholar] [CrossRef]
  21. Traynor, D.; Martin, C.; White, C.; Reynolds, S.; D’Arcy, T.; O’Leary, J.; Lyng, F. Raman Spectroscopy of Liquid-Based Cervical Smear Samples as a Triage to Stratify Women Who Are HPV-Positive on Screening. Cancers 2021, 13, 2008. [Google Scholar] [CrossRef]
  22. Wang, J.; Zheng, C.-X.; Ma, C.-L.; Zheng, X.-X.; Lv, X.-Y.; Lv, G.-D.; Tang, J.; Wu, G.-H. Raman spectroscopic study of cervical precancerous lesions and cervical cancer. Lasers Med. Sci. 2021, 36, 1855–1864. [Google Scholar] [CrossRef]
  23. Ceja-Fdez, A.; Carriles, R.; González-Yebra, A.L.; Vivero-Escoto, J.; de la Rosa, E.; López-Luke, T. Imaging and SERS Study of the Au Nanoparticles Interaction with HPV and Carcinogenic Cervical Tissues. Molecules 2021, 26, 3758. [Google Scholar] [CrossRef]
  24. Karunakaran, V.; Saritha, V.N.; Joseph, M.M.; Nair, J.B.; Saranya, G.; Raghu, K.G.; Sujathan, K.; Kumar, K.S.; Maiti, K.K. Diagnostic spectro-cytology revealing differential recognition of cervical cancer lesions by label-free surface enhanced Raman fingerprints and chemometrics. Nanomedicine 2020, 29, 102276. [Google Scholar] [CrossRef]
  25. Karunakaran, V.; Saritha, V.N.; Ramya, A.N.; Murali, V.P.; Raghu, K.G.; Sujathan, K.; Maiti, K.K. Elucidating Raman Image-Guided Differential Recognition of Clinically Confirmed Grades of Cervical Exfoliated Cells by Dual Biomarker-Appended SERS-Tag. Anal. Chem. 2021, 93, 11140–11150. [Google Scholar] [CrossRef]
  26. Traynor, D.; Duraipandian, S.; Martin, C.M.; O’Leary, J.J.; Lyng, F.M. Improved removal of blood contamination from ThinPrep cervical cytology samples for Raman spectroscopic analysis. J. Biomed. Opt. 2018, 23, 055001. [Google Scholar] [CrossRef]
  27. Behl, I.; Calado, G.; Ibrahim, O.; Malkin, A.; Flint, S.; Byrne, H.J.; Lyng, F.M. Development of methodology for Raman microspectroscopic analysis of oral exfoliated cells. Anal. Methods 2017, 9, 937–948. [Google Scholar] [CrossRef] [Green Version]
  28. Ramos, I.R.; Malkin, A.; Lyng, F.M. Current advances in the application of Raman spectroscopy for molecular diagnosis of cervical cancer. Biomed. Res. Int. 2015, 1–9. [Google Scholar] [CrossRef]
  29. Movasaghi, Z.; Rehman, S.; Rehman, I. Raman Spectroscopy of Biological Tissues. Appl. Spectrosc. Rev. 2007, 42, 493–541. [Google Scholar] [CrossRef]
  30. De Gelder, J.; De Gussem, K.; Vandenabeele, P.; Moens, L. Reference database of Raman spectra of biological molecules. J. Raman Spectrosc. 2007, 38, 1133–1147. [Google Scholar] [CrossRef]
  31. Traynor, D.; Duraipandian, S.; Bhatia, R.; Cuschieri, K.; Martin, C.M.; O’Leary, J.; Lyng, F.M. The potential of biobanked liquid-based cytology samples for cervical cancer screening using Raman. J. Biophotonics 2019, 12, e201800377. [Google Scholar] [CrossRef] [Green Version]
  32. Alrajjal, A.; Pansare, V.; Choudhury, M.S.R.; Khan, M.Y.A.; Shidham, V.B. Squamous intraepithelial lesions (SIL: LSIL, HSIL, ASCUS, ASC-H, LSIL-H) of uterine cervix and Bethesda system. CytoJournal 2021, 18, 16. [Google Scholar] [CrossRef]
  33. Da Rosa, M.I.; Medeiros, L.R.; Rosa, D.D.; Bozzeti, M.C.; Silva, F.R.; Silva, B.R. Human papillomavirus and cervical neoplasia. Cad. Saude Publica. 2009, 25, 953–964. [Google Scholar] [CrossRef] [Green Version]
  34. Mougin, C.; Dalstein, V.; Prétet, J.L.; Gay, C.; Schaal, J.P.; Riethmuller, D. Epidemiology of cervical papillomavirus infections. Recent knowledge. Presse Med. 2001, 30, 1017–1023. [Google Scholar] [PubMed]
  35. McMurray, H.R.; Nguyen, D.; Westbrook, T.F.; McAnce, D.J. Biology of human papillomavirus. J. Exp. Path 2001, 82, 15–33. [Google Scholar] [CrossRef] [PubMed]
  36. Vashisht, S.; Mishra, H.; Mishra, P.K.; Ekielski, A.; Talegaonkar, S. Structure, genome, infection cycle, and clinical manifestations associated with human papillomavirus. Curr. Pharm. Biotechnol. 2019, 20, 1260–1280. [Google Scholar] [CrossRef] [PubMed]
  37. Graham, S. The human papillomavirus replication cycle, and its links progression: A comprehensive review. Clin. Sci. 2017, 131, 2201–2221. [Google Scholar] [CrossRef] [Green Version]
  38. Harden, M.E.; Munger, K. Human papillomavirus molecular biology. Mutat. Res. Rev. Mutat. Res. 2017, 772, 3–12. [Google Scholar] [CrossRef] [Green Version]
  39. Woolford, L.; Chen, M.; Dholakia, K.; Herrington, C.S. Towards automated cancer screening: Label-free classification of fixed cell samples using wavelength modulated Raman spectroscopy. J. Biophotonics 2018, 11, e201700244. [Google Scholar] [CrossRef] [Green Version]
  40. Zheng, C.; Qing, S.; Wang, J.; Lü, G.; Li, H.; Lü, X.; Ma, C.; Tang, J.; Yue, X. Diagnosis of cervical squamous cell carcinoma and cervical adenocarcinoma based on Raman spectroscopy and support vector machine. Photodiagnosis Photodyn. Ther. 2019, 27, 156–161. [Google Scholar] [CrossRef]
  41. Krishna, C.M.; Sockalingum, G.D.; Vadhiraja, B.M.; Maheedhar, K.; Rao, A.C.K.; Rao, L.; Ventéo, L.; Pluot, M.; Fernandes, D.J.; Vidyasagar, M.S.; et al. Vibrational spectroscopy studies of formalin-fixed cervix tissues. Biopolymers 2007, 85, 214–221. [Google Scholar] [CrossRef]
  42. Rubina, S.; Vidyasagar, M.S.; Murali Krishna, C. Raman Spectroscopic Study on prediction of treatment response in cervical cancers. J. Innov. Opt. Health Sci. 2013, 6, 1350014. [Google Scholar] [CrossRef]
  43. Shaikh, R.; Prabitha, V.G.; Dora, T.K.; Chopra, S.; Maheshwari, A.; Deodhar, K.; Rekhi, B.; Sukumar, N.; Krishna, C.M.; Subhash, N. A comparative evaluation of diffuse reflectance and Raman spectroscopy in the detection of cervical cancer. J. Biophotonics 2017, 10, 242–252. [Google Scholar] [CrossRef]
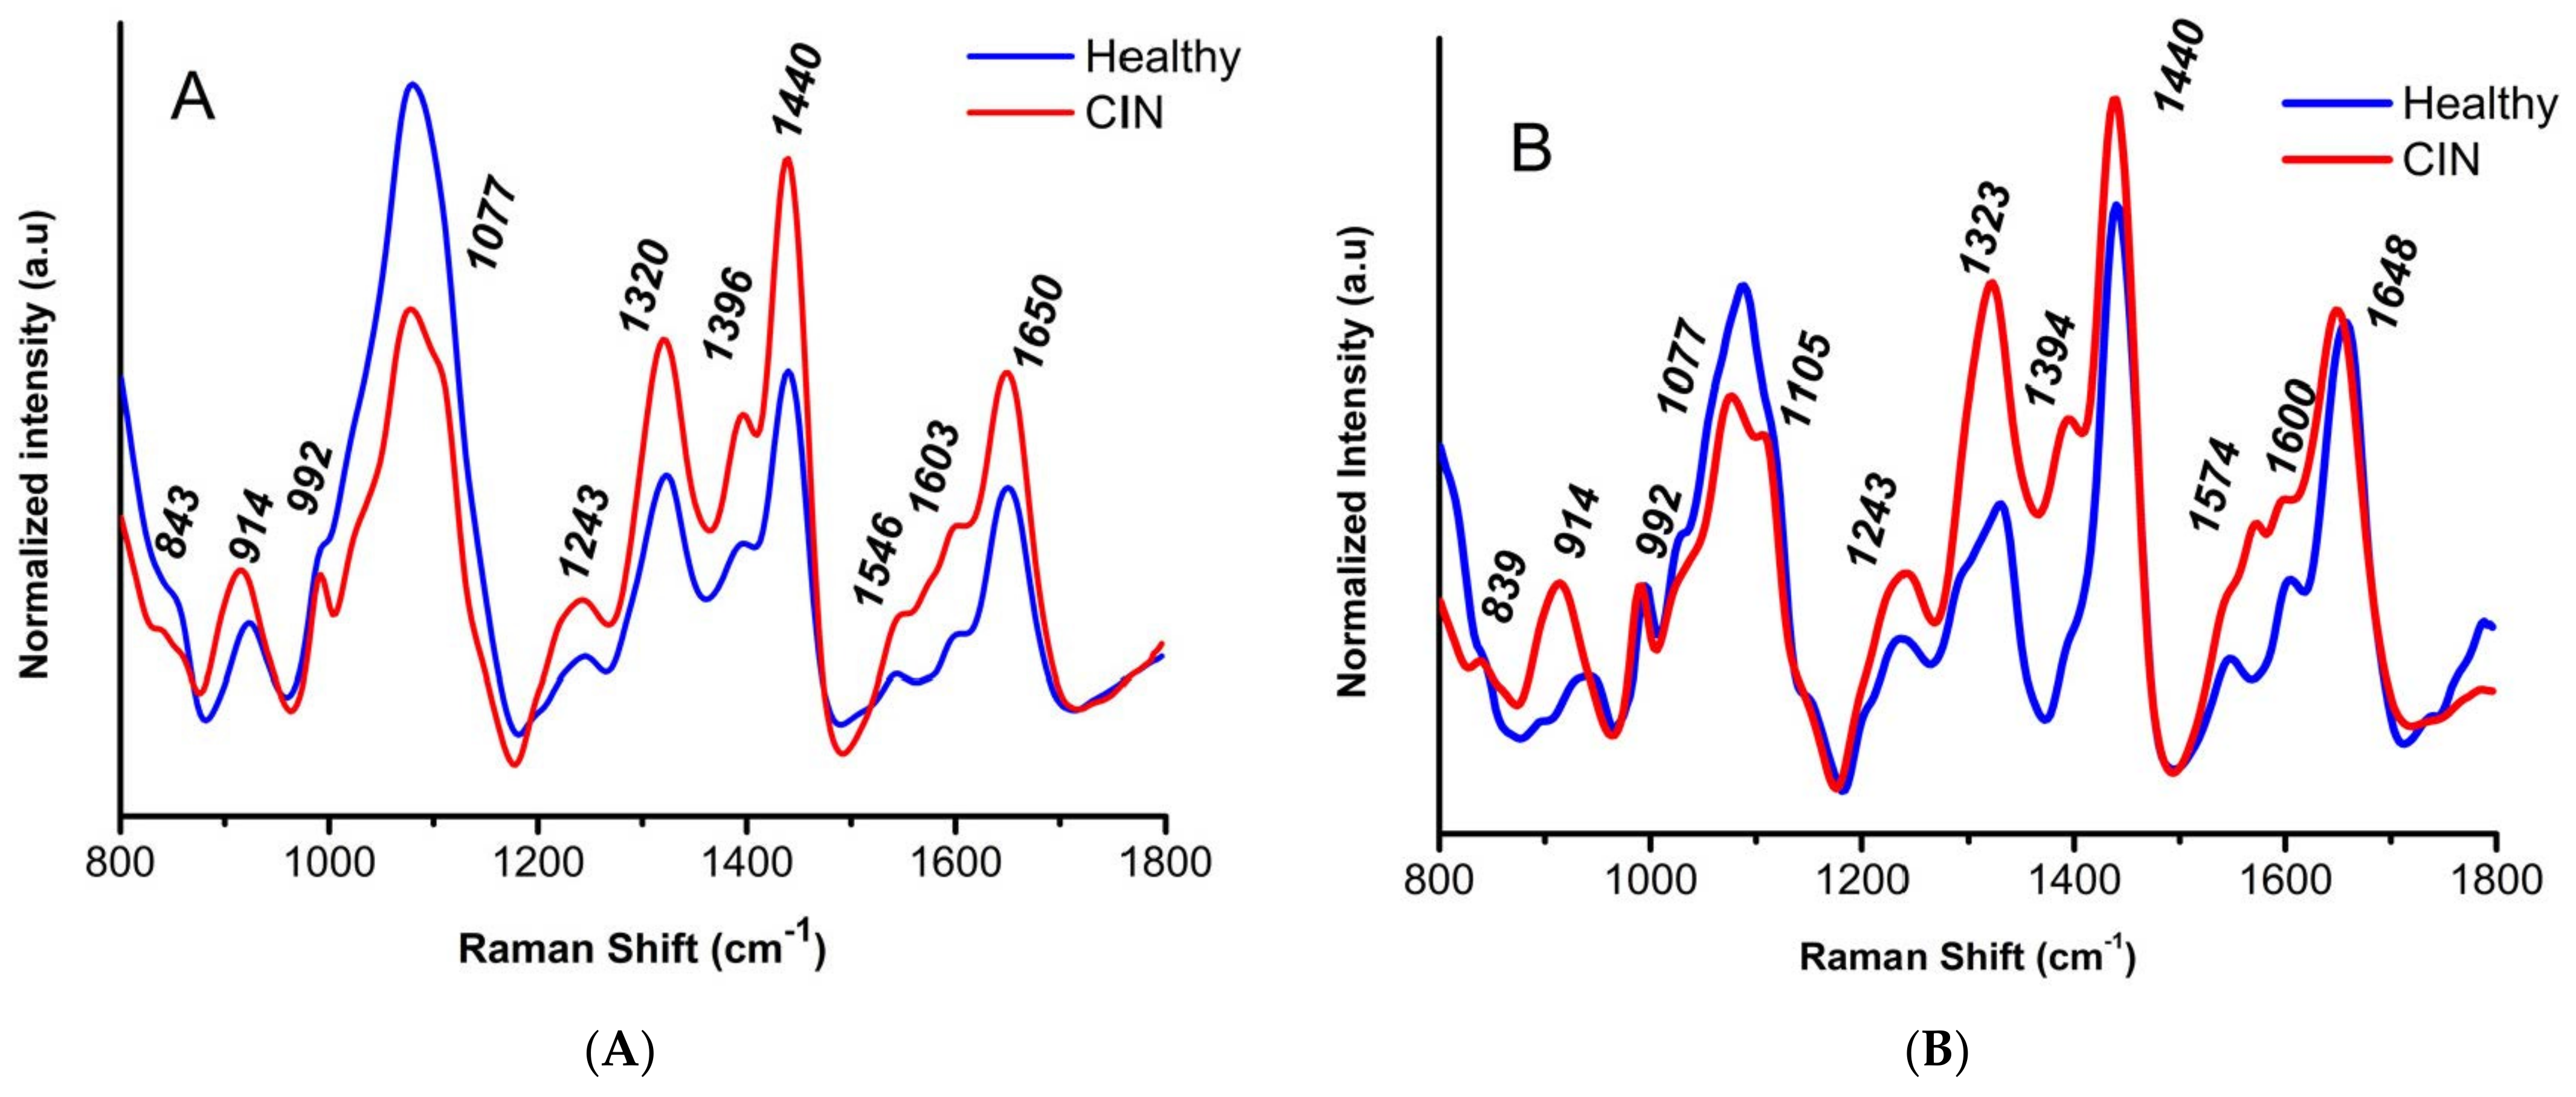
Figure 1. Raman spectra of exfoliated cervical cells from healthy and CIN patients. (A) Average spectrum obtained from the cervical cell cytoplasm of healthy patients (blue line) and that of patients with a cervical lesion, CIN (red line). (B) Average of Raman spectra of the cervical cell nucleus of a healthy patient (blue line) and a patient with lesion, CIN (red line). The most prominent bands are shown for both cytoplasm and nucleus spectra.
Applsci 12 02419 g001
Figure 2. Metric Multidimensional Scaling (MDS) plots and bootstrap averages of biochemical patterns. Samples of healthy patients (H, blue) and CIN patients (CIN, red). (A) Cytoplasmic analysis and (B) nuclear analysis. CIN = cervical lesion. Dots represent centroids and areas 95% confidence level.
Applsci 12 02419 g002
Figure 3. Canonical analysis of principal coordinates (CAP) of biochemical patterns. Samples of healthy patients (H, blue triangles) and CIN patients (CIN, red triangles). (A) Cytoplasmic analysis (δ = 0.567, p = 0.0002) and (B) nuclear analysis (δ = 0.767, p = 0.0001). HC = Health condition. CIN= cervical lesion. Euclidean distance-based analysis.
Applsci 12 02419 g003
Figure 4. Raman spectra of cervical cells of healthy patients with varying degrees of lesion. (A) Spectra corresponding to the cytoplasm and (B) Raman spectra obtained from the nucleus. Spectra of different groups: Healthy (black), viral latency (red), CIN1 (blue), CIN2 (pink), and CIN3/CIS (green). Each color corresponds to the cellular components represented in the box by the graphs.
Applsci 12 02419 g004
Table 1. Assignments of the Raman spectra of cytoplasm and nucleus of cervical cell [21,22,29].
Band
(cm−1)
C/N *
Raman AssignmentIncreased Band Intensity in
CIN Patients
Contributing Band at 50% of
Statistical Significance
Cytoplasm * CNucleus * NCytoplasmNucleus
843/839Deformative vibrations of amine groups/Polysaccharide structureXX
861Phosphate groupXX X
914/914Proteins and lipids stretching, ribose vibrationXX
917C-C proline and valine stretchingXX
934C-C collagen skeletonXX
942C-C stretching mode of proline and valine and protein backbone (alpha-hélix conformation)/glycogen X
951Stretching (CH3) of proteins (alpha helix)X
980C-C stretching β-sheet (proteins), =CH bending (lipids)XX
992/992C-O ribose, C-C X
997C-O ribose, C-CX
1037CollagenXX
1063C-C lipid skeleton stretchingXX
1077/1077symmetric PO2-stretching of DNA X
1080Phospholipids, phosphodiester nucleic acid groups, collagenXXX
1085Nucleic acid phosphodiester groupsXX
1108/1105Cytosine, carbohydrates peak for solutionsXXX
1150C-C and C-N proteins and lipids stretching, glycogenXX
1184Cytosine, adenine, guanine X
1209C-C6H5 tryptophan and phenylalanine stretchingXX
1234Guanine, amide IIIXX
1243/1243NH2 guanine and cytosine, amide III. Asymmetric phosphate stretching modesXX
1295CH2 deformationXX
1311CH3 and/or CH2 collagen and lipids twistingXX
1320/1323Guanine (RNA/DNA), CH in protein and carbohydratesXXXX
1355GuanineXX
1377T, A, G (DNA/RNA ring mode)XX
1396/1394C=O symmetric stretching, CH2 deformationXX X
1440/1440CH2 proteins and lipid bending XXX
1445CH2 proteins and lipids bendingX
1546/1574Amide II, nucleic acid modes, ring breathing modes in DNA basesXXXX
1603/1600Adenine, guanine (RNA/DNA), C=C phenylalanine bending, amide I C=O stretchingXXXX
1608C=C phenylalanine and tyrosineXXX
1650/1648Amide I (C=O stretching, C-N stretching and N-H proteins bending)X
1655Amide I collagen and protein X X
* C = Cytoplasm, N = Nucleus. The PERMANOVA statistical test indicated that differences in the Raman spectra obtained from the cytoplasm were significant (Pseudo F = 6.38, p = 0.0014).
Table 2. Model classification and cross-validation of Healthy and CIN samples from CAP analysis.
GroupHealthyCINTotalRaman Classification Score %
CytoplasmHealthy2362979.3
CIN13395275.0
Overall classification efficiency 62/81 76.5%
Incorrect classification 23.5%
NucleusHealthy2362979.3
CIN8445284.6
Overall classification efficiency 67/81 82.7%
Incorrect classification 17.3%
Publisher’s Note: MDPI stays neutral with regard to jurisdictional claims in published maps and institutional affiliations.

