
Pulse-Shape Discrimination of SiPM Array-Coupled CLYC Detector Using Convolutional Neural Network

 ,
,
Abstract
:1. Introduction
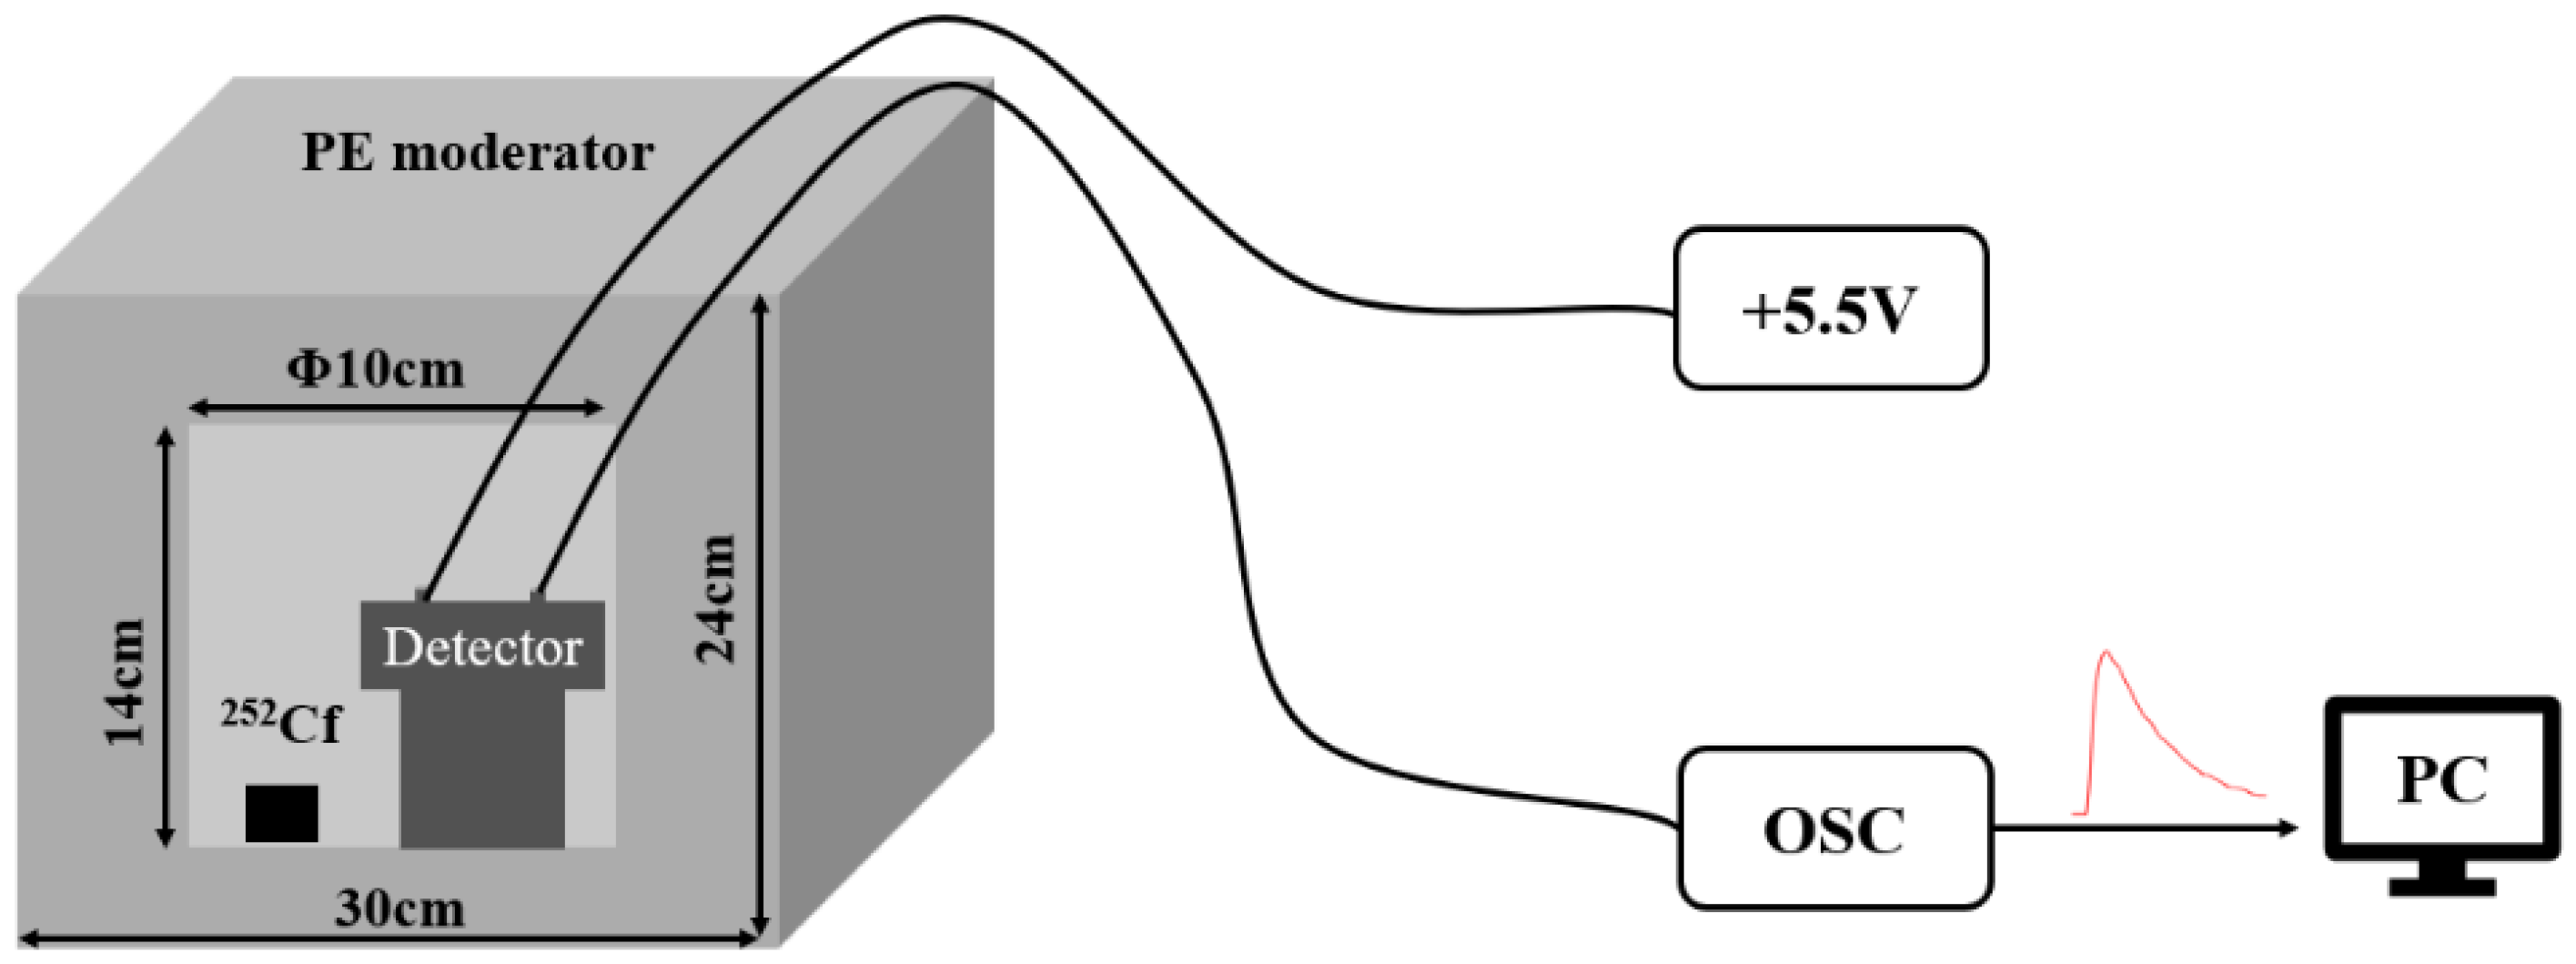
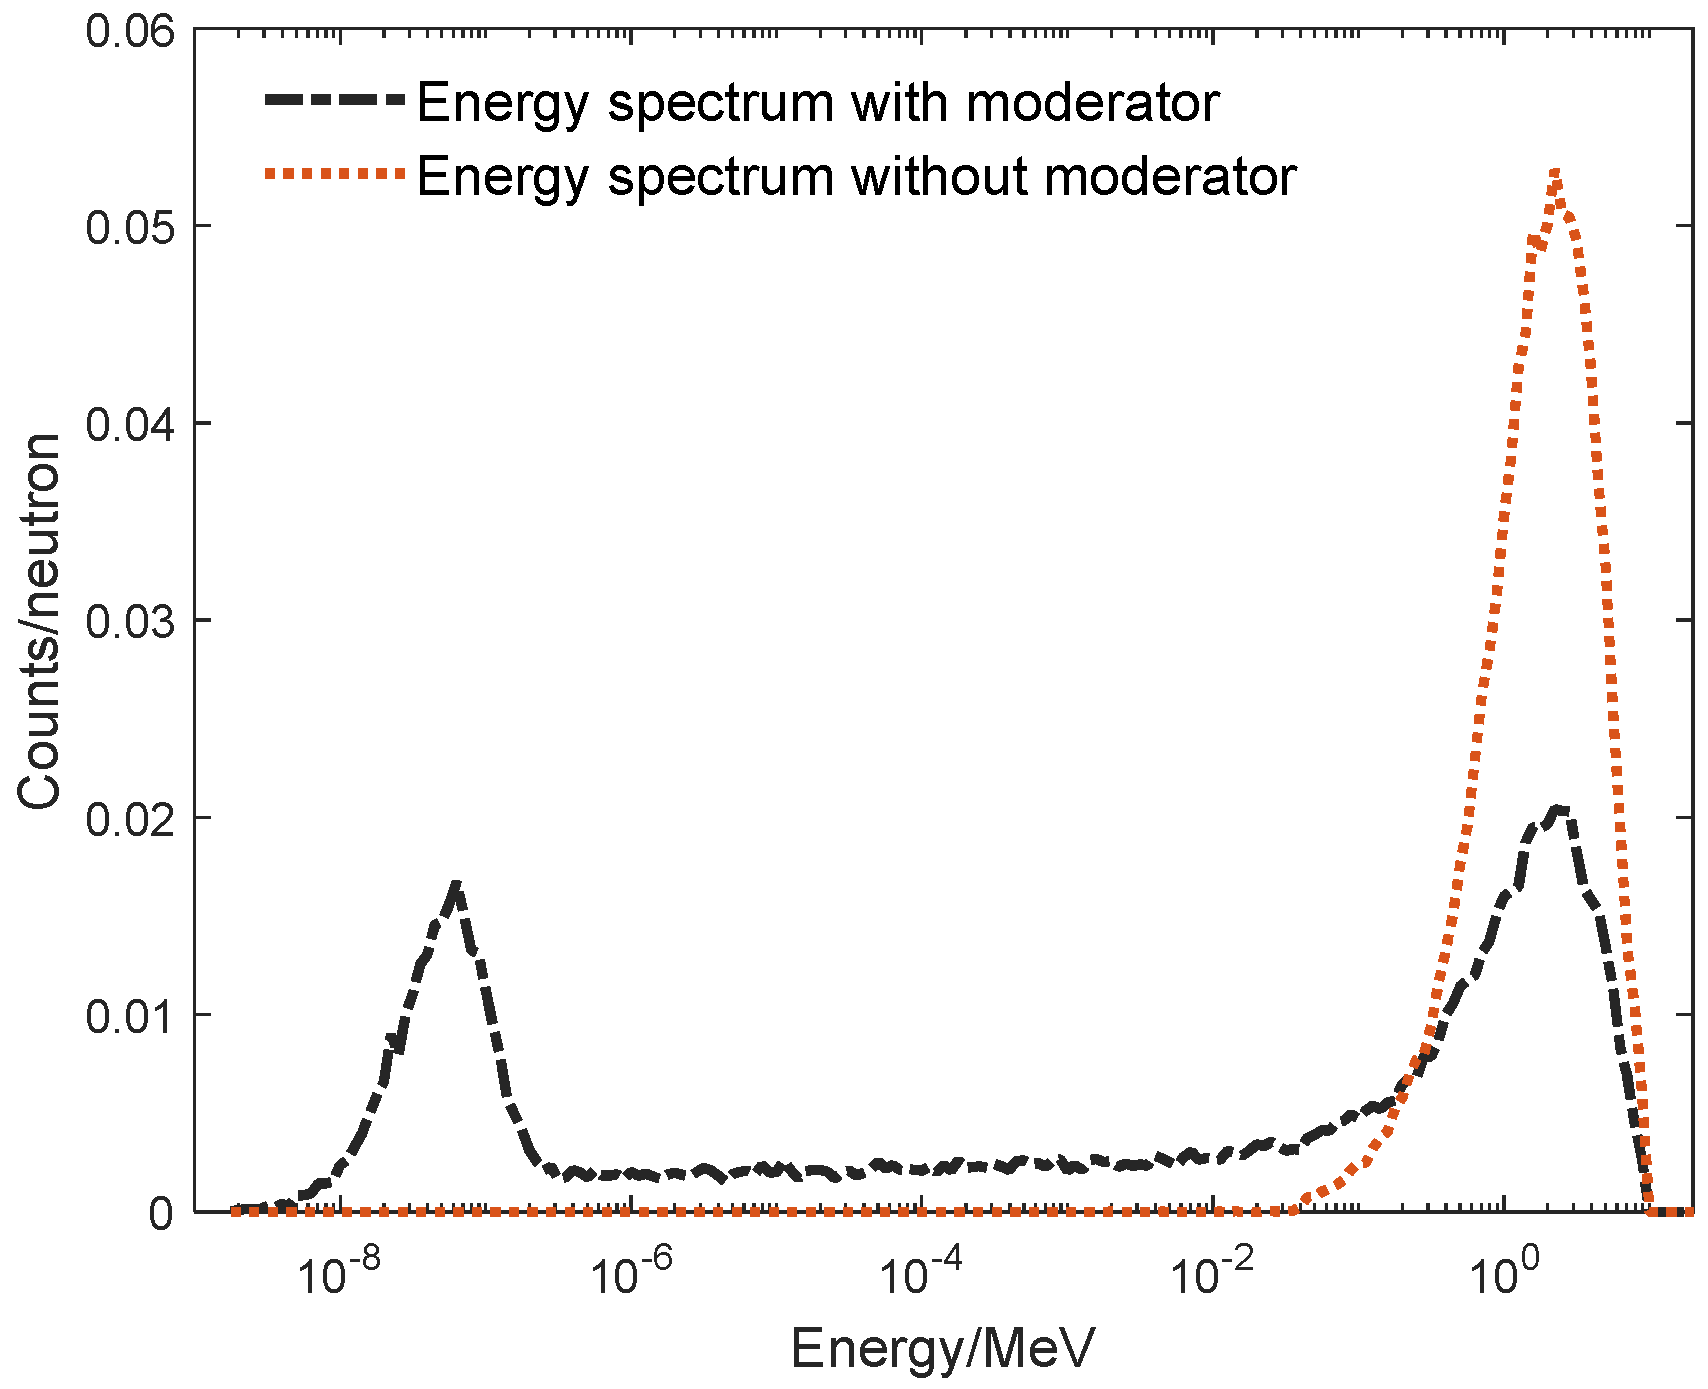
2. Data Acquisition
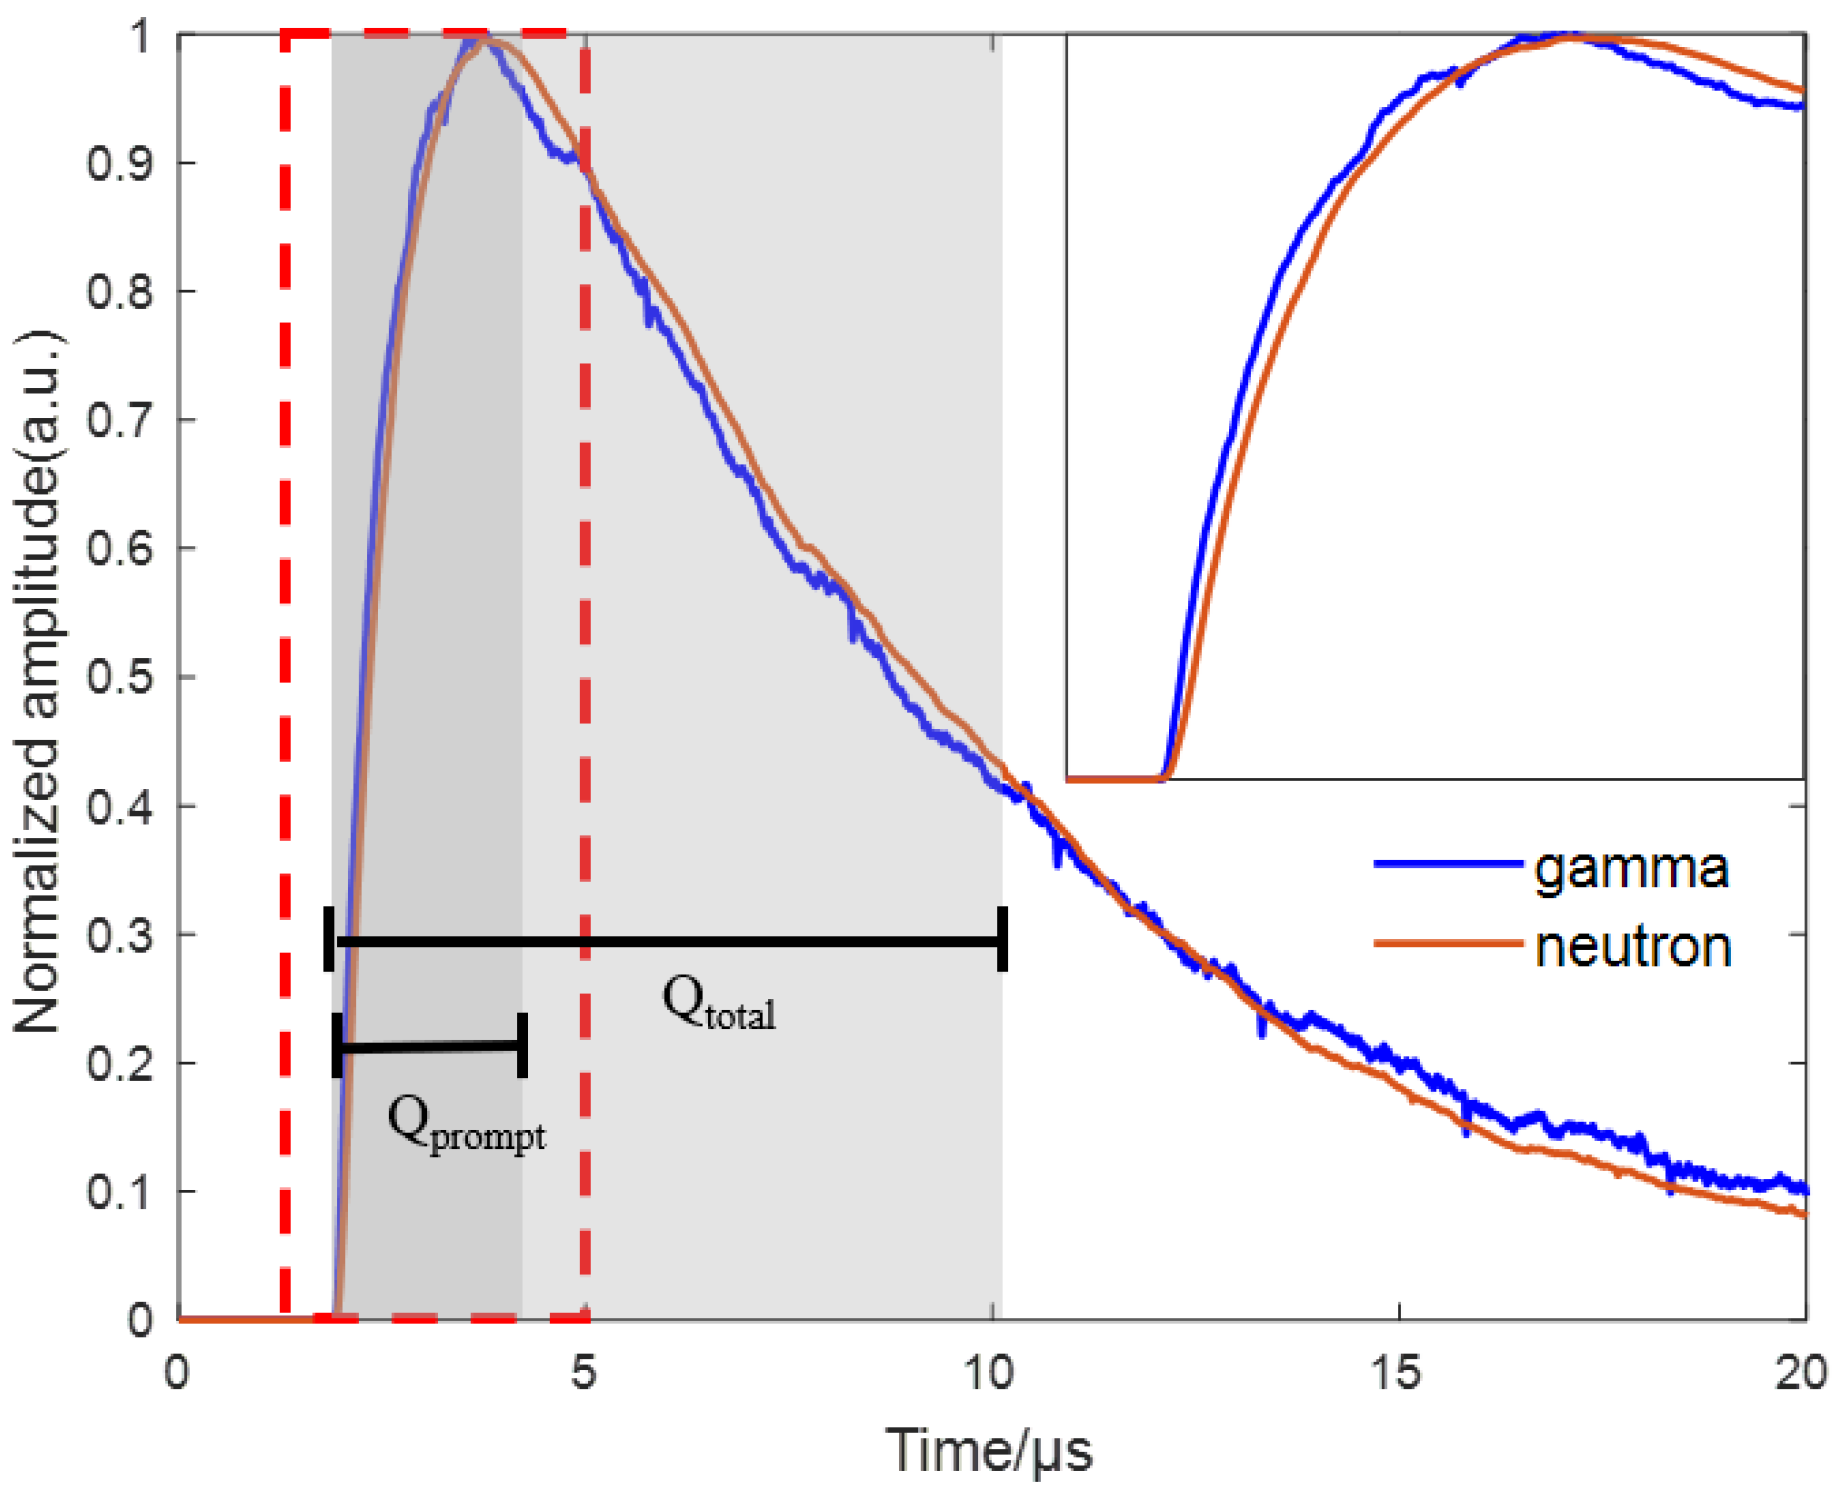
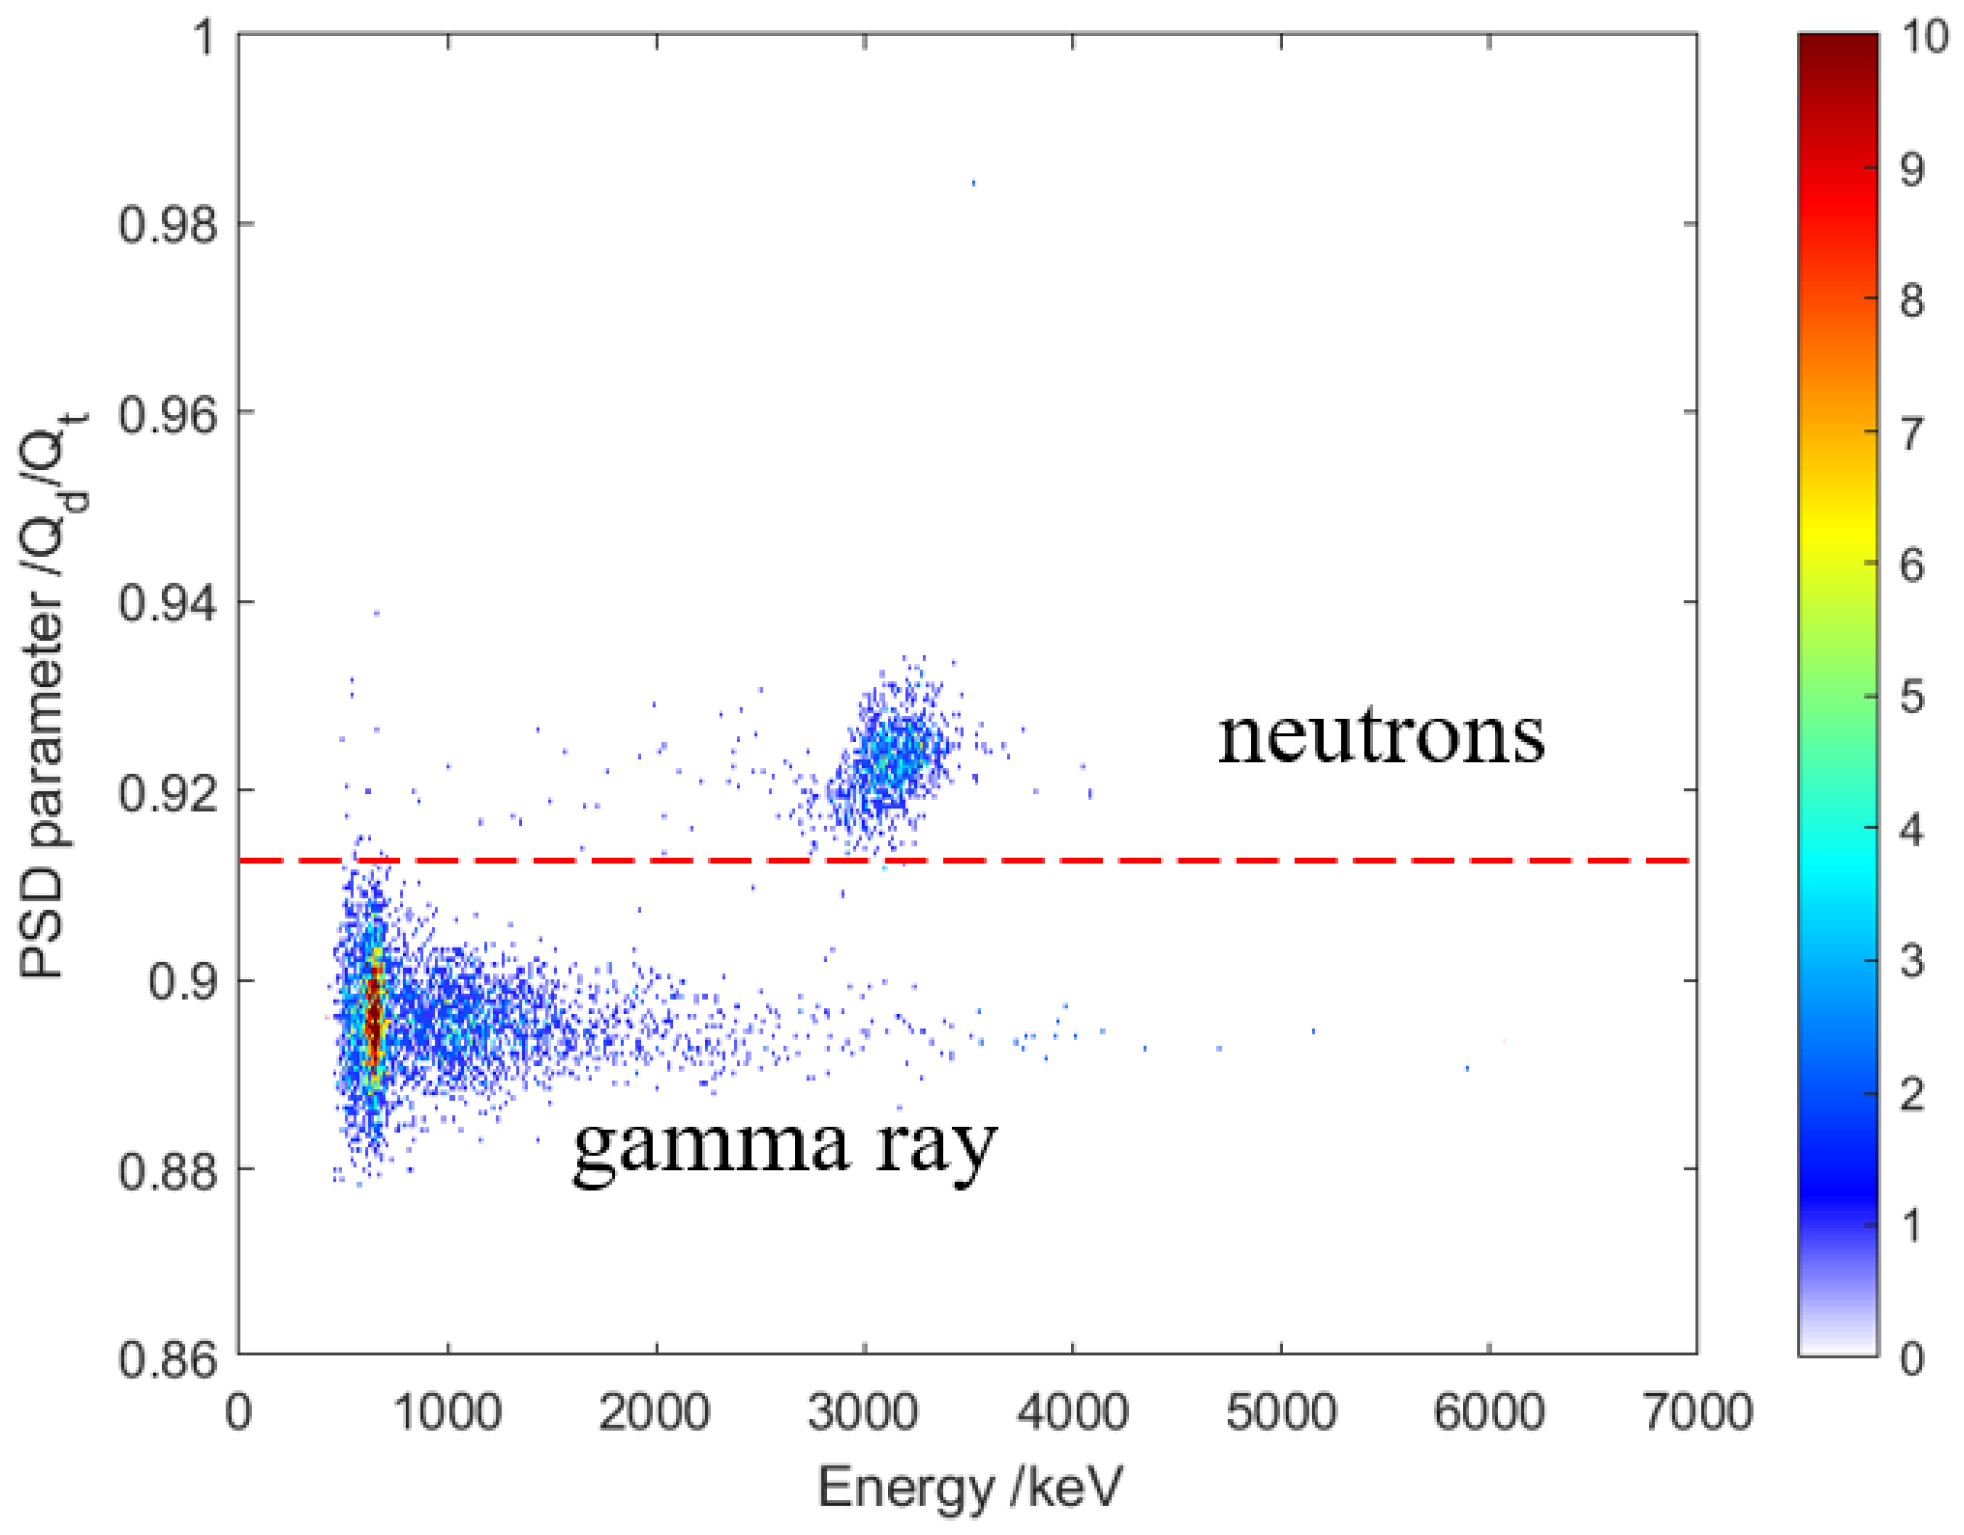
3. Pulse-Shape Discrimination
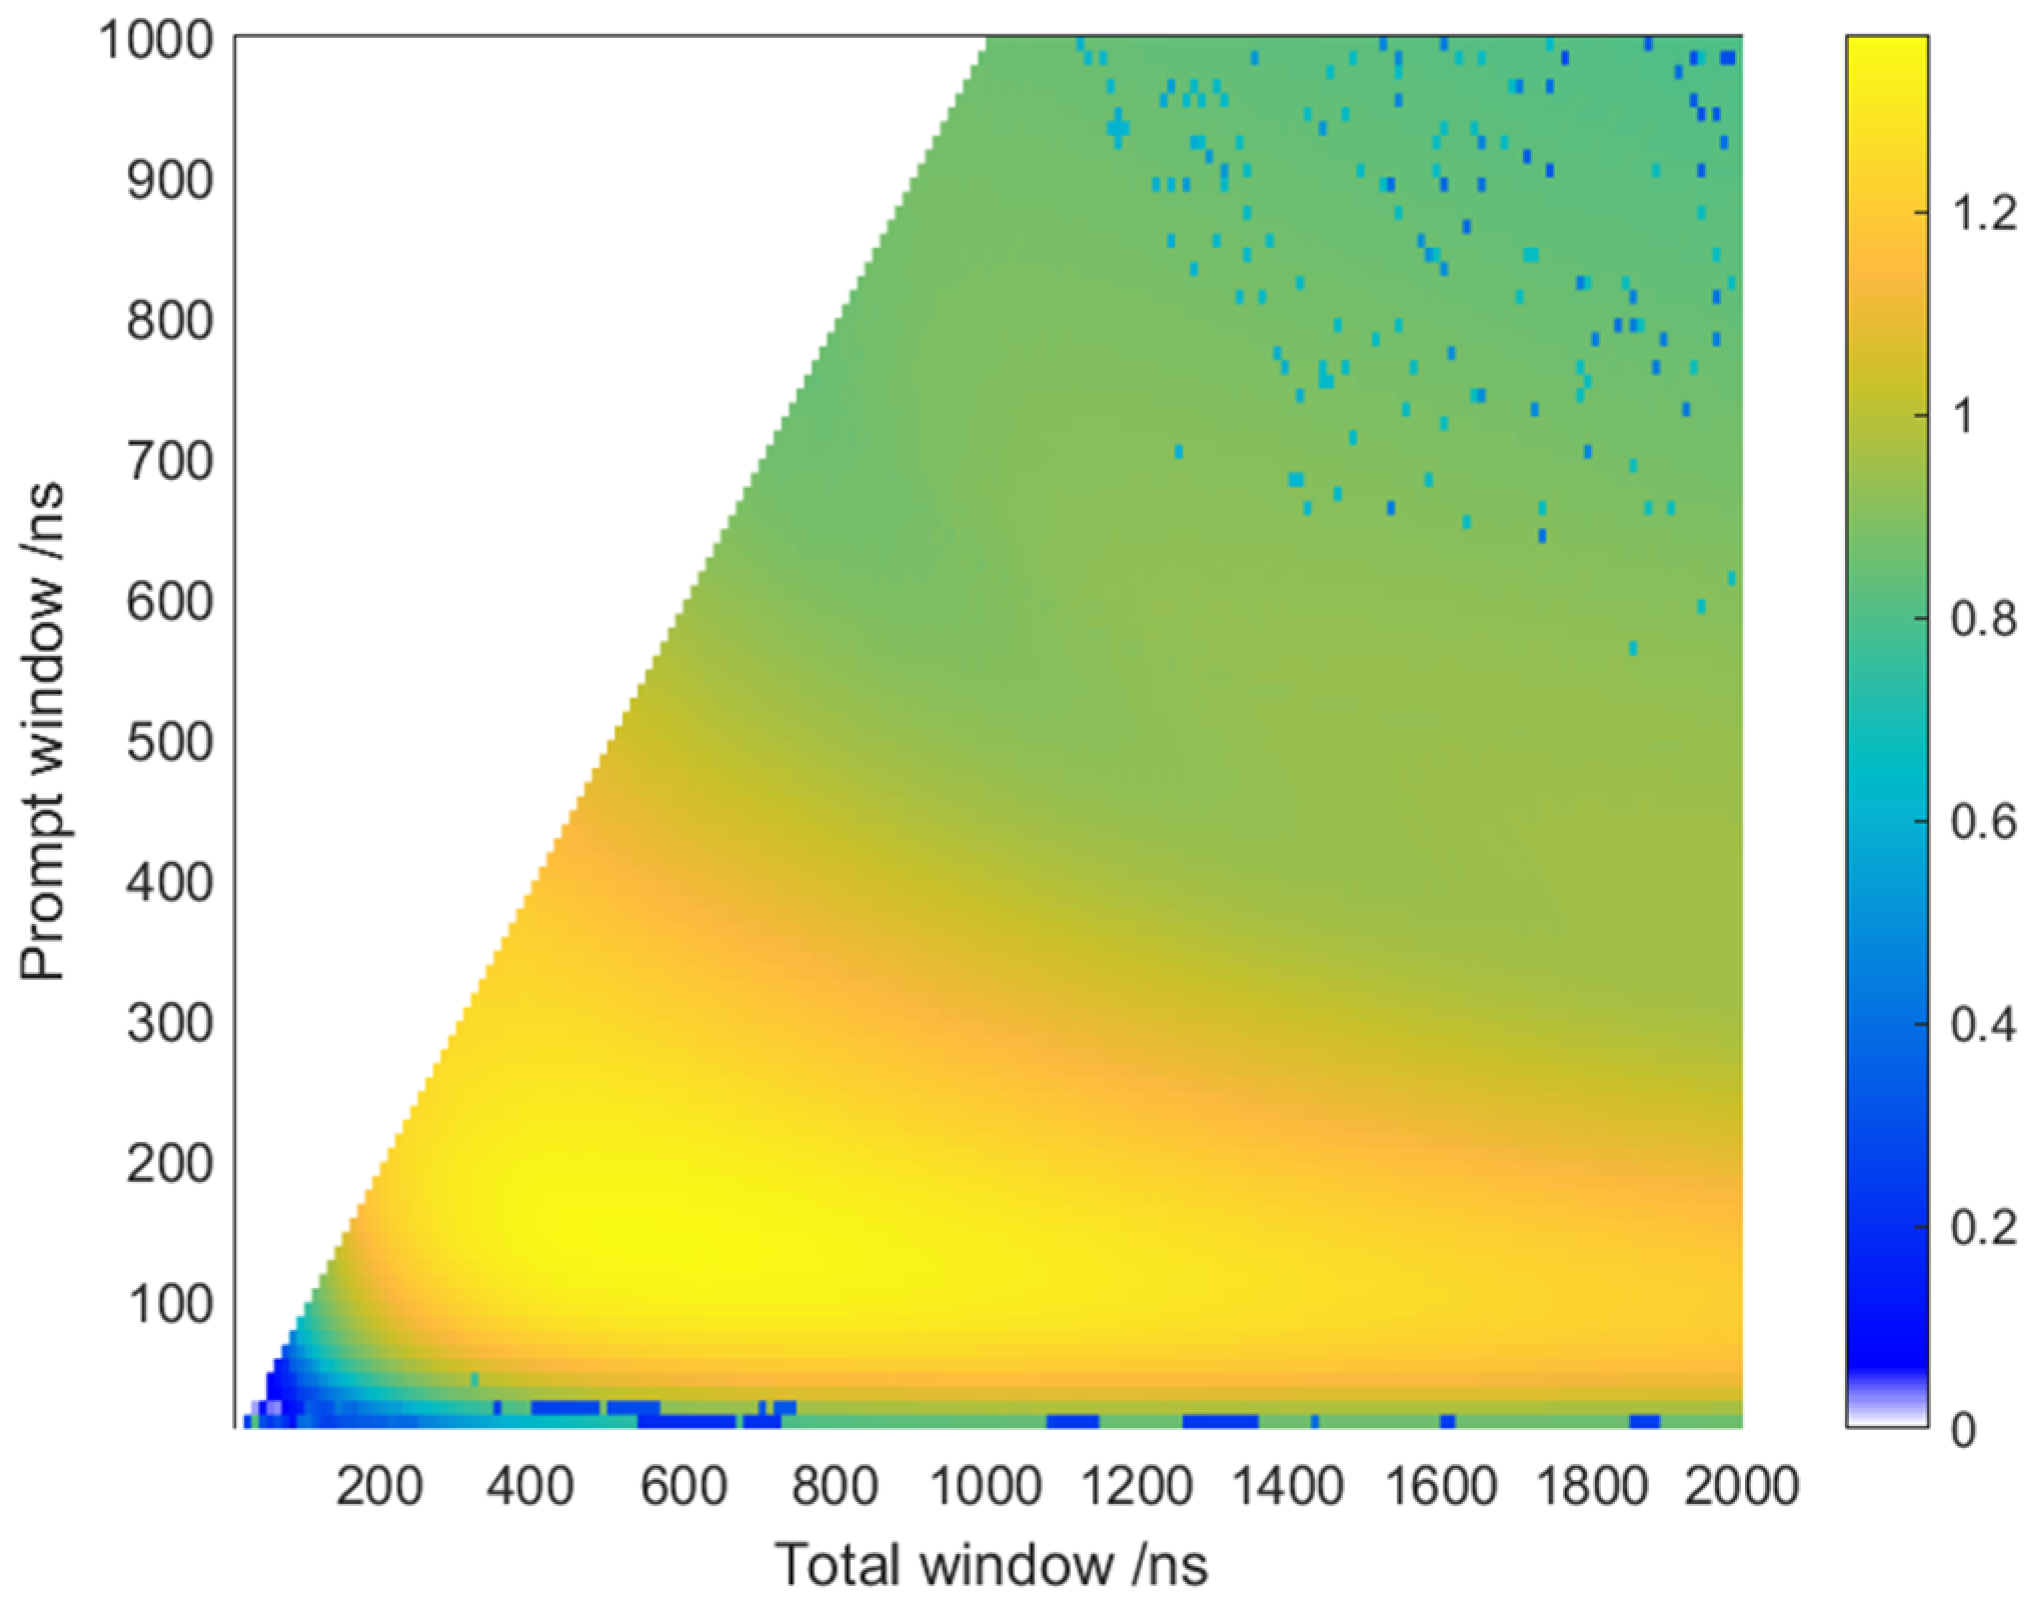
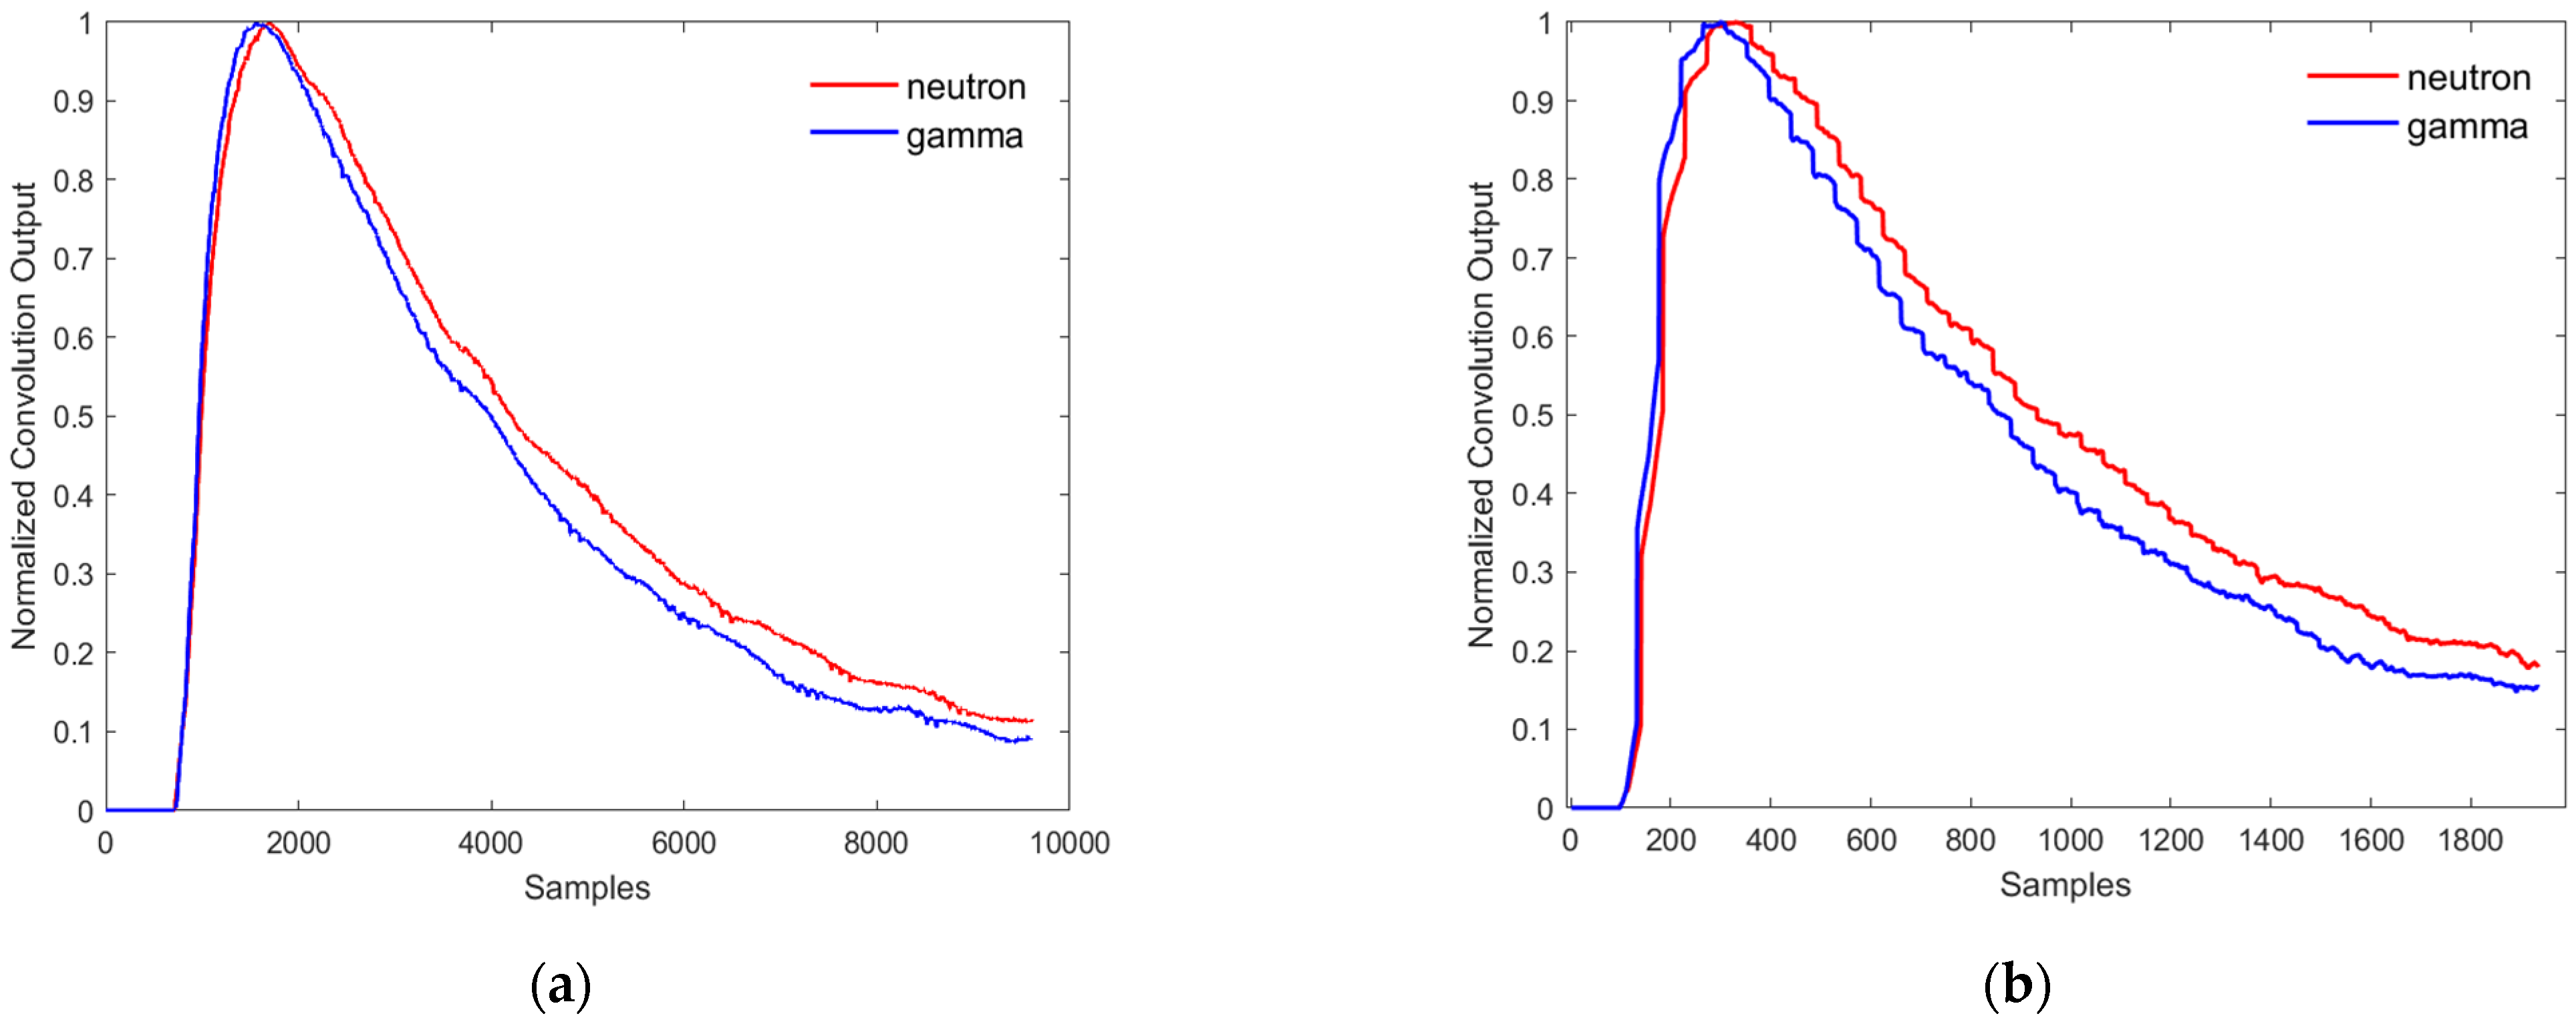
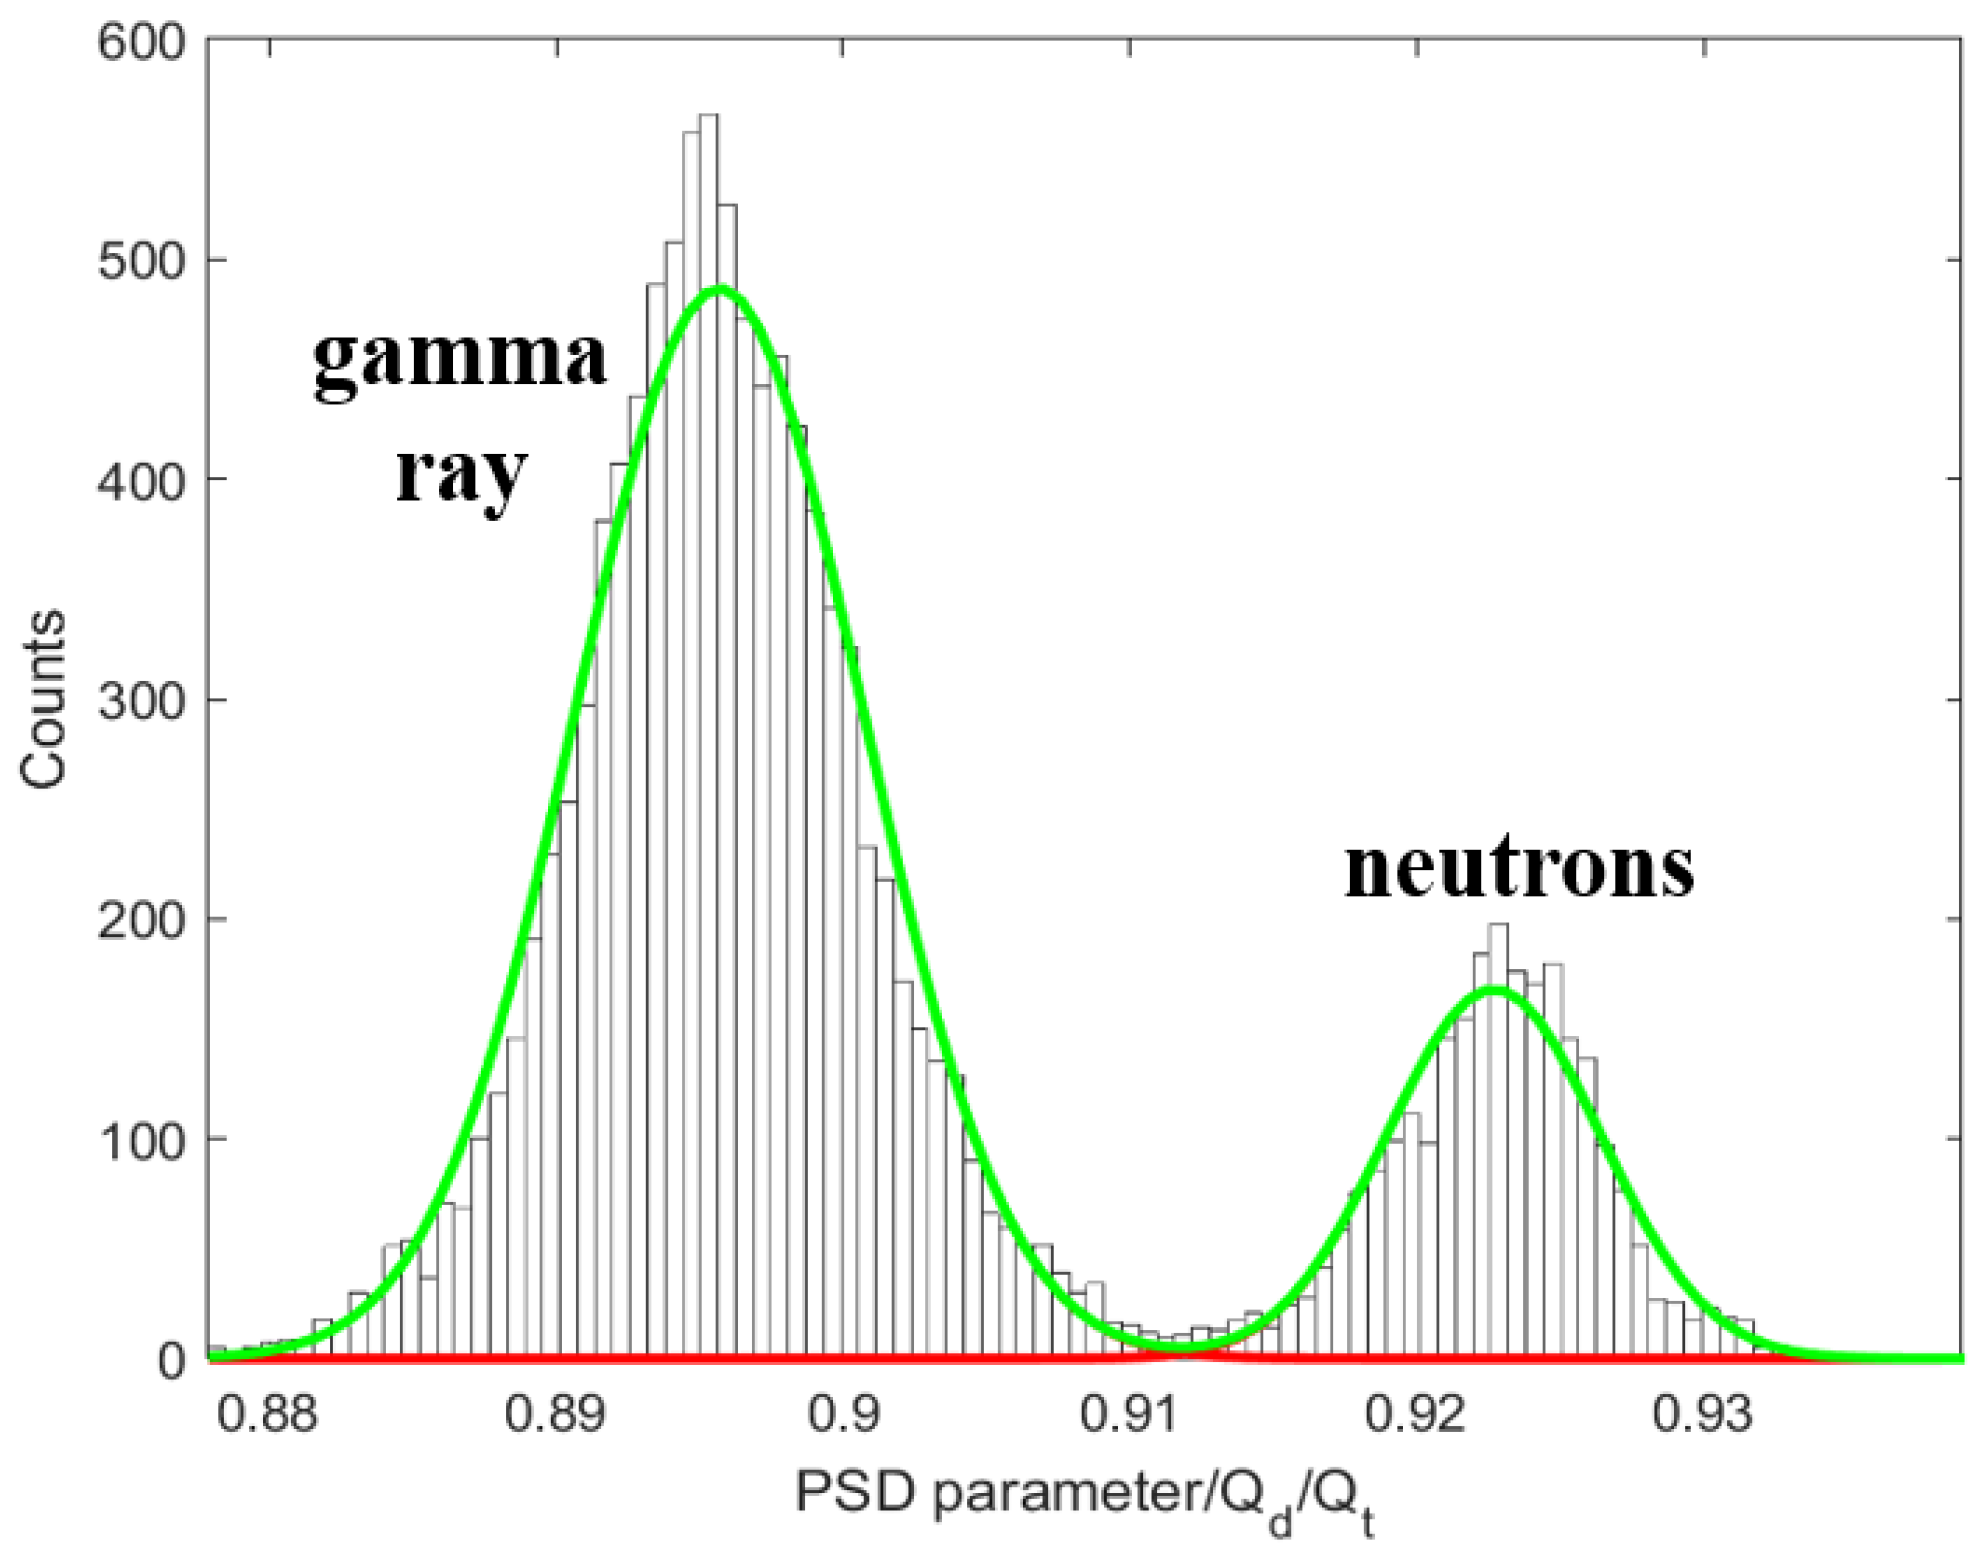
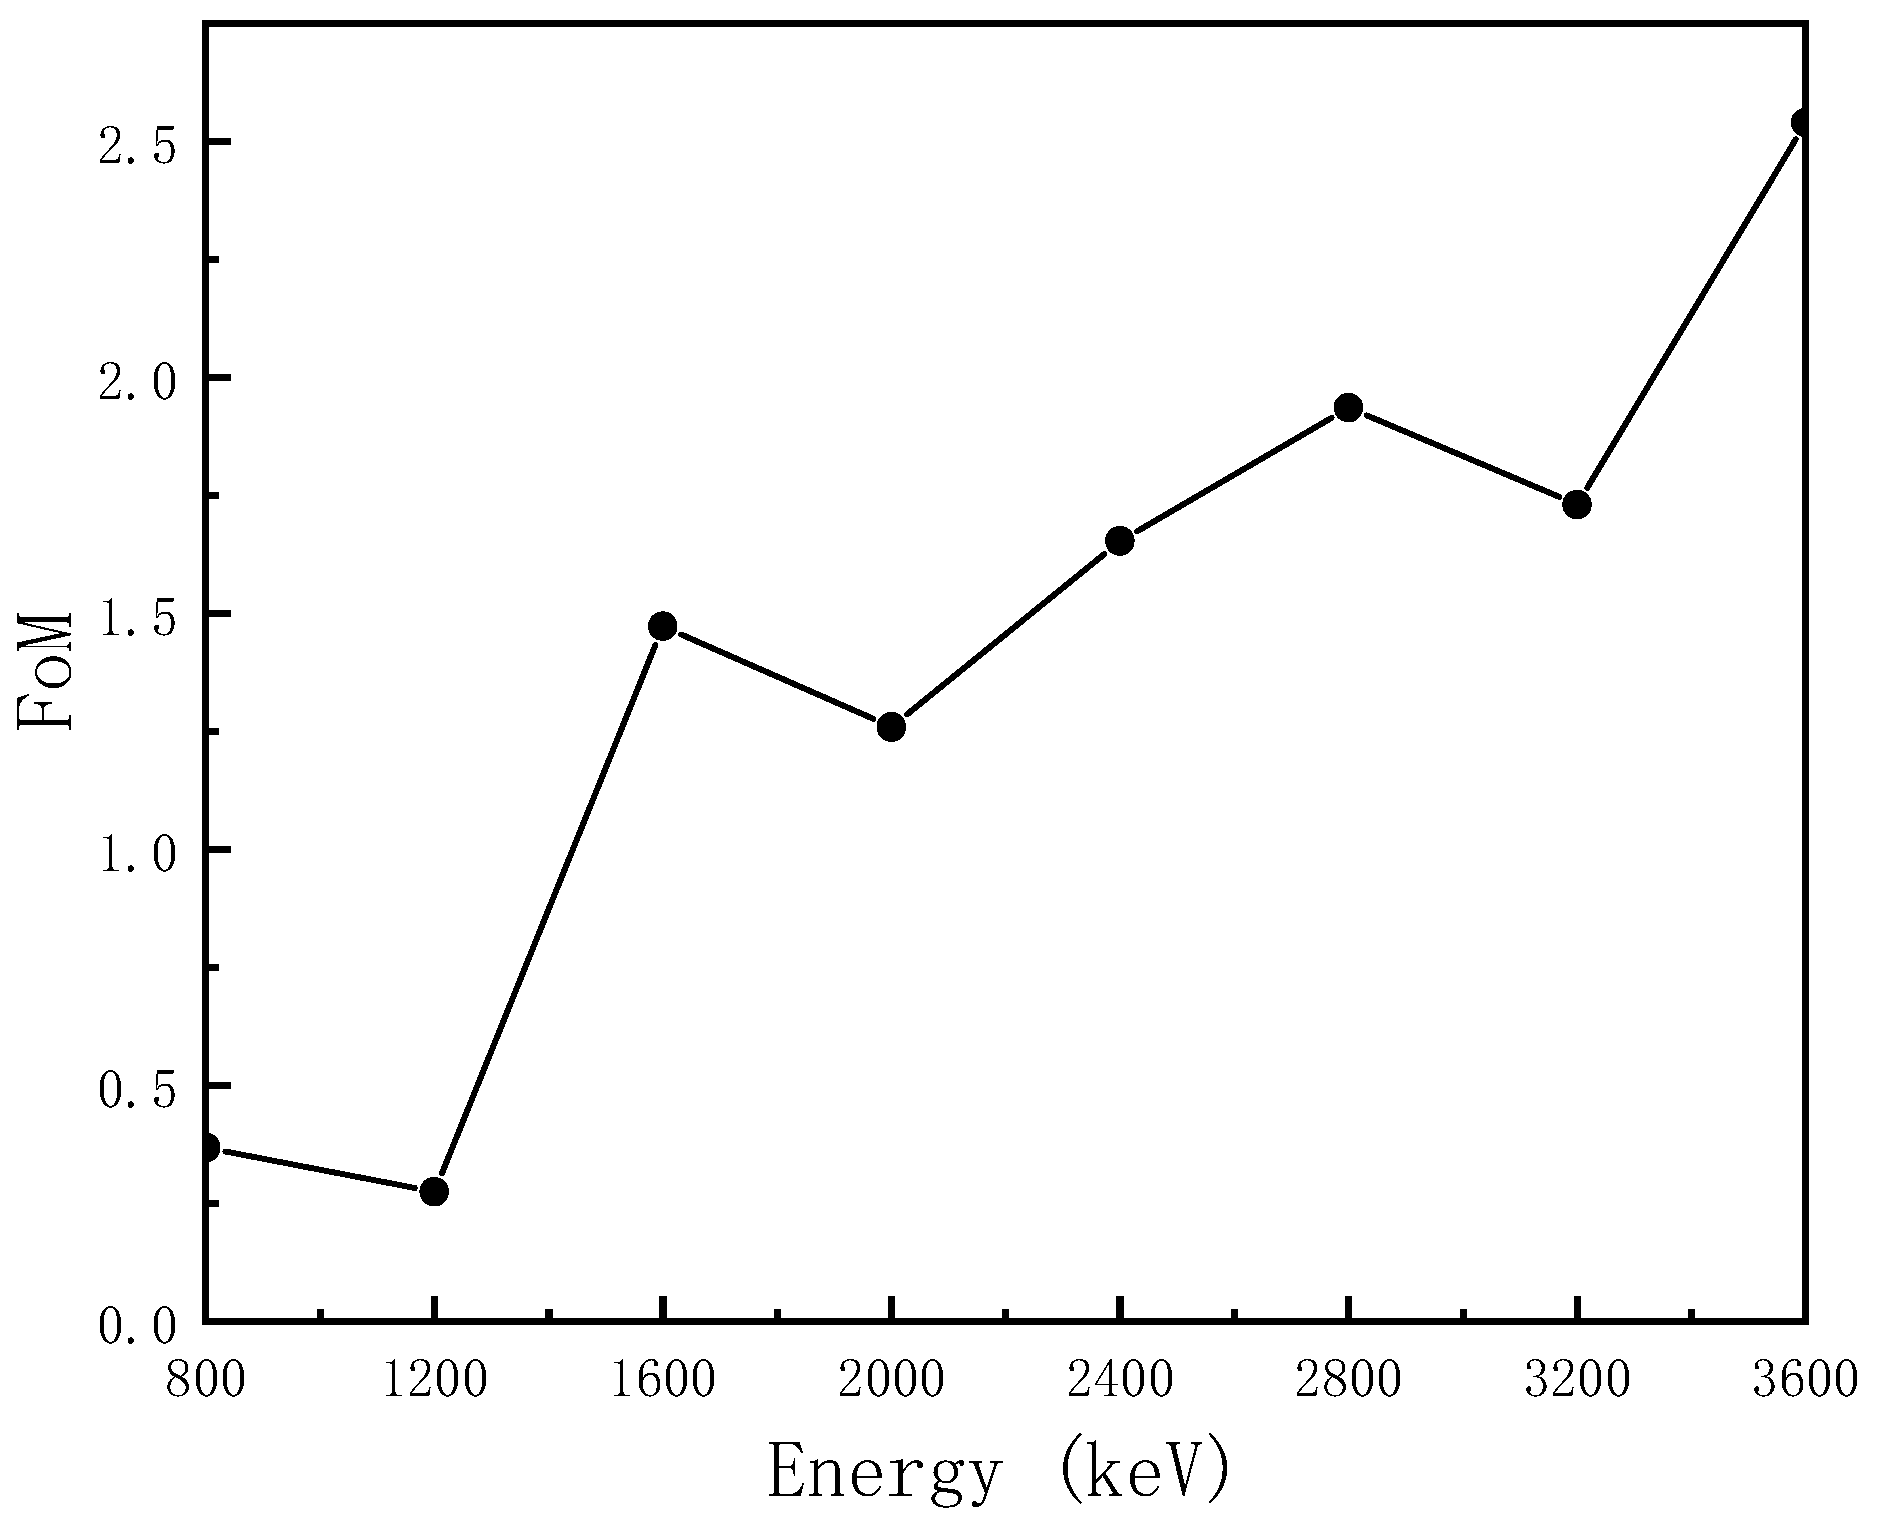
3.1. Time Window Optimization of Charge Comparison
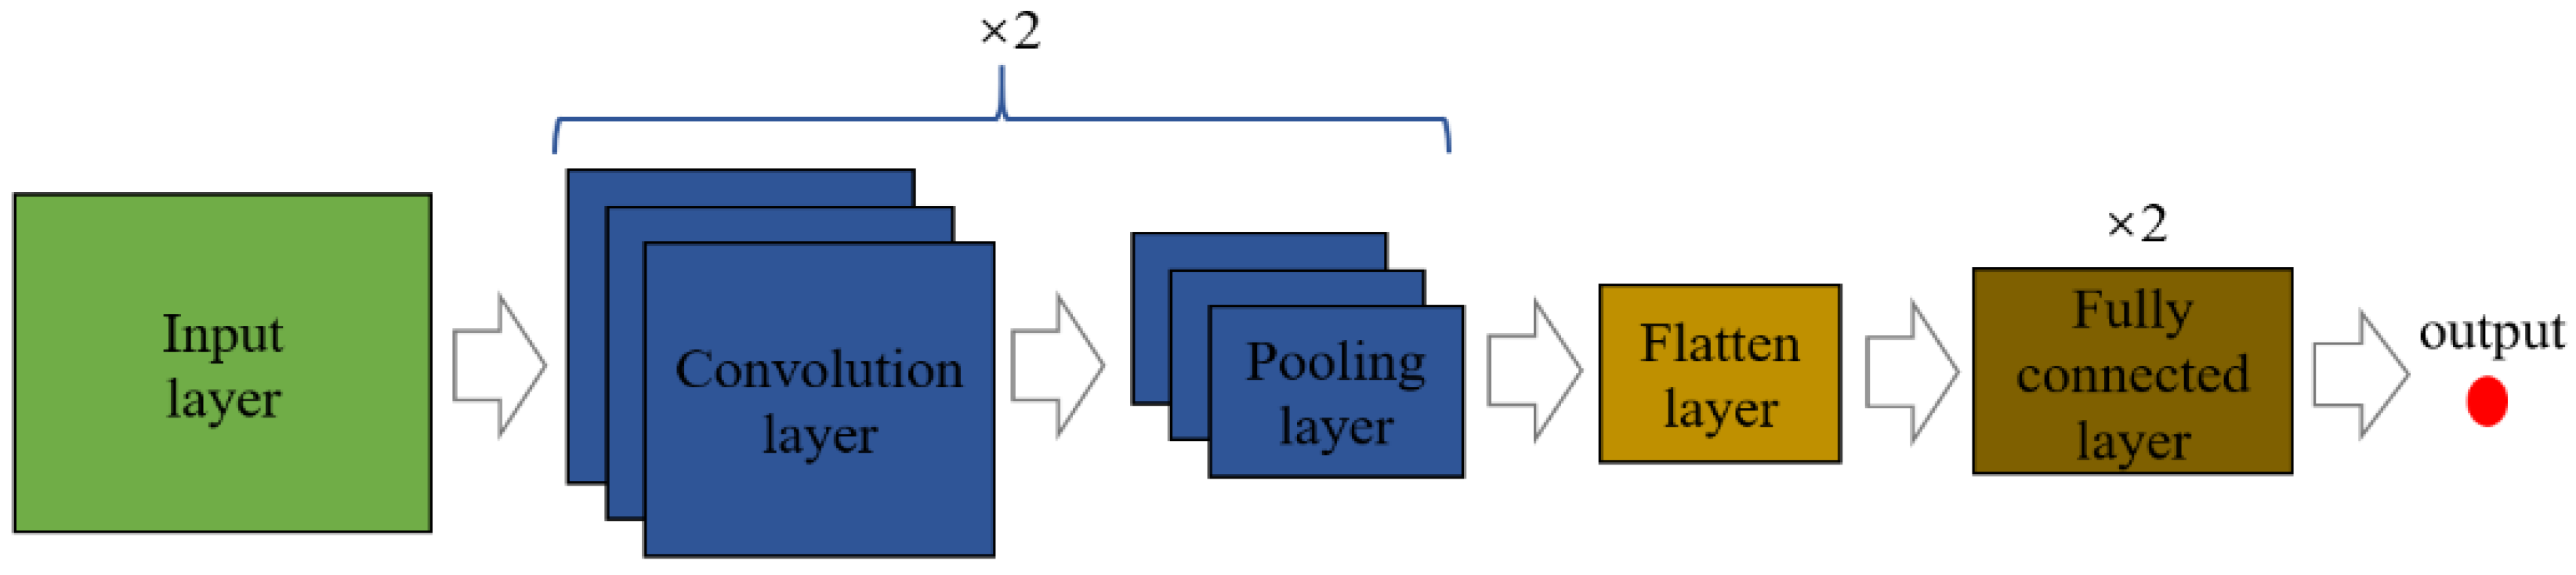
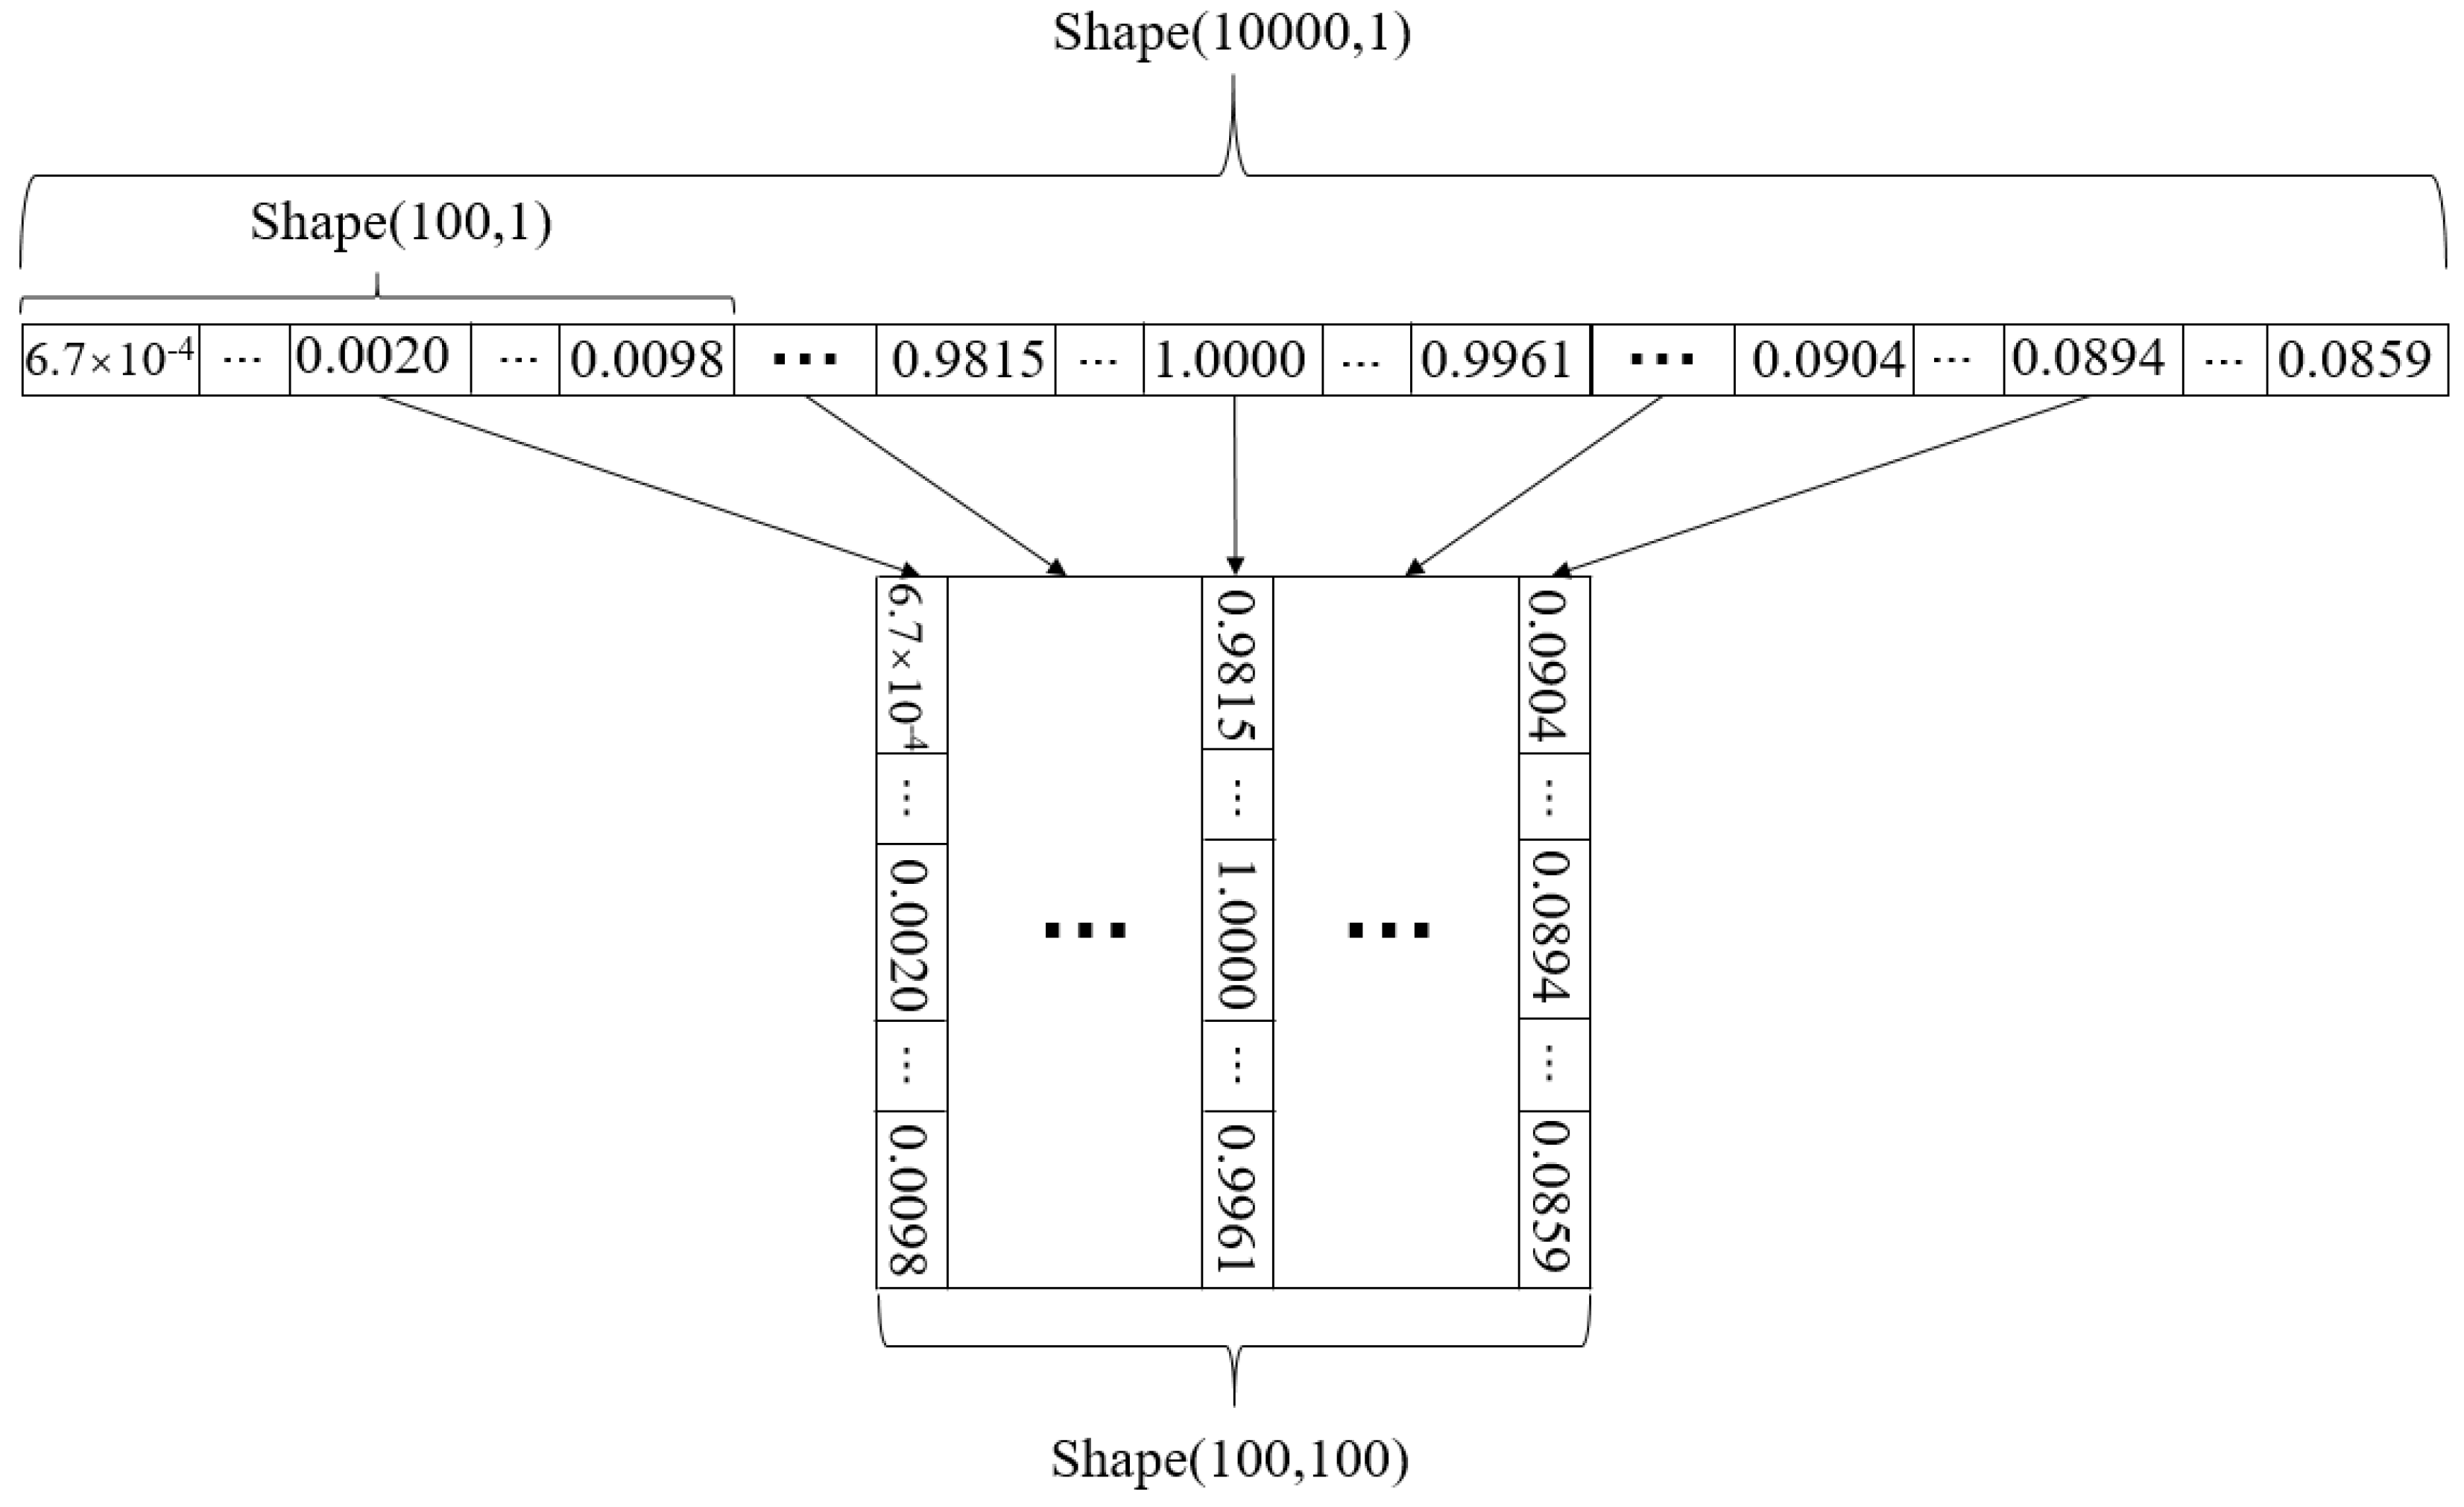
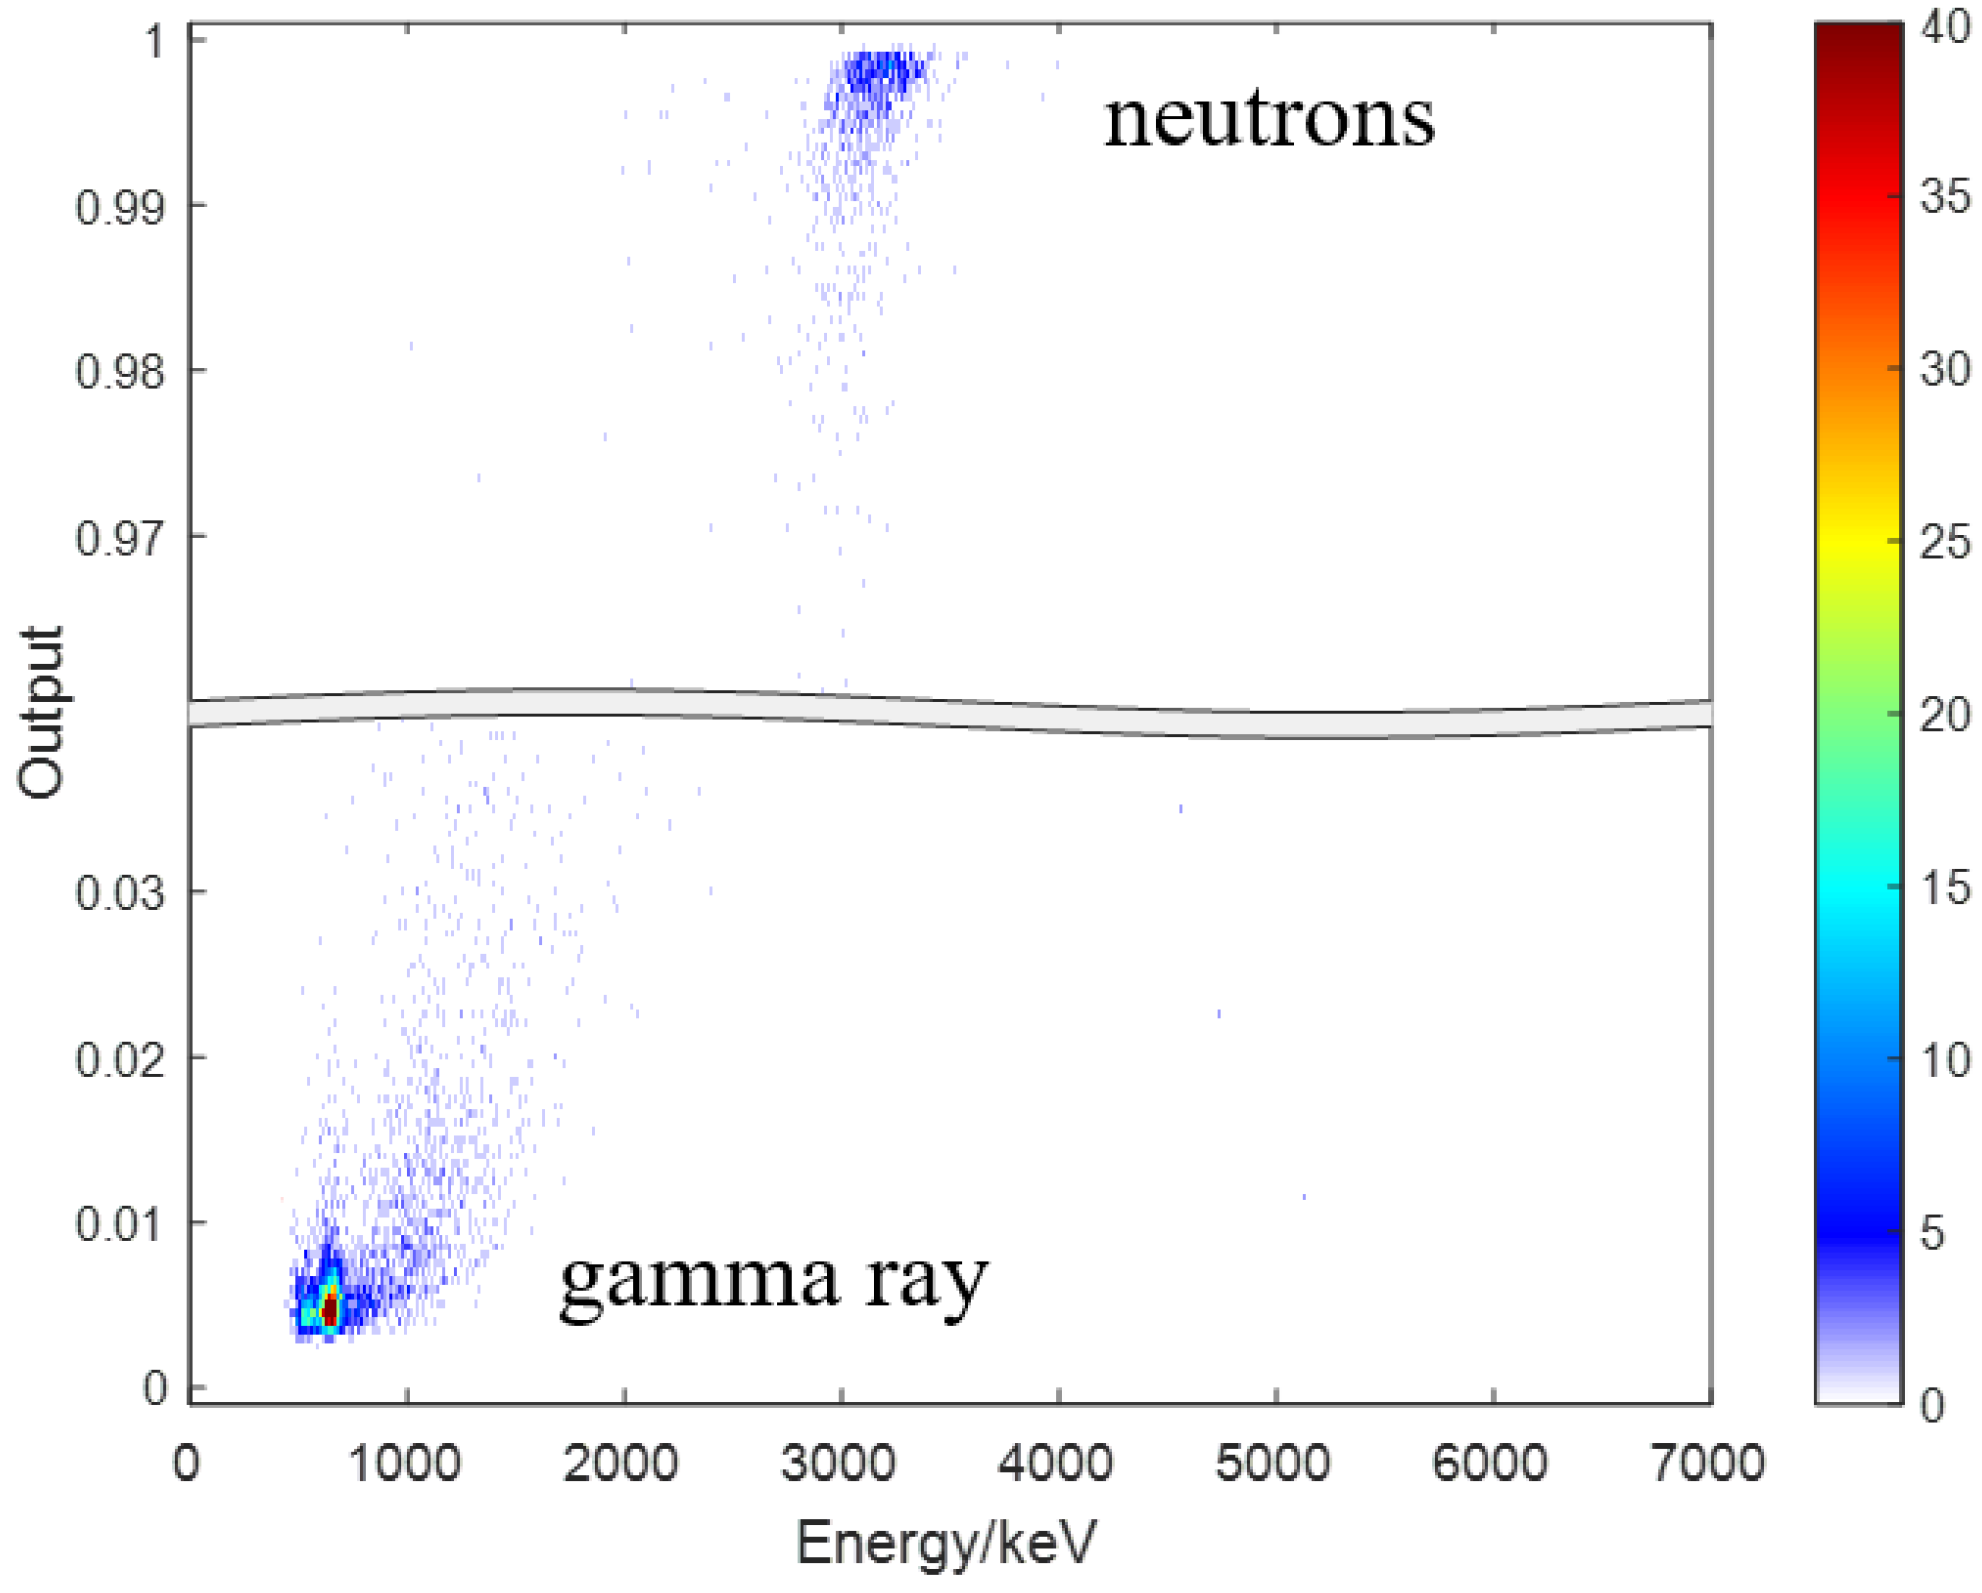
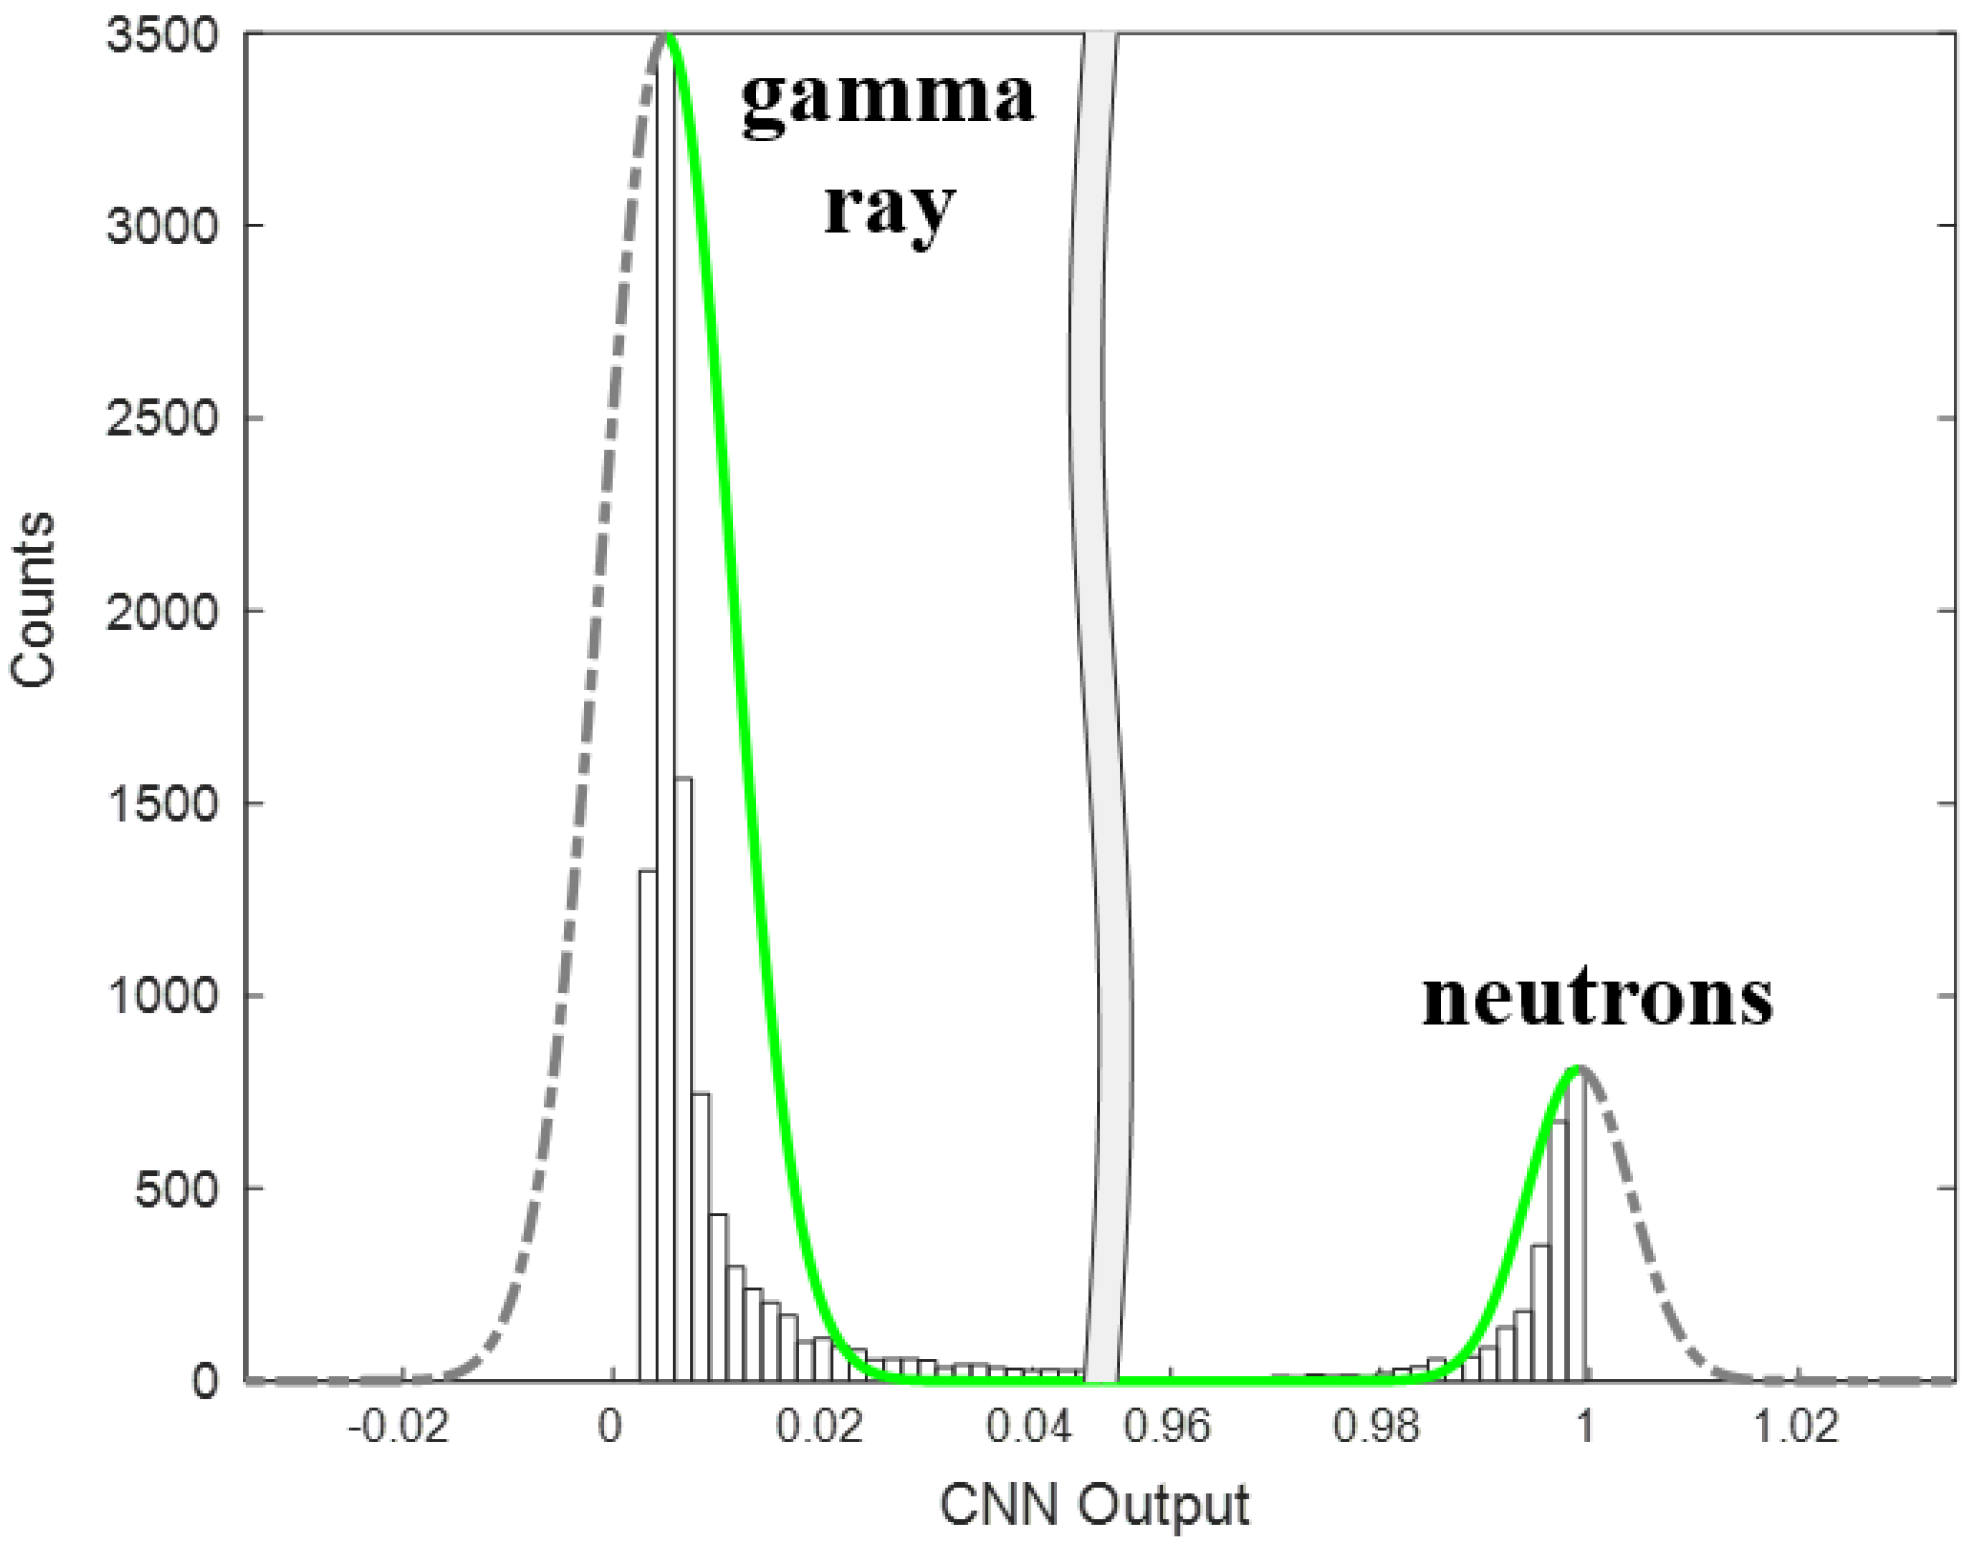
3.2. Convolutional Neural Network
| Algorithm 1 CNN algorithm process |
|
|
|
|
|
|
|
|
|
|
|
|
|
|
4. Results and Discussion
5. Conclusions
Author Contributions
Funding
Institutional Review Board Statement
Informed Consent Statement
Data Availability Statement
Conflicts of Interest
References
- Bourne, M.M.; Mussi, C.; Miller, E.C.; Clarke, S.D.; Pozzi, S.A.; Gueorguiev, A. Characterization of the CLYC detector for neutron and photon detection. Nucl. Instrum. Methods Phys. Res. Sect. A 2014, 736, 124–127. [Google Scholar] [CrossRef]
- Lee, D.; Stonehill, L.; Klimenko, A.; Terry, J.; Tornga, S. Pulse-shape analysis of Cs2LiYCl6:Ce scintillator for neutron and gamma-ray discrimination. Nucl. Instrum. Methods Phys. Res. Sect. A 2011, 664, 1–5. [Google Scholar] [CrossRef]
- Wang, Q.; Dai, H.; Deng, C.; Xie, B.; Wu, Y.; Tuo, X. Temperature dependence of SiPM array coupled Cs2LiYCl6:Ce3+ detector per-formance. Nucl. Instrum. Methods Phys. Res. Sect. A 2022, 1025, 166112. [Google Scholar] [CrossRef]
- Wang, Q.; Tuo, X.; Deng, C.; Liu, L.; Cheng, Y.; Zhang, C.; Yang, Y. Characterization of a Cs2LiYCl6:Ce3+ scintillator coupled with two silicon photomultiplier arrays of different Sizes. Nucl. Instrum. Methods Phys. Res. Sect. A 2019, 942, 162339. [Google Scholar] [CrossRef]
- Li, K.-N.; Zhang, X.-P.; Gui, Q.; Jin, P.; Tian, G. Characterization of the new scintillator Cs2LiYCl6:Ce3+. Nucl. Sci. Tech. 2018, 29, 1–6. [Google Scholar] [CrossRef]
- Budden, B.S.; Couture, A.J.; Stonehill, L.C.; Klimenko, A.V.; Terry, J.R.; Perry, J.O. Analysis of Cs2LiYCl6:Ce3+ (CLYC) waveforms as read out by solid state photomultipliers. In Proceedings of the 2012 IEEE Nuclear Science Symposium and Medical Imaging Conference Record (NSS/MIC), Anaheim, CA, USA, 27 October–3 November 2012; pp. 347–350. [Google Scholar] [CrossRef]
- Nocente, M.; Fazzi, A.; Tardocchi, M.; Cazzaniga, C.; Lorenzoli, M.; Pirovano, C.; Rebai, M.; Uboldi, C.; Varoli, V.; Gorini, G. Experimental investigation of silicon photomultipliers as compact light readout systems for gamma-ray spectroscopy applications in fusion plasmas. Rev. Sci. Instrum. 2014, 85, 11E108. [Google Scholar] [CrossRef] [PubMed] [Green Version]
- Dinar, N.; Celeste, D.; Puzo, P.; Silari, M. Characterization of CLYC scintillator coupled with photomultipliers and a large SIPM array. Radiat. Prot. Dosim. 2017, 180, 399–402. [Google Scholar] [CrossRef] [PubMed]
- Wang, Q.; Tuo, X.; Deng, C.; Zhang, Z.; Zhang, J.; Yang, J.; Yang, Y. Improvement on pulse-shape discrimination performance of SiPM array coupled Cs2LiYCl6:Ce3+ detector. J. Instrum. 2019, 14, P11005. [Google Scholar] [CrossRef]
- Takaku, D.; Oishi, T.; Baba, M. Development of Neutron-Gamma Discrimination Technique using Pattern-Recognition Method with Digital Signal Processing. Prog. Nucl. Sci. Technol. 2011, 1, 210–213. [Google Scholar] [CrossRef]
- Arahmane, H.; Mahmoudi, A.; Hamzaoui, E.M.; Maissa, Y.B.; El Moursli, R.C. Neutron-gamma discrimination based on support vector machine combined to nonnegative matrix factorization and continuous wavelet transform. Measurement 2020, 149, 106958. [Google Scholar] [CrossRef]
- Aspinall, M.D.; D’Mellow, B.; Mackin, R.O.; Joyce, M.J.; Hawkes, N.P.; Thomas, D.J.; Jarrah, Z.; Peyton, A.J.; Nolan, P.J.; Boston, A.J. Verification of the digital discrimination of neutrons and γ rays using pulse gradient analysis by digital measurement of time of flight. Nucl. Instrum. Methods Phys. Res. 2007, 583, 432–438. [Google Scholar] [CrossRef]
- Mesick, K.E.; Stonehill, L.C.; Morrell, J.T.; Coupland, D.D. Performance of Several Solid State Photomultipliers with CLYC Scintillator. In Proceedings of the 2015 IEEE Nuclear Science Symposium and Medical Imaging Conference (NSS/MIC), San Diego, CA, USA, 31 October–7 November2015. [Google Scholar]
- Dinar, N.; Celeste, D.; Silari, M.; Varoli, V.; Fazzi, A. Pulse shape discrimination of CLYC scintillator coupled with a large SiPM array. Nucl. Instrum. Methods Phys. Res. Sect. A 2019, 935, 35–39. [Google Scholar] [CrossRef]
- Cao, Z.; Miller, L.; Buckner, M. Implementation of dynamic bias for neutron–photon pulse shape discrimination by using neural network classifiers. Nucl. Instrum. Methods Phys. Res. Sect. A 1998, 416, 438–445. [Google Scholar] [CrossRef]
- Esposito, B.; Fortuna, L.; Rizzo, A. Neural neutron/gamma discrimination in organic scintillators for fusion applications. In Proceedings of the 2004 IEEE International Joint Conference on Neural Networks, Budapest, Hungary, 25–29 July 2004. [Google Scholar]
- Ronchi, E.; Söderström, P.A.; Nyberg, J.; Sundén, E.A.; Conroy, S.; Ericsson, G.; Hellesen, C.; Gatu Johnson, M.; Weiszflog, M. An artificial neural network-based neutron–gamma discrimination and pile-up rejection framework for the BC-501 liquid scintillation detector. Nucl. Instrum. Methods Phys. Res. Sect. A 2009, 610, 534–539. [Google Scholar] [CrossRef]
- Liu, G.; Aspinall, M.; Ma, X.; Joyce, M. An investigation of the digital discrimination of neutrons and γ rays with organic scintillation detectors using an artificial neural network. Nucl. Instrum. Methods Phys. Res. Sect. A 2009, 607, 620–628. [Google Scholar] [CrossRef]
- Zhang, C.-X.; Lin, S.-T.; Zhao, J.-L.; Yu, X.-Z.; Wang, L.; Zhu, J.-J.; Xing, H.-Y. Discrimination of neutrons and γ -rays in liquid scintillator based on Elman neural network. Chin. Phys. C 2016, 40, 086204. [Google Scholar] [CrossRef] [Green Version]
- Lecun, Y.; Bottou, L.; Bengio, Y.; Haffner, P. Gradient-based learning applied to document recognition. Proc. IEEE 1998, 86, 2278–2324. [Google Scholar] [CrossRef] [Green Version]
- Ketkar, N. Convolutional Neural Networks; Springer International Publishing: Berlin/Heidelberg, Germany, 2017; pp. 197–242. [Google Scholar]
- LeCun, Y.; Bengio, Y. Convolutional networks for images, speech, and time-series. In The Handbook of Brain Theory & Neural Networks; University of Montreal: Montreal, QC, Canada, 1995; ED-11; pp. 34–39. [Google Scholar]
- Bouvrie, J. Notes on Convolutional Neural Networks; Technical Report TR-0200 (4230-46)-3; Aerospace Corp.: Los Angeles, CA, USA, 2006. [Google Scholar]
- Jeong, Y.; The NEOS II Collaboration; Han, B.Y.; Jeon, E.J.; Jo, H.S.; Kim, D.K.; Kim, J.Y.; Kim, Y.D.; Ko, Y.J.; Lee, H.M.; et al. Pulse-shape Discrimination of Fast Neutron Background using Convolutional Neural Network for NEOS II. J. Korean Phys. Soc. 2020, 77, 1118–1124. [Google Scholar] [CrossRef]


| Physical Quantity | Parameter |
|---|---|
| melting point/°C | 640 |
| density/gꞏcm | 3.31 |
| refractive index | 1.81 @405 nm, @ means the measurement condition |
| emission spectrum/nm | 275–450 |
| emission peak/nm | 370 |
| Decay times/ns | 1(CVL), 50 (Ce3+), 1000 (Ce-STE) |
| Light yield | ~20,000 ph/MeV (gammas), ~70,000 ph/thermal neutron |
| Model | Response Spectrum/nm | Peak Wavelength/nm |
|---|---|---|
| SenSL MicroJseries | 200–900 | 420 |
| Input Signal Format | Training Time (min) | Accuracy (%) |
|---|---|---|
| One-dimensional vector | 142.50 | 97.73 |
| Two-dimensional matrix | 96.21 | 99.67 |
| Method | Number of Neutrons | Number of Gamma Rays | Total Number |
|---|---|---|---|
| Charge comparison | 4535 | 38 | 4573 |
| CNN | 4536 | 37 |
Publisher’s Note: MDPI stays neutral with regard to jurisdictional claims in published maps and institutional affiliations. |
© 2022 by the authors. Licensee MDPI, Basel, Switzerland. This article is an open access article distributed under the terms and conditions of the Creative Commons Attribution (CC BY) license (https://creativecommons.org/licenses/by/4.0/).
Share and Cite
Lu, J.; Tuo, X.; Yang, H.; Luo, Y.; Liu, H.; Deng, C.; Wang, Q. Pulse-Shape Discrimination of SiPM Array-Coupled CLYC Detector Using Convolutional Neural Network. Appl. Sci. 2022, 12, 2400. https://doi.org/10.3390/app12052400
Lu J, Tuo X, Yang H, Luo Y, Liu H, Deng C, Wang Q. Pulse-Shape Discrimination of SiPM Array-Coupled CLYC Detector Using Convolutional Neural Network. Applied Sciences. 2022; 12(5):2400. https://doi.org/10.3390/app12052400
Chicago/Turabian StyleLu, Jing, Xianguo Tuo, Hongchao Yang, Yushi Luo, Haolin Liu, Chao Deng, and Qibiao Wang. 2022. "Pulse-Shape Discrimination of SiPM Array-Coupled CLYC Detector Using Convolutional Neural Network" Applied Sciences 12, no. 5: 2400. https://doi.org/10.3390/app12052400