Article

Physico-Chemical and Sensory Quality of Oven-Dried and Dehydrator-Dried Apples of the Starkrimson, Golden Delicious and Florina Cultivars

Faculty of Food Engineering, Stefan cel Mare University of Suceava, 720229 Suceava, Romania
*
Author to whom correspondence should be addressed.
Appl. Sci. 2022, 12(5), 2350; https://doi.org/10.3390/app12052350
Submission received: 1 February 2022 / Revised: 16 February 2022 / Accepted: 22 February 2022 / Published: 24 February 2022

Abstract

:
Apple fruits are high in phenolic compounds, sugar and dietary fiber content and are rich in malic acid and vitamins, with a significant impact on the organoleptic quality and its health-promoting properties. They can be turned out in value-added product such as apple chips due to the low cost of raw material. The aim of the study was to obtain apple chips, fat-free, healthy, traditionally dried and without added sugar, which can be easily obtained and capitalized economically, as well as the evaluation of their physico-chemical and sensory qualities. The apple chips were produced from three apple cultivars (‘Starkrimson’, ‘Golden Delicious’ and ‘Florina’) by drying the apple fruits in an oven and a dehydrator at 65 °C. To inactivate the browning enzymes, the apple slices were immersed in a solution of lemon salt (4%) for 7 min before drying. Apple chips were sensory-evaluated and relevant parameters were analyzed at defined intervals during storage at room temperature up to 21 days. The water activity (aw) values of apple chip samples dried in the oven ranged from 0.544 to 0.650, while for the samples dried in the dehydrator, aw values were between 0.374 and 0.426. During the storage, the pH of apple chips varied very little, while titratable acidity increased for all samples. Compared with fresh apple slices, it was observed that the total soluble solids (TSS) content of all dried apple chip samples decreased. Color parameters and browning and whitening indexes differed depending on the apple cultivars and dryer type used.

1. Introduction

Apple (Malus domestica) is an important fruit produced in large quantities worldwide, ranked third after bananas and watermelons according to FAO [1], while in the European Union (EU), apples are ranked first, followed by oranges [2]. Fresh apple consumption in the EU is approximately 15 kg per capita and is expected to increase by 1 kg by 2030, while consumption of processed apples is around 8 kg per capita [3]. Apples are popular due to their availability throughout the year in various forms: fresh and dried fruits, juice, cider, puree. It is well known that the consumption of apples has various benefits for human health [4,5,6]. Current demand for natural products involves the continued development of small producers who process apples in various forms, apple chips or apple cider in food markets, restaurants and bars. Koutsos et al. [7] affirmed that apple consumption positively affects lipid metabolism, vascular function, inflammation and weight management. Apple snacks can increase the amount of consumed fruits. In the food industry, drying is a widely used method of producing apple snacks [8,9]. Apple fruits are not only preserved by drying, but the dried products obtained can be stored and transported at a relatively low cost [10,11]. Dried fruits can be consumed at breakfast and as snacks or incorporated in prepackaged cereals and baked goods [12,13,14]. Carughi et al. [15] suggested that dried fruits contribute to good health as well as fresh fruits, and they ensure satiety and have beneficial influence on the glycemic index and blood pressure. Kowalska et al. [11] stated that consumers are interested in food products rich in dietary fiber and macro- and micronutrients. Traditional dried fruits (with no added sugar) are appreciated for their sweetness, higher fiber content and long-term stability. They have a nutritional profile similar to the original food. In addition, it is considered that increasing the consumption of natural sweeteners can have a positive effect on body weight and metabolism [16]. Oven-drying and microwave-drying techniques are the most used for fruit drying. It is considered that drying with hot air is the most commonly utilized drying method [17]. There are various pre-treatment methods applied; among them are sulfite treatment, osmotic dehydration, steam blanching, ultrasonic treatment, etc. [18,19,20], which may influence the dry products’ properties. Color and visual appearance are evaluated first by the consumers, followed by taste and aroma [21]. The color and sensory attributes change during fruit drying [22,23]. The dried apple color can change due to the drying method: the apple may darken, and the color may change from green to red or from yellow to blue [12]. Marzec et al. [24] suggested that polyphenol oxidase and non-enzymatic reactions can be responsible for product darkening. It is considered that the water activity of the fruit decreases during the dehydration process, thus influencing the enzymatic activity and possible alteration [25]. The water activity during apple drying is reduced to a level that ensures microbiological safety [12,26].
The apple fruits used in this study were purchased from the North East of the country, known for its centuries-old tradition of growing fruit trees, especially apples. Between 1978 and 1982, the state system organized the first huge orchard in Curtesti (10 km from Botosani) on a scientific basis. The orchard had over 400 hectares all cultivated with apples. Even though only 60 hectares are still cultivated with apples today, the tradition is continued, and the orchard has been rejuvenated. The fruit-growing area from North East of the country is revived following the investments of the last years, is known as a major apple production nationwide and has many small farms that use family and local labor [4]. Current demand for natural products involves the continued development of small producers who process apples in various forms, apple chips or apple cider in food markets, restaurants and bars. To support these small producers, dried apple chips were produced from readily available raw materials, from abundant cultivars of apples existing in this area of the country, and evaluated in terms of physico-chemical and sensory properties. These products can be easily obtained and economically capitalized. The easiest way to obtain apple chips is by drying them in the oven, maintaining the temperature between 60 and 70 °C, without the need for special equipment. Drying in the oven is faster compared to drying in the sun or in a food dehydrator [27]. For small producers, who operate in the food markets, restaurants and bars, it can be quite useful in preserving the fruits and for their economic aspects, especially if the fresh fruits remain unsold.
The aim of this study was to obtain a healthy and appreciated product, dried apple chips, fat-free, with no sugar added, from available and abundant low-cost raw materials, namely three apple cultivars ‘Starkrimson’, ‘Golden Delicious’ and ‘Florina’.
In this study, drying of apple fruits was performed by using two types of dryers (oven and dehydrator). Physical and chemical quality attributes, including moisture, water activity, active acidity, titratable acidity, total soluble solids and total sugar contents, electrical conductivity, color of fresh apple slices and traditional dried apple chips, were evaluated. In addition, sensory and statistical evaluation was performed. Physico-chemical and sensory quality of dried apple chip samples were also determined at 7, 14 and 21 days during storage at room temperature. Finally, statistical correlations between physico-chemical parameters were obtained.

2. Materials and Methods

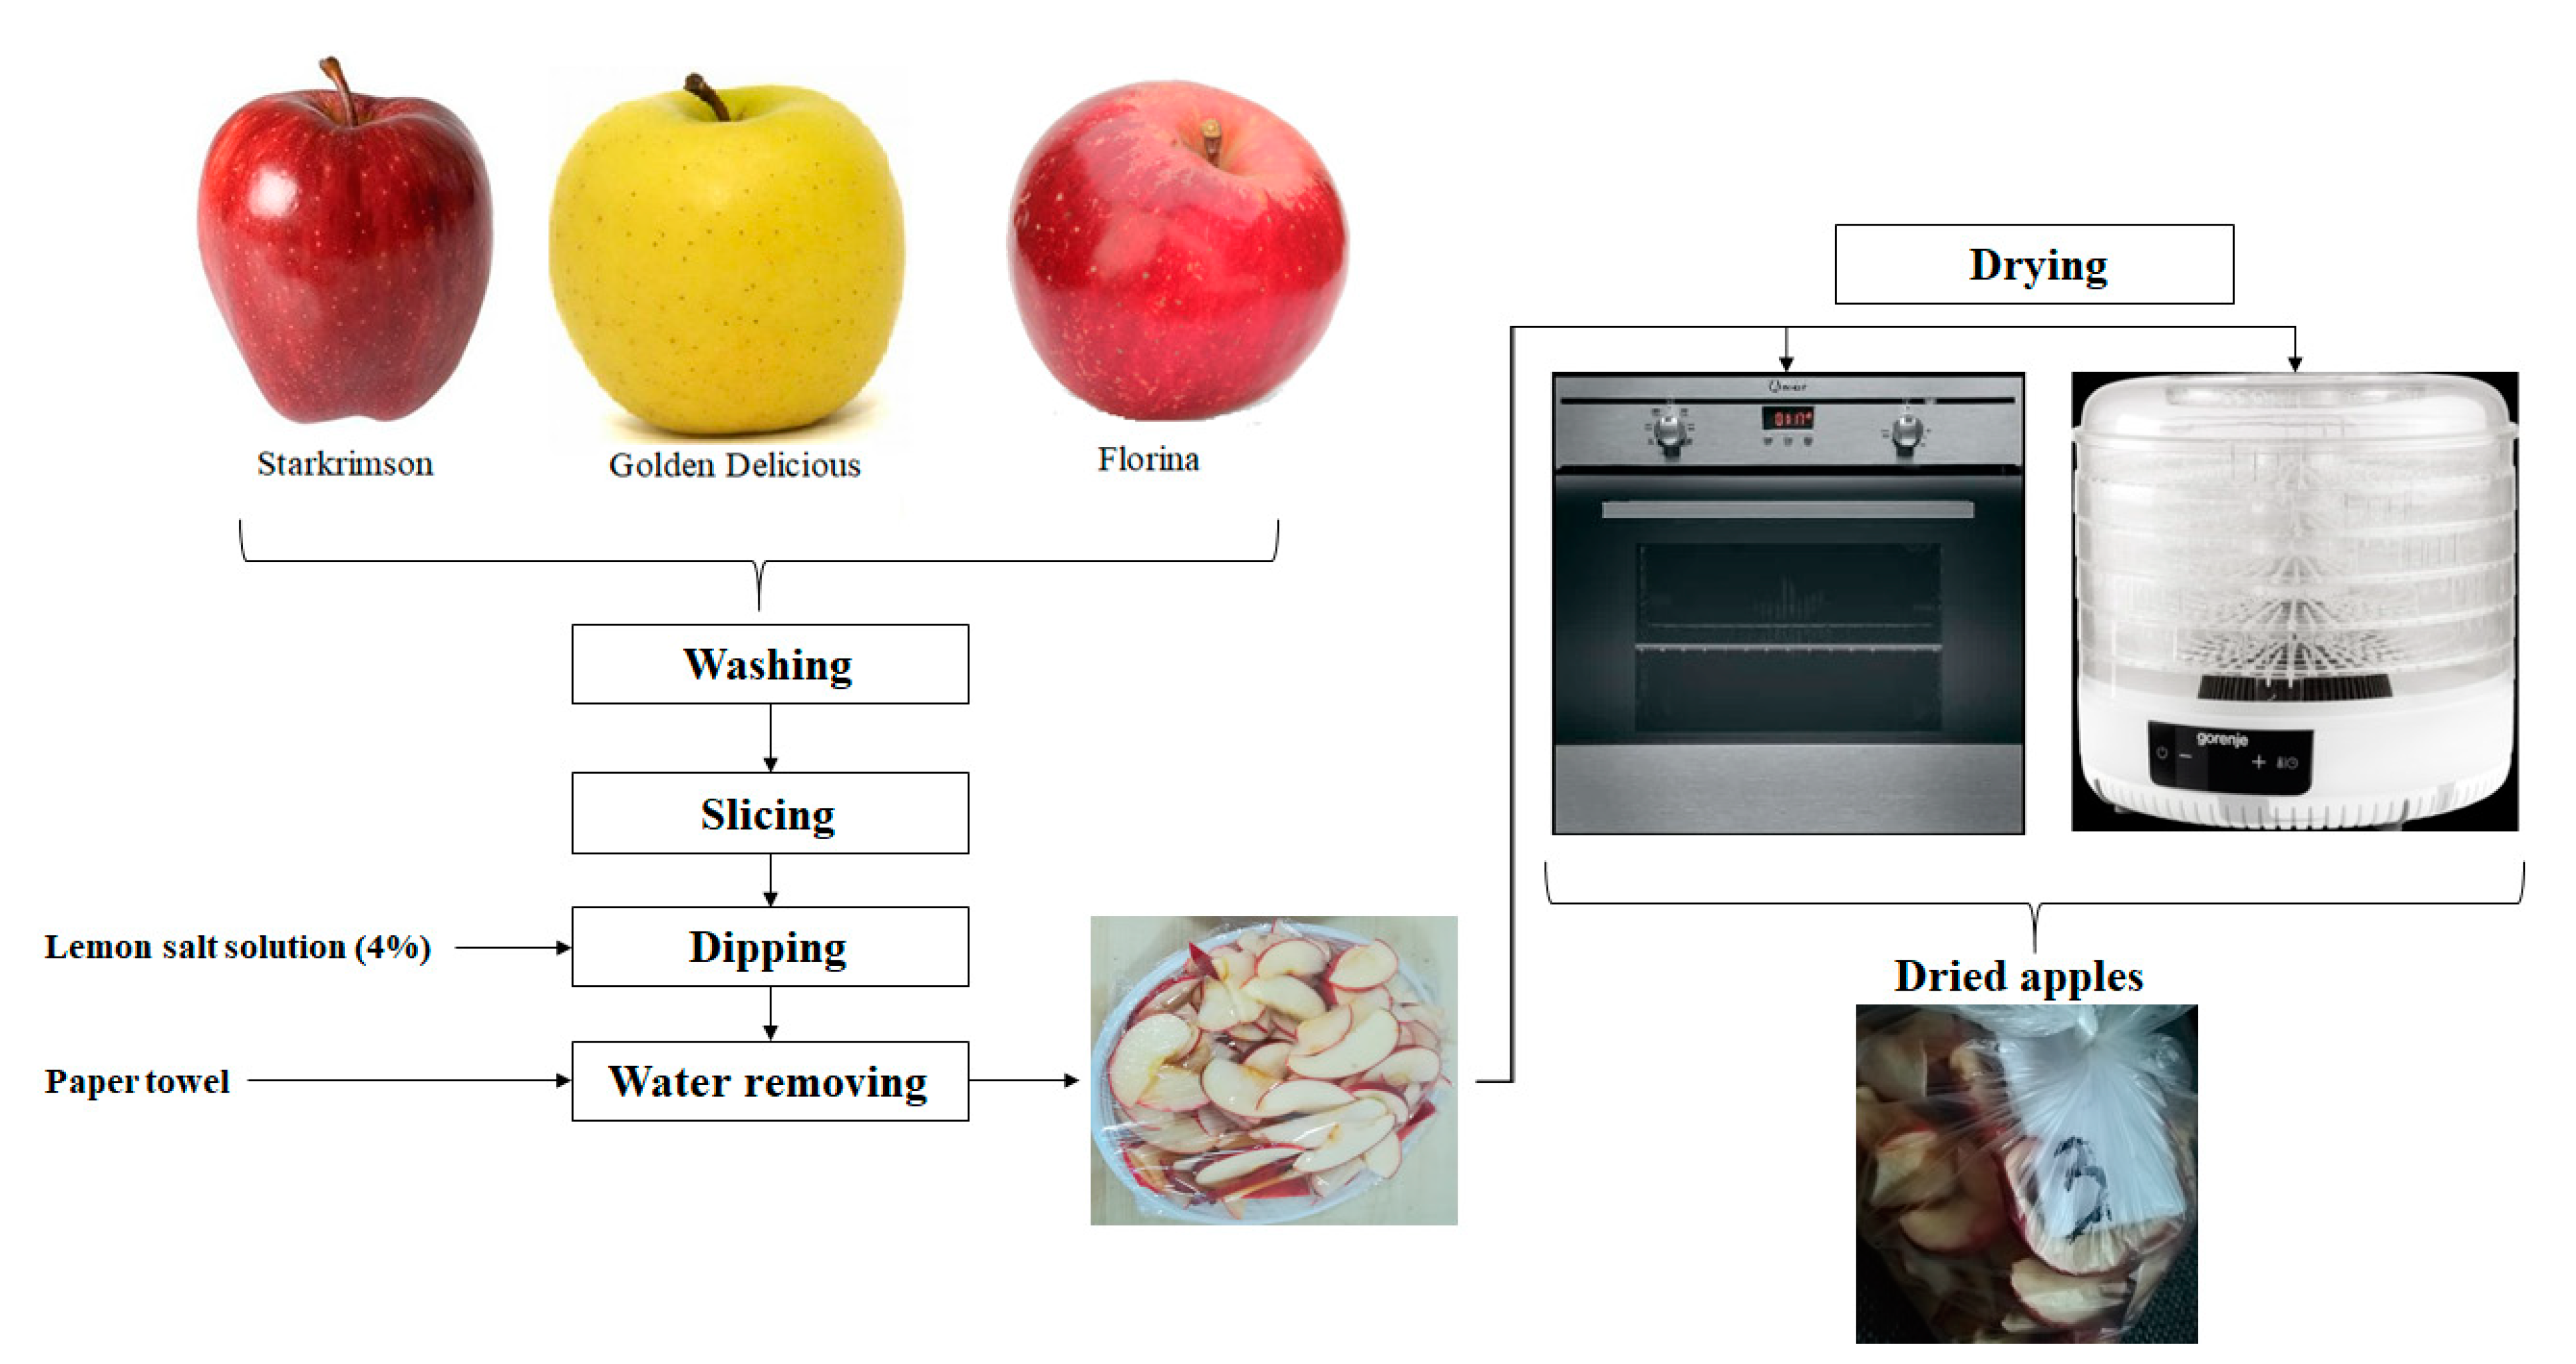
2.1. Sample Preparation and Drying

Apples (‘Starkrimson’ (S), ‘Golden Delicious’ (G) and ‘Florina’ (F) cultivars, Figure 1) were procured from a local apple orchard of Botosani, Romania. Fresh apples were selected, washed and sliced longitudinally, following their vertical axis, into slices 4 mm and 3–7 cm thick using a kitchen knife (after removing the apple core) and then dipped in a lemon salt solution (4%) for 7 min to inactivate browning enzymes, according to the methods described by Nyangena et al. [28] and ElHana [29] with minor modifications. The dipping was performed under normal conditions (light and room temperature). The apple slices were removed from the solution and washed with distilled water. After that, the adhering water was removed at the end of immersion by using paper towel. Samples were then loaded in perforated trays and subjected to drying, up to constant weight. Drying was performed by using two types of dryers: oven (Indesit on gas) and dehydrator (Gorenje, electric). The dehydrator controls and keeps the internal temperature constant, while the oven tends to fluctuate the temperature. The oven door was kept slightly open (1 to 2 inches) during drying, and a thermometer was used to check the oven temperature [27]. The drying temperature was 65 °C; all samples were dried to constant weight (Figure 1). There are numerous studies on apple chip drying at temperatures between 40 and 90 °C (convective drying) [30] but also between 35 and 85 °C (microwave, infrared or vacuum freeze-drying) [31]. According to Önal et al. [32], drying apples at 65 °C seems to be a good process to produce healthy, high-quality snacks for both consumers and the food industry.
Dried samples were cooled down and packed in plastic bags (HDPE) and stored at room temperature. Approximately 194 g of dried apple chips (172 g ‘Golden Delicious’ cultivar, 201 g ‘Florina’ cultivar and 209 g ‘Starkrimson’ cultivar) can be obtained from 1 kg of apples dehydrated in the oven, while from 1 kg of apples dried in dehydrator, an average of about 167 g of dried apple chips (158 g ‘Starkrimson’ cultivar, 169 g ‘Florina’ cultivar and 175 g ‘Golden Delicious’ cultivar) can be obtained. After removing the apple core, between 12 and 16% of the apple content can be lost, depending on the cultivar of apple (10.36–12.91% ‘Starkrimson’ cultivar, 15.44–16.33% ‘Golden Delicious’ cultivar, 11.79–19.21% ‘Florina’ cultivar).

2.2. Physico-Chemical Analysis

Apple water extract for determination of active acidity, titratable acidity, total soluble solids contents and electrical conductivity was prepared as follows: 50 mL of distilled water was added to 20 g of fresh/dried apples measured with a precision of 0.01 g. The content was heated on a water bath brought to boil for 30 min. After boiling, the extract was cooled, and the content was brought to 250 mL with distilled water and then filtered.
Moisture (M) was determined by oven-drying method; thus 5 g of apple slices from each sample was weighed and dried at 105 °C until constant weight [20,33].
Water activity (aw) was determined by using a water activity meter AquaLab Lite (Decagon, WA, USA). The determinations were performed at 25 °C, and all samples were measured in triplicates. In a special cuvette was introduced approximately 3 g of the sample; after that, the cuvette was placed in aw chamber, and the water activity was measured and displayed on the water activity meter screen [33].
Active acidity was determined by pH measurements at ambient temperature using laboratory pH meter Fisher Scientific ACCUMET Bio Set AE150 (Fisher, Waltham, MA, USA). For each sample, a 10 mL volume of apple extract was measured, the pH electrode was inserted, and after stabilization, the pH value was displayed on the pH meter screen [34].
Titratable acidity (TA) was obtained by titrating 50 mL of apple water extract with 0.1 N NaOH solution, in the presence of 1% phenolphthalein solution. The TA values were calculated according to Sadler and Murphy [35], and the results are expressed as malic acid (%) [36]. In apple, malic acid is the predominant acid (80–90% of the organic acids) that contributes to sourness of fruits [35,37].
Total soluble solids contents (TSS) were measured by using a digital hand-held refractometer standardized with distilled water. Two drops of fresh/dried apple extract were placed on the refractometer lens and measured. The obtained values were corrected to the equivalent reading at 20 °C [38,39] and reported as ‘degrees Brix’ (°Brix) which is equivalent to percentage (%) [40].
Total sugar contents in fresh and dried apple samples were determined by applying Fehling’s method. Into a 300 mL Erlenmeyer flask, was placed 20 mL of the defecated extract, then 10 mL of Fehling I solution and 10 mL of Fehling II solution. The vessel was heated on an asbestos sieve, adjusting the flame for boiling, and boiled for exactly 2 min. The flask was cooled rapidly under running water, and then 20 mL of KI solution and 15 mL H2SO4 were added. Released iodine was titrated with 0.1 N Na2S2O3 in the presence of starch (1%) as an indicator. Results were expressed in %.
Sugar/acid ratio was calculated as the total sugars content divided by titratable acidity.
Electrical conductivity (EC) of samples was measured with a laboratory conductometer VioLab COND 51+ Set (ROTH, Germany) and was expressed in μS/cm. The conductometer electrode, after calibration, was inserted into 10 mL of apple extract, and after stabilization, the electrical conductivity value was displayed on the conductometer screen. Three readings were performed for each sample analyzed.
Color analysis was performed by using Konika Minolta CR 400 colorimeter (Konica Minolta, Tokyo, Japan). The samples were introduced in a 20 mm cuvette and measured in a white spectrum. In order to establish the results, three readings were performed. The measurements were displayed in L* (light–dark spectrum, from 0 = black to 100 = white), a* (green–red spectrum; −a = green, +a = red), b* (blue–yellow spectrum; −b = blue, +b = yellow) and ΔE (total change in the color of samples) values [9,39,41].
Browning index (BI) was calculated with Equation (1) and represents the brown color purity, due to enzyme activity, in the apple [17,33], while whitening index (WI), which corresponds to apple discoloration and lesser browning, was calculated according to Equation (2) [42,43].
B I = 100 0.17 ( a * + 1.75 L * 5.645 L * + a * 3.012 b * 0.31 )
W I = 100 ( 100 L * ) 2 + a * 2 + b * 2

2.3. Sensory Evaluation

Sensory analysis can be performed in order to establish if the obtained apple chips are different and what the magnitude of these differences is. In this case, according to Ackbarali and Mahara [44], 8 to 12 panelists or 6 to 10 trained panelists are required to assess intensity for sensory attributes, and analysis of variance assessment should be applied to determine whether the means are statistically different. Velickova et al. [33] indicated 15 evaluators with experience in descriptive evaluation of crunchy products that were used to evaluate apple chips. Cliff et al. [45] indicated that 20 students and staff performed a sensory evaluation of fresh-cut apple slices, while in Chauhan et al.’s [10] study, the sensory attributes of osmo-dried apples were evaluated by a trained panel of 10 staff members of their laboratory. In addition, a panel of 15 people (after training) evaluated the color, texture, aroma, sweetness and acidity of the dried apples obtained by Wang et al. [20], while dried red apple cubes produced by Kidoń and Grabowska [26] were evaluated only by a 5-member panel with formal classroom training in sensory evaluation, and a 5-member panel evaluated color, texture and taste of dried apples gamma-irradiated in Hussain et al.’s [46] study.
In the current study, the sensory evaluation was performed in laboratory conditions by a panel of 11 engineers from food industry, with experience and familiarity with sensory assessment method. Each of the panelists evaluated the appearance, color, aroma, taste and overall acceptability of the dried apple chip samples. The scoring was based on the nine points of the standard hedonic scale, where 9 denoted ‘like extremely’, 5 ‘neither like nor dislike’, and 1 indicated ‘dislike extremely’ [9,20,21,47]. The sensory evaluation experiment was repeated three times.

2.4. Statistical Analysis

All experiments were performed in triplicates, and the results were expressed as mean values ± standard mean error. The procedure for performing the experiments in triplicate was simply adopted by tradition. Singer et al. [48] investigated the use of m-plicates and demonstrated that m-plicates do not significantly improve the accuracy of the estimates. Triplicate measurement for determination of chemical composition of apple fruits from eight apple cultivars (‘Delicious’, ‘Golden Delicious’, ‘Ralls’, ‘Fuji’, ‘QinGuan’, ‘Jonagold’, ‘Granny Smith’ and ‘Orin’) was performed by Wu et al. [49], while Preti and Tarola [50] adopted the same procedure in triplicate to determine antioxidant capacity and polyphenolic and major mineral composition of 14 ancient apple cultivars in Italy. In addition, Ergün [51] determined the biochemical contents of peel and pulp of fresh, oven-dried and sun-dried apple samples from the following apple cultivars: ‘Amasya’, ‘Braeburn’, ‘Golden Delicious’, ‘Granny Smith’ and ‘Starking’, in triplicate.
An analysis of variance (ANOVA) with a confidence interval of 95% (p < 0.05), with Tukey test, was used for comparison of physico-chemical and sensory evaluation results. Pearson correlations between measured and calculated parameters were determined. The statistical analysis was performed by using statistical software Minitab, version 17. According to Minitab [52]: ‘the null hypothesis states that the parameter means are all equal’.

3. Results and Discussion

3.1. Moisture and Water Activity

Moisture content in the fresh apple samples was in the range of 83.97 ± 0.08% (‘Starkrimson’ cultivar) to 86.27 ± 0.31% (‘Florina’ cultivar). In the case of fresh samples from the ‘Golden Delicious’ cultivar, the moisture content was determined as 86.03 ± 0.06%. These values are close to those reported in other papers. For example, Iordănescu et al. [53] obtained the following values for apple moisture content: 83.04 ± 0.87% ‘Starkrimson’ cultivar, 86.12 ± 1.35% ‘Florina’ cultivar and 84.61 ± 0.58% ‘Golden Delicious’ cultivar.
After drying in the oven, the following moisture values were obtained for the apple samples: 6.63 ± 0.01% (‘Florina’ cultivar), 6.83 ± 0.03% (‘Golden Delicious’ cultivar) and 7.08 ± 0.04% (‘Starkrimson’ cultivar). The moisture content of apple chip samples dried in the dehydrator ranges between 5.06 ± 0.03% (‘Florina’ cultivar) and 6.29 ± 0.03% (‘Golden Delicious’ cultivar). For samples of the ‘Starkrimson’ apple cultivar dried in a dehydrator, an average moisture of 5.55 ± 0.05% was obtained. These values are close to those reported by Velickova et al. [33] who obtained, by conventional drying, apple chips with moisture values between 5.17 ± 0.23 and 6.04 ± 0.31%, from fresh ‘Idared’ apples with 88.7 ± 3.9% water content.
Water activity shows how closely the water in an apple slice is bound. If aw values are less than 0.8, it means that the food has low water activity, and the most enzymatic reactions are slowing down. It is considered that the target value of dried products is aw = 0.6, which is the general level limit for the growth of molds, yeasts and bacteria [13,54,55,56]. In Figure 2 are illustrated the aw values obtained for fresh and dried apple chip samples. The aw of dried apple chip samples was investigated also at 7, 14 and 21 days during storage at room temperature. The highest value of aw (0.910) for the fresh apple sample was obtained for samples from the ‘Golden Delicious’ cultivar, followed by samples from the ‘Starkrimson’ cultivar with a mean value of 0.906. The aw mean value obtained for samples from the ‘Florina’ cultivar is slightly lower than those obtained for the samples of the other two cultivars. The water activity values for the oven-dried apples range from 0.544 to 0.650 with the highest value obtained for samples from the ‘Starkrimson’ cultivar and the lowest for the samples from the ‘Florina’ cultivar. In the case of apple chips dried in the dehydrator, it was observed that the highest mean value (0.426) was obtained for samples from the ‘Golden Delicious’ cultivar, while the lowest value (0.374) was determined for samples from the ‘Starkrimson’ cultivar. According to the results obtained, the water activity is below 0.6 for almost all samples of dried apple chips, with one exception. The obtained values are close to those reported by Klewicki et al. [55] for osmo-convectively-dried ‘Idared’ apple samples (aw = 0.542) and Kahraman et al. [17] (2021) who dried ‘Gala’ apples using hot air drying (aw = 0.345) and non-thermal ultrasound contact drying (aw = 0.386).
It can also be observed that the samples dried in the dehydrator have lower water activity values than those dried in the oven. Over time, up to 21 days, the aw values of dried apples vary, and it was observed that aw increases by about 41% and 10% in the case of ‘Starkrimson’ cultivar samples dried in a dehydrator and oven, respectively. The aw value of ‘Florina’ cultivar samples dried in a dehydrator increases by 24% until the twenty-first day, while for the samples dried in the oven, the aw value increase was only 3%. In the case of ‘Golden Delicious’ cultivar samples, the aw values increase only for the samples dried in the oven by 5%, while for the samples obtained in the dehydrator, an insignificant variation of aw values with time was observed.

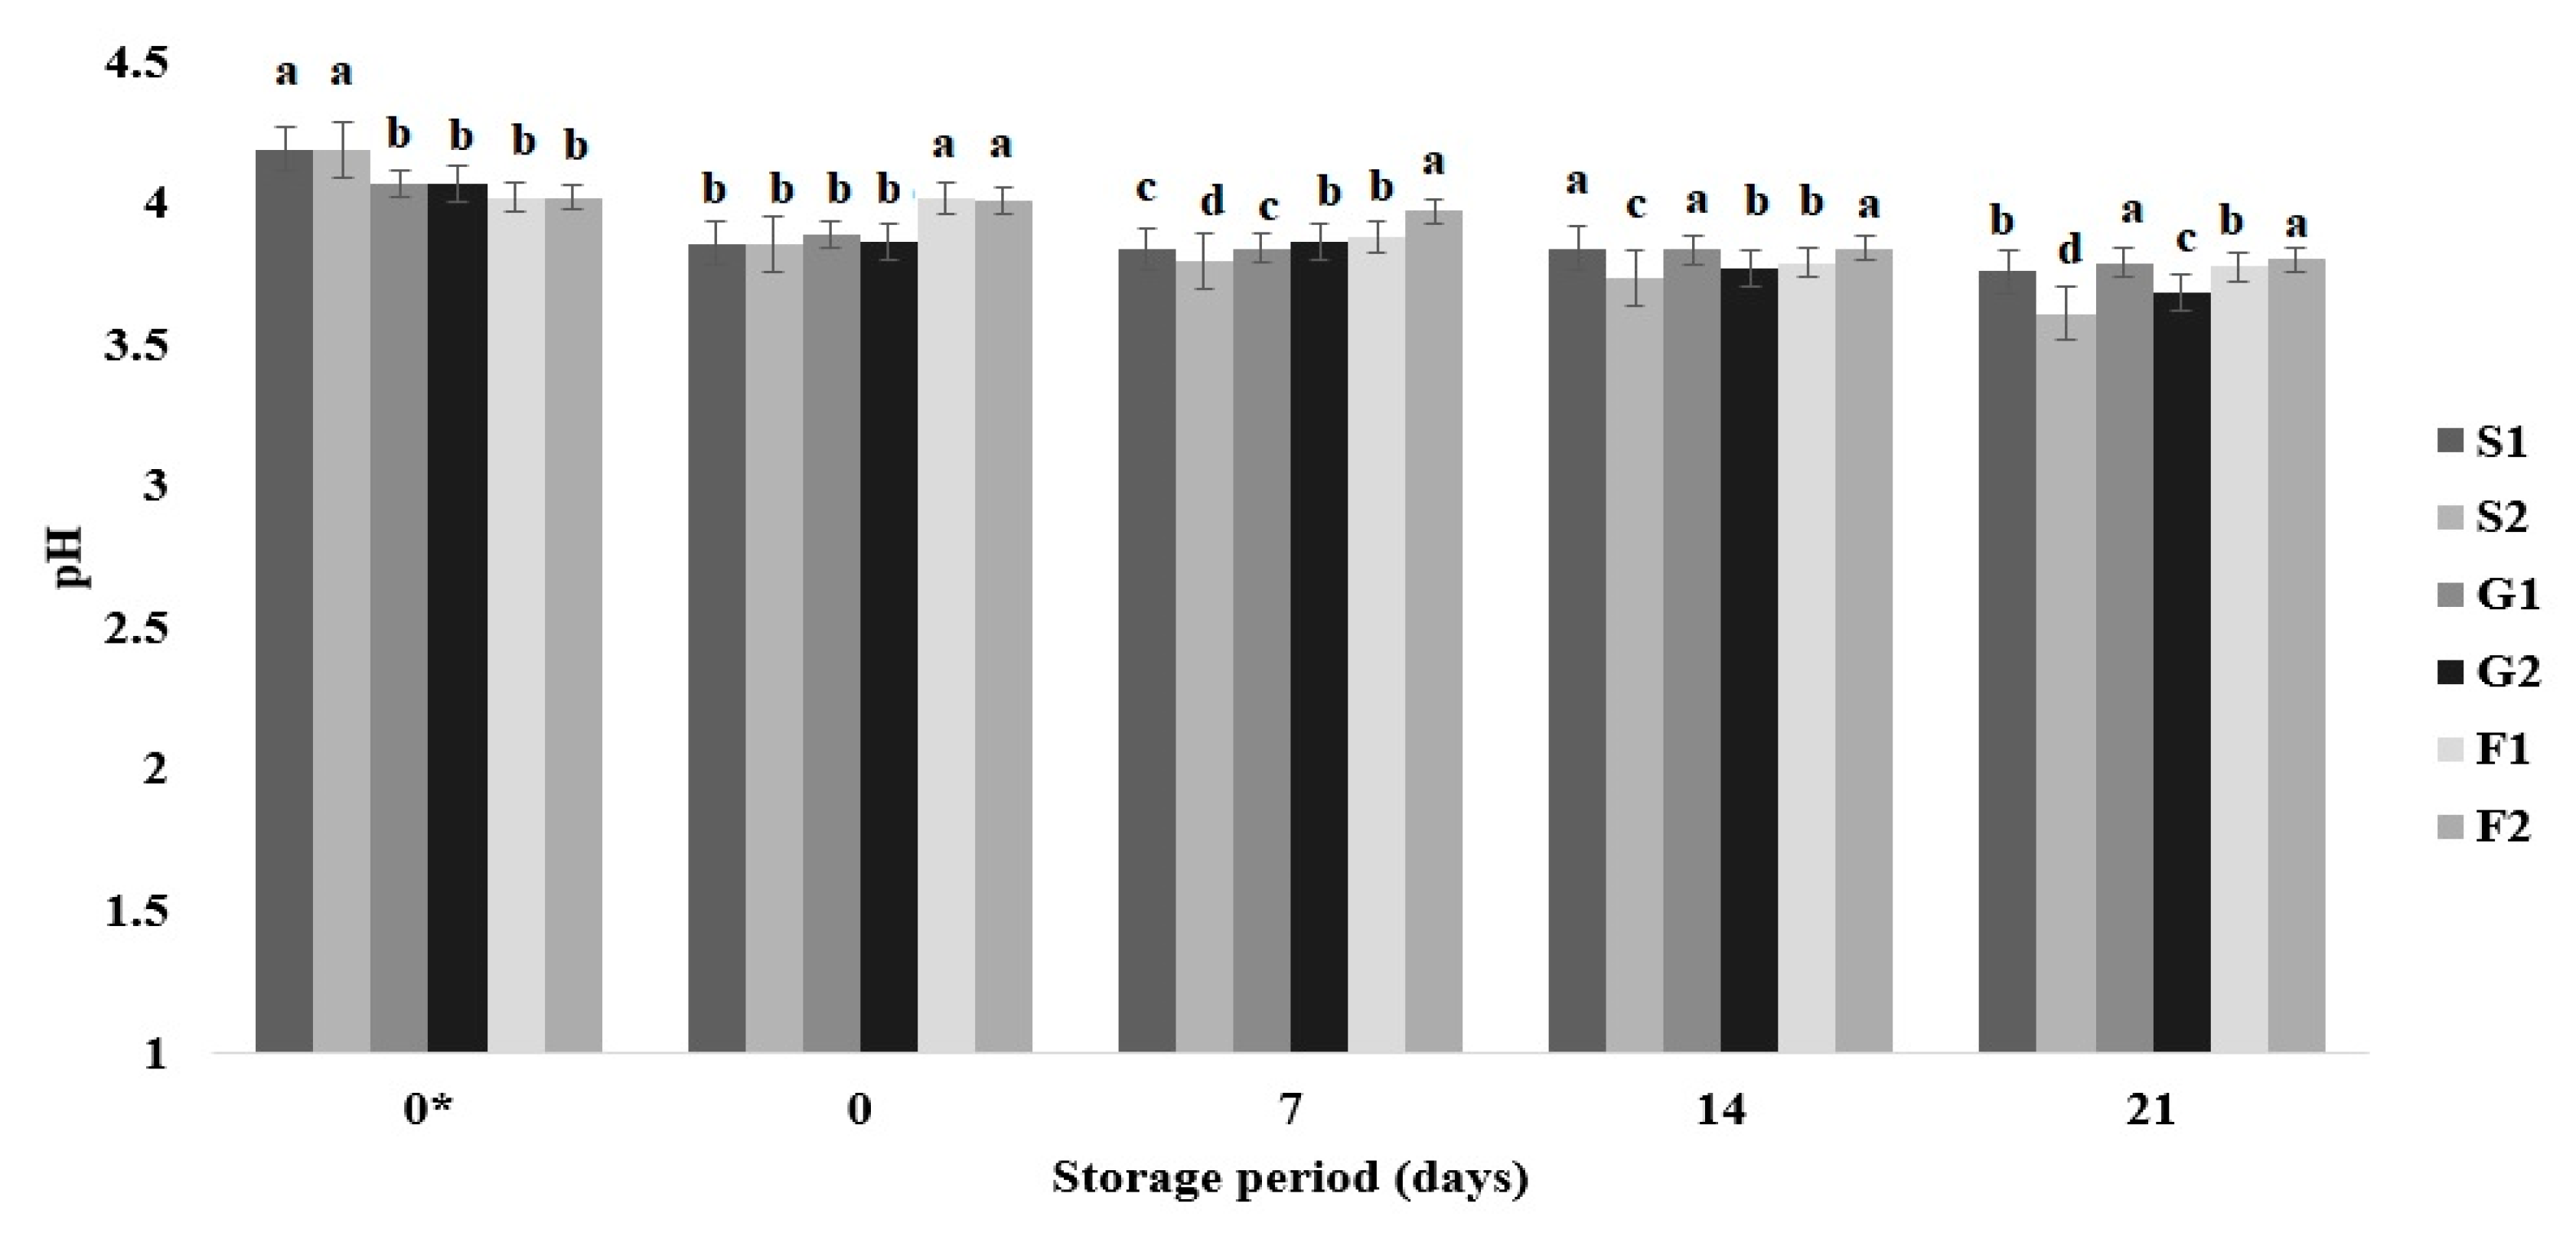
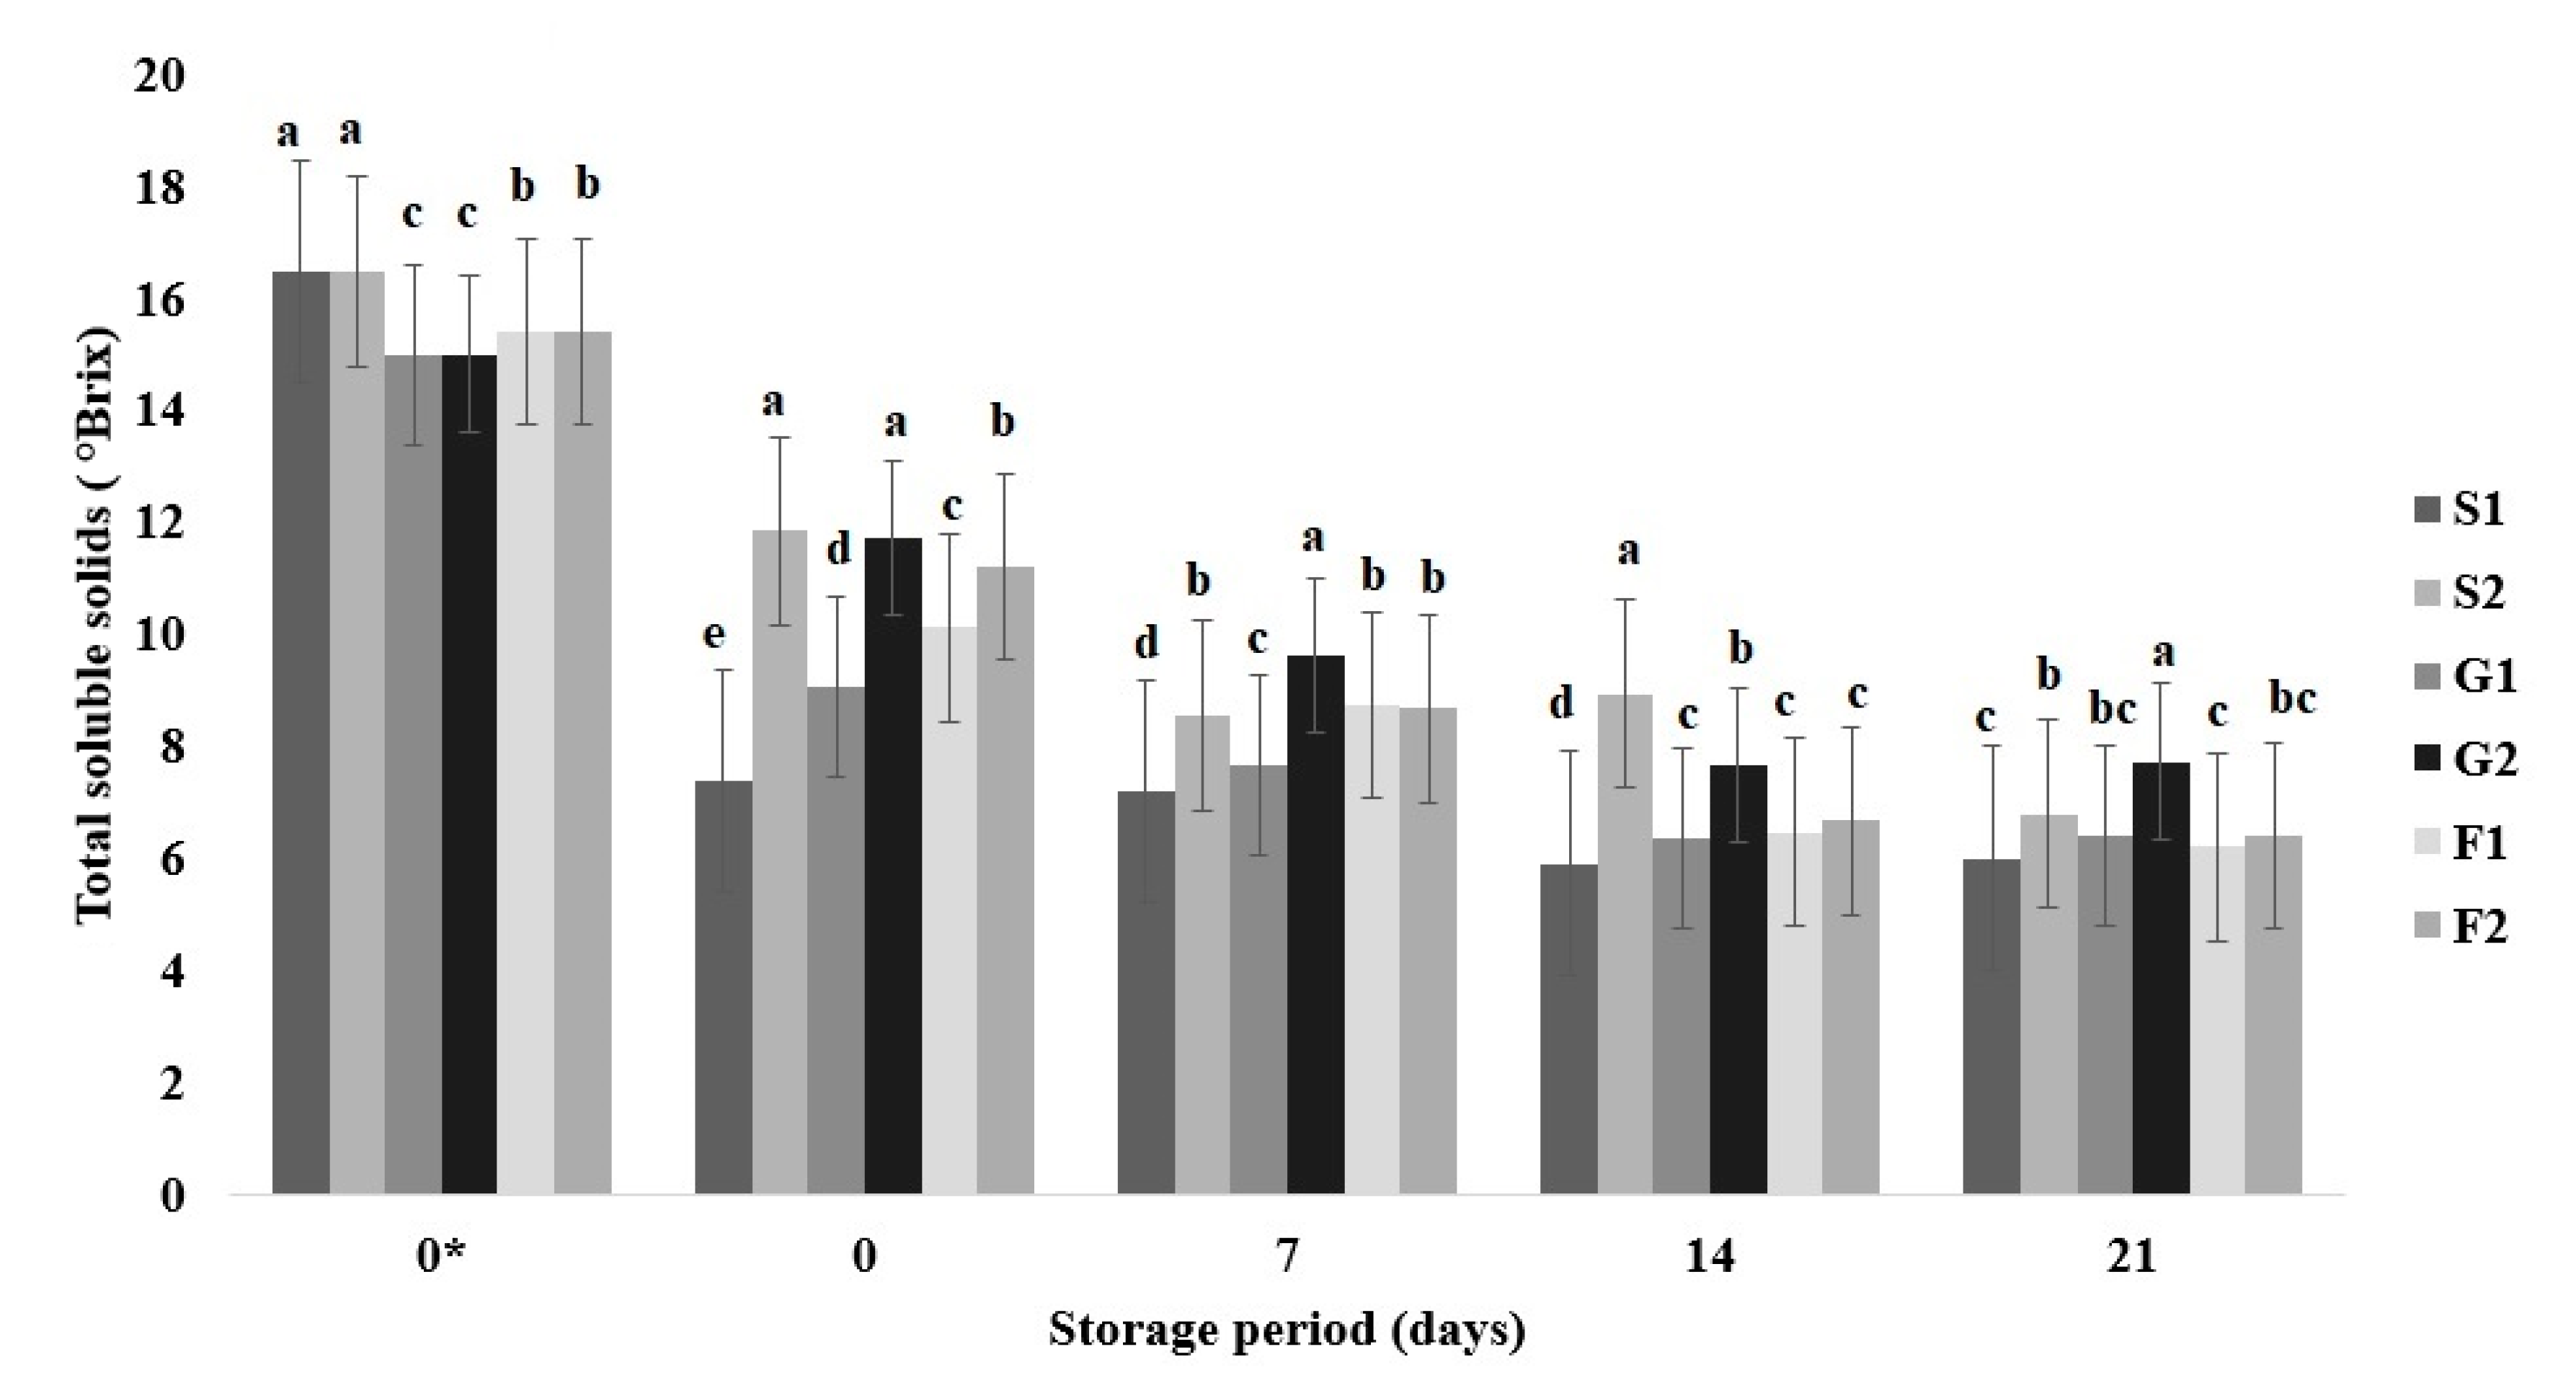
3.2. pH, Titratable Acidity and Total Solids Content

In Figure 3, the pH values obtained for the samples of fresh and dried apples are illustrated. It can be seen that the samples of fresh apple slices have average values between 4.02 and 4.19, while the pH values of dried apple chips decreased compared to the fresh samples and ranged from 3.85 to 4.02. Patras [57] obtained, for the same apple cultivars, pH values between 3.68 and 4.20, while Iordănescu et al. [53] reported pH values between 5.34 and 5.60 for fresh samples. According to Kahraman et al. [17] and Owusu et al. [58], decreases in pH values of dried apple samples may be associated with the dissociation of organic acids with temperature. The pH of dried apple chip samples during storage varies very little compared to the pH obtained for the freshly dried samples, and on the 21st day of storage, the mean pH values were between 3.61 (S2) and 3.80 (F2).
Perception of fruit taste is given by the apples’ acidity. Moreover, it is considered that sour taste depends on organic acid contents such as malic or citric acids, while soluble solids content is responsible for the sweet taste [59]. According to Sadler and Murphy [35], the typical malic acid content in apple fruit is between 0.27 and 1.02%. In this study, the values obtained for the TA of fresh apple samples from ‘Golden Delicious’ and ‘Florina’ cultivars fall between these values. The higher content of malic acid was registered in apple samples from the ‘Golden Delicious’ cultivar (0.33 a ± 0.03% acid malic) followed by apple samples from the ‘Florina’ cultivar (0.29 b ± 0.01% malic acid) and ‘Starkrimson’ cultivar (0.17 c ± 0.03% acid malic). TA values are close to those obtained by Nour et al. [59]: 0.30% for ‘Golden Delicious’, 0.20% for ‘Florina’ and 0.10% for ‘Starkrimson’. Butkeviciute et al. [6] reported a titratable acidity for other apple cultivars that varied between 0.24 and 0.61%. Titratable acidity values of dried apple chip samples are presented in Table 1. It can be observed that all dried apple chip samples have higher values of TA than fresh samples, regardless of cultivar or type of drying. The TA values of dried apple chips increased compared to the TA of fresh apple samples due to the organic acids in apples that become more concentrated as the temperature increases [58]. During storage, TA values increase for all samples.
The total solids content of fresh apple slices varies from 15.00 °Brix (‘Golden Delicious’ cultivar samples) to 16.46 °Brix (‘Starkrimson’ cultivar samples). These values are close to those obtained by Patras [57]: 15.01 and 15.3 °Brix for ‘Golden Delicious’ and ‘Starkrimson’ cultivars available on the market in 2018. In the case of ‘Florina’ cultivar fresh samples, a mean value of 15.40 °Brix for TSS (Figure 4) was obtained, a value close to that obtained by Nour et al. [59] (15.00 °Brix) for apples of the same cultivar.
Iordănescu et al. [53] reported TSS values ranging between 13.0 and 15.3 °Brix for ‘Starkrimson’ apples, between 10.6 and 14.2 °Brix for apples from the ‘Florina’ cultivar and 12.2–15.8 °Brix for ‘Golden Delicious’ apples. The total solids content for three apple cultivars determined by Egea et al. [60] varied from 13.78 to 17.61%, while Butkeviciute et al. [6] reported that the soluble solids content of ten different apple cultivars ranged between 12.40 and 14.00%.
After the drying of apple samples, the TSS values decreased for all types of apple cultivars (Figure 4). TSS values of dried apple samples decrease compared to values of fresh apple samples due to reactions that occur when the temperature rises [58]. It was observed that the TSS value decreased a lot (55%) for ‘Starkrimson’ cultivar samples dried in the oven, while the smallest decrease (22%) was recorded for ‘Golden Delicious’ cultivar samples dried with a dehydrator. According to Figure 4, it can be seen that the TSS values vary during the storage process, and all decreased on the 21st day compared to the TSS values obtained from the dried apple chip samples immediately after drying.
The flavor and quality of fruit products are given by acid and sugar content, and the sugar/acid ratio can better predict the flavor impact [35]. Apple fruits with sugar/acid ratios below 20 are characterized by a strong sour taste and are only suitable for processing; if the ratios are higher than this value, the fruits are perceived as sweet and suitable for consumption [61]. In the case of fresh samples investigated in this study, sugar/acid ratios were: 55.88 for the ‘Starkrimson’ cultivar, 46.06 for the ‘Golden Delicious’ cultivar and 39.31 for the ‘Florina’ cultivar. The values obtained are close to the values obtained in other papers. For example, Li et al. [61] obtained for the ‘Starkrimson’ cultivar sugar/acid ratios of between 28.07 and 59.73, while for the ‘Golden Delicious’ cultivar, the sugar/acid ratios were between 22.39 and 44.32 depending on the growth sites. Patras [57] reported a sugar/acid ratio of 41.36 for the ‘Florina’ cultivar. In this study, the sugar/acid ratio decreased in dried apple chip samples as follows: G1 (36.19) > S1 (33.33) > G2 (29.57) > F2 (26.90) > F1 (24.94) > S2 (24.31).

3.3. Electrical Conductivity

Electrical conductivity is a function of food components and a complex function of temperature and other physical properties; thus the components of salt, acids and moisture are very effective in increasing the conductivity of electricity, while total solids content, sugar, fats, lipids and alcohols decrease it [62,63]. It was demonstrated that with the increase of temperature, the electrical conductivity increases due to an increase in mobility of the tissue constituents as a result of higher temperature [63]. In addition, the nature of the product itself influences the conductivity of the food materials. According to [63], the interest in the EC of food is increasing greatly as advances in food processing technology, food quality assessment and food preservation increase. The mean values obtained for the electrical conductivity of apple samples (fresh and dried) are presented in Figure 5. Results show that fresh apple samples have EC values between 626 (‘Golden Delicious’ cultivar) and 727 (‘Florina’ cultivar) µS/cm, while apple samples dried in the oven have EC values ranging from 548 (‘Florina’ cultivar) to 1854 (‘Starkrimson’ cultivar) µS/cm. From Figure 5, it is possible to observe the increase of the EC values for all the samples of apple chips dried in the dehydrator; thus values between 1880 (‘Florina’ cultivar) and 2020 (‘Golden Delicious’ cultivar) µS/cm were obtained. Over time, a decrease in almost all the values recorded for the electrical conductivity of the dried apple samples can be observed (Figure 5). The EC values of dried ‘Starkrimson’ cultivar apple samples decrease with time with 42% in the case of samples dried in the oven and 45% for the samples dried in the dehydrator. In the case of the other apple cultivars, it was observed that the EC values increased with time for apple chip samples dried in the oven and decreased for the samples obtained by drying in the dehydrator.

3.4. Color Parameters, Browning and Whitening Index

Color is one of the principal quality factors that highly influence food acceptance [64]. It was observed that processed fruits are more acceptable by consumers if their colors are close to unprocessed fruits [65]. Results of color parameters measured for fresh and dried apple chips are presented in Table 2. The degree of freshness of the fruit is described by the lightness index (L*) [6]. The L* values of dried samples are higher than the L* values of fresh samples, which means that the dried fruits are lighter in color than the fresh ones, possibly due to the lemon salt solution used in the preparation of the samples [66]. According to Butkeviciute et al. [6], the yellow color of the apple fruit is given by the carotenoids, while the presence of anthocyanins leads to the red color of the fruit. All fresh apple samples had a* values situated in the negative region more toward green, while a* values measured for dried apple samples were situated in the positive region which means more toward red, in accord with [23]. The yellowness (b*) of fresh apple samples was between 18.36 ± 0.45 and 27.30 ± 1.64. The b* values increased for S1, S2 and F2 and decreased for G1 and F2 dried apple samples compared with the b* values of fresh apple samples.
The color difference between fresh and dry samples is greater when the browning index values are higher [17]. Temperature and the duration of exposure influence the evolution of color parameters [67]. Cruz et al. [23] stated that the change in color during drying is associated with the development of browning reactions, attributed to the activity of the enzyme polyphenol oxidase. Generally, the browning increases with temperature [58] (observed for S1, S2, F1 and F2 samples); thus the decrease in the browning index was unexpected for samples G1 and G2. The browning index (BI) at 0 days of storage was between 44.05 ± 0.84 (F1) and 58.42 ± 1.54 (F2), while the whitening index (WI) varied between 51.76 ± 2.28 and 63.44 ± 0.36. WI values of S1 and S2 and F1 and F2 are statistically significantly different. WI values differ depending on the drying method for S and F cultivars, while for cultivar G, WI values are not so influenced by the drying method. During storage, BI values for S1 increased and then decreased and for S2 decreased and then increased, while for WI values, the reverse was observed. In the case of G1 and G2 samples, BI values fluctuated and finally increased on the 21st day; for F1 and F2 samples, the BI values also increased on the last day of the observations compared to the values on the first day. The differences between the color parameter values are statistically significantly different. It was observed that p-values are less than 0.05, the null hypothesis is rejected, and not all group means are equal [52]. In addition, according to results obtained by applying Tukey’s method, the means that do not share a letter are significantly different (Table 2). The model fits our data, since R-sq explains 90.74% of the variation in the response in the case of the BI values of dried samples on the first day of drying, 89.48% on the 7th day of storage, 99.52% on the 14th day of storage and 96.75% on the 21st day of storage. R-sq explains 96.84% of the variation in the response in the case of WI values of dried samples on the first day of drying, 97.25% on the 7th day of storage, 98.83% on the 14th day of storage and 99.03% on the 21st day of storage.

3.5. Sensory Evaluation

For the statistical evaluation of the results, α = 0.05 was set. Results show that p-value = 0.000 < α, and it can be considered that the mean of the results is statistically significant. By applying Tukey’s pairwise comparisons, considering the scores obtained for the appearance, color, aroma, taste and overall acceptability of the dried apple samples, it was determined that the highest mean was obtained by sample F2 (8.63 a ± 0.18), followed by S2 (8.52 ab ± 0.11) that shares a letter with F2 but also with G1 (8.29 b ± 0.22), which means that they are not significantly different. In addition, the statistical evaluation of the scoring obtained for sensory assessment showed that sample S1 with a mean of 7.89 c ± 0.22 is not statistically different from the mean obtained for G2 (7.89 c ± 0.04). It can be observed that all panelists highly appreciated (‘like very much’ to ‘like extremely’) apple chips ‘Florina’ dried in a dehydrator (sample F2), while the last sample F1 (7.38 d ± 0.11) was liked moderately. It seems that the apple chips from ‘Florina’ and ‘Starkrimson’ cultivars are more liked if they are obtained with a dehydrator, while apple chips obtained from the ‘Golden Delicious’ cultivar are more appreciated if they are obtained by dehydration in an oven (Figure 6).

3.6. Correlations of Measured Data

Positive and negative correlations between physico-chemical parameters measured or calculated for apple chips dried in the oven (Table 3) and apple chips dried in the dehydrator (Table 4) were determined.
Strongly positive correlations were observed between M and aw (0.997) or BI (0.997), and strongly negative correlations were noticed between M and TSS (−0.959) or WI (−0.941) in the case of apple samples dried in the oven (Table 3). From Table 4, it can be observed that there are strongly positive correlations between M and L* (0.988) or WI (0.941) and strongly negative correlations between M and a* (−0.964) or ΔE (−0.930) when apples are dried in the dehydrator. In the case of apple chip samples dried in the oven, strongly positive relationships were found between aw and EC or BI (0.999), between pH and TSS (0.888) or TA (0.849), between TA and a* (0.870), between TSS and WI (0.806) and between EC and BI (0.999) (Table 3). In addition, strongly negative relationships were observed between aw and WI, pH and BI, TA and b*, TSS and BI and EC and WI. Strongly positive correlations between parameters, when apples were dried in the dehydrator, were registered between aw and b*, pH and BI, TSS and EC and EC and WI, while strongly negative relationships were observed between aw and TA, pH and TSS, TA and b*, TSS and BI and EC and BI (Table 4). Many negative or positive significant correlations were observed between color parameters [42].

4. Conclusions

Apple quality is influenced by color, sugar content and acid composition. A ready-to-eat product, apple chips were produced from three different apple cultivars by drying. Apple chips preserved the good color, and it can be concluded, after analyzing the color parameters, that samples F1, G1 and S1 are closer to the color of fresh apple samples, followed by samples S2, G2 and F2. The drying of the apple chip samples in the dehydrator leads to a decrease in the values of water activity, which varied between 50 and 60% compared to the aw of the fresh samples, while for the samples obtained in the oven, the aw values decreased and varied between 28 and 30%. During storage, samples of apple chips dried in the oven are less influenced in terms of water activity, and the increase in aw values is smaller compared to the values obtained for samples from the dehydrator, except for the samples of the ‘Golden Delicious’ cultivar. Instead, it was observed that during apple chips storage, aw does not exceed the value 0.6, except for a single sample S1. During storage, TA values increased more for apple samples obtained in the oven (10.00–16.35%) than for those obtained in the dehydrator (5.33–12.35%), while TSS values decreased and varied from 34.11 (G2) to 42.87% (F2) (apple chips obtained in the dehydrator) and from 18.79 (S1) to 38.72% (F1) for apple chips obtained in the oven. After analyzing all the results obtained regarding the physico-chemical parameters and the sensory analysis, it can be concluded that the apple chips obtained by drying in a dehydrator on the first day are the most appreciated in the following order: S2, F2 and G2, followed by F1, G1 and S1; after twenty-one days, the order changes in the following way: F2 > G2 > G1 > S2 > F1 > S1. Overall, this study concludes that the apple cultivar must also be considered in order to obtain apple chips, not just the dehydration method.

Author Contributions

Conceptualization, C.G. and A.E.P.; methodology, C.G. and A.E.P.; software, C.G.; validation, C.G., A.E.P. and A.L.; formal analysis, C.G. and A.E.P.; investigation, C.G. and A.E.P.; resources, C.G. and A.E.P.; writing—original draft preparation, C.G.; writing—review and editing, C.G., A.E.P. and A.L.; supervision, A.L.; funding acquisition, C.G. All authors have read and agreed to the published version of the manuscript.

Funding

This research was funded by ‘Stefan cel Mare’ University of Suceava and by Ministry of Research, Innovation and Digitalization within Program 1—Development of national research and development system, Subprogram 1.2—Institutional Performance—RDI excellence funding projects, under contract no. 10PFE/2021.

Institutional Review Board Statement

Not applicable.

Informed Consent Statement

Not applicable.

Data Availability Statement

Not applicable.

Acknowledgments

This research was supported by ‘Stefan cel Mare’ University of Suceava. This work was funded by Ministry of Research, Innovation and Digitalization within Program 1—Development of national research and development system, Subprogram 1.2—Institutional Performance—RDI excellence funding projects, under contract no. 10PFE/2021.

Conflicts of Interest

The authors declare no conflict of interest.

References

  1. FAO. World Food and Agriculture—Statistical Yearbook 2021; FAO: Rome, Italy, 2021; p. 12. [Google Scholar]
  2. FruitLogistica. European Statistics Handbook; Messe Berlin GmbH: Berlin, Germany, 2021. [Google Scholar]
  3. EC. EU Agricultural Outlook for Markets, Income and Environment, 2020–2030; European Commission, DG Agriculture and Rural Development: Brussels, Belgium, 2020. [Google Scholar]
  4. Leahu, A.; Ghinea, C.; Oroian, M.A. Osmotic dehydration of apple and pear slices: Color and chemical characteristics. Ovidius Univ. Ann. Chem. 2020, 31, 73–79. [Google Scholar] [CrossRef]
  5. Średnicka-Tober, D.; Barański, M.; Kazimierczak, R.; Ponder, A.; Kopczyńska, K.; Hallmann, E. Selected Antioxidants in Organic vs. Conventionally Grown Apple Fruits. Appl. Sci. 2020, 10, 2997. [Google Scholar]
  6. Butkeviciute, A.; Viskelis, J.; Viskelis, P.; Liaudanskas, M.; Janulis, V. Changes in the Biochemical Composition and Physicochemical Properties of Apples Stored in Controlled Atmosphere Conditions. Appl. Sci. 2021, 11, 6215. [Google Scholar] [CrossRef]
  7. Koutsos, A.; Tuohy, K.M.; Lovegrove, J.A. Apples and cardiovascular health—Is the gut microbiota a core consideration? Nutrients 2015, 7, 3959–3998. [Google Scholar] [CrossRef]
  8. Jakubczyk, E.; Kamińska-Dwórznicka, A.; Ostrowska-Ligęza, E.; Górska, A.; Wirkowska-Wojdyła, M.; Mańko-Jurkowska, D.; Górska, A.; Bryś, J. Application of Different Compositions of Apple Puree Gels and Drying Methods to Fabricate Snacks of Modified Structure, Storage Stability and Hygroscopicity. Appl. Sci. 2021, 11, 10286. [Google Scholar] [CrossRef]
  9. Zhu, J.; Liu, Y.; Zhu, C.; Wei, M. Effects of different drying methods on the physical properties and sensory characteristics of apple chip snacks. LWT-Food Sci. Technol. 2022, 154, 112829. [Google Scholar] [CrossRef]
  10. Chauhan, O.P.; Singh, A.; Singh, A.; Raju, P.S.; Bawa, A.S. Effects of Osmotic Agents on Colour, Textural, Structural, Thermal, and Sensory Properties of Apple Slices. Int. J. Food Prop. 2011, 14, 1037–1048. [Google Scholar] [CrossRef]
  11. Kowalska, H.; Marzec, A.; Kowalska, J.; Samborska, K.; Tywonek, M.; Lenart, A. Development of apple chips technology. Heat Mass Transf. 2018, 54, 3573–3586. [Google Scholar] [CrossRef] [Green Version]
  12. Figiel, A. Dehydration of apples by a combination of convective and vacuum-microwave drying. Pol. J. Food Nutr. Sci. 2007, 57, 131–135. [Google Scholar]
  13. Royen, M.J.; Noori, A.W.; Haydary, J. Experimental Study and Mathematical Modeling of Convective Thin-Layer Drying of Apple Slices. Processes 2020, 8, 1562. [Google Scholar] [CrossRef]
  14. Sullivan, V.K.; Na, M.; Proctor, D.N.; Kris-Etherton, P.M.; Petersen, K.S. Consumption of Dried Fruits Is Associated with Greater Intakes of Underconsumed Nutrients, Higher Total Energy Intakes, and Better Diet Quality in US Adults: A Cross-Sectional Analysis of the National Health and Nutrition Examination Survey, 2007–2016. J. Acad. Nutr. Diet. 2021, 121, 1258–1272. [Google Scholar] [CrossRef] [PubMed]
  15. Carughi, A.; Feeney, M.J.; Kris-Etherton, P.; Fulgoni, V., 3rd; Kendall, C.W.; Bulló, M.; Webb, D. Pairing nuts and dried fruit for cardiometabolic health. Nutr. J. 2016, 15, 23. [Google Scholar] [CrossRef] [PubMed] [Green Version]
  16. Sadler, M.J.; Gibson, S.; Whelan, K.; Ha, M.A.; Lovegrove, J.; Higgs, J. Dried fruit and public health—What does the evidence tell us? Int. J. Food Sci. Nutr. 2019, 70, 675–687. [Google Scholar] [CrossRef] [PubMed]
  17. Kahraman, O.; Malvandi, A.; Vargas, L.; Feng, H. Drying characteristics and quality attributes of apple slices dried by a non-thermal ultrasonic contact drying method. Ultrason. Sonochem. 2021, 73, 105510. [Google Scholar] [CrossRef] [PubMed]
  18. Nirmaan, A.M.C.; Rohitha Prasantha, B.D.; Peiris, B.L. Comparison of microwave drying and oven-drying techniques for moisture determination of three paddy (Oryza sativa L.) varieties. Chem. Biol. Technol. Agric. 2020, 7, 1. [Google Scholar] [CrossRef]
  19. Zhu, R.; Jiang, S.; Li, D.; Law, C.L.; Han, Y.; Tao, Y.; Kiani, H.; Liu, D. Dehydration of apple slices by sequential drying pretreatments and airborne ultrasound-assisted air drying: Study on mass transfer, profiles of phenolics and organic acids and PPO activity. Innov. Food Sci. Emerg. Technol. 2022, 75, 102871. [Google Scholar] [CrossRef]
  20. Wang, Y.; Zhao, H.; Deng, H.; Song, X.; Zhang, W.; Wu, S.; Wang, J. Influence of Pretreatments on Microwave Vacuum Drying Kinetics, Physicochemical Properties and Sensory Quality of Apple Slices. Pol. J. Food Nutr. Sci. 2019, 69, 297–306. [Google Scholar] [CrossRef]
  21. Barrett, D.M.; Beaulieu, J.C.; Shewfelt, R. Color, flavor, texture, and nutritional quality of fresh-cut fruits and vegetables: Desirable levels, instrumental and sensory measurement, and the effects of processing. Crit. Rev. Food Sci. Nutr. 2010, 50, 369–389. [Google Scholar] [CrossRef]
  22. Ayustaningwarno, F.; Dekker, M.; Fogliano, V.; Verkerk, R. Effect of Vacuum Frying on Quality Attributes of Fruits. Food Eng. Rev. 2018, 10, 154–164. [Google Scholar] [CrossRef] [Green Version]
  23. Cruz, A.C.; Guiné, R.P.F.; Gonçalves, J.C. Drying Kinetics and Product Quality for Convective Drying of Apples (cvs. Golden Delicious and Granny Smith). Int. J. Fruit Sci. 2015, 15, 54–78. [Google Scholar] [CrossRef]
  24. Marzec, A.; Kowalska, H.; Kowalska, J.; Domian, E.; Lenart, A. Influence of Pear Variety and Drying Methods on the Quality of Dried Fruit. Molecules 2020, 25, 5146. [Google Scholar] [CrossRef] [PubMed]
  25. Prawiranto, K.; Defraeye, T.; Derome, D.; Verboven, P.; Nicolai, B.; Carmeliet, J. New insights into the apple fruit dehydration process at the cellular scale by 3D continuum modelling. J. Food Eng. 2018, 239, 52–63. [Google Scholar] [CrossRef] [Green Version]
  26. Kidoń, M.; Grabowska, J. Bioactive compounds, antioxidant activity, and sensory qualities of red-fleshed apples dried by different methods. LWT 2021, 136, 110302. [Google Scholar] [CrossRef]
  27. Singh, A.P.; Sahni, D.D.; Dubey, A. Experimental study of thermal effect of drying, heating, blowing machine with different stage. Int. J. Res.-Granthaalayah 2016, 4, 104–109. [Google Scholar] [CrossRef]
  28. Nyangena, I.; Owino, W.; Ambuko, J.; Imathiu, S. Effect of selected pretreatments prior to drying on physical quality attributes of dried mango chips. J. Food. Sci. Technol. 2019, 56, 3854–3863. [Google Scholar] [CrossRef]
  29. ElHana, A.N.H. Microwave drying of apple. Misr J. Agric. Eng. 2008, 25, 980–1003. [Google Scholar]
  30. Fahim, U.; Kang, M. Impact of air flow rate on drying of apples and performance assessment of parabolic trough solar collector. Appl. Therm. Eng. 2017, 127, 275–280. [Google Scholar]
  31. Seiiedlou, S.; Ghasemzadeh, H.R.; Hamdami, N.; Talati, F.; Moghaddam, M. Convective drying of apple: Mathematical modeling and determination of some quality parameters. Int. J. Agric. Biol. 2010, 12, 171–178. [Google Scholar]
  32. Önal, B.; Adiletta, G.; Crescitelli, A.; Di Matteo, M.; Russo, P. Optimization of hot air drying temperature combined with pre-treatment to improve physico-chemical and nutritional quality of ‘Annurca’ apple. Food Bioprod. Process. 2019, 115, 87–99. [Google Scholar] [CrossRef]
  33. Velickova, E.; Winkelhausen, E.; Kuzmanova, S. Physical and sensory properties of ready to eat apple chips produced by osmo-convective drying. J. Food Sci. Technol. 2014, 51, 3691–3701. [Google Scholar] [CrossRef] [Green Version]
  34. Rydzak, L.; Kobus, Z.; Nadulski, R.; Wilczyński, K.; Pecyna, A.; Santoro, F.; Sagan, A.; Starek-Wójcicka, A.; Krzywicka, M. Analysis of Selected Physicochemical Properties of Commercial Apple Juices. Processes 2020, 8, 1457. [Google Scholar] [CrossRef]
  35. Sadler, G.D.; Murphy, P. pH and Titratable Acidity. In Food Anal., 4th ed.; Nielsen, S.S., Ed.; Springer: New York, NY, USA, 2010; pp. 219–238. [Google Scholar]
  36. Karakasova, L.; Stefanovska, E.; Babanovska-Milenkovska, F.; Stamatovska, V.; Durmishi, N.; Culeva, B. Comparing the quality properties of fresh and dried apple fruit—Varieties Pinova and Red Delicious. J. Food Agric. Environ. 2019, 73, 36–45. [Google Scholar]
  37. Khan, S.A.; Beekwilder, J.; Schaart, J.G.; Mumm, R.; Soriano, J.M.; Jacobsen, E.; Schouten, H.J. Differences in acidity of apples are probably mainly caused by a malic acid transporter gene on LG16. Tree Genet. Genomes 2013, 9, 475–487. [Google Scholar] [CrossRef]
  38. Leahu, A.; Oroian, M.; Ropciuc, S. Total phenolics of fresh and frozen minor berries and their antioxidant properties. Food Environ. Saf. 2014, 13, 87–93. [Google Scholar]
  39. Prisacaru, A.E.; Ghinea, C.; Apostol, L.C.; Ropciuc, S.; Ursachi, F. Physicochemical Characteristics of Vinegar from Banana Peels and Commercial Vinegars before and after in Vitro Digestion. Processes 2021, 9, 1193. [Google Scholar] [CrossRef]
  40. Magwaza, L.S.; Opara, U.L. Analytical methods for determination of sugars and sweetness of horticultural products—A review. Sci. Hortic. 2015, 184, 179–192. [Google Scholar] [CrossRef]
  41. Ghinea, C.; Leahu, A.; Priscarau, A.E.; Cojocaru, M.; Ladariu, V. Physico-chemical and sensory analyzes of muffins obtained with almond flour and coconut oil. In Proceedings of the 19th International Multidisciplinary Scientific GeoConference SGEM 2019, Vienna, Austria, 9–11 December 2019; Volume 19, pp. 165–172. [Google Scholar]
  42. Alibas, I.; Yilmaz, A. Microwave and convective drying kinetics and thermal properties of orange slices and effect of drying on some phytochemical parameters. J. Therm. Anal. Calorim. 2021. [Google Scholar] [CrossRef]
  43. Cuccurullo, G.; Giordano, L.; Metallo, A.; Cinquanta, L. Drying rate control in microwave assisted processing of sliced apples. Biosyst. Eng. 2018, 170, 24–30. [Google Scholar] [CrossRef]
  44. Ackbarali, D.; Mahara, R. Sensory Evaluation as a Tool in Determining Acceptability of Innovative Products Developed by Undergraduate Students in Food Science and Technology at The University of Trinidad and Tobago. J. Curric. Teach. 2014, 3, 10–27. [Google Scholar]
  45. Cliff, M.A.; Toivonen, P.M.; Forney, C.F.; Lu, C. Quality of fresh-cut apple slices stored in solid and micro-perforated film packages having contrasting O2 headspace atmospheres. Postharvest Biol. Technol. 2010, 58, 254–261. [Google Scholar] [CrossRef]
  46. Hussain, P.R.; Wani, I.A.; Rather, S.A.; Suradkar, P.; Ayob, O. Effect of post-processing radiation treatment on physico-chemical, microbiological and sensory quality of dried apple chips during storage. Radiat. Phys. Chem. 2021, 182, 109367. [Google Scholar] [CrossRef]
  47. Mohammed, S.; Edna, M.; Siraj, K. The effect of traditional and improved solar drying methods on the sensory quality and nutritional composition of fruits: A case of mangoes and pineapples. Heliyon 2020, 6, e04163. [Google Scholar] [CrossRef]
  48. Singer, J.M.; Pedroso-de-Lima, A.C.; Tanaka, N.I.; González-López, V.A. To triplicate or not to triplicate? Chemom. Intell. Lab. Syst. 2007, 86, 82–85. [Google Scholar] [CrossRef]
  49. Wu, J.; Gao, H.; Zhao, L.; Liao, X.; Chen, F.; Wang, Z.; Hu, X. Chemical compositional characterization of some apple cultivars. Food Chem. 2007, 103, 88–93. [Google Scholar] [CrossRef]
  50. Preti, R.; Tarola, A.M. Study of polyphenols, antioxidant capacity and minerals for the valorisation of ancient apple cultivars from Northeast Italy. Eur. Food Res. Technol. 2021, 247, 273–283. [Google Scholar] [CrossRef]
  51. Ergün, Z. Determination of Biochemical Contents of Fresh, Oven-Dried, and Sun-Dried Peels and Pulps of Five Apple Cultivars (Amasya, Braeburn, Golden Delicious, Granny Smith, and Starking). J. Food Qual. 2021, 2021, 9916694. [Google Scholar] [CrossRef]
  52. Minitab. Interpret the Key Results for One-Way ANOVA. 2022. Available online: https://support.minitab.com/en-us/minitab-express/1/help-and-how-to/modeling-statistics/anova/how-to/one-way-anova/interpret-the-results/key-results/ (accessed on 1 February 2022).
  53. Iordănescu, O.A.; Iuga, C.; Hădărugă, N.; Becherescu, A.; Drăgunescu, A.; Băla, M.; Scedei, D. Research on fruit quality of several apple cultivars from different locations in the area of Western Romania. Sci. Pap. Ser. B Hortic. 2021, LXV, 1129–1138. [Google Scholar]
  54. Shi, J.; Pan, Z.; McHugh, T.H.; Wood, D.; Hirschberg, E.; Olson, D. Drying and quality characteristics of fresh and sugar-infused blueberries dried with infrared radiation heating. LWT-Food Sci. Technol. 2008, 41, 1962–1972. [Google Scholar] [CrossRef]
  55. Klewicki, R.; Konopacka, D.; Uczciwek, M.; Irzyniec, Z.; Piasecka, E.; Bonazzi, C. Sorption isotherms for osmo-convectively-dried and osmo-freeze-dried apple, sour cherry, and blackcurrant (ISAFRUIT Special Issue). J. Hortic. Sci. Biotechnol. 2009, 84, 75–79. [Google Scholar] [CrossRef]
  56. Antal, T. Comparative study of three drying methods: Freeze, hot air assisted freeze and infrared-assisted freeze modes. Agron. Res. 2015, 13, 863–878. [Google Scholar]
  57. Patras, A. Quality parameters of apple fruits marketed in Iaşi. Sci. Pap. Ser. B Hortic. 2018, 61, 281–286. [Google Scholar]
  58. Owusu, J.; Ma, H.; Wang, Z.; Amissah, A. Effect of Drying Methods on Physicochemical Properties of Pretreated Tomato (lycopersicon esculentum mill.). Slices. Croat. J. Food Tehnol. Biotech. Nutr. 2012, 7, 106–111. [Google Scholar]
  59. Nour, V.; Trandafir, I.; Ionica, M.E. Compositional characteristics of fruits of several apple (Malus domestica Borkh.) cultivars. Not. Bot. Horti. Agrobot. 2010, 38, 228–233. [Google Scholar]
  60. Egea, M.B.; Ferreira da Silva, R.S.S.; Yamashita, F.; Borsato, D. Optimizing Dehydration of Apples Malus Domestica with Fructo-Oligosaccharide Incorporation. Braz. Arch. Biol. Technol. 2012, 55, 751–762. [Google Scholar] [CrossRef]
  61. Li, Y.; Sun, H.; Li, J.; Qin, S.; Yang, W.; Ma, X.; Qiao, X.; Yang, B. Effects of Genetic Background and Altitude on Sugars, Malic Acid and Ascorbic Acid in Fruits of Wild and Cultivated Apples (Malus sp.). Foods 2021, 10, 2950. [Google Scholar] [CrossRef]
  62. Varghese, K.S.; Pandey, M.C.; Radhakrishna, K.; Bawa, A.S. Technology, applications and modelling of ohmic heating: A review. J. Food Sci. Technol. 2014, 51, 2304–2317. [Google Scholar] [CrossRef] [Green Version]
  63. Banti, M. Review on Electrical Conductivity in Food, the Case in Fruits and Vegetables. World J. Food Sci. Technol. 2020, 4, 80–89. [Google Scholar] [CrossRef]
  64. Wrolstad, R.E.; Smith, D.E. Color Analysis. In Food Anal., 4th ed.; Nielsen, S.S., Ed.; Springer: New York, NY, USA, 2010; pp. 573–586. [Google Scholar]
  65. Coklar, H.; Akbulut, M.; Kilinc, S.; Yildirim, A.; Alhassan, I. Effect of Freeze, Oven and Microwave Pretreated Oven Drying on Color, Browning Index, Phenolic Compounds and Antioxidant Activity of Hawthorn (Crataegus orientalis) Fruit. Not. Bot. Horti. Agrobot. 2018, 46, 449–456. [Google Scholar] [CrossRef] [Green Version]
  66. Moon, K.M.; Kwon, E.-B.; Lee, B.; Kim, C.Y. Recent Trends in Controlling the Enzymatic Browning of Fruit and Vegetable Products. Molecules 2020, 25, 2754. [Google Scholar] [CrossRef]
  67. Li, L.; Li, X.; Wang, A.; Jiang, Y.; Ban, Z. Effect of heat treatment on physiochemical, colour, antioxidant and microstructural characteristics of apples during storage. Int. J. Food Sci. Technol. 2013, 48, 727–734. [Google Scholar] [CrossRef]
  68. Mukaka, M.M. Statistics corner: A guide to appropriate use of correlation coefficient in medical research. Malawi Med. J. 2012, 24, 69–71. [Google Scholar] [PubMed]
Figure 1. Steps included in sample preparation and drying.
Applsci 12 02350 g001
Figure 2. Water activity (aw) evaluation of fresh and dried apple chips during storage under ambient conditions (S1—apple chips ‘Starkrimson’, oven; S2—apple chips ‘Starkrimson’, dehydrator; G1—apple chips ‘Golden Delicious’, oven; G2—apple chips ‘Golden Delicious’, dehydrator; F1—apple chips ‘Florina’, oven; F2—apple chips ‘Florina’, dehydrator). Notes: 0*—fresh apple samples, 0—dried apple samples. Different lowercase letters (a–e) show significant differences between the groups (p < 0.05).
Applsci 12 02350 g002
Figure 3. pH evaluation of fresh and dried apple chips during storage under ambient conditions (S1—apple chips ‘Starkrimson’, oven; S2—apple chips ‘Starkrimson’, dehydrator; G1—apple chips ‘Golden Delicious’, oven; G2—apple chips ‘Golden Delicious’, dehydrator; F1—apple chips ‘Florina’, oven; F2—apple chips ‘Florina’, dehydrator). Notes: 0*—fresh apple samples, 0—dried apple samples. Different lowercase letters (a–d) show significant differences between the groups (p < 0.05).
Applsci 12 02350 g003
Figure 4. Total soluble solids (TSS) evaluation of fresh and dried apple chips during storage under ambient conditions. Notes: 0*—fresh apple samples, 0—dried apple samples. Different lowercase letters (a–e) show significant differences between the groups (p < 0.05).
Applsci 12 02350 g004
Figure 5. Electrical conductivity (EC) evaluation of fresh and dried apple chips during storage under ambient conditions (S1—apple chips ‘Starkrimson’, oven; S2—apple chips ‘Starkrimson’, dehydrator; G1—apple chips ‘Golden Delicious’, oven; G2—apple chips ‘Golden Delicious’, dehydrator; F1—apple chips ‘Florina’, oven; F2—apple chips ‘Florina’, dehydrator). Notes: 0*—fresh apple samples, 0—dried apple samples. Different lowercase letters (a–e) show significant differences between the groups (p < 0.05).
Applsci 12 02350 g005
Figure 6. Sensory evaluation of apple chip samples (S1—apple chips ‘Starkrimson’, oven; S2—apple chips ‘Starkrimson’, dehydrator; G1—apple chips ‘Golden Delicious’, oven; G2—apple chips ‘Golden Delicious’, dehydrator; F1—apple chips ‘Florina’, oven; F2—apple chips ‘Florina’, dehydrator), on the first day.
Applsci 12 02350 g006
Table 1. Titratable acidity of dried apple samples.
SampleTitratable Acidity (TA), % Malic AcidSampleTitratable Acidity (TA), % Malic AcidSampleTitratable Acidity (TA), % Malic AcidSampleTitratable Acidity (TA), % Malic Acid
Dried apple chip samplesS10.72 c ± 0.11Dried apple chip samples (7th day)S10.72 cd ± 0.02Dried apple chip samples (14th day)S10.73 c ± 0.05Dried apple chip samples (21st day)S10.80 b ± 0.05
S20.95 a ± 0.15S20.95 a ± 0.09S20.97 a ± 0.01S21.04 a ± 0.05
G10.63 d ± 0.01G10.65 e ± 0.05G10.67 d ± 0.01G10.75 b ± 0.05
G20.71 c ± 0.03G20.74 c ± 0.05G20.80 b ± 0.02G20.81 b ± 0.01
F10.87 b ± 0.05F10.91 b ± 0.01F10.95 a ± 0.00F11.04 a ± 0.06
F20.71 c ± 0.15F20.71 d ± 0.05F20.72 c ± 0.05F20.75 b ± 0.01
Means that do not share a letter are significantly different (p ≤ 0.05).
Table 2. Color parameters of fresh and dried apple chips during storage under ambient conditions.
SampleL*a*b*ΔEBIWI
Fresh apple samplesS051.93 a ± 1.13−1.42 a ± 0.1418.36 b ± 0.45-40.27 b ± 1.2348.52 a ± 1.14
G064.28 a ± 4.86−2.29 a ± 0.5527.30 a ± 1.64-50.63 a ± 0.9454.85 a ± 2.94
F057.7 a ± 7.03−3.47 b ± 0.3319.83 b ± 1.51-36.29 b ± 1.0953.02 a ± 5.73
Dried apple chip samplesS157.69 e ± 2.4210.62 a ± 0.9320.56 c ± 0.4040.17 a ± 2.3257.02 a ± 2.2851.76 d ± 2.28
S267.39 c ± 0.935.09 c ± 0.1924.41 b ± 0.6232.81 c ± 1.0849.63 b ± 1.2758.94 c ± 1.09
G171.83 b ± 0.433.02 d ± 0.3324.77 b ± 0.8129.47 de ± 0.4044.42 b ± 0.6762.36 ab ± 0.38
G276.10 a ± 1.052.09 d ± 0.3727.56 a ± 0.4728.76 e ± 0.2645.86 b ± 0.1363.44 a ± 0.36
F165.85 cd ± 0.9412.08 a ± 0.3217.59 d ± 0.2932.49 cd ± 0.9344.05 b ± 0.8459.73 bc ± 0.95
F263.65 d ± 1.017.10 b ± 0.8025.53 b ± 0.2936.78 b ± 1.0858.42 a ± 1.5455.01 d ± 1.06
Dried apple chip samples (7th day)S147.39 c ± 1.179.31 a ± 0.6518.39 d ± 0.7648.41 a ± 0.9562.73 ab ± 1.5143.48 c ± 0.97
S271.51 a ± 3.013.98 b ± 1.1225.44 ab ± 1.4230.32 c ± 3.2747.39 cd ± 3.9361.58 a ± 3.29
G161.63 b ± 1.019.14 a ± 0.9125.96 ab ± 0.3139.09 b ± 0.7864.44 a ± 0.9352.77 b ± 0.77
G270.31 a ± 0.403.73 b ± 0.2226.94 a ± 0.7332.22 c ± 0.6451.09 cd ± 1.1059.72 a ± 0.63
F158.09 b ± 1.268.21 a ± 0.0321.13 c ± 0.4839.43 b ± 0.9054.84 bc ± 0.2052.34 b ± 0.90
F273.57 a ± 2.864.05 b ± 0.7824.52 b ± 0.9928.33 c ± 1.3743.76 d ± 0.4263.65 a ± 1.53
Dried apple chip samples (14th day)S152.22 d ± 2.2011.16 a ± 0.5522.43 c ± 1.3445.87 a ± 1.5370.72 a ± 0.2846.01 d ± 1.49
S275.96 a ± 0.133.23 d ± 0.3027.11 a ± 0.1728.59 c ± 0.1946.24 c ± 0.3363.62 b ± 0.18
G169.91 b ± 0.274.47 c ± 0.4125.72 ab ± 0.4531.69 b ± 0.3749.58 b ± 0.8060.16 c ± 0.34
G277.17 a ± 0.800.64 e ± 0.1524.28 b ± 0.2925.37 d ± 0.6737.46 d ± 0.6066.66 a ± 0.71
F164.49 c ± 1.138.09 b ± 0.1720.52 d ± 0.3433.65 b ± 0.7546.93 c ± 0.1758.19 c ± 0.77
F263.78 c ± 0.872.77 d ± 0.2019.90 d ± 0.1132.98 b ± 0.8439.82 d ± 0.6658.57 c ± 0.83
Dried apple chip samples (21st day)S152.26 e ± 1.039.84 b ± 0.7520.02 e ± 0.4244.57 a ± 0.9861.34 a ± 1.4247.29 e ± 0.95
S269.63 b ± 1.095.97 c ± 0.1026.31 a ± 0.6032.58 d ± 0.5452.78 b ± 0.4859.36 b ± 0.59
G164.76 c ± 0.786.19 c ± 0.2423.70 bc ± 0.1934.67 c ± 0.5851.72 b ± 0.4057.07 c ± 0.58
G272.39 a ± 0.083.31 d ± 0.0324.75 b ± 0.0329.09 e ± 0.0744.27 c ± 0.0762.77 a ± 0.07
F158.65 d ± 0.5712.42 a ± 0.5321.44 d ± 0.2540.23 b ± 0.6960.30 a ± 0.9651.77 d ± 0.68
F268.56 b ± 1.033.75 d ± 0.5123.30 c ± 0.7231.03 d ± 0.6944.69 c ± 1.0660.67 b ± 0.70
Values are mean ± standard deviation (n = 3). Means that do not share a letter are significantly different (p ≤ 0.05).
Table 3. Correlations between physico-chemical parameters measured or calculated for apple chips dried in the oven (Pearson correlation).
MawpHTATSSECL*a*b*ΔEBI
aw0.997 *
pH−0.722−0.668
TA−0.246−0.1730.849
TSS−0.959−0.9350.8880.511
EC0.9950.999 *−0.646−0.144−0.924
L*−0.858−0.8940.263−0.2870.676−0.906
a*0.2640.3360.4770.8700.0200.363−0.723
b*0.007−0.068−0.697−0.971−0.290−0.0970.508−0.963
ΔE0.9270.953−0.4100.134−0.7830.961−0.9880.606−0.368
BI0.997 *0.999 *−0.664−0.168−0.9330.999 *−0.8960.341−0.0730.954
WI−0.941−0.9630.444−0.0970.806−0.9710.981−0.5760.333−0.999 *−0.965
* Statistically significant at p < 0.05. Values in bold show very high positive/negative correlation (according to Mukaka [68]).
Table 4. Correlations between physico-chemical parameters measured or calculated for apple chips dried in dehydrator (Pearson correlation).
MawpHTATSSECL*a*b*ΔEBI
aw0.473
pH−0.5710.453
TA−0.373−0.994−0.549
TSS0.485−0.541−0.9950.631
EC0.819−0.119−0.9390.2280.899
L*0.9880.331−0.692−0.2250.6150.898
a*−0.964−0.2220.7690.113−0.700−0.942−0.994
b*0.8790.836−0.110−0.7710.0080.4450.794−0.72
ΔE−0.930−0.1160.8330.006−0.772−0.972−0.9760.994−0.641
BI−0.8200.1160.938−0.225−0.898−0.999 *−0.8990.943−0.4470.973
WI0.9420.149−0.814−0.0390.7510.9640.982−0.997 *0.666−0.999 *−0.965
* Statistically significant at p < 0.05. Values in bold show very high positive/negative correlation (according to Mukaka [68]).
Publisher’s Note: MDPI stays neutral with regard to jurisdictional claims in published maps and institutional affiliations.

