Article

Untargeted 1H-NMR Urine Metabolomic Analysis of Preterm Infants with Neonatal Sepsis

by
Panagiota D. Georgiopoulou
1,
Styliani A. Chasapi
1,
Irene Christopoulou
2,
Anastasia Varvarigou
2,* and
Georgios A. Spyroulias
1,*
1
Department of Pharmacy, University of Patras, 26504 Patras, Greece
2
Department of Paediatrics, University of Patras Medical School, General University Hospital, 26500 Patras, Greece
*
Authors to whom correspondence should be addressed.
Appl. Sci. 2022, 12(4), 1932; https://doi.org/10.3390/app12041932
Submission received: 24 December 2021 / Revised: 26 January 2022 / Accepted: 8 February 2022 / Published: 12 February 2022

Abstract

:
One of the most critical medical conditions occurring after preterm birth is neonatal sepsis, a systemic infection with high rates of morbidity and mortality, chiefly amongst neonates hospitalized in Neonatal Intensive Care Units (NICU). Neonatal sepsis is categorized as early-onset sepsis (EOS) and late-onset sepsis (LOS) regarding the time of the disease onset. The accurate early diagnosis or prognosis have hurdles to overcome, since there are not specific clinical signs or laboratory tests. Herein, a need for biomarkers presents, with the goals of aiding accurate medical treatment, reducing the clinical severity of symptoms and the hospitalization time. Through nuclear magnetic resonance (NMR) based metabolomics, we aim to investigate the urine metabolomic profile of septic neonates and reveal those metabolites which could be indicative for an initial discrimination between the diseased and the healthy ones. Multivariate and univariate statistical analysis between NMR spectroscopic data of urine samples from neonates that developed EOS, LOS, and a healthy control group revealed a discriminate metabolic profile of septic newborns. Gluconate, myo-inositol, betaine, taurine, lactose, glucose, creatinine and hippurate were the metabolites highlighted as significant in most comparisons.

1. Introduction

Neonatal sepsis is a systemic inflammatory response to infection, with a wide range and severity of symptoms [1]. The incidence varies all over the world and is quite different among high-, low-, and middle-income countries [2]. According to World Health Organization (WHO), 1.3 to 3.9 million cases are reported annually and 400,000 to 700,000 deaths worldwide [3]. Despite the progress in medical knowledge, neonatal care and antibiotic treatment, sepsis is considered one of the main reasons of morbidity and mortality, especially in very low birth weight (VLBW, <1500 g birth weight) and preterm infants (born before 37 weeks of pregnancy) [4,5,6]. Extremely preterm infants, whose gestational age (GA) is less than 28 weeks, are at greater risk of sepsis diagnosis [7,8]. However, several studies suggest that also late preterms are highly susceptible to developing sepsis [9,10,11].
Neonatal sepsis is classified as early onset sepsis (EOS), occurring within 72 h after birth, and late onset sepsis (LOS), 72 h after birth according to the onset time of the findings [12]. The incidence of EOS is 1 to 5 per 1000 live births, decreasing with intrapartum antibiotic therapy [13,14]. Associated with the increasing survival rate of preterm and VLBW infants, LOS rate presents an increase, with neonates weighing less than 750 g having the highest rate of LOS diagnosis [15,16].
Prematurity and low birth weight are among the main risk factors causing sepsis, with premature neonates having three to ten times higher possibility of sepsis diagnosis than normal weight full-term ones [1]. Risk factors and mortality rates differ among early- and late-onset sepsis [17]. Among the EOS risk factors are fetal distress, low APGAR score, resuscitation of the neonate and multiple pregnancies. Additionally, for low-income countries, as EOS seems to be enhanced from factors such as inadequate antenatal care, unhealthy birth and late recognition of conditions that might induce infections to the mother or the neonate [18]. Factors that can increase risk of LOS are considered mainly invasive procedures, such as surgical interventions, intubation, mechanical ventilation, catheter/probe insertion, long-term parenteral nutrition, frequent blood sampling, low stomach acid and/or insufficient breastfeeding [1].
The pathogenesis of EOS is taking place during the intrapartum period, during which the responsible pathogens are transmitted from mother to neonate [19]. Pathogens causing EOS are usually colonized in maternal genitourinary tract and with the amniotic membrane rupture are transmitted to the fetus or during the labor to neonate [20]. Most frequent EOS’s pathogens are the Gram (+) group B Streptococcus (GBS) followed by the Gram (−) E. Coli bacteria [21]. Pathogens causing LOS can be transmitted during labor or from the environment. LOS is usually caused by nosocomial or environmental pathogens, specifically Coagulase-negative staphylococci (CONS), Gram (−) bacilli and Fungi, especially C. albicans. Apart from differences in the pathogenesis and the time of onset, EOS and LOS have different clinical manifestations [22].
A combination of clinical signs and laboratory findings constitute the diagnosis procedure, with blood culture considered as the “gold” standard [23]. For the physicians, the diagnosis of sepsis is a challenge. The limited diagnostic accuracy of common laboratory tests, such as white blood cell indices and acute phase reactants contribute poorly to the early diagnosis of neonatal sepsis. The diagnostics’ accuracy limitations, in combination with the neonate’s prematurity and survival status as well as the ambiguity of early clinical signs, urge neonatologists to shut out sepsis [24]. Hence, the discovery of new biomarkers, which can easily be detected at an early stage, has occupied the medical and scientific community, with many studies already having been carried out [25].
In this scope, metabolomic analysis could take upon a fundamental role. Detecting and quantifying a wide variety of small molecules, intermediate or final components of metabolic pathways, metabolomics aim to identify the alterations caused by the condition of biological and medical interest. As the outcome of biochemical procedures regulated by proteins derived from genes expression, metabolomics provides the closest relation with the phenotype of an organism, at a specified time frame in correlation with endogenous and exogenous influences. The utilization of metabolomics as a tool for the validation of new biomarkers for early diagnosis or prognosis of pathophysiological conditions is constantly growing.
Before any metabolomic analysis, based on the main question to be answered, the process of the analysis has to be determined. A targeted metabolomics approach is selected when the aim is to measure the levels of a particular set of metabolites which are suspected to have a relation with a condition. An untargeted approach aims to detect and assign as many peaks as possible related to metabolites biofluid, tissue or cell extract under study, identifying the metabolic “fingerprint” [26]. Nuclear magnetic resonance (NMR) spectroscopy and mass spectrometry (MS) are the two dominant analytical techniques for metabolomic analysis of biofluids. NMR-based analysis offers numerous advantages and could combine chemometrics and basic clinical research [27].
In the field of neonatology, the interest for a prognostic and diagnostic tool for neonatal sepsis is continuously growing. A urine sample, reflecting a holistic view of the metabolism, is considered as the most appropriate biological fluid for analysis of newborns’ metabolism via NMR spectroscopy. The impact of neonatal sepsis on newborn metabolism has been in the center of interest the last few years and application of metabolomic studies towards the investigation of a specific profile of septic newborns is on demand, but, to establish metabolites as biomarkers, further analysis must be conducted [28,29,30]. The aim of our study is to reveal those metabolites with differentiated levels among the septic neonates hospitalized in the Neonatal Intensive Care Unit (NICU) and control/healthy neonates. Such metabolic alterations could lead to early diagnosis of EOS and LOS. To our knowledge, both medical treatment and parenteral nutrition of NICU hospitalization may induce essential metabolic drifts. For this reason, we chose to investigate the comparison of the sepsis metabolic profile with the metabolic profile of NICU hospitalized neonates without severe comorbidities except prematurity, complementary to healthy neonates, whose care after birth was taken over by their mother.

2. Materials and Methods

2.1. Study Population

The current study was conducted in the Neonatal Ward and the NICU of the General University Hospital, and the Department of Pharmacy at the University of Patras. Seventy-one (n = 71) neonates were recruited in the study, only after informed consent and parental permission having been provided. The neonates were separated into the following four groups: Group A: Septic neonates diagnosed with EOS (n = 23); Group B: Septic neonates diagnosed with LOS (n = 11); Group C: Preterm neonates without any clinical sign or symptom of sepsis or other serious morbidity (n = 14) hospitalized in the NICU; Group D: Healthy preterm neonates (n = 23) not separated from their mother after birth. All NICU neonates were premature, with GA ranging from 25 to 36 GA weeks, while all healthy non NICU preterm neonates ranged from 35 to 36 GA weeks. For each neonate, the following were recorded: (a) perinatal data such as gestational age (GA), birth weight (BW), sex, delivery mode, premature rupture of membranes and Apgar score; (b) clinical data such as mechanical ventilation, treatment with antibiotics, positive blood cultures, C reactive protein (CRP), and breast feeding. All clinical characteristics and laboratory findings of the neonates participated in this study are listed in Table 1. The biological fluid under study was urine and the samples were collected in the first 24 h after birth for EOS neonates and in the third day of the extrauterine life for LOS neonates. The collection was carried out with the use of adhesive pediatric urine collection bags and 1.5 mL of each collected urine sample was transferred to sterile vials and remained at −80 °C until the analysis.

2.2. Ethical Statement

The study was approved by the General University Hospital of Patras Human Research Ethics Committee and all the procedures performed in this study involving human participants were in accordance with the ethical standards of the institutional and/or national research committee and with the 1964 Helsinki declaration and its later amendments or comparable ethical standards. A written informed consent was obtained from parents.

2.3. NMR Sample Preparation

The urine samples were stored at −80 °C until analysis. For NMR analysis, frozen urine samples were thawed at room temperature and centrifuged at 12,000 rpm for 10 min at 4 °C. For each sample, 540 μL of the supernatant was mixed with 60 μL potassium phosphate buffer (1.5 M KH2PO4 in H2O containing 4% 2 Mm NaN3 and 10 mM 4,4-dimethyl-4-silapentane-1-sulfonic acid (DSS), pH 4.2). The mixture was vortexed and 590 μL of it was transferred into a 5 mm NMR tube (Bruker BioSpin srl).

2.4. NMR Experiments

The 1H-NMR spectra were recorded at 298 K on a Bruker Avance III HD 700 MHz NMR spectrometer equipped with a cryogenically cooled 5.0 mm 1H/13C/15N/D Z-gradient probe. Two kinds of 1H-NMR spectra were recorded for each urine sample of the study’s participants. A mono-dimensional (1D) NMR spectrum was acquired using a standard NOESY (noesygppr1d.comp; Bruker BioSpin, Billerica, MA, USA) pulse sequence for water suppression, to reveal all the detectable 1H signals of metabolites. Due to the complexity of urine NMR spectra, as they consist of numerous peaks, presented in a non-distinctive manner, and sometimes overlapped, the identification and further quantification of metabolites using only 1D NMR spectra cannot be accomplished [31]. Hence, for each urine sample, a two-dimensional (2D) J-resolved (jresgpprqf.comp; Bruker BioSpin) spectrum acquired, separating the chemical shifts and J-couplings into two different dimensions, making it a very useful NMR experiment for metabolite assignment in metabolomics [32]. Accurately, the acquisition parameters for the 1H 1D NMR and 2D J-resolved spectra were 64 scans, 4 dummy scans, FID size 64.536, a spectral width of 10,504 Hz, 3.1 s acquisition time, 2 s a relaxation delay, and 100 ms mixing time [33].

2.5. Data Processing

After the NMR data acquisition, all spectra were manually processed for phase and baseline corrections and calibrated to the internal standard’s DSS peak at 0.00 ppm. The processing was performed using the TopSpin 4.1.1 (Bruker BioSpin srl). For further statistical analysis, all 1H 1D NOESY NMR spectra were transformed into binned numerical data. Each spectrum was fragmented into buckets of 0.02 ppm width for the spectral region 0.70–9.50 ppm, using the AMIX software (Bruker BioSpin). The spectral areas of 4.50–6.00 ppm, 2.70–2.80 ppm and 1.75–1.77 ppm where 1H signals of water, urea and internal standard DSS are observed, were excluded. Chenomx software (NMR Suite Version 9.0, Edmonton, AB, Canada), the online Human Metabolome Database (HMDB) and data from literature, were utilized for the assignment of important and discriminant proton NMR signals of urine samples.

2.6. Statistical Analysis of NMR Data

The statistical analysis of the spectral binning data was performed using the online tool MetaboAnalyst 5.0 [34]. Multivariate analysis (MVA), consisting of the unsupervised principal component analysis (PCA) and supervised partial least squares discriminant analysis (PLS-DA), was applied on the 1H NMR data after Pareto normalization. This normalization was selected, since NMR information does not deviate much from the original compared to autoscaling, and fewer errors related to noisy spectral regions without biological impact are conducted [35]. PCA and PLS-DA plots were examined to extract information about group clustering and potential outliers. Loadings values from PCA model and variable importance in projection (VIP) scores >1 from PLS-DA were the main evidence source about metabolites with differentiation between groups, responsible for the group clustering. The quality of PLS-DA was ensured using the parameters as follows: goodness of fit R2 and the goodness of predictability Q2, after 10-fold cross-validation test. For statistical correlation of NMR data, a mono-dimensional (1D) statistical total correlation spectroscopy analysis was performed using the muma R package [36], where pareto scaled data were analyzed and the represented pseudo-NMR spectrum displayed the covariance (height) and the Pearsons correlation coefficient (color) of all spectral variables (buckets) with the variable of interest being the ‘’driver peak’’ or ‘’driver signal’’. Additionally, univariate analysis was performed on the successfully identified metabolites, targeting only the non-overlapping metabolites’ peaks for integration. Non-parametric Kruskal–Wallis test, followed by a false discovery rate (FDR) correction, was conducted using RStudio and metabolites with p-value <0.05 were characterized as significant.

2.7. Pathway Analysis and Visualization

A pathway analysis module of MetaboAnalyst 5.0, integrating enrichment analysis and pathway topology analysis through a Google Maps-style visualization system, was adopted to identify the metabolic pathways associated with the statistically significant metabolites for EOS, LOS and healthy preterms. After the import of metabolites’ compound names as data input, the Homo Sapiens pathway library from KEGG was selected. A hypergeometric test and relative betweenness centrality were preferred for over-presentation and topological analysis, respectively.

3. Results

A total of 45 metabolites were successfully detected and assigned in urine samples of the preterm neonates. Due to the complexity and peak overlapping of the 1H NMR urine spectra, statistically important and peaks with discriminant signals were recorded for the qualitative identification of the neonate’s urine metabolism. Table S1 represents the list of all the assigned metabolites (Supplementary materials Table S1) and the main pathway they may belong to. Further statistical analysis of the binned data was based on the reported chemical shifts to associate statistical important spectral regions with specific metabolites.

3.1. Metabolic Profile Alterations of Preterms with EOS

3.1.1. EOS Preterms versus Non NICU Healthy Preterms

Twenty-three preterm infants (n = 23), hospitalized in NICU, were diagnosed with EOS and their urine NMR metabolic profiles were compared to the first day of life spectroscopic data of the control group, consisting of twenty (n = 20) healthy preterm neonates, treated by their mothers immediately after birth and non-hospitalized in NICU (non NICU preterms). The generated data, consisting of 359 spectral bins, were processed using Pareto normalization. The numerical data matrix was applied as input for the unsupervised PCA and the supervised PLS-DA. Both showed a clear discrimination between the two groups. According to PC1 and PC2, explaining the 73.4% of the total variance, loadings belonging to an unknown pattern of multiple peaks between 7.40–7.50 ppm and at 1.40 ppm, observed to the majority of the NMR spectra of the NICU urine samples (20 out of 23 spectra of EOS samples), were responsible for the separation (Supplementary materials Figure S1). Additionally, gluconate and lactose differed between the two groups, with EOS neonates having the higher concentration level of gluconate and lower of lactose. The PLS-DA model (Figure 1a) shows a discrimination between the two groups, with an R2 of 0.664 and Q2 of 0.409 for the third component after a 10-fold cross-validation test, supporting the unsupervised PCA’s clustering. VIP scores, with colored boxes on the right representing the differentiated relative concentrations of the corresponding buckets in each group (blue—low—and red—high—relative concentration) were in accordance with loadings (Figure 1b) and those with higher scores reveal lower intensity of buckets related to ppm of taurine, myo-inositol and betaine, creatinine for EOS and higher intensity of the unknown area 7.40–7.50 ppm. The box plots of the metabolites responsible for the group clustering confirm the concentration’s alteration among the compared groups (Figure 1c). The Y axis represents the normalized concentration of the corresponding spectral region. The obtained negative values come as a result of the total spectral area normalization. The unassigned spectral region of two different types of peaks that resonate at 1.40 ppm statistically correlate with the multiple peaks at the aromatic region of 7.40–7.50 ppm. The statistical correlation was confirmed with the 1D-STOCSY (Supplementary materials Figure S2) that indicates all the correlations of all spectral variables (buckets). To further examine and highlight the structural correlations with the spectral variables that resonate at 7.40–7.50 ppm, we set as ‘’driver peak’’ the variable x.1.41, which includes the signals at 1.40 ppm and the observed maximum correlation displayed between the variable x.1.41 and x.7.51. Thus, they may belong to the same metabolite or group of metabolites derived from medication or parenteral nutrition. We attribute the unknown spectral pattern at 7.40–7.50 ppm and at 1.40 ppm as a NICU metabolic-induced characteristic, since it is present predominantly in the 1H NMR spectra from NICU urine samples (Figure 2). Most of the preterm neonates hospitalized in NICU are under antibiotic treatment because of sepsis or of other infectious condition suspicion; also, prophylactic administration of broad-spectrum antibiotics is unfortunately very common. Antibiotics can lead to adverse effects, including necrotizing enterocolitis (NEC) and LOS [37]. Patton et al. studied their impact on fecal metabolome of preterm infants, but urine metabolome has not been investigated yet [38]. Our study suggests the further analysis of these unidentified spectral regions as antibiotic outcome on 1H NMR spectra of urine samples. However, in depth investigation of the antibiotic and/or additional medication effect on the urine NMR metabolic profile is beyond the scope of this research.

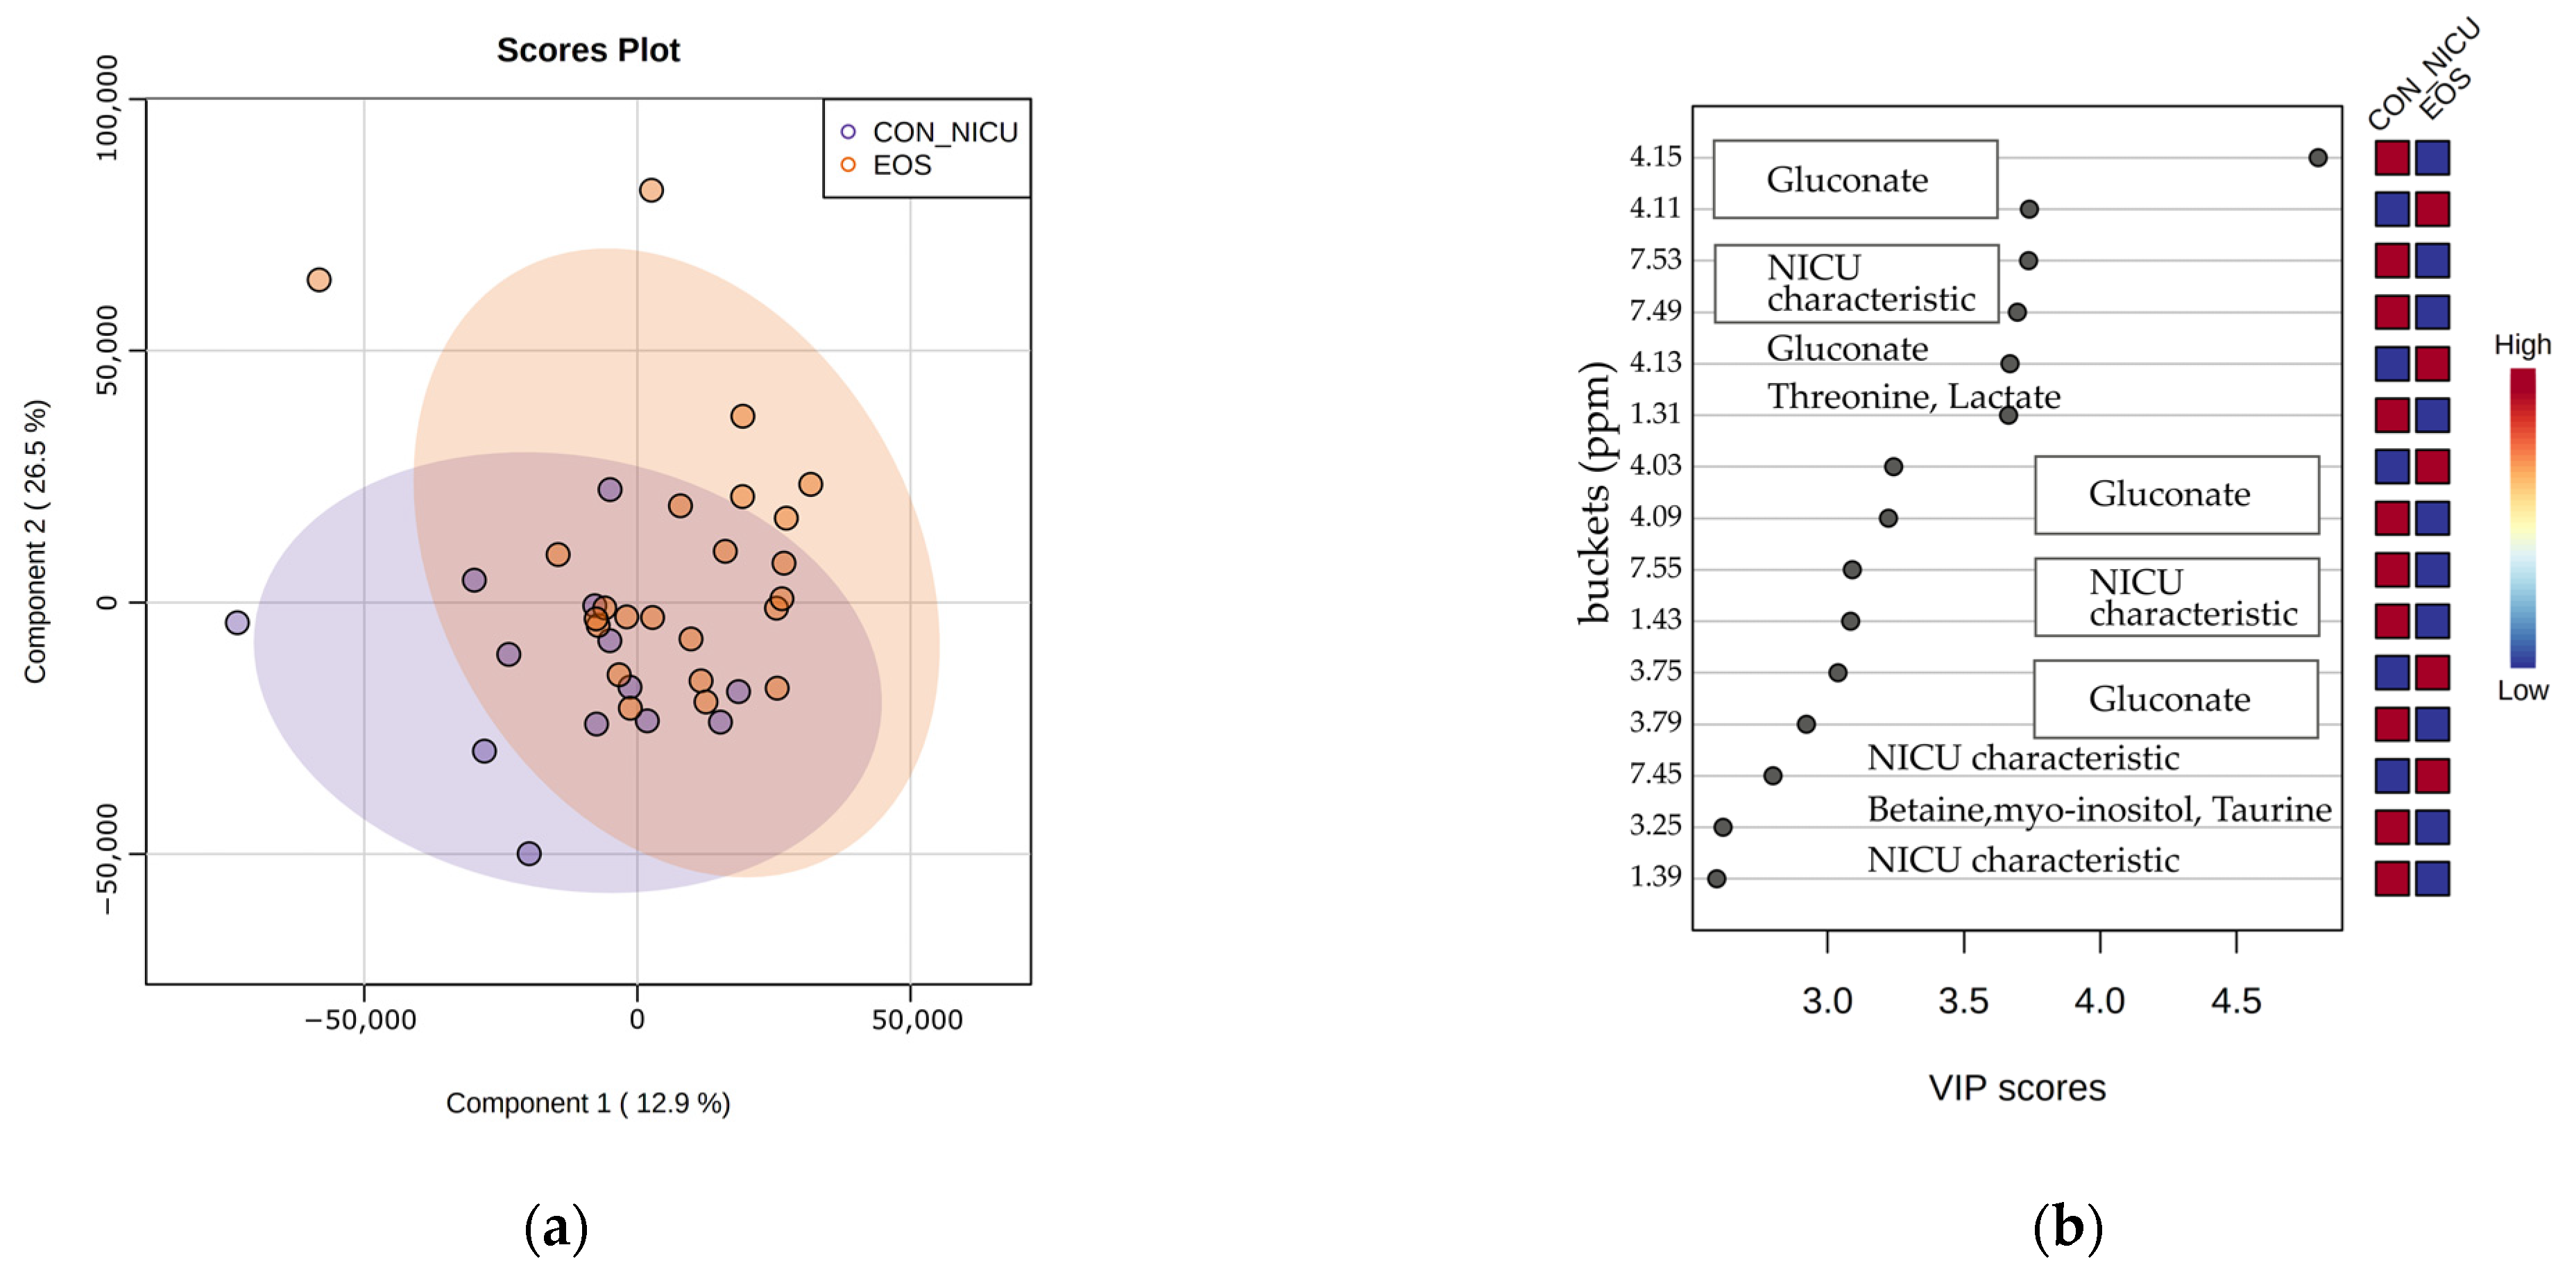
3.1.2. EOS Preterms Versus NICU Control Preterms

1H NMR urine metabolic profile of the first day of life from twenty-three (n = 23) preterm infants with EOS was compared to that of thirteen (n = 13) preterms hospitalized in NICU without any sign or symptom of sepsis or other infection. This comparison was conducted complementary to the group of preterms without the need of hospitalization, to examine and reduce the effect of NICU hospitalization on newborns urinary metabolism. Multivariate analysis of EOS and NICU control preterms displayed less distinctive classification (Supplementary Materials Figure S3a) regarding the comparison with healthy non-NICU preterms (Supplementary Materials Figure S1a). The PLS-DA model (Figure 3a) separated the two groups, but the low value of the R2 = 0.491 and the negative Q2 indicate an overfitted model with low predictability. The buckets responsible for this group separation, as resulting from the PCA loadings plot (Supplementary Materials Figure S3b) and from VIP scores, are related to gluconate, threonine/lactate and 7.40 ppm chemicals shifts of unknown peaks (Figure 3b). Gluconate seems to be present in higher concentration on EOS group, but some buckets related to gluconate (4.09 ppm, 4.15 ppm) have higher VIP score in the control group. This may be justified by the shift of gluconate peaks in different spectra or the presence of sugars, such as glucose and lactose. The pattern of 7.40, 1.40 ppm had higher intensity for control neonates, and may be related to different medical treatment and nutrition. In accordance with prior analysis, EOS neonates differ from controls at the 3.25 ppm spectral region, where mainly betaine is located, overlapping myo-inositol and taurine.

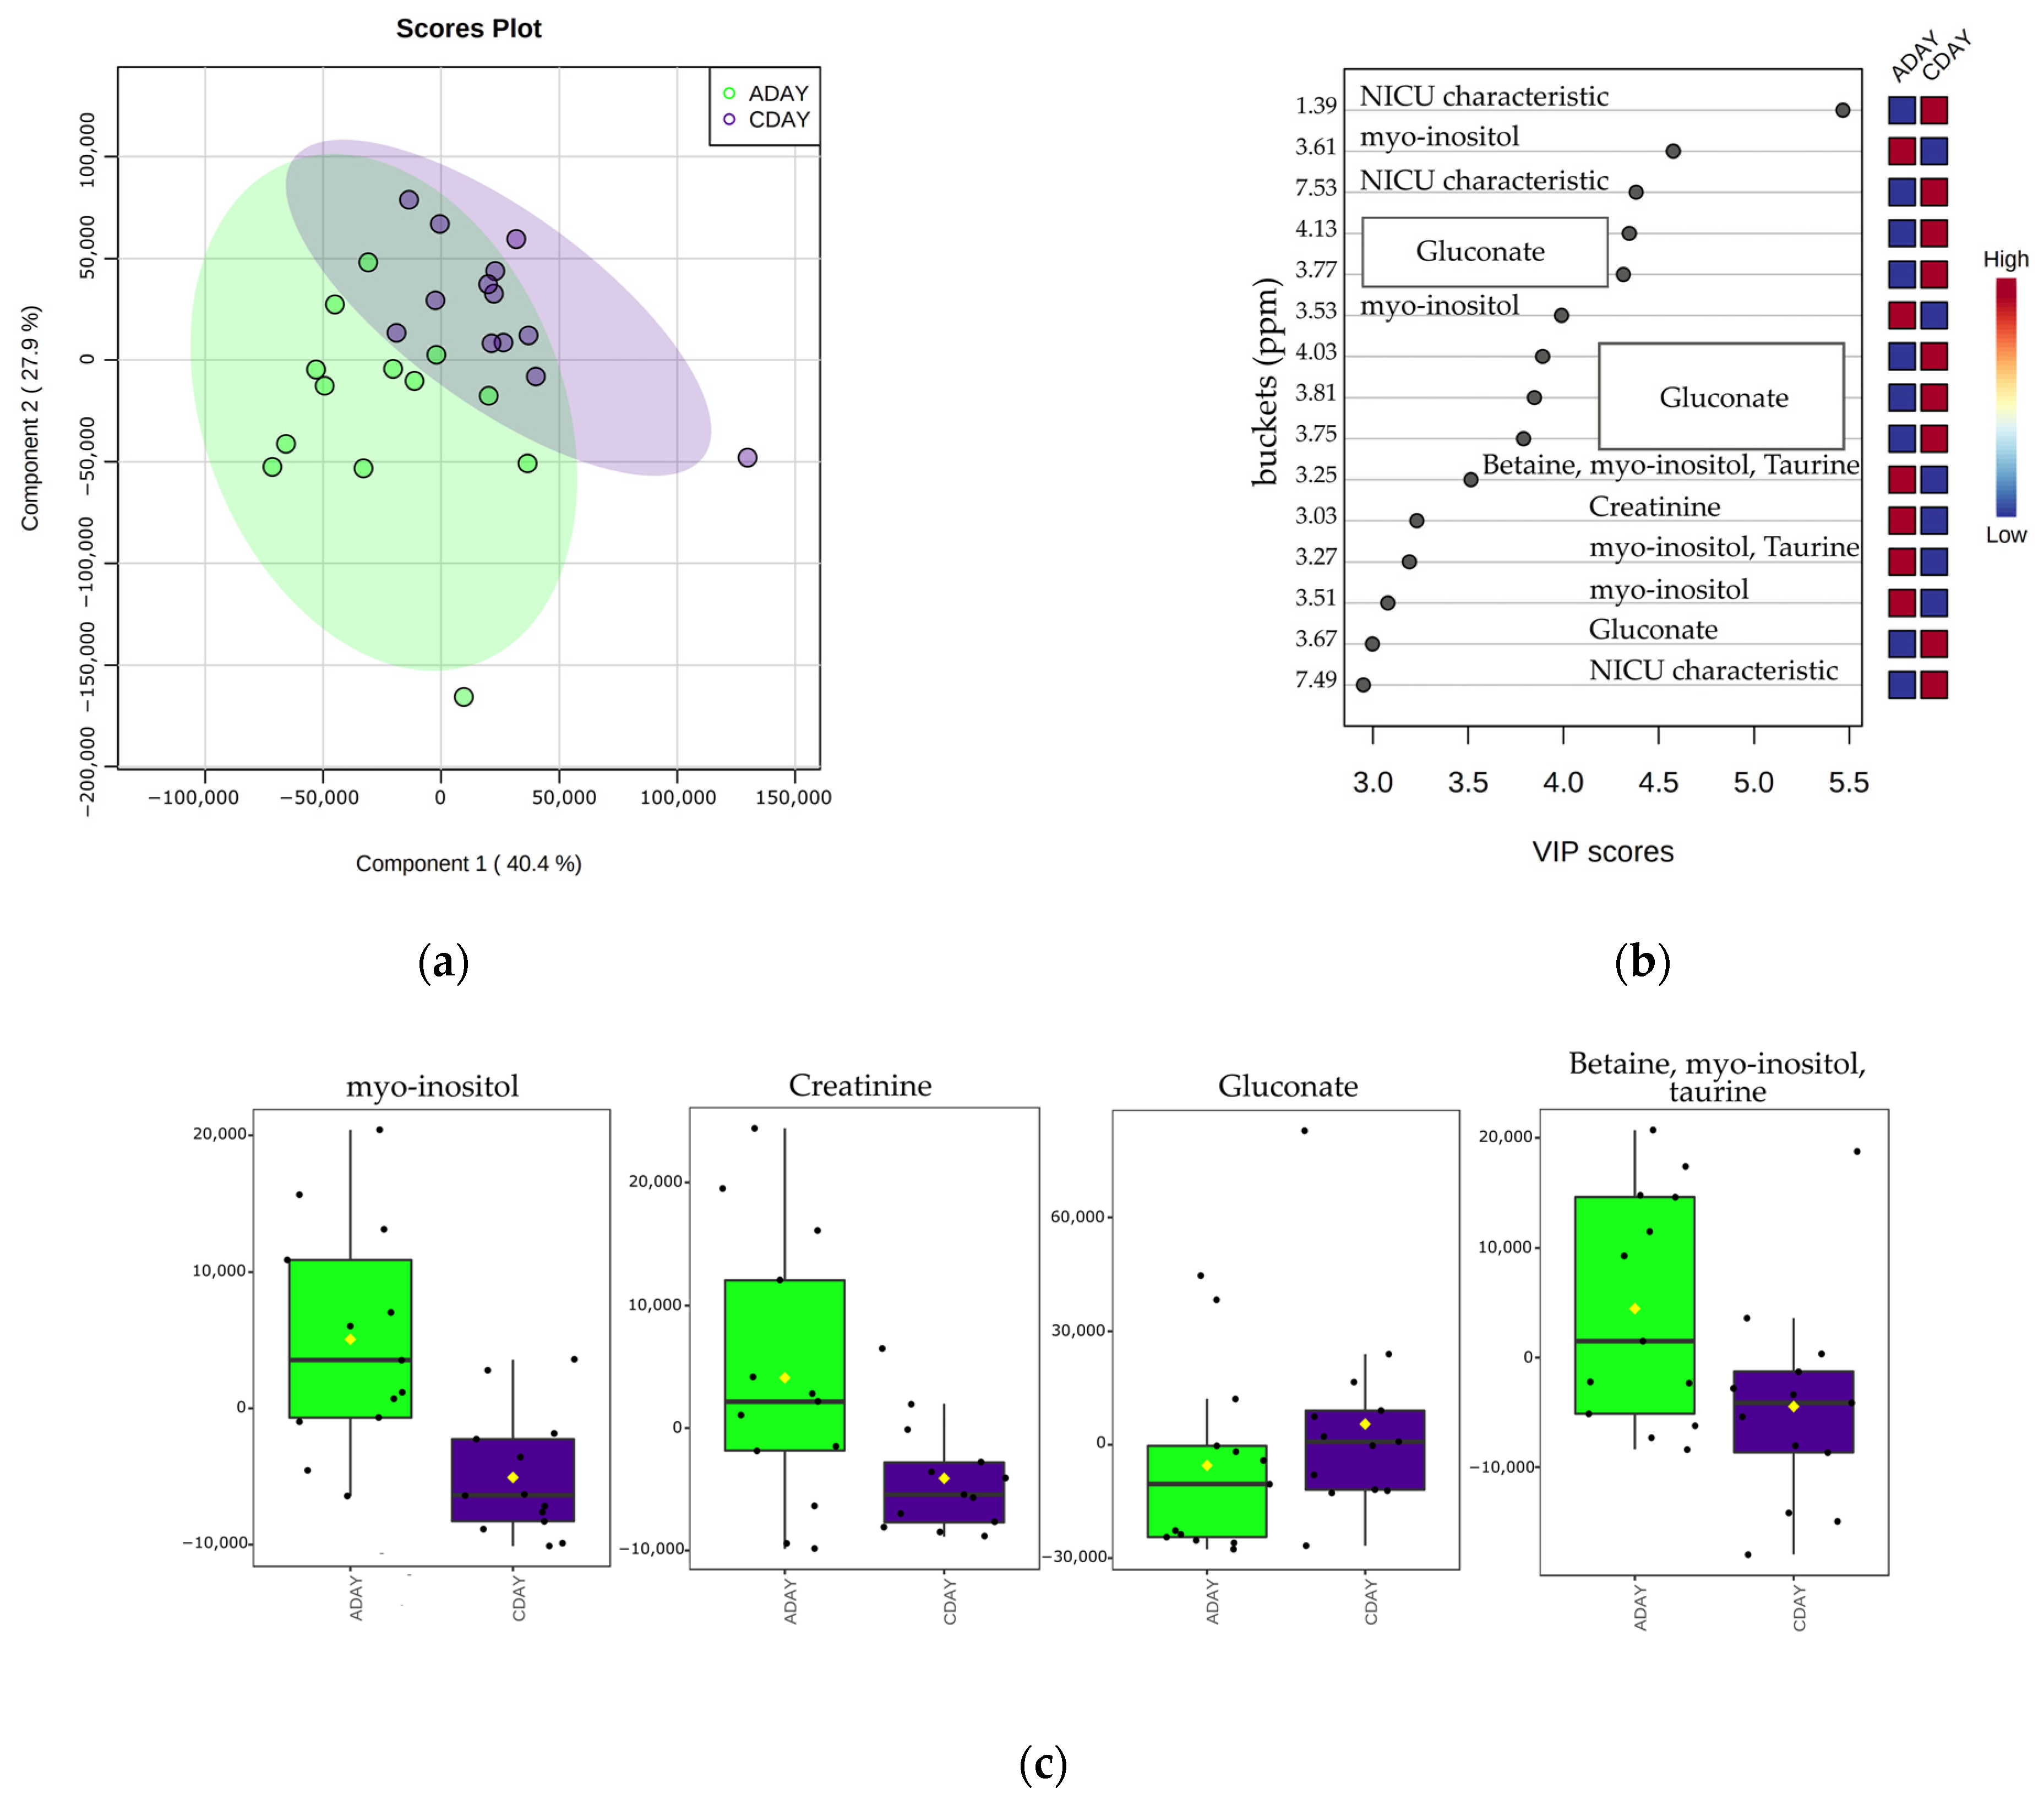
3.1.3. EOS Metabolic Profile Progression between First and Third Day of Life

With the perspective for the validation of a metabolite for further analysis or the identification of a group of metabolites characteristic of the septic urine metabolome, the progression of the metabolome throughout the time of the condition needs to be examined. In our study a comparative analysis of urine metabolomes between the first and the third day of septic newborns’ extrauterine life was conducted. For ten (n = 10) out of the twenty-three neonates diagnosed with EOS, urine samples and NMR data from the third day of neonates’ life are not available due to handling inaccuracies during sample collection or other excluding criteria regarding the NMR spectra (e.g., baseline and phase distortions) and the presence of lipids, characterized of broad peaks overlapping peaks of small molecules studied in this analysis. Hence, a total of twenty-six (n = 26; paired 1st and 3rd day of life) urine 1H NMR spectra, corresponding to each one of the thirteen (n = 13) EOS preterms, were analyzed. An initial classification of the two groups was performed via PCA, where the third principal component, explains the 79.9% of the cumulated variance (Supplementary materials Figure S4). PLS-DA corroborated and strengthened the clustering, providing a valid and reliable model (Figure 4a). The cross-validation indicated the use of the first two components as optimal for building the classification model, with R2 = 0.613 and Q2 = 0.296. VIP scores were in accordance with the PCA’s loadings and indicated reduced concentration of myo-inositol, gluconate, betaine, taurine, and creatinine on the third day (Figure 4b). The normalized concentration’s differentiated levels of the reported metabolites are clearly represented on their associated box plots (Figure 4c). The alteration of myo-inositol levels between the first and the third day of life has been previously reported for healthy full-term (>38 GA) neonates [33]. Specifically, in association with sepsis, increased levels of myo-inositol have also been detected on the work of Sarafidis et al. for LOS at the day of the disease’s onset [28]. The decrease in creatinine is in accordance with the Fanos et al. findings for septic neonates [30].

3.2. Metabolic Profile Alterations of Preterms with LOS

3.2.1. LOS Preterms versus Non NICU Healthy Preterms

Spectroscopic data of urine samples collected on the third day of life from eleven (n = 11) preterm neonates that developed LOS were compared to the third day’s 1H NMR urine profile of twelve (n = 12) non-NICU healthy preterms. The unsupervised PCA, explaining the 75.1% of the total variability within the first three components (PC1 = 43.3%, PC2 = 18.2% and PC3 = 13.6%) indicated a clear tendency for clustering the two groups. Loadings with the greatest impact caused this form of PCA plot, agreed with EOS results and reinforced the claim of the great impact of hospitalization in NICU on urine metabolome (Supplementary materials Figure S5). The supervised PLS-DA, after the cross-validation resampling method, present a reliable and predictable model with R2 = 0.861 and Q2 = 0.788 for the second component (Figure 5a). As expected, VIP scores highlighted gluconate and the pattern of 1.40, 7.40–7.50 ppm (Figure 5b), with significant alterations of normalized concentration among groups, clearly displayed on the box plots (Figure 5c). Multivariate analysis of LOS metabolic profile reveals similar metabolic alterations with EOS. This analysis did not add something different compared to the analysis about EOS and healthy non-NICU preterms, and it is primary evidence that the septic profile does not dramatically change in relation to time within the first three days of neonate’s life.

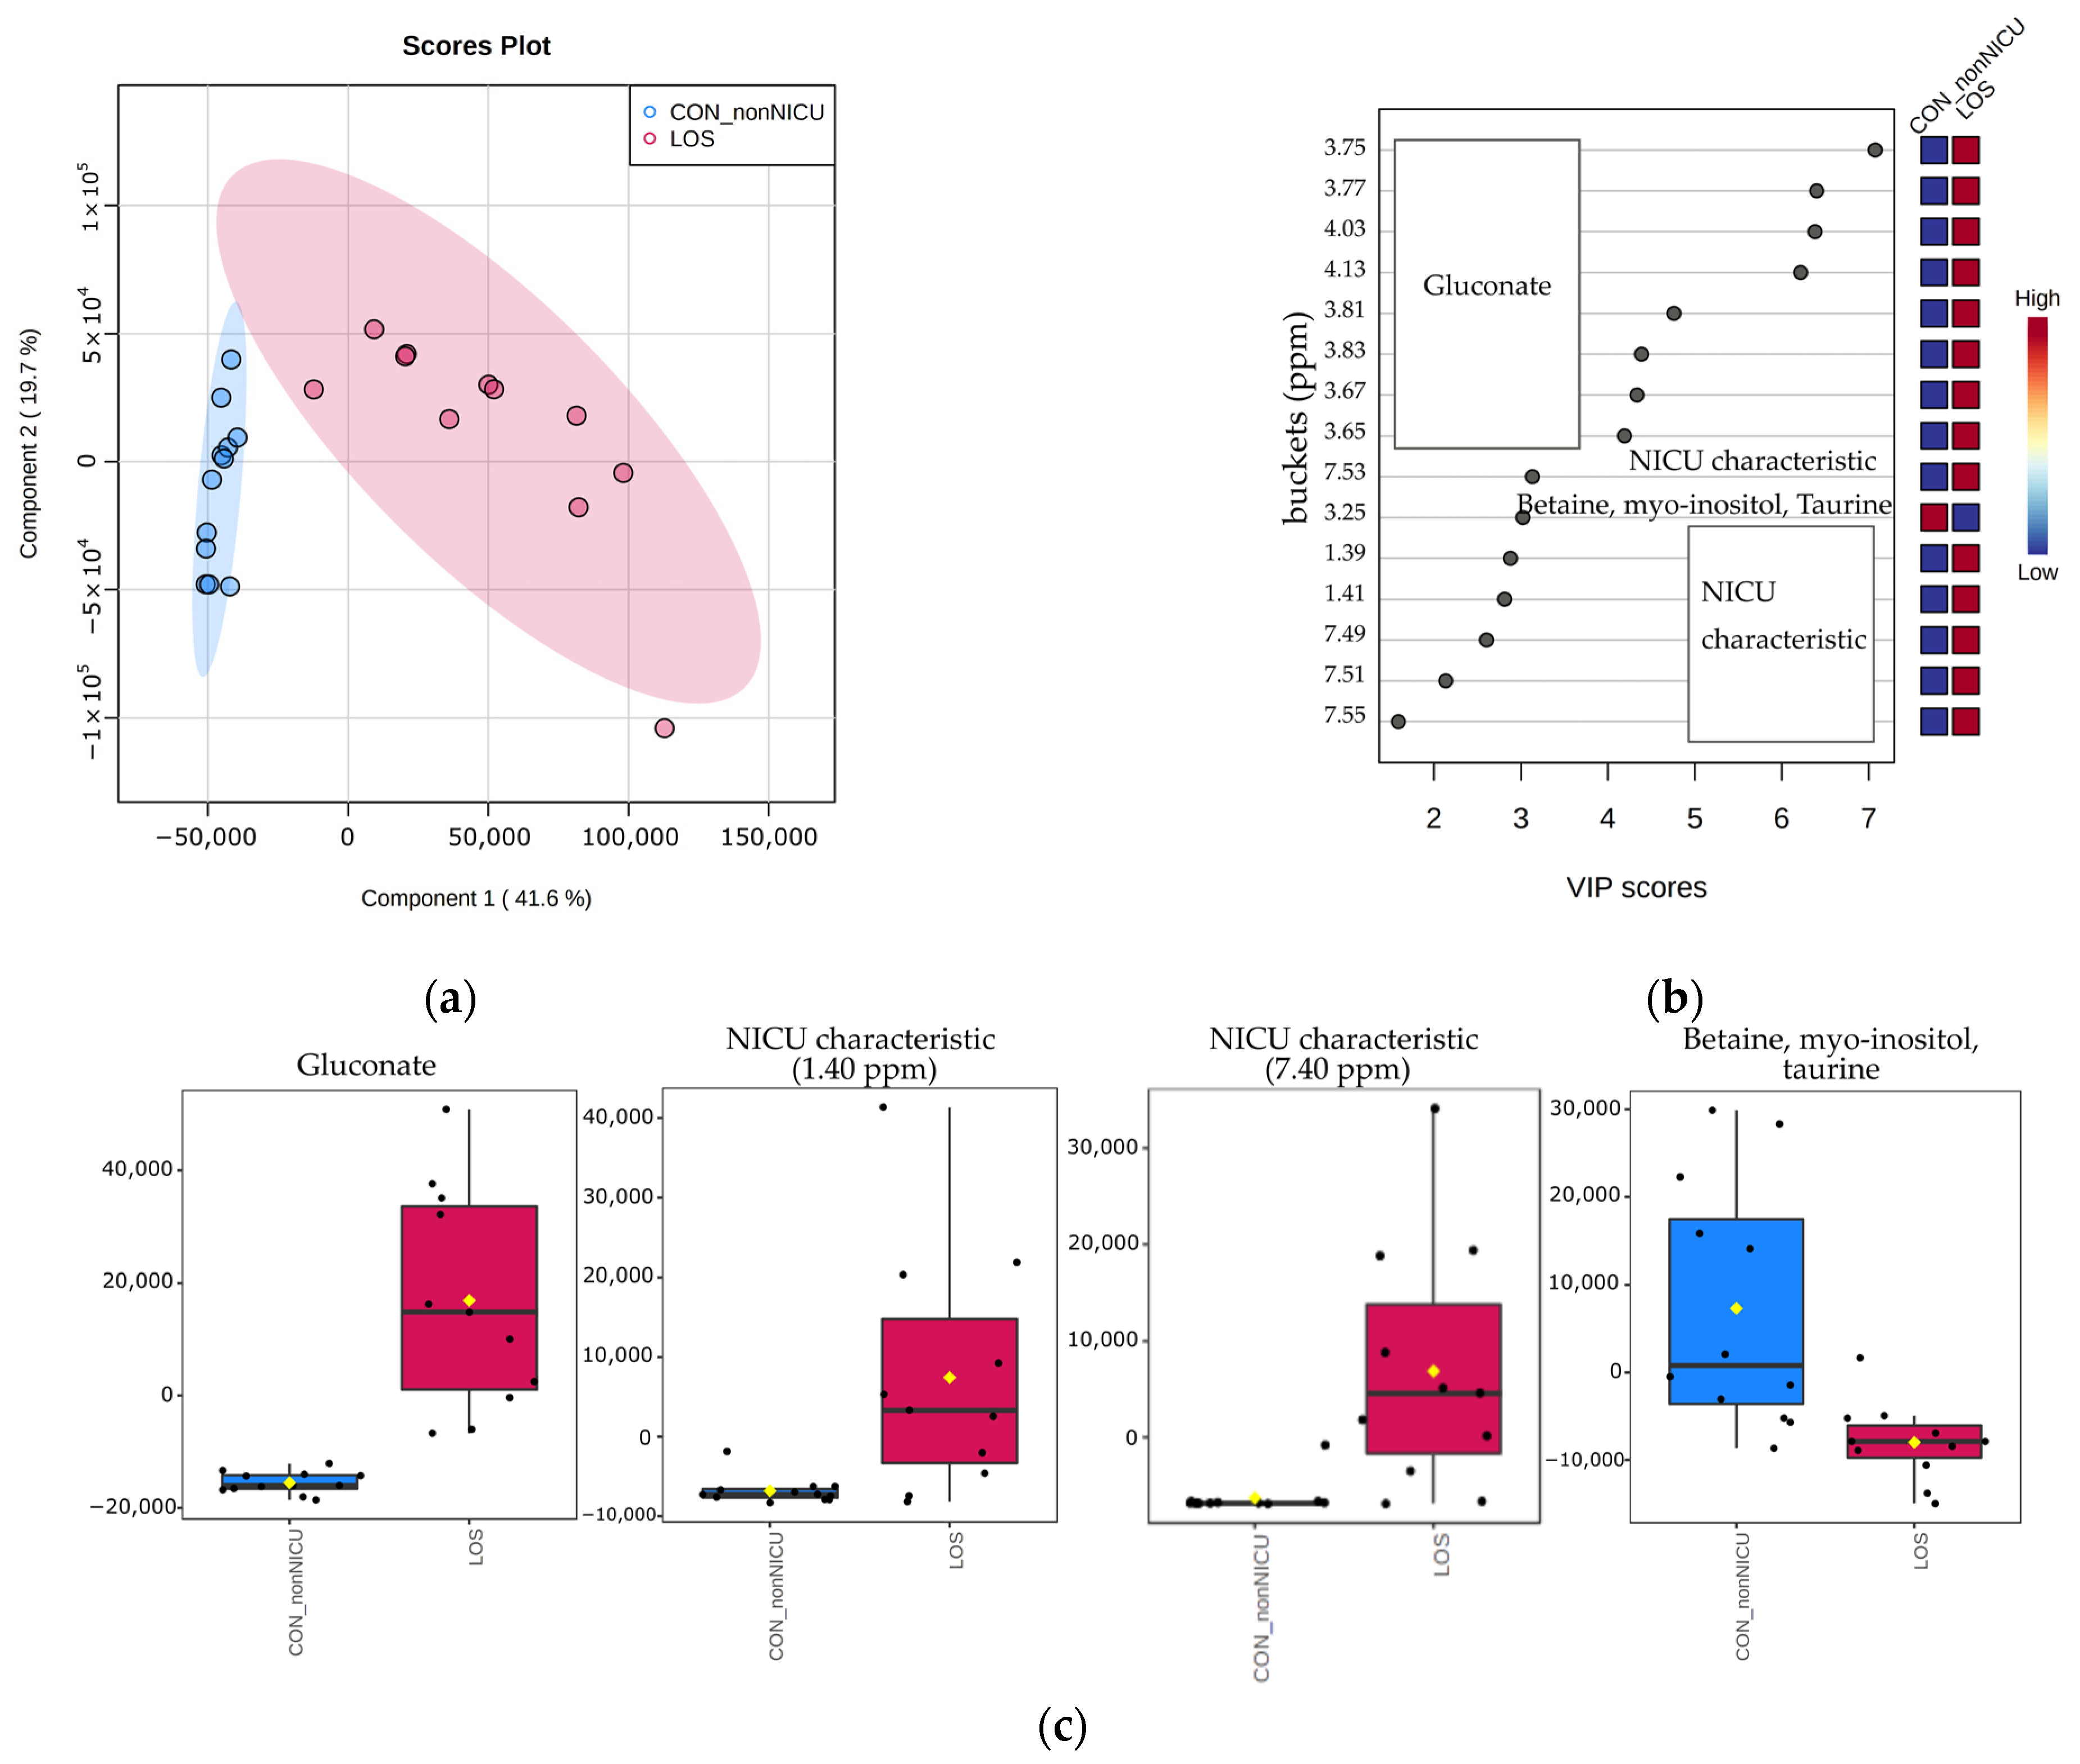
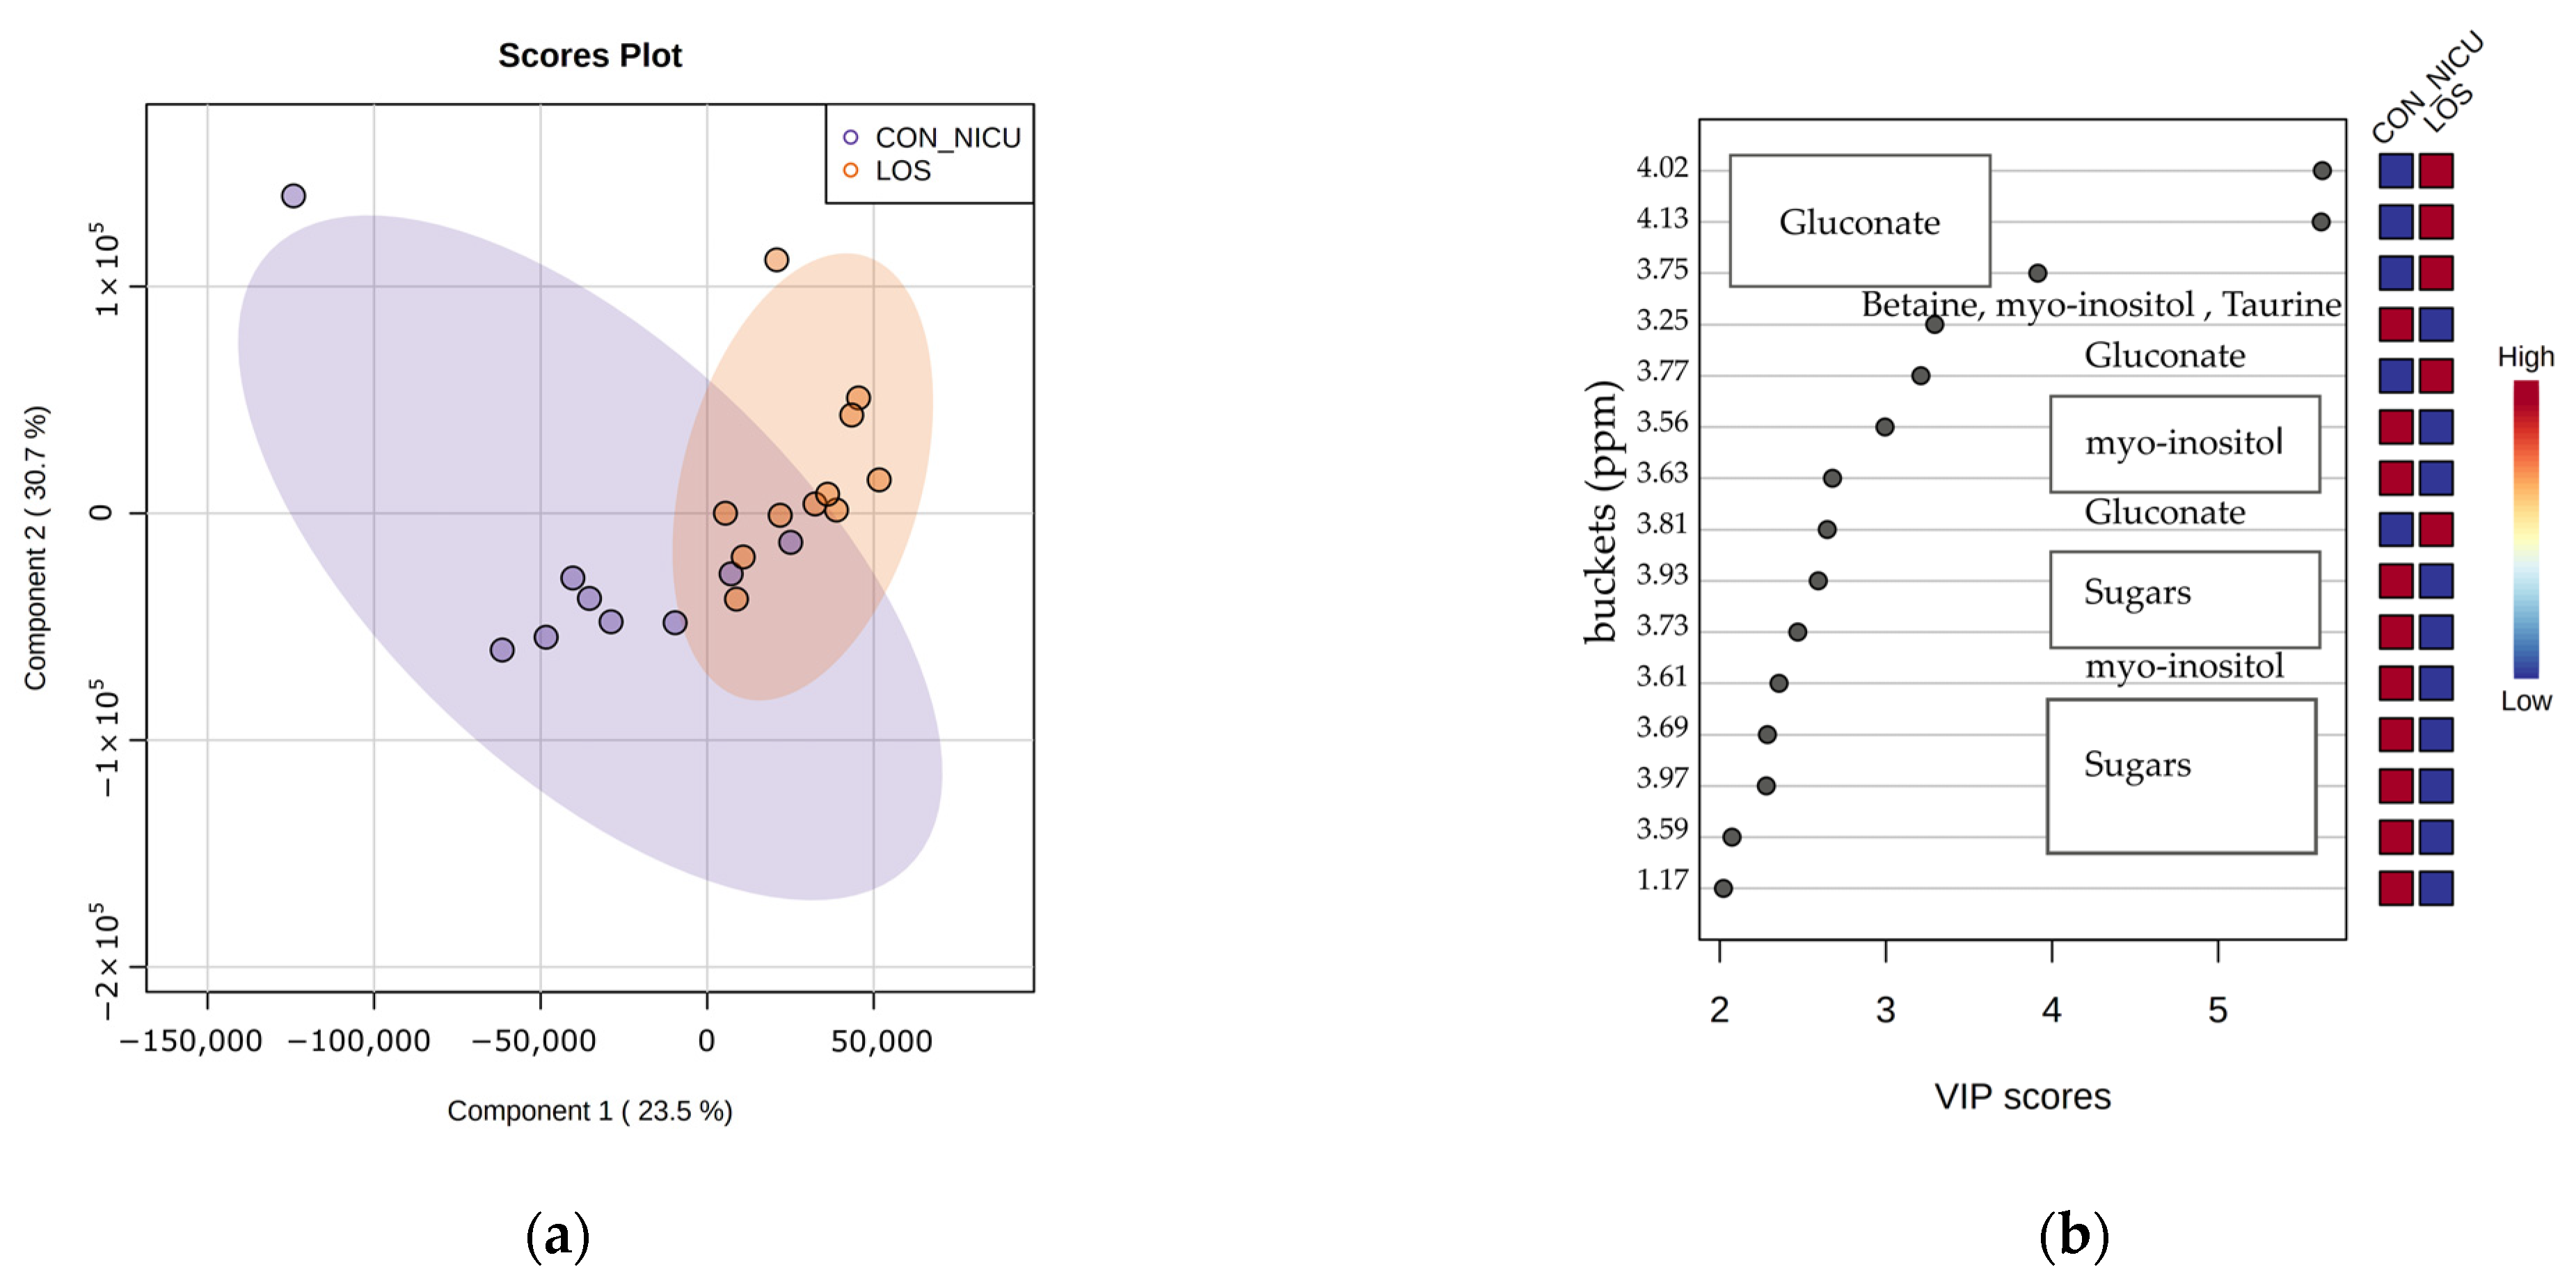
3.2.2. LOS Preterms Versus NICU Control Preterms

Following the same procedure with the comparisons for EOS neonates, in order to eliminate the impact of hospitalization and dietary or drugs urine excreted metabolites in urine LOS data compared to the NICU control group. In total, eleven (n = 11) 1H NMR urine LOS profiles were compared with nine (n = 9) 1H NMR urine NICU control profiles from the third day of life. Scores plot of the PCA model (Supplementary materials Figure S5a) primarily did not reveal strong discrimination and resembles the PCA plot clustering of EOS analysis. Additively, presents different urine metabolic profile with the same elevations of myo-inositol, betaine, gluconate, taurine and NICU characteristics (Supplementary materials Figure S6b). The PLS-DA model is characterized by low capacity of predictability with negative Q2 values (Figure 6a). Beyond these metabolites, VIP scores revealed higher concentration of buckets belonging to sugars, for the control group (Figure 6b). The bucket of 1.17 ppm belongs to a crowded 1H NMR region, without a specific metabolite present to the total of urine samples.

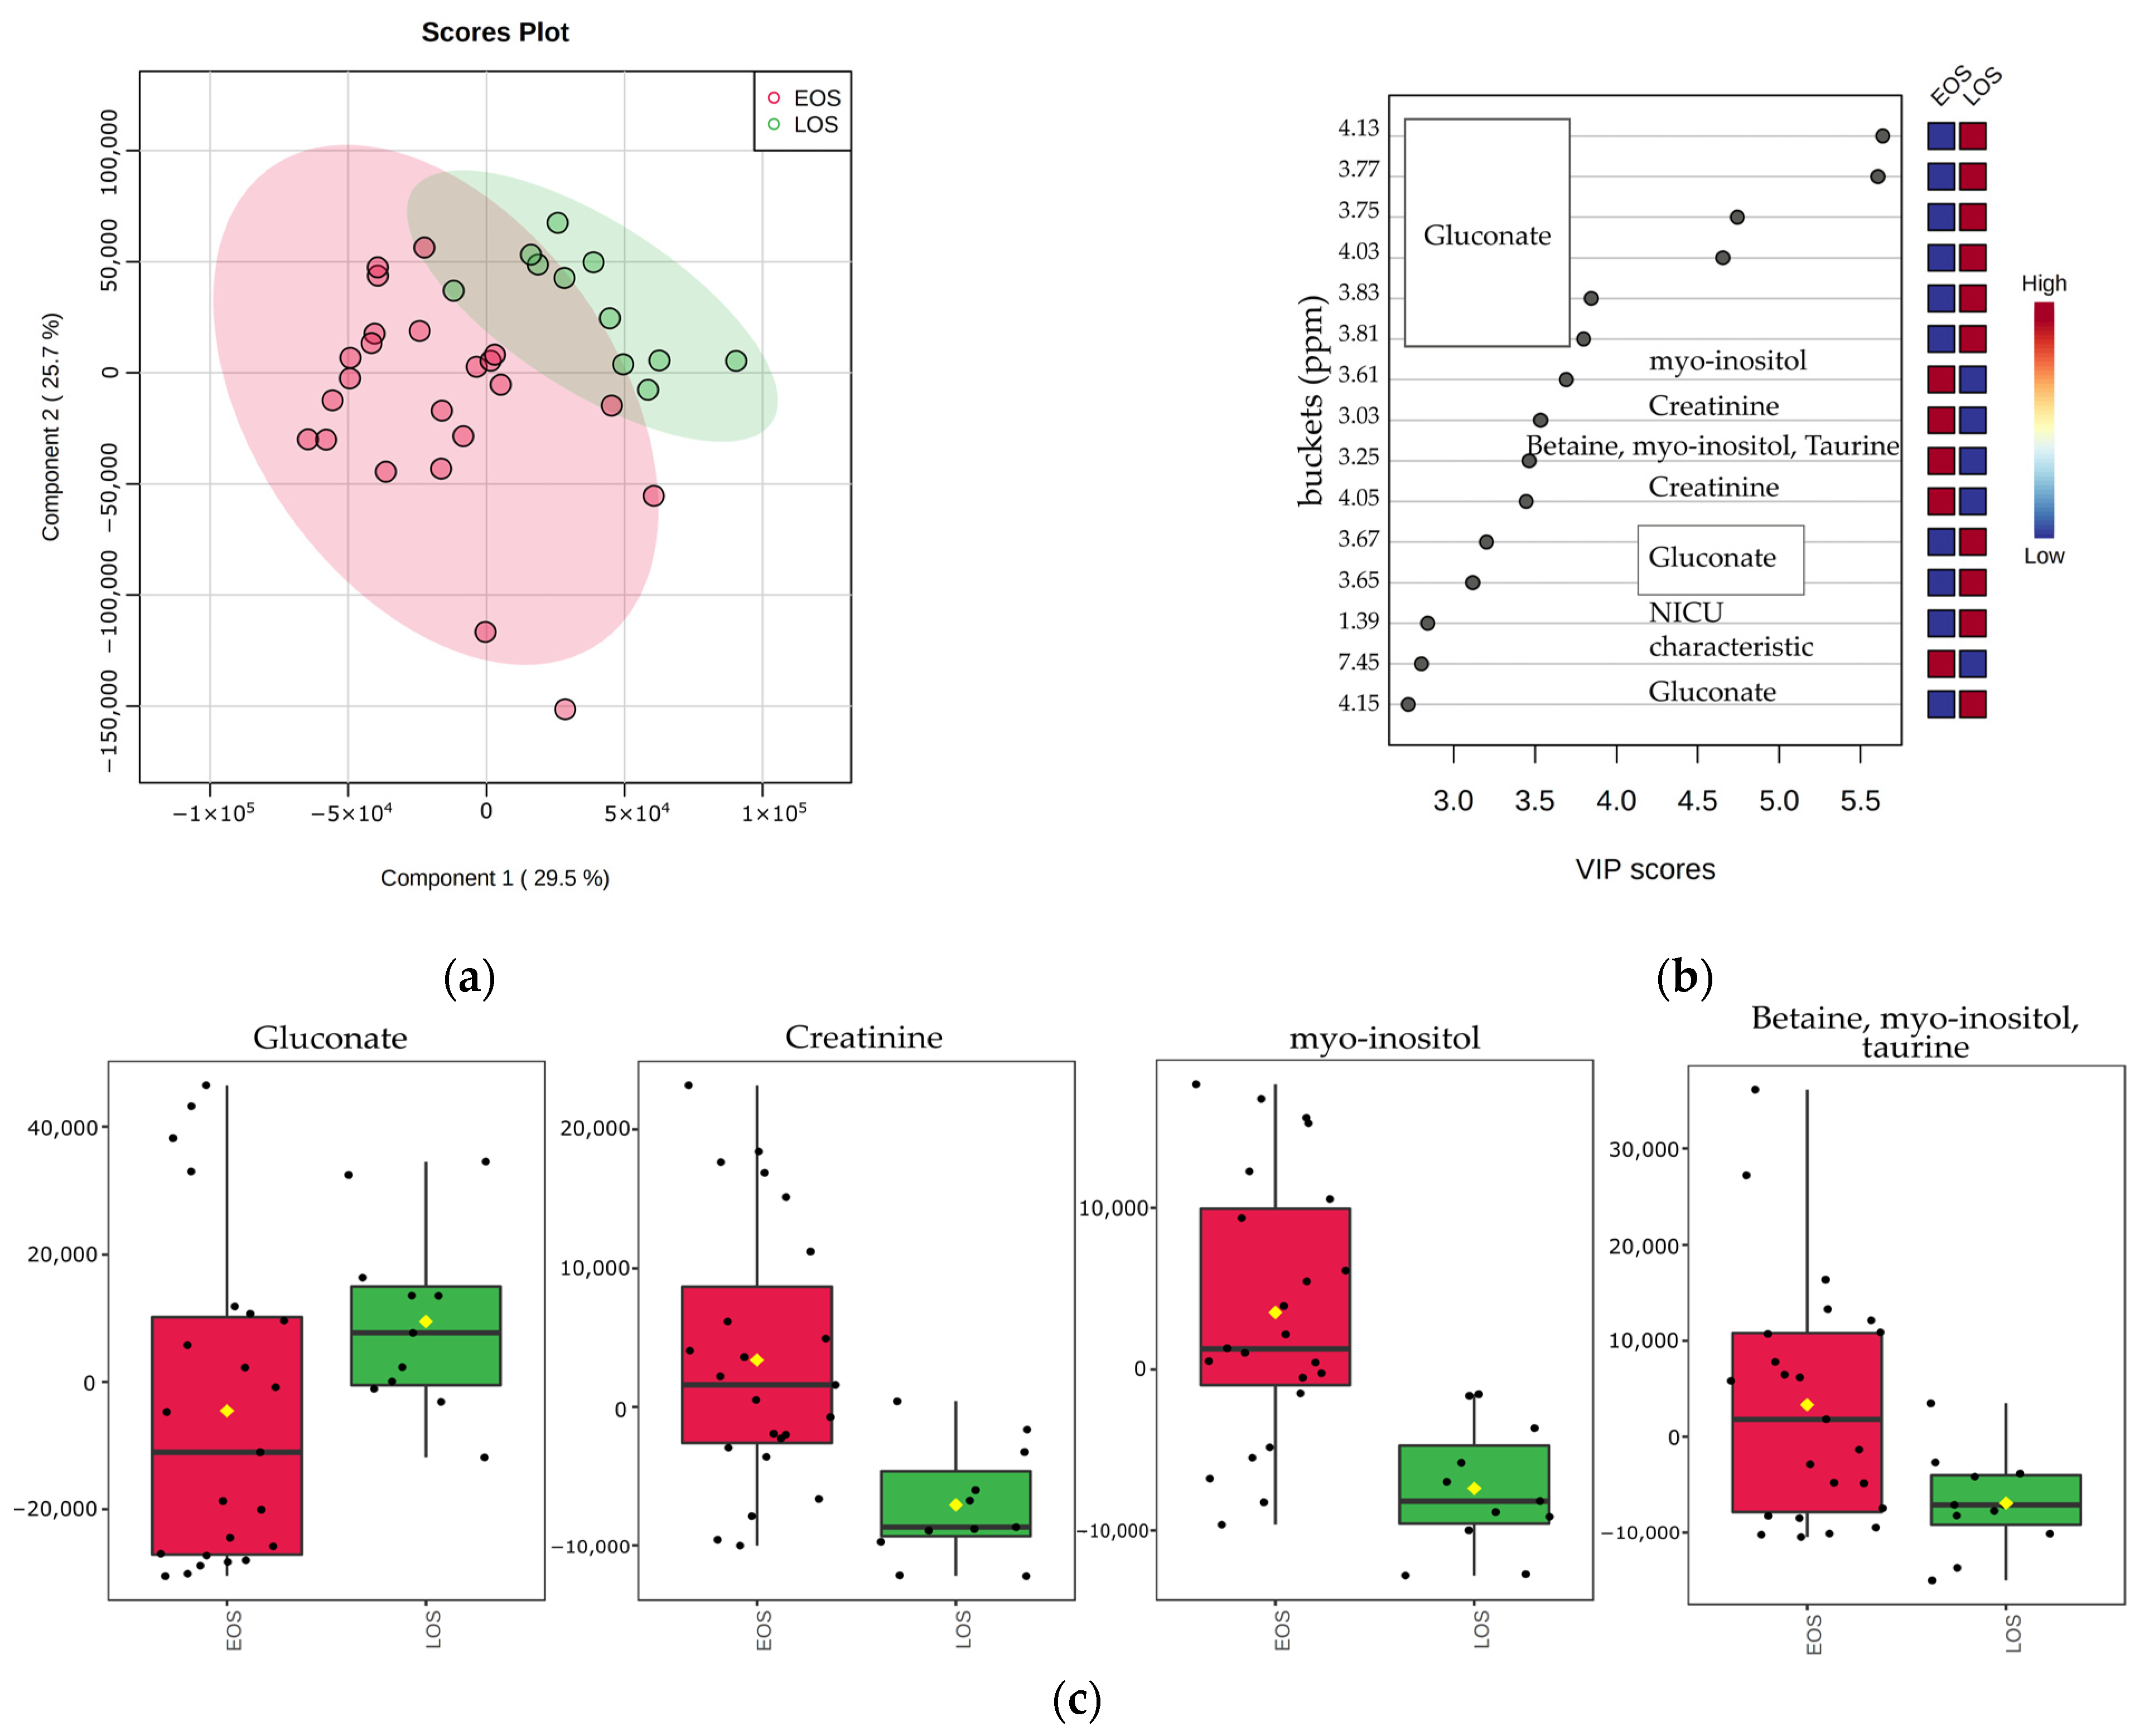
3.3. Metabolic Profile Alterations between EOS and LOS Neonates

LOS and EOS neonates, except the onset of the disease, present different clinical symptoms and vary on the severity of the outcome. This differentiation can be reflected also on the metabolism. So, additively to separate comparisons between EOS, LOS and control groups, multivariate analysis was conducted between the urine metabolic profile of the first day of life for twenty-three (n = 23) EOS neonates and third day of life for eleven (n = 11) LOS neonates. For the PCA model (Supplementary materials Figure S7), until the PC3 the variance explained was 70.1% and the plot showed a tendency of clustering the urine metabolic profiles of each group, which became clear on the PLS-DA plot (Figure 7a). The metabolic alterations, according to VIP scores (Figure 7b) and box plots (Figure 7c), resemble the differences among the first and third day of EOS. So, the correlation between EOS and LOS cannot be validated as this metabolic outcome may reflect the adaptation of the neonate to the extrauterine life. To shed light on the alterations of the septic metabolome over the days, targeted metabolomic analysis of specific metabolites already known or suspected based on metabolomics results for their association with sepsis would offer a more certain approach.

3.4. Univariate Statistical Analysis

A univariate statistical analysis was performed on specific metabolites with discriminant peaks. Metabolites with p-value < 0.05 (Table 2) were characterized as statistically significant. Between septic and healthy non-NICU preterms, additively to multivariate results, lactose and hippurate were highlighted as significant for EOS, and dimethylglycine for LOS group. For both septic groups decreased levels of taurine, betaine and increased levels of gluconate also shown by multivariate analysis were reinforced by univariate analysis. EOS and LOS metabolites’ comparison confirmed the initial results obtained through multivariate analysis regarding myo-inositol’s differentiation. Septic groups and control NICU preterms did not highlight any statistically significant metabolite. The box plots of the statistically significant metabolites represent the differentiation of their relative intensity between septic and healthy control non-NICU neonates (Supplementary materials Figure S8).

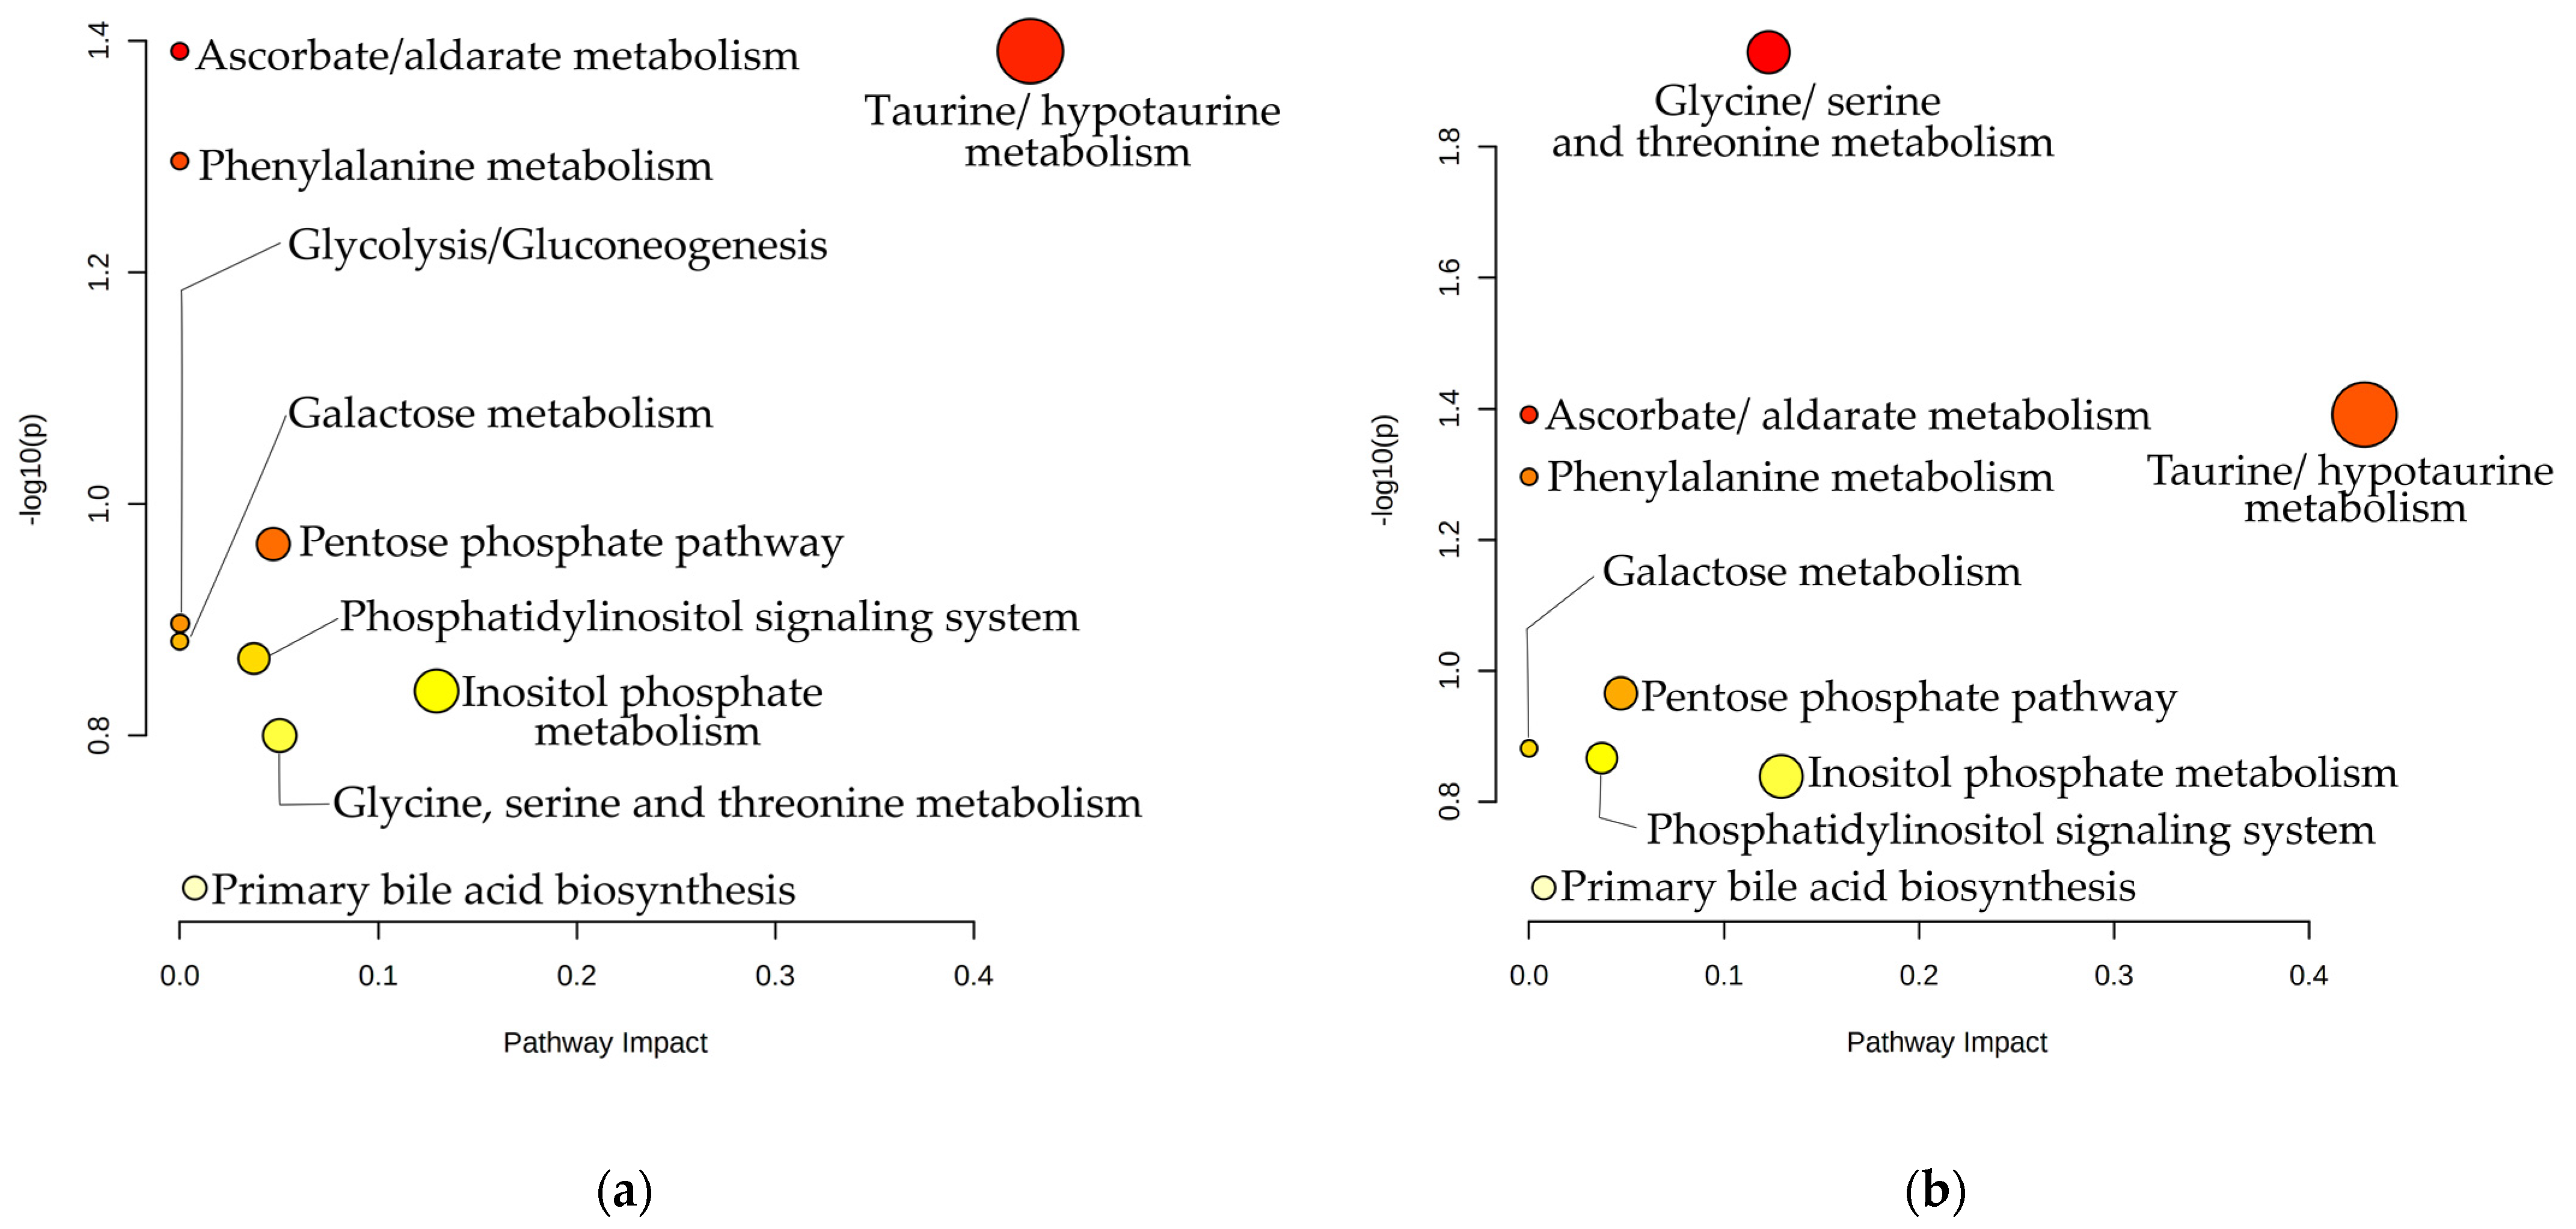
3.5. Pathway Analysis

The identified significant metabolites from multivariate and univariate analysis were implemented into MetaboAnalyst pathway analysis module to determine a qualitative aspect of all the possibly affected metabolic pathways. A separate analysis for the EOS and LOS group was selected, as except myo-inositol, betaine, gluconate, taurine, lactose, creatinine and hippurate which were statistically significant for both groups, glucose and N, N-Dimethylglycine were characterized as significant only for EOS and LOS group, respectively. A metabolic pathway analysis depicted ten (n = 10) altered metabolic pathways for the EOS (Figure 8a, Supplementary materials Table S2) and nine (n = 9) for the LOS group (Figure 8b, Supplementary materials Table S3). The representation of all the identified pathways was based on the pathway impact (x-axis) and the calculated p-value (y-axis). Among the nine metabolic pathways for EOS, ascorbate/ alderate metabolism and taurine/hypotaurine metabolism were the most significant, with p-value < 0.05. Taurine/hypotaurine metabolism pathway had the largest impact factor (0.42), followed by inositol phosphate pathway (0.13). Myo-inositol and taurine were the metabolites involved in these pathways (Supplementary materials Table S2). Regarding the LOS, significant metabolites, glycine/serine, and threonine metabolism pathway, where betaine and N,N-Dimethylglycine are involved, had the lowest p-value (0.01). The pathway impact scores did not present large differences from EOS pathway analysis.

4. Conclusions

The findings of our study indicate a discrete metabolic profile of septic neonates. NMR based metabolomic approach revealed the relation among septic and control neonates, highlighting gluconate, myo-inositol, hippurate, taurine, N, N-Dimethylglycine, betaine, creatinine, glucose and lactose as significant metabolites. Our study reported, for the first time, altered urinary amounts of betaine in EOS and LOS neonates and N, N-Dimethylglycine in LOS neonates. Differentiated concentration levels of taurine and hippurate via LC-MS analysis have been previously reported by Sarafidis et al., and through UPLC-MS by Mardegan et al. [28,29]; however, our study was the first to detect them in urine samples of septic neonates via NMR. The utilization of the two control groups and their discrete analysis, based on the NICU hospitalization, showed that NICU treatment has a significant impact on neonates’ urine metabolome. The observed spectral pattern indicative for the most of the NICU neonates, suggests that it is related to endogenous or exogenous metabolites of the personalized nutrition or medical treatment. Additionally, the impact of nutrition is confirmed from the greatly elevated levels of gluconate for the septic group and lactose for neonates fed from their mothers. Differentiation between EOS and LOS, and the adaptation of the fetus to neonate during the first days of extrauterine life that occur in parallel are reflected to the metabolism. Changes through the first days of life, associated with EOS and LOS, highlight the necessity for chronological coupled sampling with the onset and specific time of the disease progression. This research builds on the power of NMR metabolomic analysis to determine the status of an entire organism by a small amount of non-invasive collected biological sample. Τhe establishment of NMR analysis of metabolome for clinical research in the field of neonatology, leading to large-scale multicenter studies, gives new and promising perspectives for its incorporation into the clinical daily routine and the validation of new combined diagnostic biomarkers.

Supplementary Materials

The following supporting information can be downloaded at: https://www.mdpi.com/article/10.3390/app12041932/s1; Figure S1: Scores and loadings plot of PCA for NMR data belonging to neonates diagnosed with EOS (pink circles) and healthy neonates without need for NICU hospitalization (blue circles). (a) PCA scores plot of the EOS and healthy non-NICU preterms. (b) Loadings plot of PC1 and PC2; Figure S2: 1D-STOCY pseudo-NMR spectrum of correlation coefficients to the other signals in the median urine NMR spectrum and maximum intensity correlation of peaks are color encoded and projected into statistical difference spectra: ‘’driver peak’’ was set the one at 1.41 ppm; Figure S3: Scores and loadings plot of PCA for NMR data belonging to neonates diagnosed with EOS (orange circles) and neonates hospitalized in NICU without EOS (purple circles). (a) PCA scores plot of the EOS and control group. (b) Loadings plot of PC1 and PC2; Figure S4: Scores and loadings plot of PCA for NMR data belonging to urine samples of neonates diagnosed with EOS the first (green circles) and the third day (blue circles) of their life. (a) PCA scores plot of the first- and third-day’s samples. (b) Loadings plot of PC1 and PC2; Figure S5: Scores and loadings plot of PCA for NMR data belonging to neonates diagnosed with LOS (pink circles) and control neonates with-out need for hospitalization (blue circles). (a) PCA scores plot of the LOS and healthy non-NICU preterms without need for hospitalization. (b) Loadings plot of PC1 and PC2; Figure S6: Scores and loadings plot of PCA for NMR data belonging to neonates diagnosed with LOS (orange circles) and control neonates of NICU (purple circles). (a) PCA scores plot of the LOS and control group. (b) Loadings plot of PC1 and PC2; Figure S7: Scores and loadings plot of PCA for NMR data belonging to urine samples of neonates diagnosed with EOS (red circles) and neonates with LOS (green circles). (a) PCA scores plot of EOS and LOS group. (b) Loadings plot of PC1 and PC2; Figure S8: Box plots of the statistically significant metabolites highlighted from univariate analysis with p-value < 0.05, between healthy control non-NICU neonates, LOS and EOS groups; Table S1: 1H NMR Chemical Shifts of Metabolites detected in urine samples of neonates and their main metabolic pathway; Table S2: Detailed results from the pathway analysis of the EOS group’s significant metabolites; Table S3: Detailed results from the pathway analysis of the LOS group’s significant metabolites.

Author Contributions

Study conception and design, I.C., A.V. and G.A.S.; patient enrolment and management: I.C. and A.V.; collection of clinical data and urine samples: I.C.; NMR analysis: S.A.C.; statistical analysis, biostatistics, and computational analysis, P.D.G.; results interpretation, P.D.G., S.A.C., I.C., A.V. and G.A.S.; writing—original draft preparation: P.D.G. and S.A.C.; writing—review and editing: P.D.G., S.A.C., I.C., A.V. and G.A.S.; supervision, A.V. and G.A.S. All authors have read and agreed to the published version of the manuscript.

Funding

The work was supported by the INSPIRED (MIS 5002550) which is implemented under the Action ‘Reinforcement of the Research and Innovation Infrastructure,’ funded by the Operational Program ‘Competitiveness, Entrepreneurship and Innovation’ (NSRF 2014–2020) and co-financed by Greece and the European Union (European Regional Development Fund). Additionally, EU FP7 REGPOT CT-2011-285950—“SEE-DRUG” project is acknowledged for the purchase of UPAT’s 700 MHz NMR equipment.

Institutional Review Board Statement

This study was approved by the General University Hospital of Patras human research ethics committee (protocol code 7976/24.4.17, date of research committee approval: 217/ 31.3.2017 and study number approval: 154/16.3.2017 by the research ethics and deontology committee) all procedures performed in studies involving human participants were in accordance with the ethical standards of the institutional and/or national research committee and with the 1964 Helsinki declaration and its later amendments or comparable ethical standards.

Informed Consent Statement

Informed consent and parental permission were obtained from all the parents of the participants involved in the study.

Data Availability Statement

Data and R script are available from the corresponding authors upon reasonable request.

Conflicts of Interest

The authors declare that they have no conflict of interest.

References

  1. Shane, A.L.; Sánchez, P.J.; Stoll, B.J. Neonatal Sepsis. Lancet 2017, 390, 1770–1780. [Google Scholar] [CrossRef]
  2. Vergnano, S.; Sharland, M.; Kazembe, P.; Mwansambo, C.; Heath, P.T. Neonatal Sepsis: An International Perspective. Arch. Dis. Child. Fetal Neonatal Ed. 2005, 90, 220–224. [Google Scholar] [CrossRef]
  3. World Health Organization (WHO). Global Report on the Epidemiology and Burden of Sepsis: Current Evidence, Identifying Gaps and Future Directions; World Health Organization: Geneva, Switzerland, 2020; ISBN 9789240010789.
  4. Fanaroff, A.A.; Wright, L.L.; Stevenson, D.K.; Shankaran, S.; Donovan, E.P.; Ehrenkranz, R.A.; Younes, N.; Korones, S.B.; Stoll, B.J.; Tyson, J.E.; et al. Very-Low-Birth-Weight Outcomes of the National Institute of Child Health and Human Development Neonatal Research Network, May 1991 through December 1992. Am. J. Obstet. Gynecol. 1995, 173, 1423–1431. [Google Scholar] [CrossRef]
  5. Shah, G.S.; Budhathoki, S.; Das, B.K.; Mandal, R.N. Risk Factors in Early Neonatal Sepsis. Kathmandu Univ. Med. J. (KUMJ) 2006, 4, 187–191. [Google Scholar]
  6. Lim, W.H.; Lien, R.; Huang, Y.C.; Chiang, M.C.; Fu, R.H.; Chu, S.M.; Hsu, J.F.; Yang, P.H. Prevalence and Pathogen Distribution of Neonatal Sepsis among Very-Low-Birth-Weight Infants. Pediatrics Neonatol. 2012, 53, 228–234. [Google Scholar] [CrossRef] [Green Version]
  7. Greenberg, R.G.; Kandefer, S.; Do, B.T.; Smith, P.B.; Stoll, B.J.; Bell, E.F.; Carlo, W.A.; Laptook, A.R.; Sánchez, P.J.; Shankaran, S.; et al. Late-Onset Sepsis in Extremely Premature Infants: 2000–2011. Pediatr. Infect. Dis. J. 2017, 36, 774–779. [Google Scholar] [CrossRef] [PubMed]
  8. Ohlin, A.; Björkman, L.; Serenius, F.; Schollin, J.; Källén, K. Sepsis as a Risk Factor for Neonatal Morbidity in Extremely Preterm Infants. Acta Paediatr. Int. J. Paediatr. 2015, 104, 1070–1076. [Google Scholar] [CrossRef] [PubMed]
  9. Cohen-Wolkowiez, M.; Moran, C.; Benjamin, D.K.; Cotten, C.M.; Clark, R.H.; Benjamin, D.K.; Smith, P.B. Early and Late Onset Sepsis in Late Preterm Infants. Pediatr. Infect. Dis. J. 2009, 28, 1052–1056. [Google Scholar] [CrossRef] [Green Version]
  10. Wang, M.L.; Dorer, D.J.; Fleming, M.P.; Catlin, E.A. Clinical Outcomes of Near-Term Infants. Pediatrics 2004, 114, 372–376. [Google Scholar] [CrossRef]
  11. Tomashek, K.M.; Shapiro-Mendoza, C.K.; Davidoff, M.J.; Petrini, J.R. Differences in Mortality between Late-Preterm and Term Singleton Infants in the United States, 1995-2002. J. Pediatr. 2007, 151, 1995–2002. [Google Scholar] [CrossRef]
  12. Hornik, C.P.; Fort, P.; Clark, R.H.; Watt, K.; Benjamin, D.K.; Smith, P.B.; Manzoni, P.; Jacqz-Aigrain, E.; Kaguelidou, F.; Cohen-Wolkowiez, M. Early and Late Onset Sepsis in Very-Low-Birth-Weight Infants from a Large Group of Neonatal Intensive Care Units. Early Hum. Dev. 2012, 88, S69–S74. [Google Scholar] [CrossRef] [Green Version]
  13. Centers for Disease Control and Prevention (CDC). Perinatal group B streptococcal disease after universal screening recommendations--United States 2003–2005. MMWR. Morb. Mortal. Wkly. Rep. 2007, 56, 701–705. [Google Scholar]
  14. Centers for Disease Control and Prevention (CDC). Trends in perinatal group B streptococcal disease—United States 2000–2006. MMWR. Morb. Mortal. Wkly. Rep. 2009, 58, 109–112. [Google Scholar]
  15. Dong, Y.; Speer, C.P. Late-Onset Neonatal Sepsis: Recent Developments. Arch. Dis. Child. Fetal Neonatal Ed. 2015, 100, F257–F263. [Google Scholar] [CrossRef] [Green Version]
  16. Bizzarro, M.J.; Raskind, C.; Baltimore, R.S.; Gallagher, P.G. Seventy-Five Years of Neonatal Sepsis at Yale: 1928–2003. Pediatrics 2005, 116, 595–602. [Google Scholar] [CrossRef]
  17. Leal, Y.A.; Álvarez-Nemegyei, J.; Velázquez, J.R.; Rosado-Quiab, U.; Diego-Rodríguez, N.; Paz-Baeza, E.; Dávila-Velázquez, J. Risk Factors and Prognosis for Neonatal Sepsis in Southeastern Mexico: Analysis of a Four-Year Historic Cohort Follow-Up. BMC Pregnancy Childbirth 2012, 12, 48. [Google Scholar] [CrossRef] [Green Version]
  18. Osrin, D.; Vergnano, S.; Costello, A.; Williams, L. Serious Bacterial Infections in Newborn Infants in Developing Countries. Curr. Opin. Infect. Dis. 2004, 17, 217–224. [Google Scholar] [CrossRef]
  19. Mukhopadhyay, S.; Puopolo, K.M. Risk Assessment in Neonatal Early Onset Sepsis. Semin. Perinatol. 2012, 36, 408–415. [Google Scholar] [CrossRef] [Green Version]
  20. Simonsen, K.A.; Anderson-Berry, A.L.; Delair, S.F.; Dele Davies, H. Early-Onset Neonatal Sepsis. Clin. Microbiol. Rev. 2014, 27, 21–47. [Google Scholar] [CrossRef] [PubMed] [Green Version]
  21. Lu, L.; Li, P.; Pan, T.; Feng, X. Pathogens Responsible for Early-Onset Sepsis in Suzhou, China. Jpn. J. Infect. Dis. 2020, 73, 148–152. [Google Scholar] [CrossRef] [PubMed] [Green Version]
  22. Itoh, K.; Aihara, H.; Takada, S.; Nishino, M.; Lee, Y.; Negishi, H.; Itoh, H. Clinicopathological Differences between Early-Onset and Late-Onset Sepsis and Pneumonia in Very Low Birth Weight Infants. Fetal Pediatr. Pathol. 1990, 10, 757–768. [Google Scholar] [CrossRef] [PubMed]
  23. Iroh Tam, P.Y.; Bendel, C.M. Diagnostics for Neonatal Sepsis: Current Approaches and Future Directions. Pediatr. Res. 2017, 82, 574–583. [Google Scholar] [CrossRef] [PubMed]
  24. Wynn, J.L. Defining Neonatal Sepsis. Curr. Opin. Pediatr. 2016, 28, 135–140. [Google Scholar] [CrossRef] [Green Version]
  25. Sharma, A.; Thakur, A.; Bhardwaj, C.; Kler, N.; Garg, P.; Singh, M.; Choudhury, S. Potential Biomarkers for Diagnosing Neonatal Sepsis. Curr. Med. Res. Pract. 2020, 10, 12–17. [Google Scholar] [CrossRef]
  26. Bingol, K. Recent Advances in Targeted and Untargeted Metabolomics by NMR and MS/NMR Methods. High-Throughput 2018, 7, 9. [Google Scholar] [CrossRef] [PubMed] [Green Version]
  27. Vignoli, A.; Ghini, V.; Meoni, G.; Licari, C.; Takis, P.G.; Tenori, L.; Turano, P.; Luchinat, C. High-Throughput Metabolomics by 1D NMR. Angew. Chem.-Int. Ed. 2019, 58, 968–994. [Google Scholar] [CrossRef]
  28. Sarafidis, K.; Chatziioannou, A.C.; Thomaidou, A.; Gika, H.; Mikros, E.; Benaki, D.; Diamanti, E.; Agakidis, C.; Raikos, N.; Drossou, V.; et al. Urine Metabolomics in Neonates with Late-Onset Sepsis in a Case-Control Study. Sci. Rep. 2017, 7, 45506. [Google Scholar] [CrossRef]
  29. Mardegan, V.; Giordano, G.; Stocchero, M.; Pirillo, P.; Poloniato, G.; Donadel, E.; Salvadori, S.; Giaquinto, C.; Priante, E.; Baraldi, E. Untargeted and Targeted Metabolomic Profiling of Preterm Newborns with Earlyonset Sepsis: A Case-Control Study. Metabolites 2021, 11, 115. [Google Scholar] [CrossRef]
  30. Fanos, V.; Caboni, P.; Corsello, G.; Stronati, M.; Gazzolo, D.; Noto, A.; Lussu, M.; Dessì, A.; Giuffrè, M.; Lacerenza, S.; et al. Urinary 1H-NMR and GC-MS Metabolomics Predicts Early and Late Onset Neonatal Sepsis. Early Hum. Dev. 2014, 90, 78–83. [Google Scholar] [CrossRef]
  31. Ludwig, C.; Viant, M.R. Two-Dimensional J-Resolved NMR Spectroscopy: Review of a Key Methodology in the Metabolomics Toolbox. Phytochem. Anal. 2010, 21, 22–32. [Google Scholar] [CrossRef]
  32. Huang, Y.; Yang, Y.; Cai, S.; Chen, Z.; Zhan, H.; Li, C.; Tan, C.; Chen, Z. General Two-Dimensional Absorption-Mode J-Resolved NMR Spectroscopy. Anal. Chem. 2017, 89, 12646–12651. [Google Scholar] [CrossRef] [PubMed]
  33. Georgakopoulou, I.; Chasapi, S.A.; Bariamis, S.E.; Varvarigou, A.; Spraul, M.; Spyroulias, G.A. Metabolic Changes in Early Neonatal Life: NMR Analysis of the Neonatal Metabolic Profile to Monitor Postnatal Metabolic Adaptations. Metabolomics 2020, 16, 58. [Google Scholar] [CrossRef] [PubMed]
  34. Pang, Z.; Chong, J.; Zhou, G.; de Lima Morais, D.A.; Chang, L.; Barrette, M.; Gauthier, C.; Jacques, P.É.; Li, S.; Xia, J. MetaboAnalyst 5.0: Narrowing the Gap between Raw Spectra and Functional Insights. Nucleic Acids Res. 2021, 49, W388–W396. [Google Scholar] [CrossRef]
  35. van den Berg, R.A.; Hoefsloot, H.C.J.; Westerhuis, J.A.; Smilde, A.K.; van der Werf, M.J. Centering, Scaling, and Transformations: Improving the Biological Information Content of Metabolomics Data. BMC Genom. 2006, 7, 142. [Google Scholar] [CrossRef] [Green Version]
  36. Gaude, E.; Chignola, F.; Spiliotopoulos, D.; Spitaleri, A.; Ghitti, M.; Garcìa-Manteiga, J.M.; Mari, S.; Giovanna, M. muma, an R package for metabolomics univariate and multivariate statistical analysis. Curr. Metab. 2013, 1.2, 180–189. [Google Scholar] [CrossRef]
  37. Tripathi, N.; Cotten, C.M.; Smith, P.B. Antibiotic Use and Misuse in the Neonatal Intensive Care Unit. Clin. Perinatol. 2012, 39, 61–68. [Google Scholar] [CrossRef] [PubMed] [Green Version]
  38. Patton, L.; Li, N.; Garrett, T.J.; Ruoss, J.L.; Russell, J.T.; de la Cruz, D.; Bazacliu, C.; Polin, R.A.; Triplett, E.W.; Neu, J. Antibiotics Effects on the Fecal Metabolome in Preterm Infants. Metabolites 2020, 10, 331. [Google Scholar] [CrossRef] [PubMed]
Figure 1. Multivariate analysis of NMR data belonging to neonates diagnosed with EOS (pink circles) and healthy neonates without need for NICU hospitalization (blue circles). (a) PLS-DA scores plot of the EOS and healthy non-NICU preterms. (b) VIP scores and metabolites related to buckets with different concentration among the two groups. (c) Box plots of normalized concentration for the discriminant metabolites.
Applsci 12 01932 g001aApplsci 12 01932 g001b
Figure 2. Spectral regions of unassigned chemical shifts mostly present on 1H NMR spectra of NICU samples (blue spectrum) and healthy non-NICU preterms (black spectrum).
Applsci 12 01932 g002
Figure 3. Multivariate analysis of NMR data belonging to neonates diagnosed with EOS (orange circles) and neonates hospitalized in NICU without EOS (purple circles). (a) PLS-DA scores plot of the EOS and control group. (b) VIP scores and metabolites related to buckets with different concentration among the two groups.
Applsci 12 01932 g003
Figure 4. Multivariate analysis of NMR data belonging to urine samples of neonates diagnosed with EOS the first (green circles) and the third day (blue circles) of their life. (a) PLS-DA scores plot of the first- and third-day’s samples. (b) VIP scores and metabolites related to buckets with different concentration among the two groups. (c) Box plots of normalized concentration for the discriminant metabolites.
Applsci 12 01932 g004
Figure 5. Multivariate analysis of NMR data belonging to neonates diagnosed with LOS (pink circles) and control neonates without need for hospitalization (blue circles). (a) PLS-DA scores plot of the LOS and healthy non-NICU preterms without need for hospitalization. (b) VIP scores and metabolites related to buckets with different concentration among the two groups. (c) Box plots of normalized concentration for the discriminant metabolites.
Applsci 12 01932 g005
Figure 6. Multivariate analysis of NMR data belonging to neonates diagnosed with LOS (orange circles) and control neonates of NICU (blue circles). (a) PLS-DA scores plot of the LOS and control. (b) VIP scores and metabolites related to buckets with different concentration among the two groups.
Applsci 12 01932 g006
Figure 7. Multivariate analysis of NMR data belonging to urine samples of neonates diagnosed with EOS (red circles) and neonates with LOS (green circles). (a) PLS-DA scores plot of EOS and LOS samples. (b) VIP scores and metabolites related to buckets with different concentration among the two groups. (c) Box plots of normalized concentration for the discriminant metabolites.
Applsci 12 01932 g007
Figure 8. Graphically representation of the pathway analysis. Each cycle represents a metabolic pathway, while the color and the size are based on p-value and pathway impact, respectively. (a) Pathway analysis of EOS group significant metabolites. (b) Pathway analysis of LOS significant metabolites.
Applsci 12 01932 g008
Table 1. Clinical characteristics and laboratory findings for septic and control neonates. Median and (minimum–maximum) values of the GA, BW, Apgar Score for the first and tenth minute of life, the number (percentage) of the male sex, the delivery mode (cesarian section), the small for gestational age (SGA) infants, the newborns with premature rupture of membranes (>18 h), treatment with mechanical ventilation and/or antibiotics, blood culture positive (Gram-positive, Gram-negative and fungi) and c reactive protein (CRP).
Group A
EOS
(n = 23)
Group B
LOS
(n = 11)
Group C
Control NICU
(n = 14)
Group D
Control Non NICU
(n = 23)
Male sex (n, %)8 (35)5 (45)9 (64)18 (75)
GA (weeks)34 (26–36)34 (25–36)35 (31–36)36 (35–36)
BW (gr)2150 (770–4060)1820 (690–2900)2085 (1630–3540)2740 (2100–3700)
Small for GA (n, %)5 (22)4 (36)2 (14)0(0)
Cesarian Section (n, %)8 (73)8 (73)11 (79)13 (57)
Apgar Score 1st min8 (3–9)8 (3–9)8 (7–9)9 (5–9)
Apgar Score 10th min9 (8–10)9 (8–10)9.5 (8–10)9 (7–10)
Antibiotics (n, %)23 (100)11 (100)1 (7)11 (48)
Premature Rupture of Membranes >18 h (n, %)1 (4.3)0 (0)3 (21.4)0 (0)
Mechanical Ventilation (n, %)17 (71)7 (64)4 (14)0 (0)
NutritionNoNoNoBreast milk
Laboratory findings
B.C negative, CRP positive findings (n, %)17 (74)5 (45)0 (0)0 (0)
B.C positive, gram (+) (n, %)4 (17)5 (45)0 (0)0 (0)
B.C positive, gram (−) (n, %)1 (4)1 (10)0 (0)0 (0)
B.C positive,
Fungi (n, %)
1 (4)0 (0)0 (0)0 (0)
Table 2. Statistically significant metabolites and their p-value for EOS and LOS groups.
Metabolitesp-ValueSeptic Group
EOS versus
healthy non NICU preterms
Taurine0.004
Gluconate8 × 10−5
Lactose1 × 10−4
Hippurate7 × 10−5
LOS versus
healthy non NICU preterms
Gluconate0.0007
Lactose0.01
Betaine0.006
N, N-Dimethylglycine0.005
Hippurate0.03
Publisher’s Note: MDPI stays neutral with regard to jurisdictional claims in published maps and institutional affiliations.

