1. Introduction
Biosignals have played an important role in the diagnosis and treatment of diseases, and they have also played a key role in preventing further severe diseases. In practical fields, wearable devices have recently been developed to diagnose cardiac fibrillation or other diseases using biosignals acquired from the human body using specific types of sensors [
1]. In general, biosignals are categorized into four groups: heart rate, blood pressure, body temperature, and breathing rate. From among the four aforementioned signals, respiratory signal has gained less attention than the others. Representative biosignals are divided into two types [
2]: Electrical signals generated by the human body and can be measured with an electrocardiogram (ECG), which includes the electrical activity of the heart; an electroencephalogram (EEG), which is based on the brain; and an electromyogram (EMG), based on nerves and muscles. There are also non-electrical signals in the body, which include blood flow (hematocele), temperature, and respiration rate. Among these, the respiratory status is an important factor that can represent the status of respiratory organs or related ones. It also plays an important role in carbon dioxide emission and energy generation. Respiration is divided into two phases: internal and external respiration. Internal respiration is an interaction inside the body, and external respiration occurs between the body and the external environment. There are internal respiration processes in which oxygen transfer takes place in cells through interactions within the body and the production of carbon dioxide occurs, and there are external respiration processes in which oxygen is obtained and carbon dioxide is released through interactions between the environments inside and outside the human body. Apnea causes ventilatory disorders resulting from changes in the amount of ventilation in the alveoli and airways, and it is accompanied by chronic alveolar hypoventilation, hypertension, and cardiac arrhythmias. It also increases the long-term mortality rate of patients. In fact, patients with apnea have twice the risk of developing hypertension compared to those with normal respiration activities [
3].
There are two main approaches to biosignal acquisition: a contact-based method and a contactless (or non-contact)-based method. Contact-based methods usually employ a device that is attached to the human body, located near a respiratory organ. The contact-based method acquires respiratory signals using a device that measures human respiration with high quality (because the noise is removed or reduced with signal processing techniques) compared to the non-contact based method. The latest technology uses smart steering wheel, smart seat belt, and equipment that acquire electrical signals such as EEG analysis [
4]. Although the contact-based methods acquire biosignals with low noise, it is sometimes not suitable for patients such as children, the disabled, or severely damaged persons because it can be difficult to attach a device for respiration acquisition and to monitor respiratory states in a continuous and real-time manner. Contrary to the contact-based methods, non-contact-based methods can be an alternative to the contact-based ones and have advantages in monitoring respiratory states in a continuous and real-time manner in addition to its simplicity and ease of use in the acquisition of measurements. Research on human behavior and health status through biosignals and the use of non-contact-based methods employing the technologies of computer vision, image processing, and signal processing is being extensively performed [
5,
6]. The non-contact-based method is easy and simple to use, and measuring devices have become accurate and low-cost compared to those used for the contact-based method. However, the non-contact-based method is still considered less accurate and less stable in practical fields. Eye tracking using a Charge Coupled Device (CCD) video camera, image processing to determine drowsiness using face direction and eyelid movement, and visualization and analysis of audio signal characteristics using MFCC (Mel-Frequency Cepstral Coefficient) based on signal processing techniques have been proposed [
7]. Feature visualization is used for the classification of speech signals and vibration analysis. Existing apnea diagnosis studies analyze characteristics by decomposing data with continuous values into frequency components in the time domain [
8]. On the other hand, the feature visualization method visualizes regional features in the time domain by periodically dividing the data in it. Compared with the time and frequency domains, which express the features in one dimension, it is possible to analyze the local features in two dimensions [
9,
10]. Radar acquires data with relatively low noise in environments of low-light conditions, in rainy and cloudy circumstances, or other conditions which usual image sensors suffer from. Radar applies to diverse fields such as defense, medicine, vehicle, surveillance, etc., and it achieves a high precision in distance measurement [
11]. Even though respiratory status is important, it has gained less attention compared to other biosignals. Research on the diagnosis of apnea using ECG-based electrical signals acquired by PSG (Polysomnography) that can provide various information about human biosignals has long been of interest in the research and industrial fields. As deep learning algorithms have shown significant improvements in detection, recognition, and classification in the areas of signal processing, image processing, etc., recent studies on the detection of the apnea status of humans based on a neural network model—e.g., long short-term memory and deep neural network—have been performed [
12,
13]. Existing work has focused on the classification of respiratory signals in the frequency domain, and recently, a learning-based classification using an artificial neural network has been proposed [
14]. In this paper, we present a learning-based respiration state classification algorithm using a feature visualization method that visualizes and classifies frequency changes in respiratory data.
This paper classifies the respiration states using a feature visualization method and an artificial neural network model. Respiratory signal is acquired by UWB radar sensor, and the signal is transformed into the frequency domain. In the Fourier domain, the signal that is defined in one-dimensional (1D) space is transformed into 2D space using a spectogram. Analyzing biosignals in the image domain has been introduced in a recent work. In the work by Modak et al. [
15], the EEG signal is represented in the time-frequency domain using a cross wavelet transform followed by the convolutional neural network (CNN)-based feature extraction and classification of EEG signals. EEG is a popularly used tool that provides assistance in the detection of epileptic seizures by analyzing EEG signals [
16]. In the work by Naz et al. [
17], a new deep learning approach has been proposed to predict ventricular tachyarrhythmia (VTA) using ECG signals that are converted into binary images. Deviating from the existing research method using electrical biosignals, non-electrical biosignals are acquired using an Ultra Wide Band (UWB) radar sensor. The aim of this study is to propose a learning-based respiration status classification algorithm using a feature visualization method that classifies respiration conditions, particularly detecting abnormal respiration such as in apnea. The rest of the paper is organized as follows.
Section 2 describes the necessity of this study and related work on the detection of abnormal respiration. In addition, the difference between the biosignals obtained via the contact method and the non-contact method is explained. This section presents the accuracy according to the data set and classifier used in the previous study. In addition, the method and type of feature visualization used in mechanical engineering and speech and acoustics are presented.
Section 3 presents the algorithm used in the proposed method. We present the structure of a convolutional neural network (CNN) and the hyperparameters used for the feature visualization of respiration states using signal processing techniques and image classification.
Section 4 presents the experimental environment and the results of the algorithm verification. The equipment for acquiring the respiratory state, the measured environment, and the measurement object are described, and so is the respiratory state data set used in the experiment. The experimental results verify the algorithm presented in this paper by comparing the results of the proposed method with the methods presented in previous studies. Finally, in
Section 5, the conclusion of this paper and future research plans are presented.
2. Related Research
The diagnosis of apnea using biosignals has been actively carried out in the pastdecades [
18,
19,
20]. It is divided into a method of diagnosing apnea using electrical biosignals obtained through PSG and a method of diagnosing apnea using ECG obtained via PSG. A scalogram-based convolutional neural network was introduced to detect sleep apnea using single-lead ECG signals [
21]. In the work by Shen et al. [
13], the detection of sleep apnea employs a multiscale, dilated-attention, one-dimensional convolutional neural network and a weighted-loss time-dependent classification model. It reports that the combination of the weighted cross-entropy loss function and the hidden Markov model alleviated the problem of data imbalance. Furthermore, it improved the classification accuracy. PSG is a data acquisition method used for apnea diagnosis with electrical biosignals such as EEG, ECG, eye movement, and muscle movement. Usually, one needs more than a day in the laboratory to acquire vital signals. The obtained electrical biosignals are directly attached to the body to obtain low-noise data. PSG, a biosignal acquisition method designed for apnea diagnosis, has been actively studied in the past [
22]. Although low-noise data are obtained by the method of acquiring electrical biosignals, there are restrictions on its use such as the cost of maintaining the experimental space and equipment and the time required for accurate diagnosis of more than one day. To alleviate this problem, ECG-based apnea diagnosis is being actively studied. ECG is one of the electrical biosignals obtained from PSG and refers to the electrical biosignals obtained from the heart. ECG is one of the means of diagnosing physical abnormalities such as arrhythmia, cardiac arrest, and apnea by analyzing the pattern of the heartbeat. ECG has partially relieved the limitations of PSG and enabled real-time diagnosis [
23]. The method using ECG verified with similar accuracy compared to the method using various electrical biosignals acquired with PSG, and the cost and time constraints of the existing method were relaxed [
24]. A flowchart that describes existing research about the detection of abnormal respiration states (e.g., apnea) is shown in
Figure 1.
Studies on ECG-based apnea diagnosis only classify ECG from values measured in PSG or use a data set provided by the National Institutes of Health (NIH) [
25,
26]. Improvements such as optimizing the hyperparameters of the classifier are actively improving the performance of apnea diagnosis. Logistic regression (LR) was used to discriminate against apnea [
27]. Logistic regression is used for regression and classification problems in the areas of image processing, pattern recognition, computer vision, etc. Although the learning speed and prediction are fast, it is difficult to interpret the weights by multiplying them.
is the input signal,
B is the regression coefficient, and
is the error term. A quadratic discriminant analysis (QDA) was used to detect the resting state of respiration [
28,
29]. You can set the variance matrix for each class that you need to classify, but it requires a lot of data. A decision boundary between classes is constructed, with the mean value corresponding to the
class
and the variance matrix
. The
k-nearest neighbor algorithm (k-NN: k-Nearest Neighbor) is a method of classifying data using
k classes located in adjacent locations. In this case, there are two methods of estimating the distance: Euclidean distance and Manhattan distance. There is no restriction on the distribution of data, but it requires a lot of data. Bidirectional Long Short-Term Memory (Bi-LSTM) solves the unidirectional limitation of the existing Long Short-Term Memory (LSTM) with a reverse LSTM layer. Shouldice et al. showed an accuracy of 84% with the quadratic discriminant function method [
28]. Mendez et al. showed 88% accuracy using the k-nearest neighbor algorithm and the artificial neural network [
29]. Recently, Bi-LSTM showed an accuracy of 82% using the data set provided by NIH [
26]. This has also been shown from related studies using various classifiers such as SVM, LDA, TVAM, and ELM [
30,
31,
32,
33,
34]. In the time domain, every waveform is actually a sum of sinusoids. Existing studies analyze the singularity by decomposing the global time for the feature into the frequency domain. When the length of the signal feature is long, a singularity that occurs with a low frequency in a local area may not appear in the results of analyzing the singularity for the entire signal. In mechanical engineering and acoustics, data characteristics are divided into local units and analyzed, and features appearing in the region are predicted and diagnosed. A spectrogram decomposes singularities by dividing the time domain into regions. The
x-axis is the time domain and the
y-axis is the frequency domain that visualize the characteristics of the data. In mechanical engineering, it has been used for predicting and diagnosing engine failures and failures of vehicle parts [
35]. In the Mel spectrogram, the
x-axis is the frequency domain and the
y-axis is the amplitude domain, and it is used in acoustics and phonetics such as in speech and sound recognition, detection, and classification. Human emotions were predicted and diagnosed through voice [
36]. In the past, MFCC was used to analyze voice and acoustic signals. However, Mel spectrogram is used to achieve an improved computational processing power compared to the conventional spectrogram of recent computer systems. In this paper, the spectrogram is used to process the signal for the rate of change of the human thorax. The flowchart for visualization and analysis of input data is shown in
Figure 2. The input data are characterized as a two-dimensional value on the
x-axis and
y-axis using data visualization tools such as the spectrogram and the Mel spectrogram.
Alternative to the methods explained above, contactless-based methods have been of interest for the measurement of respiratory states since contact-based methods have limitations in that long-term and continuous monitoring is sometimes difficult because devices that measure respiration need to be attached to respiratory organs. Severely injured persons, children, or other people suffer from or have difficulties in the attachment of a sensing device to their body. Unless patients are not comfortable with attaching a sensing device to the body, an accurate measurement of respiration may be difficult. Recently, the Coronavirus disease 19 (COVID 19) has inspired a necessity for the measurement of respiratory states, and the early detection and isolation of potential patients has been one of the most important factors that could reduce the severity of the disease. In addition, due to the limited number of hospital wards, contactless-based methods of respiratory measurement have gained a lot of attention in the areas of medicine and medical engineering. In contactless methods, ultra-wideband (UWB) radar is widely used because of its simplicity, and it enables us to monitor respiratory states in a long-term and continuous manner. However, another recent work has shown a deep learning model using an IR-UWB radar to propose a real-time apnea-hypopnea (AH) event detection [
37]. The UWB radar shows robustness against factors in the external environment such as the existence of dust, temperature changes, etc. When using UWB radar sensors for respiration measurement, patients (or persons who need measurements to be taken) do not have inconveniences in attaching the device. The UWB radar sensor provides a high signal-to-noise ratio and accuracy of measurement [
38]. If the reflected signal is not pre-processed, various types of filters such as the Kalman filter, bandpass filter, median filter, etc., are employed to enhance the quality of the signals.
3. Proposed Method
The proposed method visualizes the signal of the respiration state obtained from the UWB radar in both the time and the frequency domains and classifies the respiration state using an artificial neural network. The overall flow chart for apnea detection and respiration classification based on a convolutional neural network considering the visualization of respiration consists of three steps, as shown in
Figure 3.
First, a visualized data set is created based on the time domain and the frequency domain through the segmentation, overlap, and frequency analysis of the respiration state signal input in the pre-processing process. Through the frequency analysis of the divided time domain, it is possible to extract features that consider both the local and global features of the respiration signal and visualize it. Second, in the parameter estimation step, learning is performed based on a training set. Finally, in the last step, the respiration state is classified as a validation set in the state estimation step. The classifier uses a CNN suitable for image classification. In the proposed method, we present the difference between the method of system transformation of the entire feature presented by previous studies and the method of feature visualization presented in this paper. The visualization of the respiratory state periodically represents the frequency change in the input respiratory state signal. The respiratory conditions used were normal breathing, apnea, and normal breathing during a speaking activity. The actual image that visualizes the characteristics of the respiration state acquired by the radar sensor for 60 s is shown in
Figure 4. The difference in the visualization image can be confirmed according to the characteristics of the respiration state. The feature visualization method used a spectrogram. As shown in
Figure 4, the color red represents a high level of signal power, and the color blue stands for a low level of signal power. Thus, the spectrogram shows the distribution of signal power of different frequencies.
If the amount of variation in the respiratory signal is small (or no variation), it means that the signal has a low-frequency value or it is close to 0, and it is determined as apnea. Normal respiration, a visualization model with relatively high-frequency values, is shown in
Figure 4a. In the case of the existence of apnea, a spectrogram is shown in
Figure 4b. In
Figure 4c, the low-frequency values are distributed as similar in the case of normal respiration. The visualized respiration states show a difference in the frequency domain and a pattern of change with time when apnea occurs. For this manner of apnea detection, it is important to change the frequency value over time and not to conduct just a simple frequency analysis. The proposed method constructs a learning-based classifier using a visualization method that considers the regional characteristics of the respiration status and classifies apnea detection and respiration status.
Section 3 describes the process in detail, from feature visualization to respiration state classification. A Fourier transform (FT) decomposes an input signal into a sum of sine waves. It is a technique actively used to analyze specific signals in signal and image processing as well as communication fields. The frequency domain Fourier transforms the respiration state for the input time domain into an input value in the frequency domain. The proposed method uses a fast Fourier transform that reduces the number of operations based on the Fourier transform. The fast Fourier transform equation used in the input signal of the respiration state is as follows (
1):
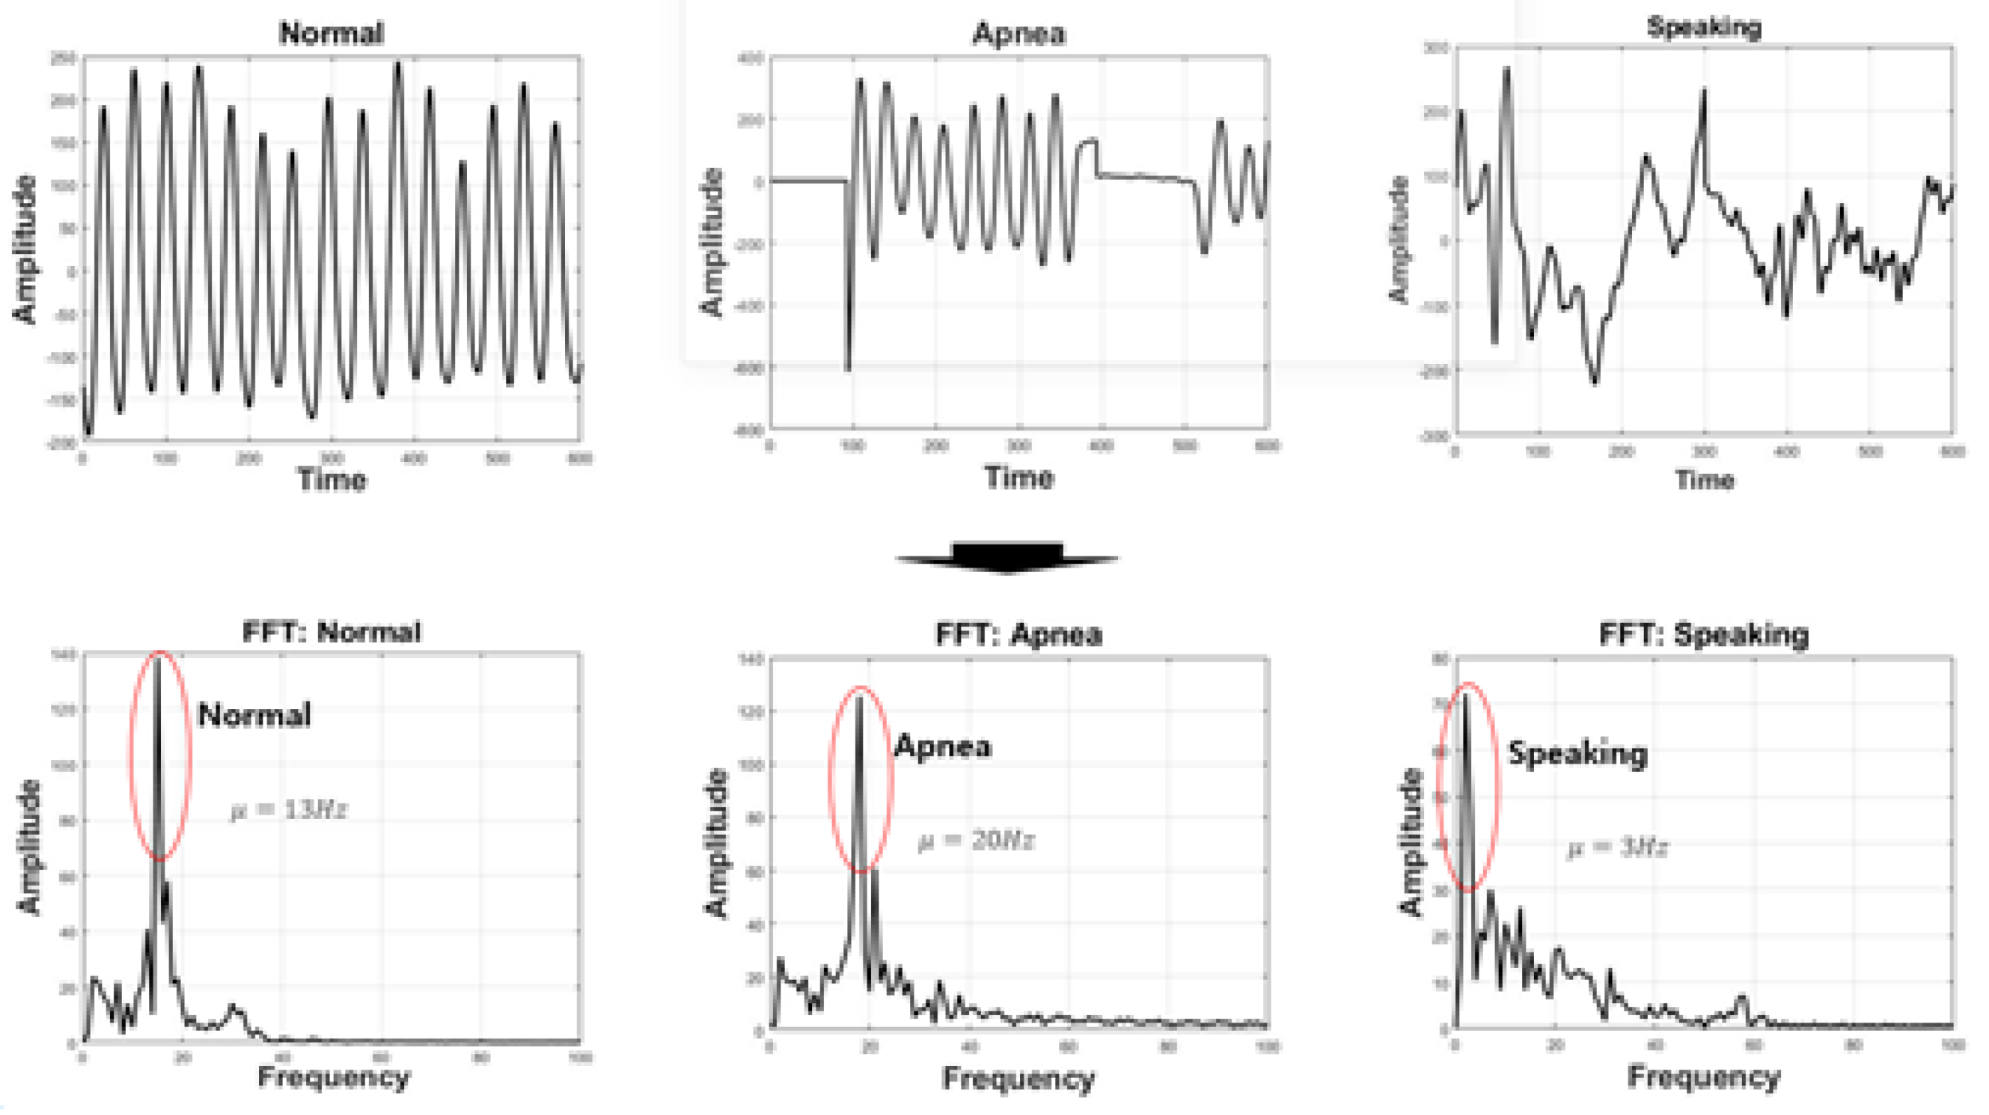
The respiration signals in the time domain used in the experiments are also represented in the frequency domain using the fast Fourier transform. As shown in
Figure 5, normal respiration has a peak value of around 13 Hz, apnea has a peak of around 20 Hz, and speaking respiration has a peak of around 3 Hz.
is the average frequency of respiration states in the frequency domain.
A series of processes, from inputting the respiration state to the visualization of the frequency change, using the fast Fourier transform is shown in
Figure 6. First, the input respiration state divides the entire signal into regions using the window function. In addition, a region adjacent to the window divided by an overlap is used overlappingly, and the frequency is transformed by fast Fourier transform. In contrast, the
x-axis visualizes the signal of the respiration state as a time domain and the
y-axis as a frequency value.
The window function divides the input data into units of a specified length and divides the signal. When the start and end values of the divided signal are not 0, signal discontinuity occurs. The Hamming window minimizes the discontinuity for each window in order to reduce frequency distortion. Equation (
2) is the Hamming window equation.
N is the number of input data, and in the case of the present work, it is 60 (respiration signal is sampled with 1 Hz, 60 samples per 1 min).
The overlap uses adjacent data utilized in the previous time window as the starting value for the current window. The input signal is divided into divided windows, and the discontinuity between the generated windows is minimized. In Equation (
3),
L is the length of the window used (
), and
p (here,
) is the percentage of adjacent data to be used. A number for overlapped data is written by:
Visualized feature values are generated in
RGB format. The respiration state is visualized with a spectrogram, which is one of the visualization methods. The
x-axis represents the time domain, and the
y-axis represents the frequency domain, indicating the frequency domain of the respiration state according to the time domain. The spectrograms for normal, apnea, and speaking, which represent respiration for each input situation, are explained in
Figure 4.
The CNN analyzes and classifies visual images by applying filtering techniques to artificial neural networks. It consists of an input layer, a convolution block, a fully connected (FC) layer, and a softmax layer, as shown in
Figure 7.
The input image data generate a feature map through convolution block, filter, stride, and padding processes, and the output value of the neural network is used with the activation function. The channel for the input image is determined by the input layer, and the filter extracts the features of the input data to generate a feature map. The convolution block consists of convolution, batch normalization, activation function, and max pooling. Convolution is an operator that finds a new function with two functions. In fact, in the convolutional neural network, the operation of the filter inversion process is omitted by cross-correlation. The convolution operation shows a loss in the size of the feature map. Padding fills the edges of the input matrix with specific values and prevents the loss of the feature map size caused by the convolution operation. In the proposed method, a zero-padding, which fills the value with “0”, is applied. The batch normalization of artificial neural network models is the process of normalizing input values with the mean and variance of the data in the classifier learning process. It is used in convolutional or post-FC steps, and it speeds up learning by reducing additional tasks such as a dropout to prevent overfitting and the determination of initial weights according to data distribution. The difference in learning accuracy according to batch normalization is shown in
Figure 8. It can be seen that the convolutional neural network to which batch normalization was applied is 10% more accurate than the convolutional neural network to which it was not applied.
Equation (
4) is the input data normalized to the mean of the data
, the standard deviation
, the number of data m, the mean 0 and the variance 1, the scale factor
, the shift factor
, and prevents the value from being “0”
; the output value of batch normalization
is represented by the following equation:
The Sigmoid function, Step function, Rectified Linear Unit function (ReLU), and Hyperbolic Tangent function are activation functions used in artificial neural networks. In the proposed method, ReLU, in which the input value is output as a threshold value through a function, and Softmax, suitable for classification, are used as the activation functions. The ReLU function solves the problem of the sigmoid function that occurs in deep learning using deep layers. In deep learning, the sigmoid function has a vanishing gradient problem in which the output value converges to “0”. The step function and the sigmoid function have the problem of gradient extinction converging to “0” in deep neural networks. Although we used a hyperbolic tangent function whose output value is in the range of [−1, 1] and the center of the output value is “0”, the problem of gradient disappearance still exists. In the proposed method, ReLU is used as an activation function. Values for positive integers and “0” are maintained, and negative integers are treated as “0”. This is used to solve the gradient annihilation problem. Although a leaky ReLU function such as Equation (
5) and an Exponential ReLU (Exponential ReLU) function such as Equation (
6) have been developed considering even negative values, in this proposed method, the existing ReLU function is used and the number of layers, the Hyperparameter optimization of artificial neural networks such as learning rate and activation comparison, proceeds as a future study. Max pooling extracts the value with the largest feature from the generated feature map and alleviates the overfitting problem by reducing the number of features used for learning.
4. Experiment
In this paper, respiration states are classified by visualizing the respiration conditions acquired through the UWB radar.
Table 1 shows the experimental environment, the central processing unit (CPU), the random access memory (RAM), and the graphic card of the device used for the experiment.
Table 2 presents specific information about the UWB radar used in the experiments.
A total of 10 adults participated in the experiments (9 males, 25–28 years old; 1 female, 35 years old). Every person generated both normal and abnormal respiration, and each respiration was generated for 60 s. Computation time was 5 min for training and 2 min for testing. The radar sensor that acquired the respiratory signal was about 30 cm far from the person who generated the respiration signal. Prior to conducting the experiments, all of the participants determined the type of respiration, normal, abnormal (apnea signal is emulated by the pausing of respiratory activity for a few seconds). The visualized respiration data set is used as training data for the classifier in the parameter estimation step. The data set is divided into a training set and a validation set. The training set uses 70% of the entire data set to train the classifier. The validation data set is used to evaluate the performance of the trained classifier.
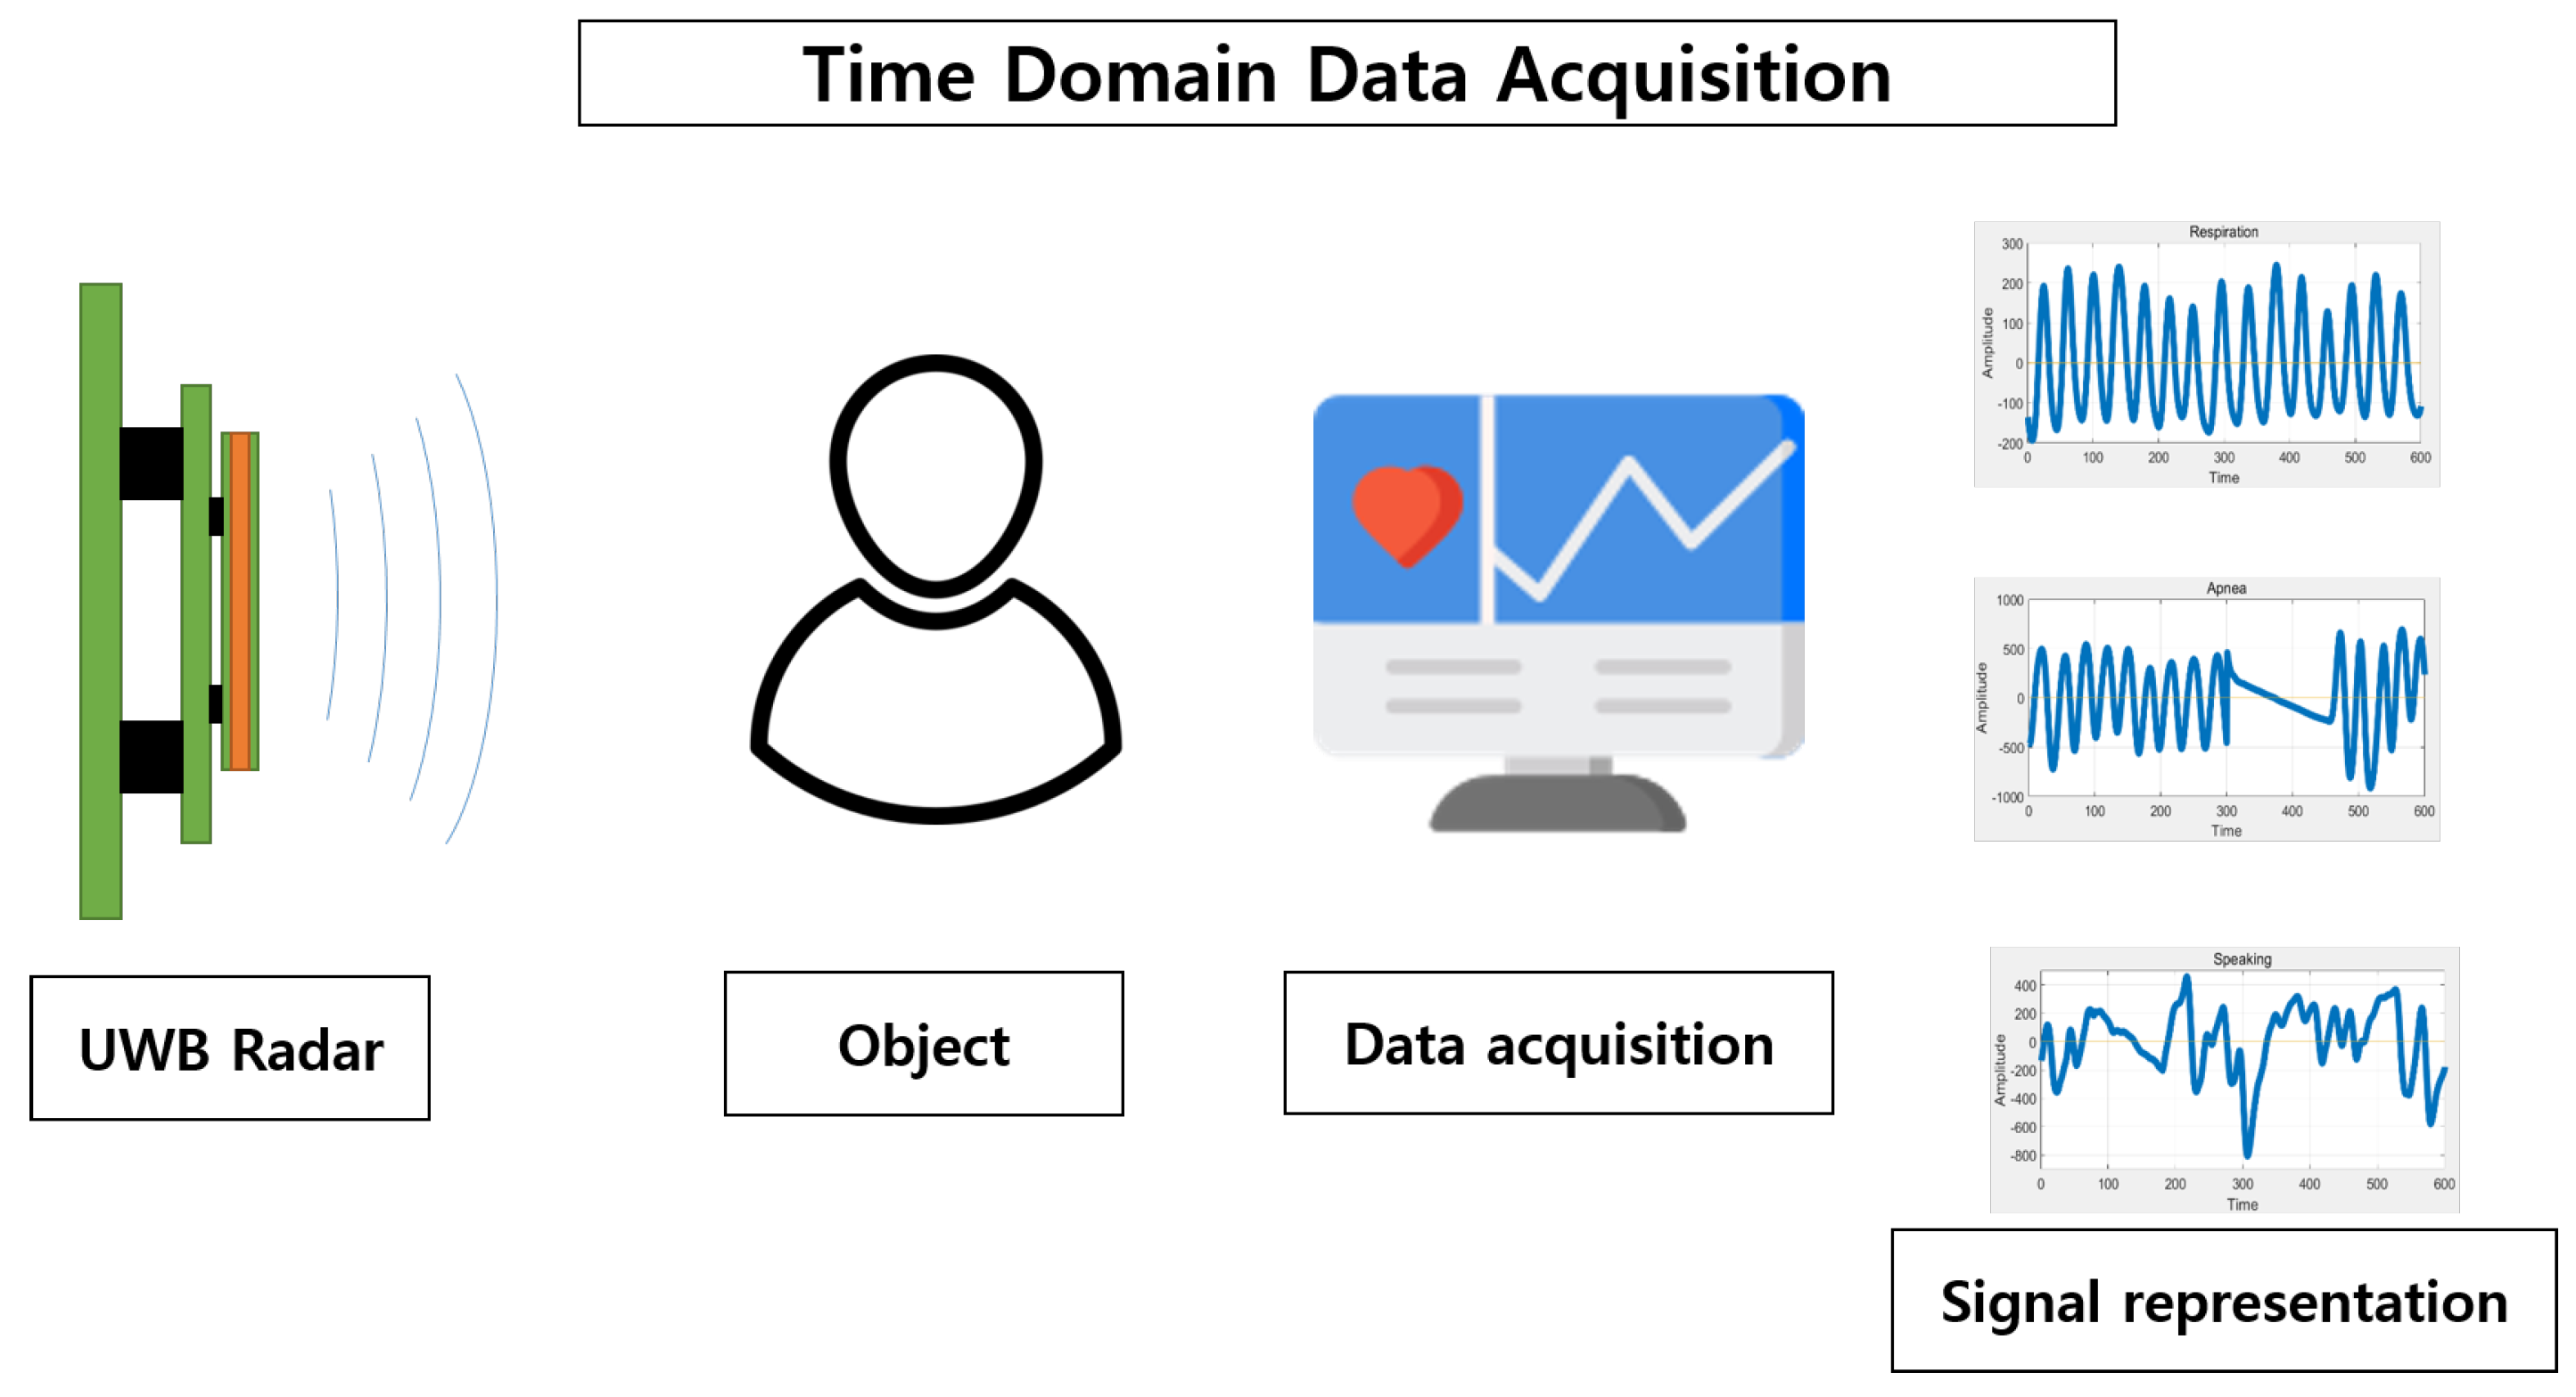
Figure 9 shows the time domain data acquisition process for the rate of change of the rib cage using the UWB radar.
The UWB radar can measure distance and position using pulse signals close to nano or picoseconds. In this paper, the rate of change in the rib cage caused by the contraction and relaxation of the diaphragm and the external intercostal muscles is acquired as a signal of the respiration state. The rate of change of the chest refers to the distance between the radar and the chest. The signal used in the experiment is the time series data obtained with a sampling frequency of 10 Hz for a 60,000 ms section of the rate of change of the chest. There are three types of signals acquired: normal breathing, apnea, and normal breathing during a speaking activity. In medical institutions and domestic and foreign research fields, a case in which breathing does not occur for more than 10 s is estimated as apnea [
40,
41,
42,
43,
44]. The total number of data sets used for training is 3000, which include normal breathing (1000), normal breathing with speaking activity (1000), and apnea (1000). For accuracy verification, training data and verification data are divided at a 7:3 ratio, and 2100 training data and 900 verification data are used.
Data input in size is trained with hyperparameters specified for each layer. The structure of the convolutional neural network uses three convolution blocks, as shown in
Figure 10, and the hyperparameters of each layer are shown in
Table 3. The number of filters used in the neural network layer is
K, the filter size is
M, the pooling size is
, Stripe is
S, and the activation function is
K. The activation function in the convolutional layer is the ReLU function, and the soft max function is used in the output layer for respiration state classification. Dropout was not applied by adding a batch normalization layer. Batch size is 128 and the stochastic gradient descent with momentum(SGDM) optimizer is used for optimization.
Table 4 presents the proposed method and the results of existing studies. We use a convolutional neural network to classify visualized respiratory states. As an artificial neural network model of a filtering technique, it is more suitable for image classification than LSTM and RNN. True positive (TP) is when the classifier predicts an actual positive value as positive, and true negative (TN: true negative) is when the classifier predicts an actual negative value as negative. False positive (FP) is when the classifier classifies an actual negative case as positive, and false negative (FN: false negative) refers to a case where the classifier classifies an actual positive case as negative. Precision is the percentage of positive values predicted by the classifier. Recall refers to the percentage of actual positives predicted by the classifier to be positive. Specificity indicates the percentage of false values classified as false by the classifier. Accuracy refers to the ratio that the classifier predicts a true value as true and a false value as false. The F1 Score is an index that considers precision and recall using a harmonic mean.
Previously proposed algorithms have diagnosed apnea based on ECG, which relieve the constraints of PSG-based biosignals such as the high cost of equipment and the space and time constraints of the experiments. In this study, the respiratory state is classified using the non-electrical biosignal, the respiratory state. The proposed method cannot be simply compared with the existing methods. Existing studies have used ECG, which is an electrical biosignal, and mainly focus on the accuracy of counting the number of respirations or the detection of apnea. On the other hand, this study focuses on the classification of the state of respiration. Because the experimental environment and the data set used in the previous studies are different, the performance of the classifier is compared with the accuracy. The proposed method showed similar accuracy with that used by Raymond et al., with a difference of 1% [
45].
Apnea diagnosis and respiration status classification using non-electrical biosignals were previously conducted using logistic regression.
Table 5 presents the difference in accuracy between previous studies and the proposed method. Based on the visualization data set, the accuracy using the artificial neural network was improved by 27% as compared to the classifier based on the existing time domain.
5. Conclusions and Future Work
In this paper, we proposed a method of classifying the respiratory state using an artificial neural network by acquiring the respiratory state signal through a non-contact method with the use of a UWB radar. The convolutional neural network classified three respiratory states into normal breathing, apnea, and normal breathing during a speaking activity. In the feature visualization method, data with a vector length of 600 obtained in the time domain is transformed into the frequency domain by dividing the data into 60 ms periods. A data set in which the time domain and the frequency domain were visualized was used as input data for the convolutional neural network. The convolutional block consisted of three outputs, and the respiration state was classified through the softmax activation function. The proposed method showed an accuracy performance similar to that of the data set using the existing electrical signal with an accuracy of 80%, and improved the accuracy by 27% in the non-contact method-based data set that acquired the respiratory state with the UWB radar. The proposed method classified the human respiratory state signal according to the situation, without the attachment of the measuring sensor to the human body. The UWB radar sensor showed high measurement accuracy, but if there existed barriers between human body and the sensor, the accuracy could be degraded. We proposed a method of classifying respiratory states along with apnea diagnosis by using a feature visualization method that alleviated the constraints on the body, which change according to the body, as well as the constraints on the space of the experimental environment that previous studies had and the need to acquire body signals for half a day. The respiration state classifier using non-electrical biosignals was put alongside the comparison of the accuracy results with the apnea diagnosis algorithm using the existing electrical biosignals. Experiments were performed using CNNs with a basic neural network structure. Future work is aimed at improving the accuracy of classifying respiratory states by optimizing hyperparameters such as the learning rate, the hierarchical structure of the artificial neural network, and the optimizer. In addition, as a future study, we plan to acquire and classify changes in respiratory status, from emotions such as fear and anxiety to mental disorders such as panic disorder, including the classification of respiratory states for normal breathing, apnea, and normal breathing during a speaking activity.


