
Dist-YOLO: Fast Object Detection with Distance Estimation


Abstract
:1. Introduction
1.1. Related Work
1.2. The Motivation and Our Idea in Brief
- 1.
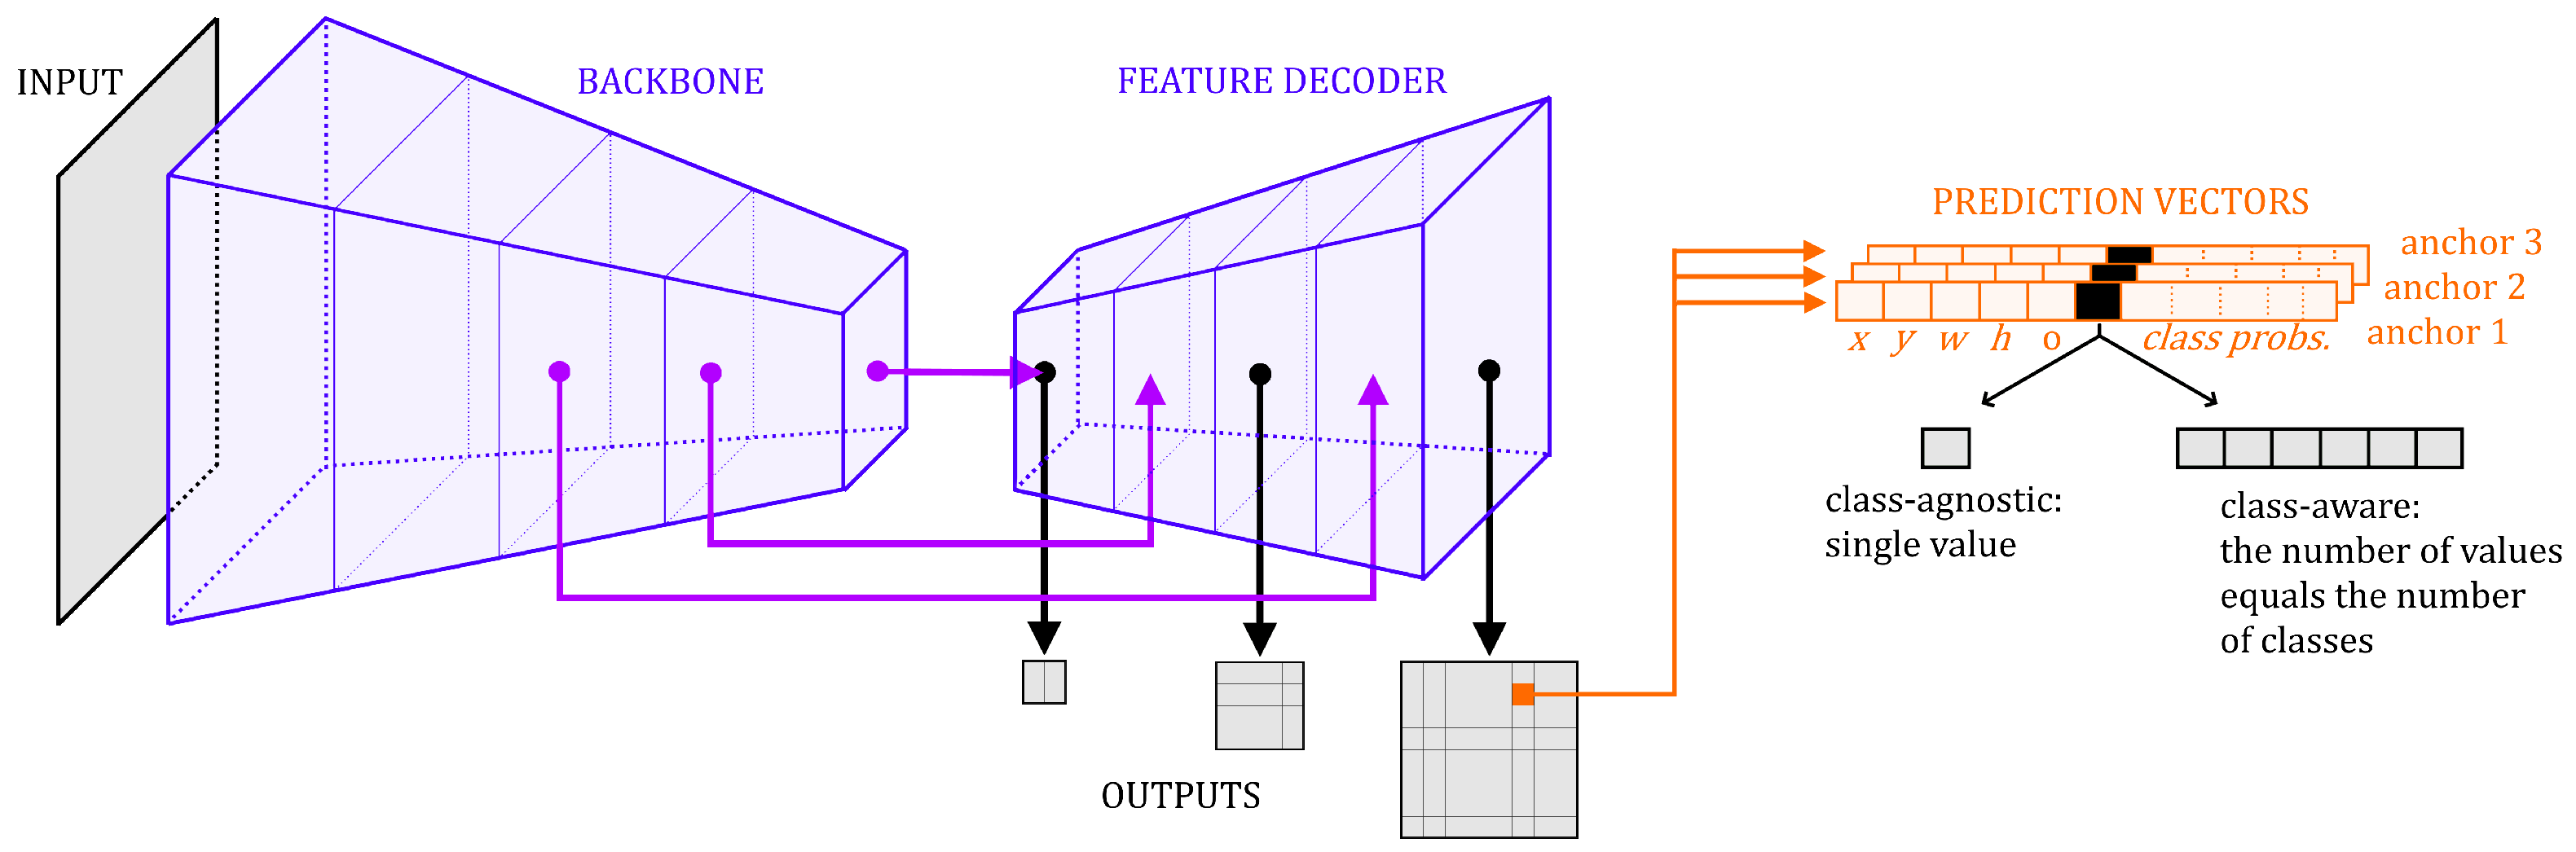
- We define a novel architecture, Dist-YOLO, where prediction vectors produced by heads are extended by information about distance and coupled with a proper distance loss function.
- 2.
- We show that Dist-YOLO detects bounding boxes more accurately than the original YOLO while having the same backbone’s capacity.
- 3.
- We demonstrate that a monocular camera with Dist-YOLO can precisely estimate the distance of an object.
2. Dist-YOLO
- (a)
- Enrich the labels in the training dataset with information about distances.
- (b)
- Extend the prediction in each cell to produce the distance of an object.
- (c)
- Update the YOLOv3 loss function used for training to take into account the distance of an object.
2.1. Preliminaries-YOLOv3
2.2. Updating the Predictions Vector
2.3. Updating the YOLOv3 Loss Function
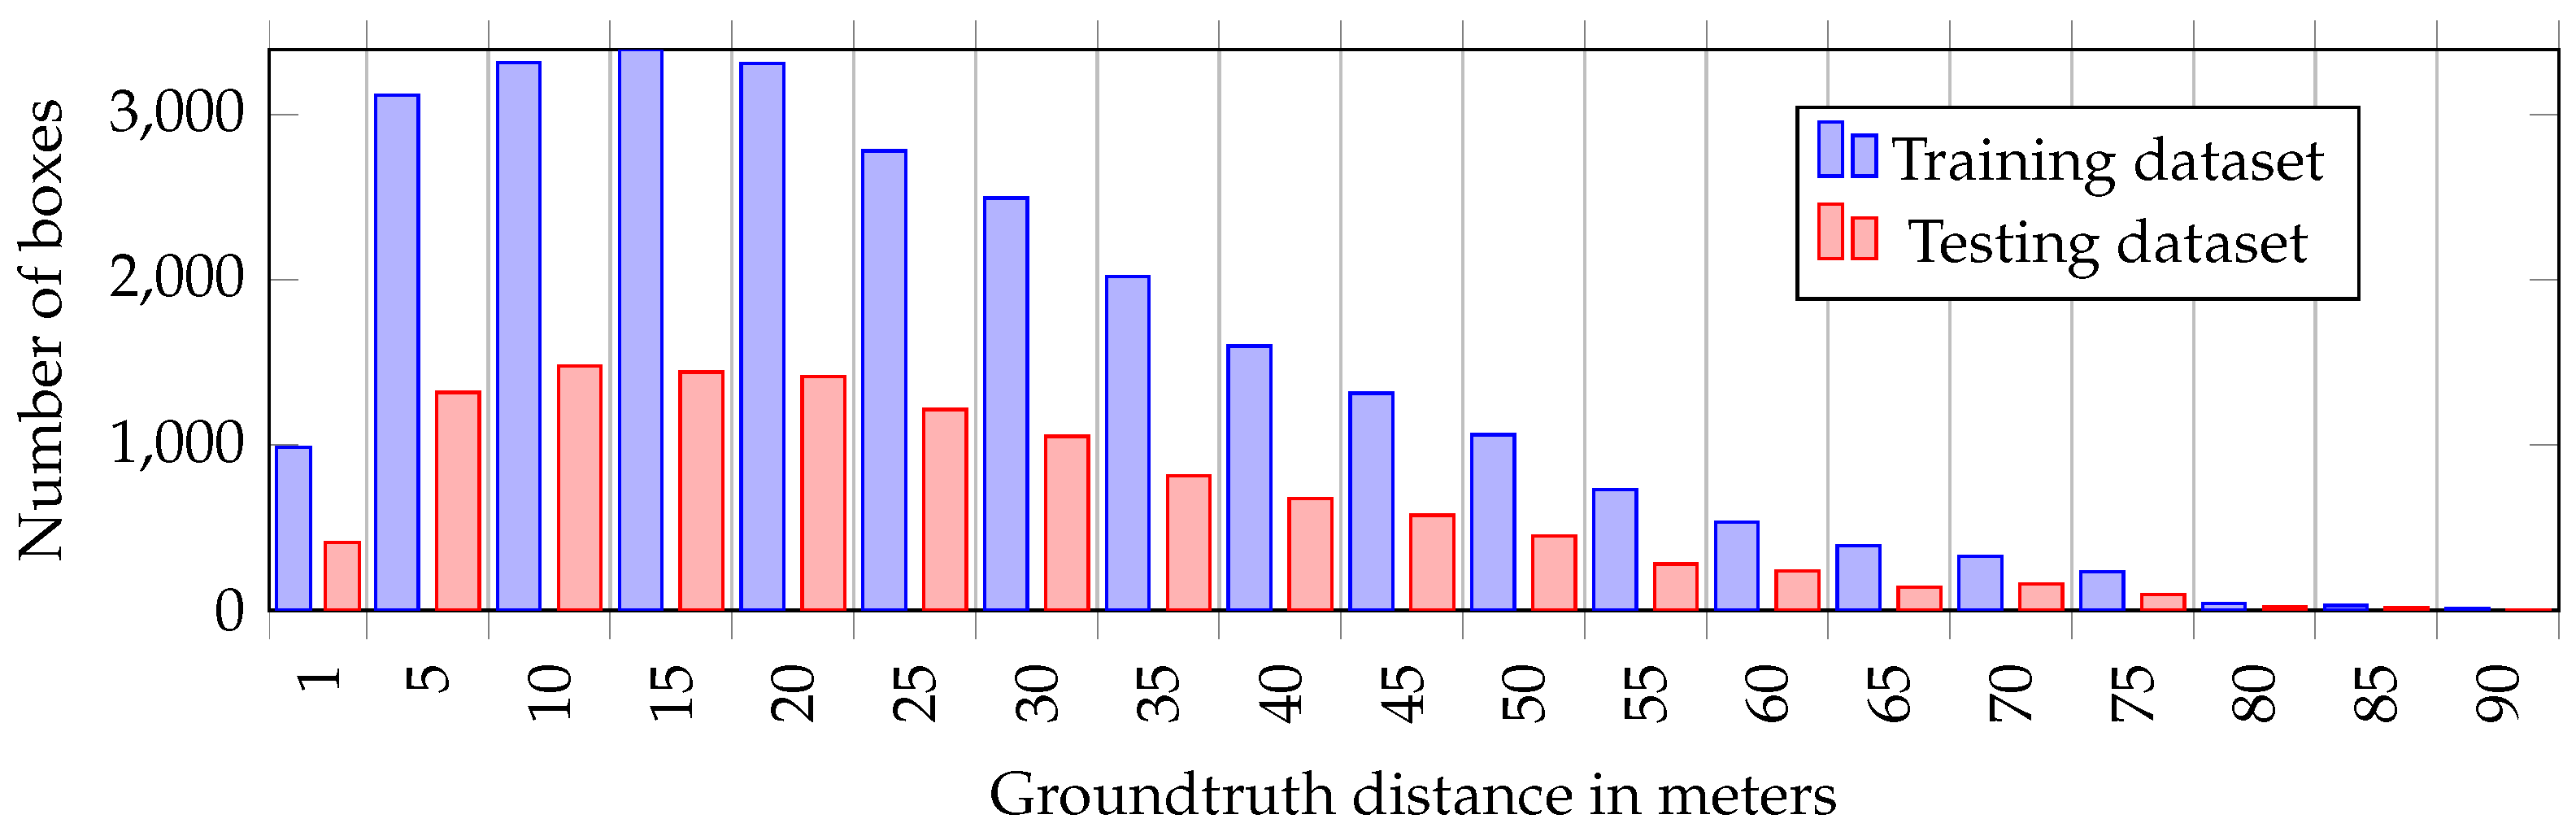
2.4. Updating YOLOv3 Training Data
3. Benchmark and Results
3.1. Evaluation Criteria
3.2. Preserving YOLO Performance
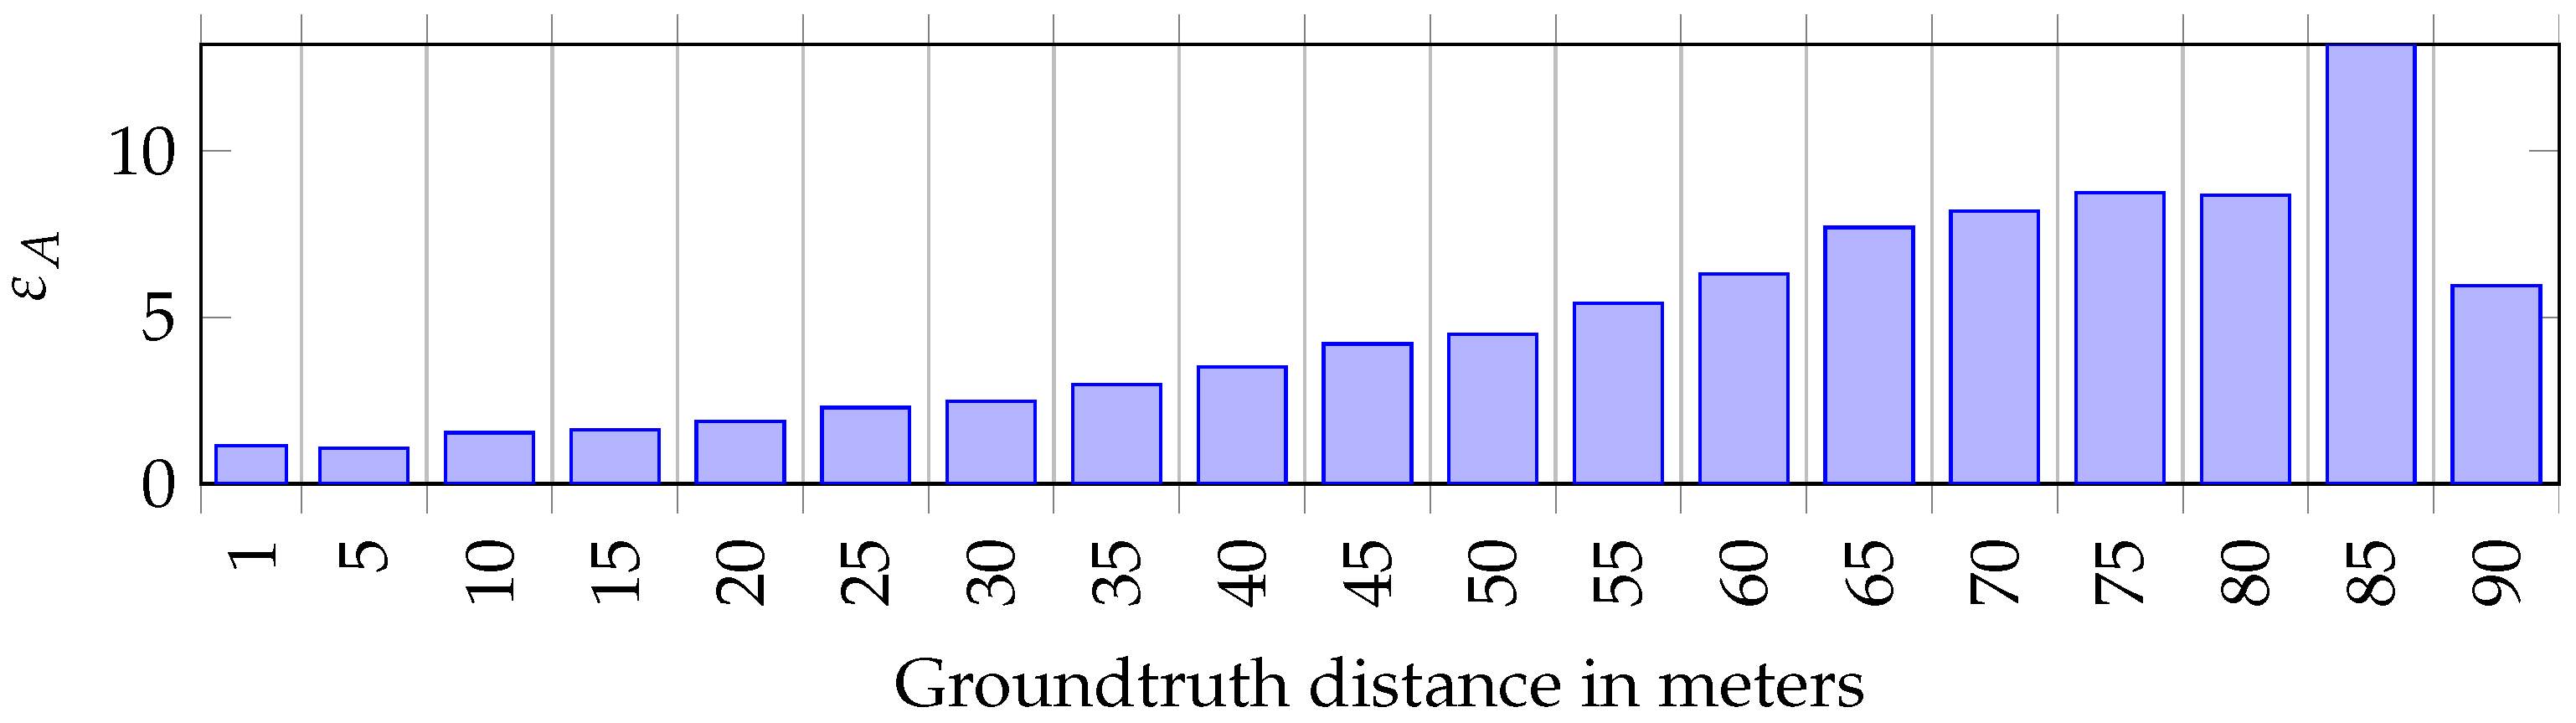
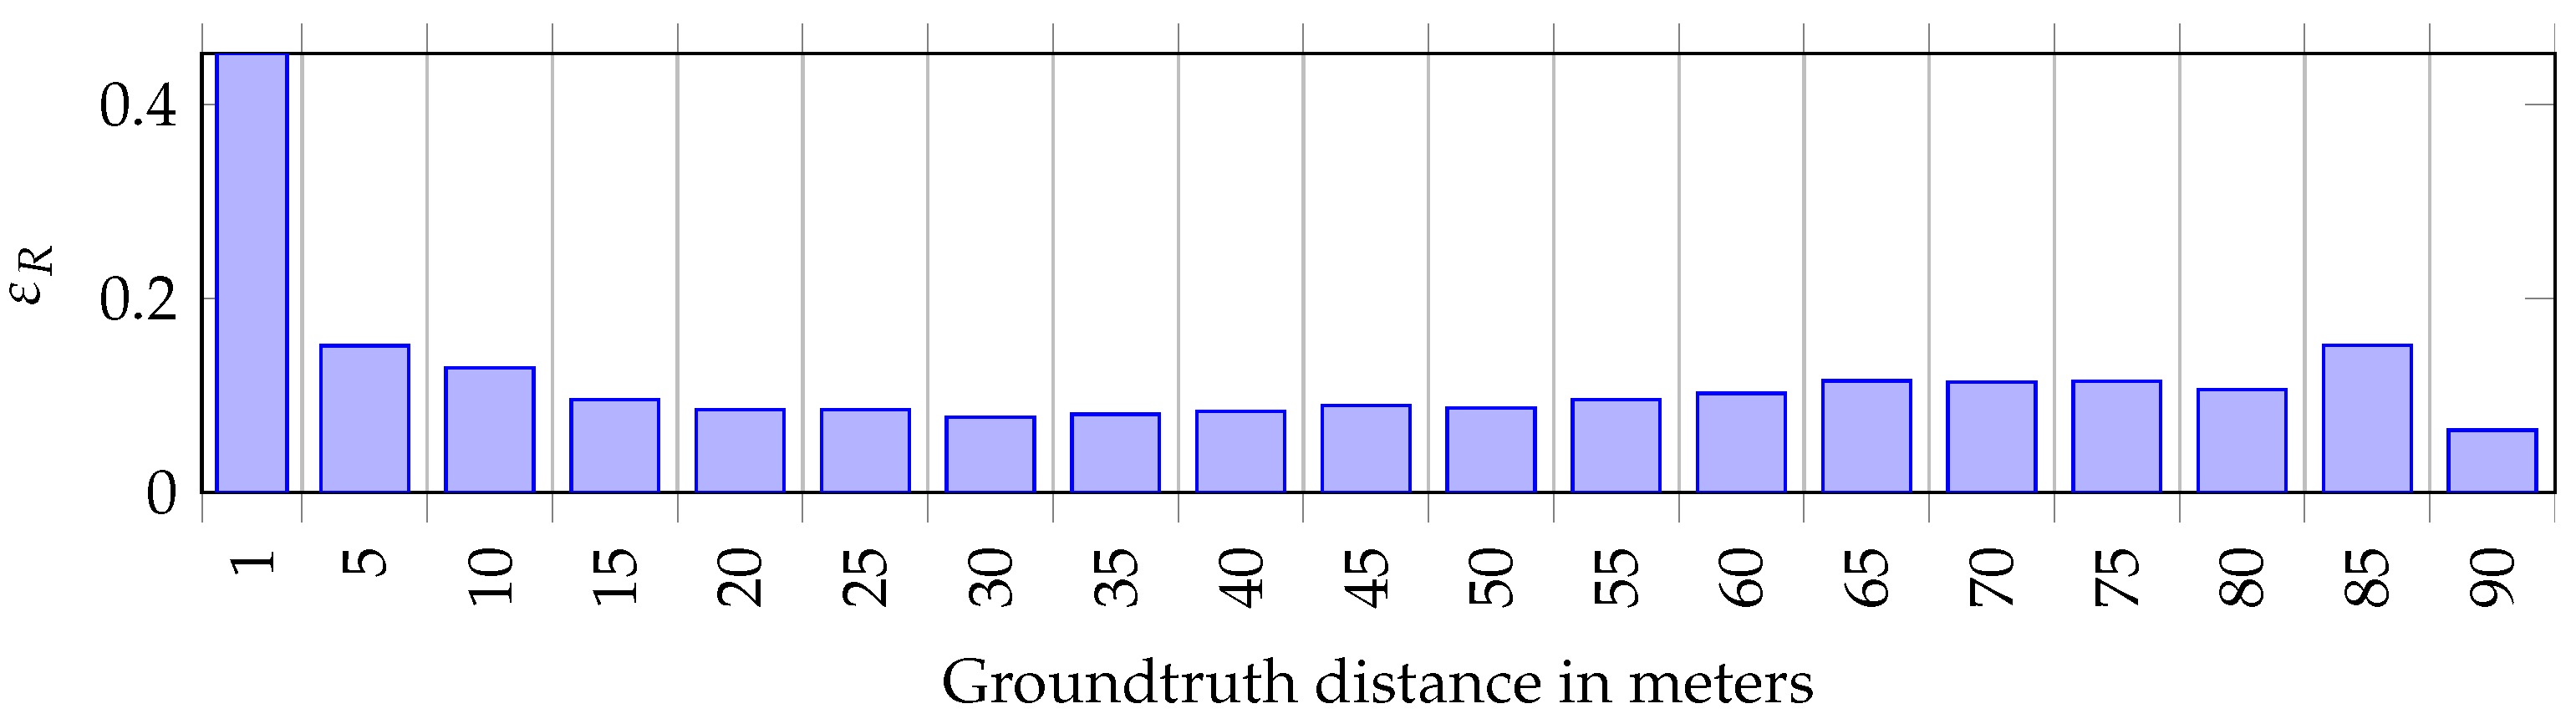
3.3. Measure the Error of Distance Estimation
3.4. Comparison with the Other Methods
3.5. Ablation Study
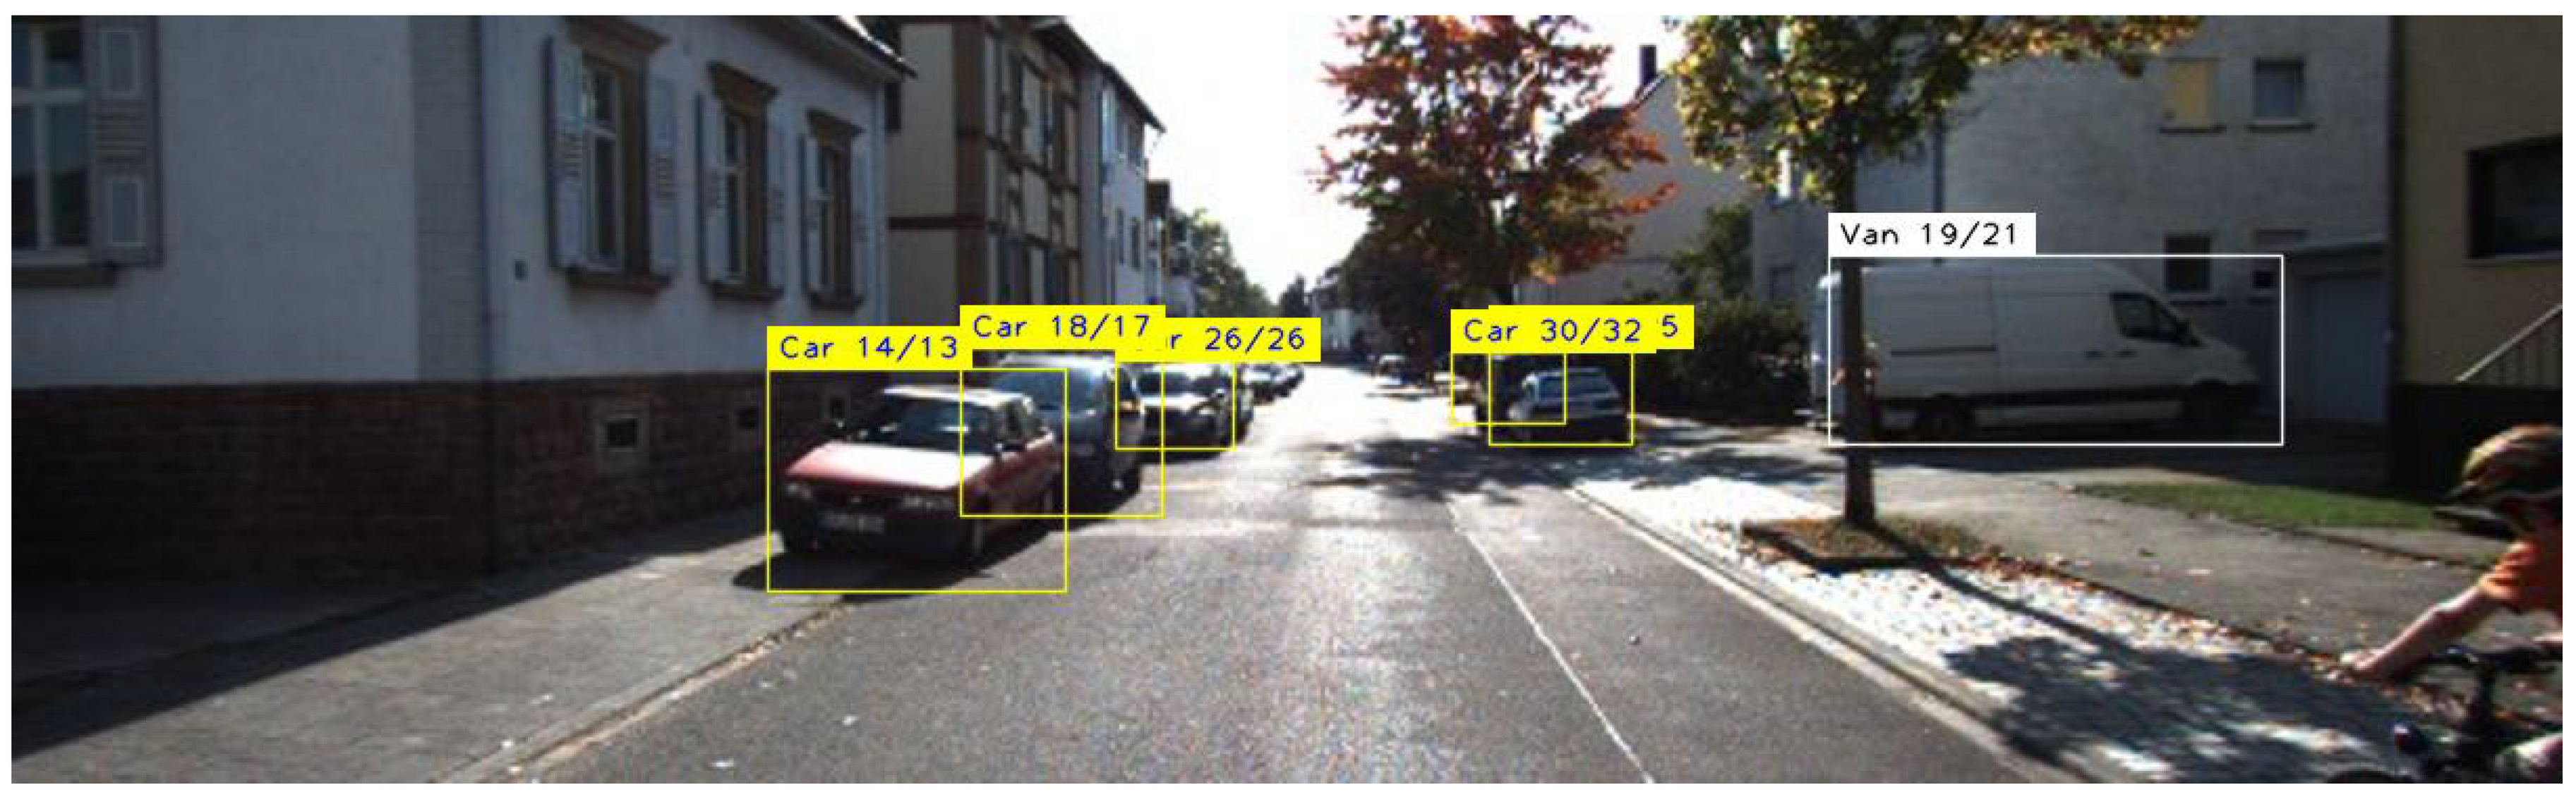
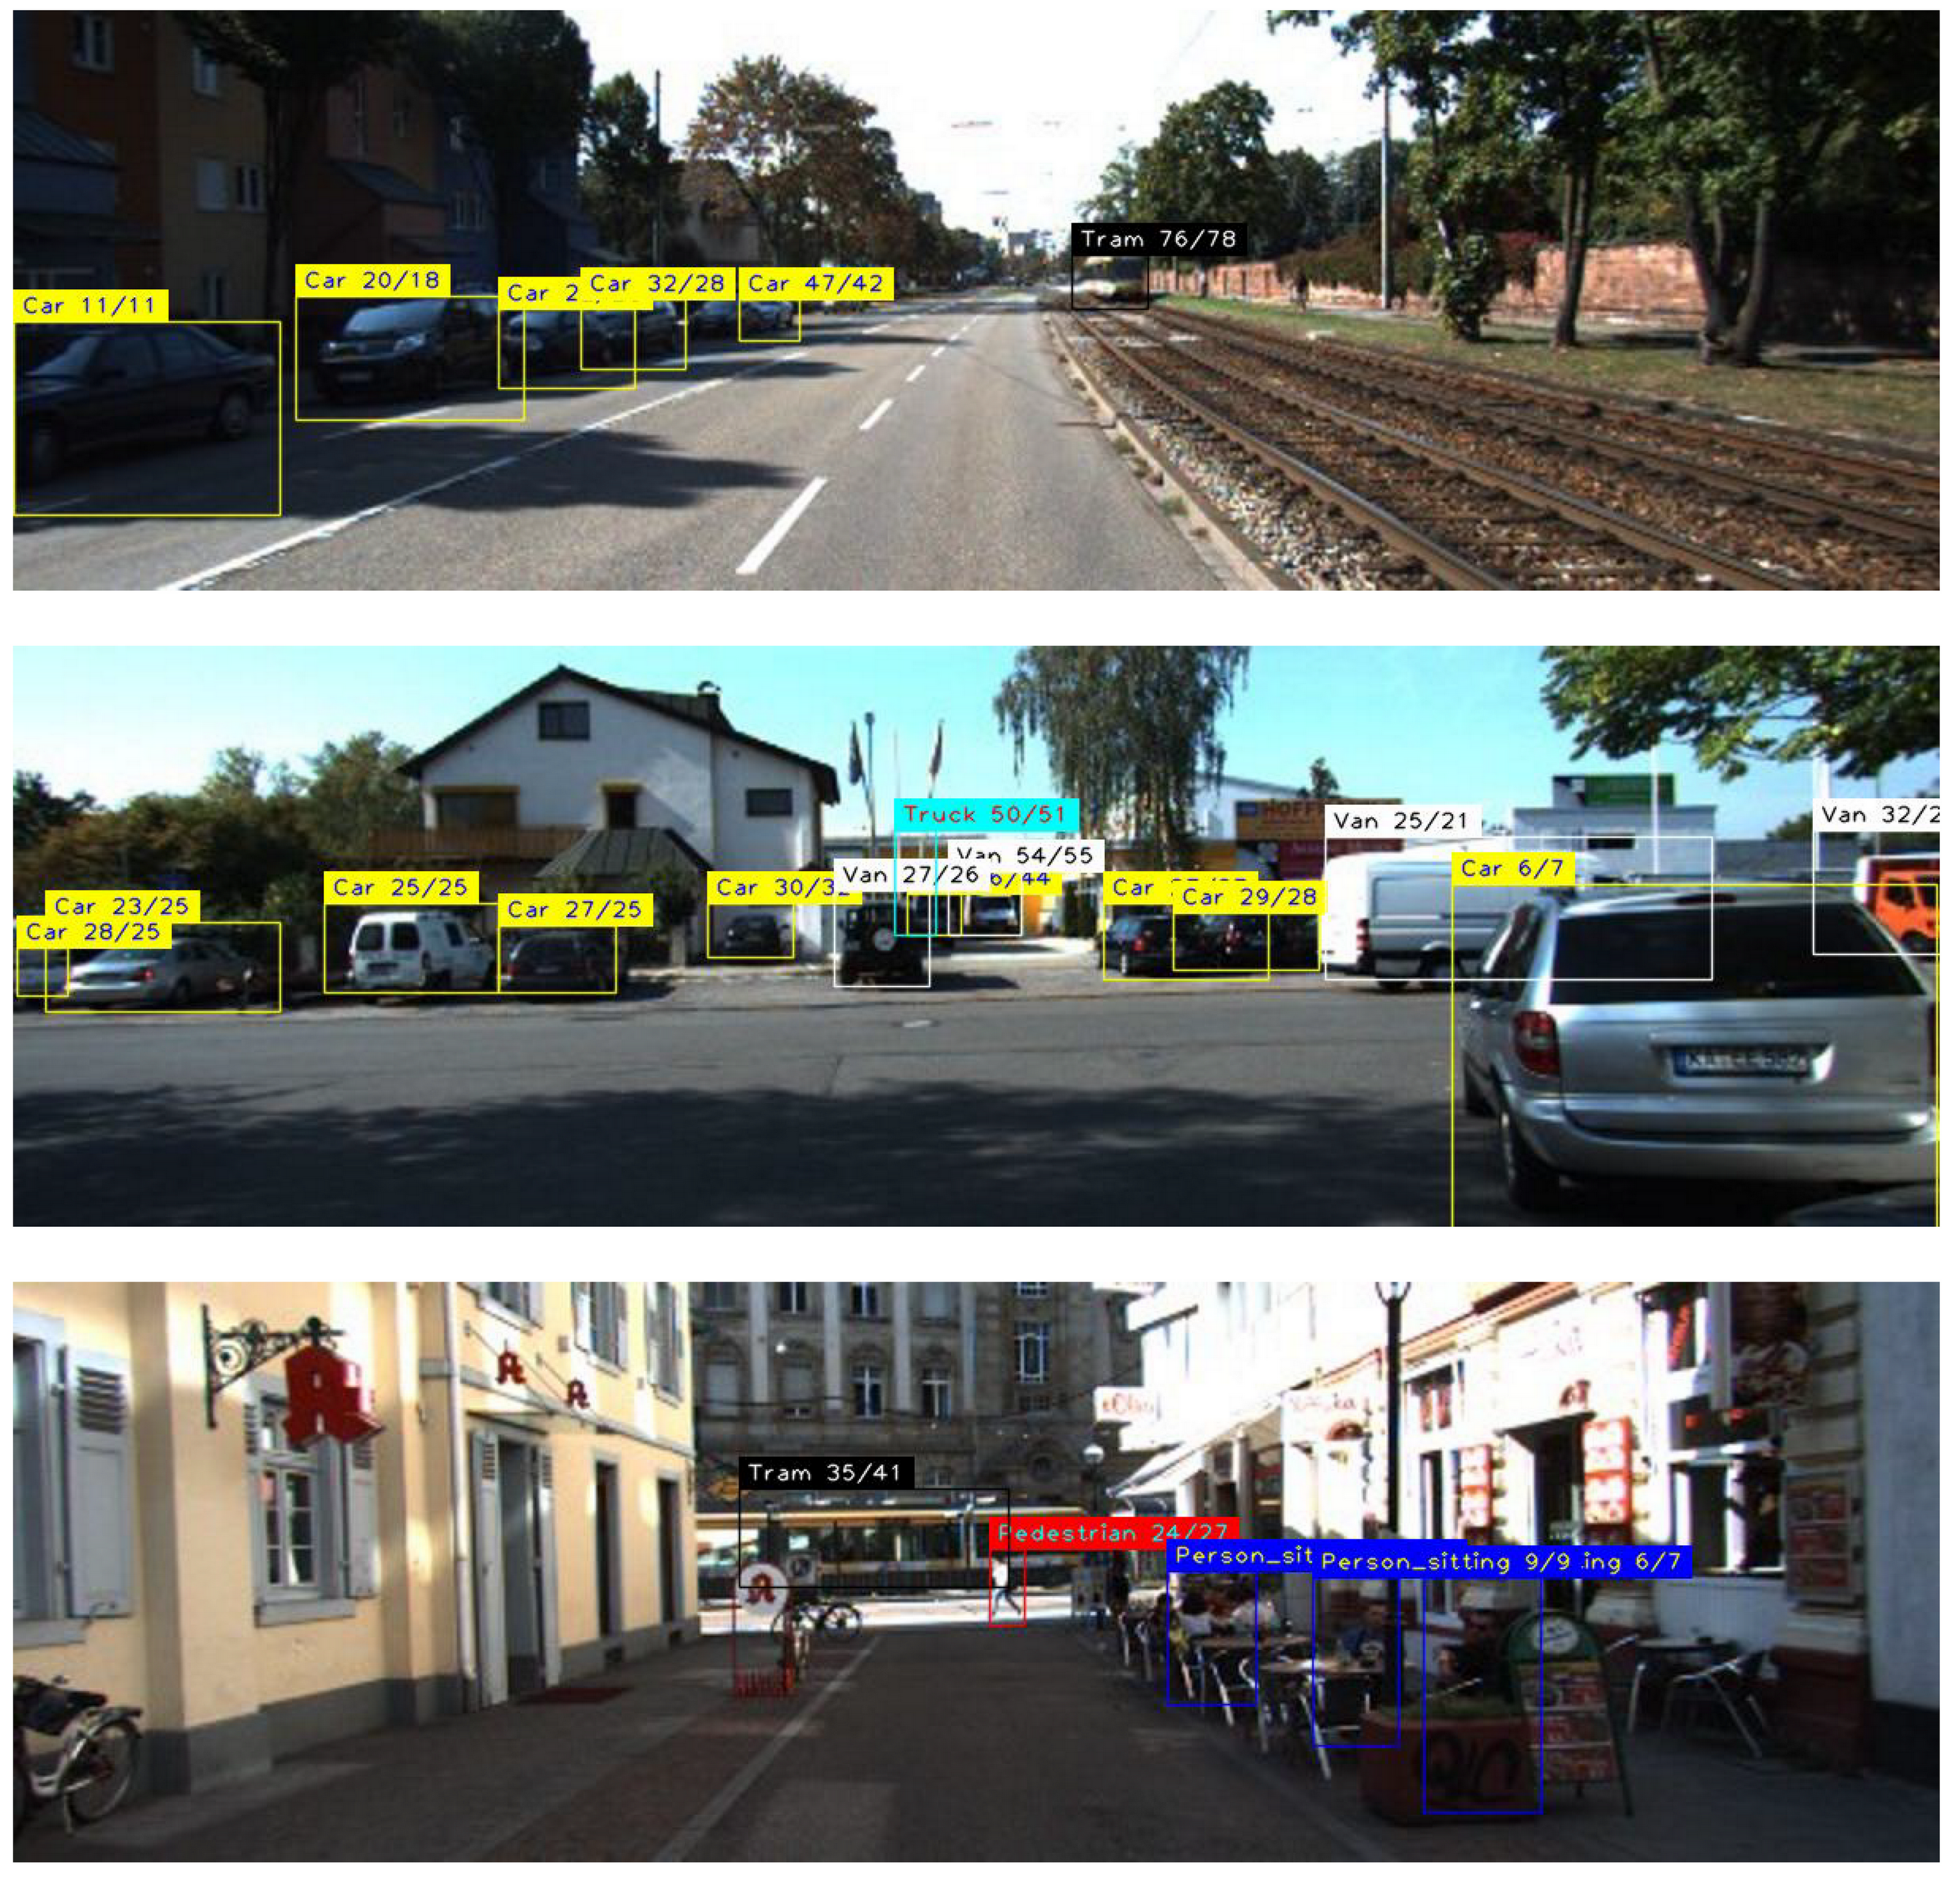
3.6. Examples
4. Discussion, Open Issues, and Future Work
5. Summary
Author Contributions
Funding
Institutional Review Board Statement
Informed Consent Statement
Data Availability Statement
Conflicts of Interest
Abbreviations
| YOLO | You Only Look Once |
| mAP | Mean Average Precision |
| MAE | Mean Average (Distance) Error |
| BB | Bounding Box |
| IoU | Intersection over Union |
References
- Rukhovich, D.; Mouritzen, D.; Kaestner, R.; Rufli, M.; Velizhev, A. Estimation of Absolute Scale in Monocular SLAM Using Synthetic Data. In Proceedings of the IEEE/CVF International Conference on Computer Vision Workshop (ICCVW), Seoul, Korea, 27–28 October 2019; pp. 803–812. [Google Scholar] [CrossRef] [Green Version]
- Haseeb, M.A.; Guan, J.; Ristic-Durrant, D.; Gräser, A. DisNet: A novel method for distance estimation from monocular camera. In Proceedings of the 10th Planning, Perception and Navigation for Intelligent Vehicles (PPNIV18), Madrid, Spain, 1 October 2018. [Google Scholar]
- Zhang, K.; Xie, J.; Snavely, N.; Chen, Q. Depth sensing beyond lidar range. In Proceedings of the IEEE/CVF Conference on Computer Vision and Pattern Recognition, Seattle, WA, USA, 13–19 June 2020; pp. 1692–1700. [Google Scholar] [CrossRef]
- Redmon, J.; Farhadi, A. Yolov3: An incremental improvement. arXiv 2018, arXiv:1804.02767. [Google Scholar]
- Bochkovskiy, A.; Wang, C.Y.; Liao, H.Y.M. Yolov4: Optimal speed and accuracy of object detection. arXiv 2020, arXiv:2004.10934. [Google Scholar]
- Jocher, G.; Stoken, A.; Borovec, J.; NanoCode012; ChristopherSTAN; Liu, C.; Laughing; Tkianai; Hogan, A.; Lorenzomammana; et al. Ultralytics/yolov5: v3.1-Bug Fixes and Performance Improvements. 2020. Available online: https://zenodo.org/record/4154370#.YfJaRfgRXQw (accessed on 26 January 2022).
- Van Breugel, F.; Morgansen, K.; Dickinson, M.H. Monocular distance estimation from optic flow during active landing maneuvers. Bioinspir. Biomimetics 2014, 9, 025002. [Google Scholar] [CrossRef] [PubMed] [Green Version]
- Ranftl, R.; Bochkovskiy, A.; Koltun, V. Vision Transformers for Dense Prediction. arXiv 2021, arXiv:2103.13413. [Google Scholar]
- Luo, X.; Huang, J.B.; Szeliski, R.; Matzen, K.; Kopf, J. Consistent video depth estimation. ACM Trans. Graph. (TOG) 2020, 39, 71-1. [Google Scholar] [CrossRef]
- Kumari, S.; Jha, R.R.; Bhavsar, A.; Nigam, A. Autodepth: Single image depth map estimation via residual cnn encoder-decoder and stacked hourglass. In Proceedings of the 2019 IEEE International Conference on Image Processing (ICIP), Taipei, Taiwan, 22–25 September 2019; pp. 340–344. [Google Scholar] [CrossRef]
- Park, M.G.; Yoon, K.J. As-planar-as-possible depth map estimation. Comput. Vis. Image Underst. 2019, 181, 50–59. [Google Scholar] [CrossRef]
- Zhou, Y.; Tuzel, O. Voxelnet: End-to-end learning for point cloud based 3d object detection. In Proceedings of the IEEE Conference on Computer Vision and Pattern Recognition, Salt Lake City, UT, USA, 18–23 June 2018; pp. 4490–4499. [Google Scholar] [CrossRef] [Green Version]
- Lehner, J.; Mitterecker, A.; Adler, T.; Hofmarcher, M.; Nessler, B.; Hochreiter, S. Patch Refinement–Localized 3D Object Detection. arXiv 2019, arXiv:1910.04093. [Google Scholar]
- Geiger, A.; Lenz, P.; Urtasun, R. Are we ready for Autonomous Driving? The KITTI Vision Benchmark Suite. In Proceedings of the Conference on Computer Vision and Pattern Recognition (CVPR), Providence, RI, USA, 16–21 June 2012. [Google Scholar]
- Geiger, A.; Lenz, P.; Urtasun, R. KITTI 3D Object Detection Benchmark. 2012. Available online: http://www.cvlibs.net/datasets/kitti/eval_object.php?obj_benchmark=3d (accessed on 14 July 2019).
- Saxena, A.; Chung, S.H.; Ng, A.Y. Learning depth from single monocular images. In Advances in Neural Information Processing Systems; MIT Press: Cambridge, MA, USA, 2006; pp. 1161–1168. [Google Scholar]
- Garg, R.; BG, V.K.; Carneiro, G.; Reid, I. Unsupervised cnn for single view depth estimation: Geometry to the rescue. In European Conference on Computer Vision; Springer: Berlin/Heidelberg, Germany, 2016; pp. 740–756. [Google Scholar]
- Zhu, J.; Fang, Y. Learning object-specific distance from a monocular image. In Proceedings of the IEEE/CVF International Conference on Computer Vision, Seoul, Korea, 27 October–2 November 2019; pp. 3839–3848. [Google Scholar]
- Hu, H.N.; Cai, Q.Z.; Wang, D.; Lin, J.; Sun, M.; Krahenbuhl, P.; Darrell, T.; Yu, F. Joint monocular 3D vehicle detection and tracking. In Proceedings of the IEEE/CVF International Conference on Computer Vision, Seoul, Korea, 27 October–2 November 2019; pp. 5390–5399. [Google Scholar]
- Huang, L.; Zhe, T.; Wu, J.; Wu, Q.; Pei, C.; Chen, D. Robust inter-vehicle distance estimation method based on monocular vision. IEEE Access 2019, 7, 46059–46070. [Google Scholar] [CrossRef]
- Natanael, G.; Zet, C.; Foşalău, C. Estimating the distance to an object based on image processing. In Proceedings of the 2018 International Conference and Exposition on Electrical Furthermore, Power Engineering (EPE), Iasi, Romania, 18–19 October 2018; pp. 0211–0216. [Google Scholar]
- Haseeb, M.A.; Ristić-Durrant, D.; Gräser, A. Long-range obstacle detection from a monocular camera. In Proceedings of the ACM Computer Science in Cars Symposium (CSCS), Munich, Germany, 13–14 September 2018. [Google Scholar]
- Chen, Z.; Khemmar, R.; Decoux, B.; Atahouet, A.; Ertaud, J.Y. Real time object detection, tracking, and distance and motion estimation based on deep learning: Application to smart mobility. In Proceedings of the 2019 Eighth International Conference on Emerging Security Technologies (EST), Colchester, UK, 22–24 July 2019; pp. 1–6. [Google Scholar]
- Godard, C.; Mac Aodha, O.; Brostow, G.J. Unsupervised monocular depth estimation with left-right consistency. In Proceedings of the IEEE Conference on Computer Vision and Pattern Recognition, Honolulu, HI, USA, 21–26 July 2017; pp. 270–279. [Google Scholar]
- Strbac, B.; Gostovic, M.; Lukac, Z.; Samardzija, D. YOLO Multi-Camera Object Detection and Distance Estimation. In Proceedings of the 2020 Zooming Innovation in Consumer Technologies Conference (ZINC), Novi Sad, Serbia, 26–27 May 2020; pp. 26–30. [Google Scholar]
- Mauri, A.; Khemmar, R.; Decoux, B.; Haddad, M.; Boutteau, R. Real-time 3D multi-object detection and localization based on deep learning for road and railway smart mobility. J. Imaging 2021, 7, 145. [Google Scholar] [CrossRef]
- You, Y.; Wang, Y.; Chao, W.L.; Garg, D.; Pleiss, G.; Hariharan, B.; Campbell, M.; Weinberger, K.Q. Pseudo-lidar++: Accurate depth for 3d object detection in autonomous driving. arXiv 2019, arXiv:1906.06310. [Google Scholar]
- Redmon, J.; Divvala, S.; Girshick, R.; Farhadi, A. You only look once: Unified, real-time object detection. In Proceedings of the IEEE Conference on Computer Vision and Pattern Recognition, Las Vegas, NV, USA, 27–30 June 2016; pp. 779–788. [Google Scholar]
- Redmon, J.; Farhadi, A. YOLO9000: Better, faster, stronger. In Proceedings of the IEEE Conference on Computer Vision and Pattern Recognition, Honolulu, HI, USA, 21–26 July 2017; pp. 7263–7271. [Google Scholar]
- Ge, Z.; Liu, S.; Wang, F.; Li, Z.; Sun, J. Yolox: Exceeding yolo series in 2021. arXiv 2021, arXiv:2107.08430. [Google Scholar]
- Hurtik, P.; Molek, V.; Hula, J.; Vajgl, M.; Vlasanek, P.; Nejezchleba, T. Poly-YOLO: Higher speed, more precise detection and instance segmentation for YOLOv3. arXiv 2020, arXiv:2005.13243. [Google Scholar]
- Bolya, D.; Zhou, C.; Xiao, F.; Lee, Y.J. YOLACT: Real-time Instance Segmentation. arXiv 2019, arXiv:1904.02689. [Google Scholar]
- Bolya, D.; Zhou, C.; Xiao, F.; Lee, Y.J. YOLACT++: Better Real-time Instance Segmentation. IEEE Trans. Pattern Anal. Mach. Intell. 2020, 44, 1108–1121. [Google Scholar] [CrossRef]
- Ren, S.; He, K.; Girshick, R.; Sun, J. Faster r-cnn: Towards real-time object detection with region proposal networks. IEEE Trans. Pattern Anal. Mach. Intell. 2017, 39, 1137–1149. [Google Scholar] [CrossRef] [Green Version]
- Yu, J.; Zhang, W. Face mask wearing detection algorithm based on improved YOLO-v4. Sensors 2021, 21, 3263. [Google Scholar] [CrossRef]
- Roy, A.M.; Bose, R.; Bhaduri, J. A fast accurate fine-grain object detection model based on YOLOv4 deep neural network. Neural Comput. Appl. 2022, 1–27. [Google Scholar] [CrossRef]
- Yi, Z.; Shen, Y.; Zhang, J. An improved tiny-yolov3 pedestrian detection algorithm. Optik 2019, 183, 17–23. [Google Scholar] [CrossRef]
- Jiao, Z.; Zhang, Y.; Xin, J.; Mu, L.; Yi, Y.; Liu, H.; Liu, D. A deep learning based forest fire detection approach using UAV and YOLOv3. In Proceedings of the 2019 1st International Conference on Industrial Artificial Intelligence (IAI), Shenyang, China, 23–27 July 2019; pp. 1–5. [Google Scholar]
- Zhou, F.; Zhao, H.; Nie, Z. Safety Helmet Detection Based on YOLOv5. In Proceedings of the 2021 IEEE International Conference on Power Electronics, Computer Applications (ICPECA), Shenyang, China, 22–24 January 2021; pp. 6–11. [Google Scholar]
- De Guzman, S.R.C.; Tan, L.C.; Villaverde, J.F. Social Distancing Violation Monitoring Using YOLO for Human Detection. In Proceedings of the 2021 IEEE 7th International Conference on Control Science and Systems Engineering (ICCSSE), Qingdao, China, 30 July–1 August 2021; pp. 216–222. [Google Scholar] [CrossRef]
- Rahim, A.; Maqbool, A.; Rana, T. Monitoring social distancing under various low light conditions with deep learning and a single motionless time of flight camera. PLoS ONE 2022, 16. [Google Scholar] [CrossRef]
- Wu, P.; Li, H.; Zeng, N.; Li, F. FMD-Yolo: An efficient face mask detection method for COVID-19 prevention and control in public. Image Vis. Comput. 2022, 117, 104341. [Google Scholar] [CrossRef]
- Ioffe, S.; Szegedy, C. Batch normalization: Accelerating deep network training by reducing internal covariate shift. In Proceedings of the 32nd International Conference of International Conference on Machine Learning, Lille, France, 7–9 July 2015; Volume 37, pp. 448–456. [Google Scholar]
- Qi, C.R.; Zhou, Y.; Najibi, M.; Sun, P.; Vo, K.; Deng, B.; Anguelov, D. Offboard 3D Object Detection from Point Cloud Sequences. arXiv 2021, arXiv:2103.05073. [Google Scholar]
- Yu, F.; Xian, W.; Chen, Y.; Liu, F.; Liao, M.; Madhavan, V.; Darrell, T. Bdd100k: A diverse driving video database with scalable annotation tooling. arXiv 2018, arXiv:1805.04687. [Google Scholar]
- Caesar, H.; Bankiti, V.; Lang, A.H.; Vora, S.; Liong, V.E.; Xu, Q.; Krishnan, A.; Pan, Y.; Baldan, G.; Beijbom, O. nuScenes: A multimodal dataset for autonomous driving. arXiv 2019, arXiv:1903.11027. [Google Scholar]
- Lin, T.Y.; Maire, M.; Belongie, S.; Bourdev, L.; Girshick, R.; Hays, J.; Perona, P.; Ramanan, D.; Zitnick, C.L.; Dollár, P. Microsoft COCO: Common Objects in Context. arXiv 2015, arXiv:1405.0312. [Google Scholar]
- Lin, T.Y.; Maire, M.; Belongie, S.; Bourdev, L.; Girshick, R.; Hays, J.; Perona, P.; Ramanan, D.; Zitnick, C.L.; Dollár, P. Microsoft COCO—Common Objects in Context. 2015. Available online: https://cocodataset.org//#detection-eval (accessed on 15 October 2021).
- Mordan, T.; Thome, N.; Henaff, G.; Cord, M. Revisiting multi-task learning with rock: A deep residual auxiliary block for visual detection. In Proceedings of the 32nd Conference on Neural Information Processing Systems (NeurIPS), Montreal, QC, Canada, 2–8 December 2018. [Google Scholar]
- Castellano, G.; Castiello, C.; Mencar, C.; Vessio, G. Crowd detection in aerial images using spatial graphs and fully-convolutional neural networks. IEEE Access 2020, 8, 64534–64544. [Google Scholar] [CrossRef]
- Ali, A.; Hassan, A.; Ali, A.R.; Khan, H.U.; Kazmi, W.; Zaheer, A. Real-time vehicle distance estimation using single view geometry. In Proceedings of the IEEE/CVF Winter Conference on Applications of Computer Vision, Snowmass, CO, USA, 1–5 March 2020; pp. 1111–1120. [Google Scholar]
- Fu, H.; Gong, M.; Wang, C.; Batmanghelich, K.; Tao, D. Deep ordinal regression network for monocular depth estimation. In Proceedings of the IEEE Conference on Computer Vision and Pattern Recognition, Salt Lake City, UT, USA, 18–23 June 2018; pp. 2002–2011. [Google Scholar]
- Bengio, Y.; Louradour, J.; Collobert, R.; Weston, J. Curriculum learning. In Proceedings of the 26th Annual International Conference on Machine Learning, Montreal, QC, Canada, 14–18 June 2009; pp. 41–48. [Google Scholar] [CrossRef]


| Model | Params | mAP | mAP |
|---|---|---|---|
| YOLOv3 | 42.56 M | 74.3 | 28.3 |
| Dist-YOLOv3 G | 42.57 M | 76.2 | 30.7 |
| Dist-YOLOv3 W | 42.60 M | 77.1 | 33.5 |
| Class | Dist-YOLOv3 G | Dist-YOLOv3 W | ||||||||||
|---|---|---|---|---|---|---|---|---|---|---|---|---|
| # | Min | Mean | Max | # | Min | Mean | Max | |||||
| Pedestrian | 1150 | −16.81 | −0.54 | 7.73 | 1.75 | 0.11 | 1117 | −8.93 | 3.83 | 39.48 | 4.87 | 0.41 |
| Car | 7682 | −24.87 | −0.81 | 14.47 | 2.49 | 0.11 | 7798 | −13.24 | 8.75 | 42.10 | 10.68 | 0.44 |
| Van | 749 | −20.49 | 0.46 | 18.00 | 3.55 | 0.15 | 751 | −26.88 | 13.94 | 42.25 | 14.17 | 0.64 |
| Truck | 318 | −34.36 | 1.16 | 15.93 | 4.63 | 0.14 | 319 | −27.33 | 4.51 | 26.30 | 6.49 | 0.21 |
| Person sitting | 57 | −7.09 | −0.59 | 4.74 | 1.84 | 0.22 | 56 | −2.27 | 4.35 | 16.15 | 4.64 | 0.64 |
| Cyclist | 406 | −17.79 | −1.25 | 14.66 | 2.37 | 0.11 | 409 | −4.16 | 14.32 | 46.80 | 14.38 | 0.85 |
| Tram | 135 | −26.66 | 1.85 | 19.57 | 4.72 | 0.19 | 132 | −22.37 | −2.65 | 11.36 | 4.41 | 0.17 |
| All | 10,497 | −34.36 | −0.61 | 19.57 | 2.57 | 0.11 | 10,582 | −27.33 | 8.52 | 46.80 | 10.22 | 0.46 |
Publisher’s Note: MDPI stays neutral with regard to jurisdictional claims in published maps and institutional affiliations. |
© 2022 by the authors. Licensee MDPI, Basel, Switzerland. This article is an open access article distributed under the terms and conditions of the Creative Commons Attribution (CC BY) license (https://creativecommons.org/licenses/by/4.0/).
Share and Cite
Vajgl, M.; Hurtik, P.; Nejezchleba, T. Dist-YOLO: Fast Object Detection with Distance Estimation. Appl. Sci. 2022, 12, 1354. https://doi.org/10.3390/app12031354
Vajgl M, Hurtik P, Nejezchleba T. Dist-YOLO: Fast Object Detection with Distance Estimation. Applied Sciences. 2022; 12(3):1354. https://doi.org/10.3390/app12031354
Chicago/Turabian StyleVajgl, Marek, Petr Hurtik, and Tomáš Nejezchleba. 2022. "Dist-YOLO: Fast Object Detection with Distance Estimation" Applied Sciences 12, no. 3: 1354. https://doi.org/10.3390/app12031354