Article

Strength Characteristics of Biochar-Amended Clay Covered Soil Mixed with Methane-Oxidizing Bacteria

1
School of Civil Engineering, Luoyang Institute of Science and Technology, Luoyang 471023, China
2
Department of Civil Engineering, College of Environment Science and Engineering, Donghua University, Shanghai 201620, China
3
School of Civil and Transportation Engineering, Henan University of Urban Construction, Pingdingshan 467036, China
*
Author to whom correspondence should be addressed.
Appl. Sci. 2022, 12(24), 12954; https://doi.org/10.3390/app122412954
Submission received: 22 October 2022 / Revised: 2 December 2022 / Accepted: 15 December 2022 / Published: 16 December 2022

Abstract

:
Adding biochar to soil can improve the soil’s physical–chemical properties, microscopic pore structure, and bacterial habitat. This affects the soil’s strength characteristics and the oxidization of methane. Using a Humboldt pneumatic direct shear instrument, this study investigated the effect of the amount of biochar in the soil, the soil’s methane-oxidizing bacteria, aeration time, and carbon content on the strength characteristics of a biochar-amended clay. The results show that when the biochar content is low, the soil’s stress–strain curve shows a strain hardening state as the strain increases. When the biochar content is greater than 10%, the methane-oxidizing bacteria increase as the shear strain increases. The stress–strain curves of the biochar–clay mixture all showed a softened state. Under the same biochar content, the soil’s stress–strain curves show strain softening as the methane filling time increases. However, with an increase in the amount of biochar, cohesion gradually increased and the internal friction angle did not change significantly. A scanning electron microscope (SEM) image of the biochar–clay mixture with methane oxidizing bacteria revealed the influence of the evolution law of the samples’ micropore structure on the soil’s stress–strain curve and strength properties.

1. Introduction

During the service period of a typical landfill, gas is released due to the degradation of organic matter in the waste. Landfill emissions contain two greenhouse gasses: methane (55% to 60%) and carbon dioxide (40% to 45%). Potentially, methane’s global greenhouse effect is about 25 times that of carbon dioxide [1], and between 5% to 50% of landfill methane escapes into the atmosphere even if a complete gas collection device is installed. In small, medium-sized, or old landfills, where such devices are rarely installed, methane suppression by other means is necessary [2]. Therefore, to suppress and reduce the escape of methane gas, this study proposes a biochar–clay mixture with methanotrophic bacteria as an alternative material for the landfill’s final cover. The research results have practical implications for global warming.
Methane oxidizing bacteria are microorganisms that use methane as their only carbon and energy source and are easily enriched in the landfill coating [3]. Moon et al. [4] showed that adding methane oxidizing bacteria to the landfill’s overburdened soil can promote the oxidation of escaping CH4. However, the growth and reproduction of the soil’s aerobic methane oxidizing bacteria require a suitable environment (such as optimal temperature, pH, and oxygen content), and the traditional clay overburden has high clay content and poor aeration. It is also acidic and, therefore, generally not suitable for the growth of methane oxidizing bacteria [5].
With its low density, high specific surface area, high pH and stability, and well-developed pore structure [6,7], biochar has received considerable attention as a sustainable and eco-friendly material for overburdened soil improvement in landfills [8]. Added to soil, it can reduce soil density, increase soil porosity, and affect the distribution of soil aggregates and pore size [9,10,11]. Biochar’s porosity also provides a good habitat for methane-oxidizing bacteria [12]. It can improve the soil’s microclimate and physical–chemical properties, both of which promote bacterial growth and enzyme activity [13], and increase the methane oxidation efficiency of a landfill’s biochar–clay cover mixed with methanotrophs. Although suggested biochar as a modification material for the final landfill, most traditional landfill cover layers are composed of clay and are affected by the atmosphere’s dry–wet cycle or the uneven settlement of waste degradation [14]. For this reason, the cover layer often cracks, a phenomenon closely related to the microscopic pore structure of the overlying soil, which in turn affects the soil’s strength properties [15,16]. Yaghoubi [15] investigated the effect of biochar content and particle size on the soil’s shear strength and showed that the latter gradually increased with the amount of biochar. When the biochar’s particle size increases, the soil’s shear strength also increases. Hussain et al. [17] similarly explored whether biochar improved the shear strength of cohesive sandy soil and found that, when the amount of biochar increases from 5% to 15%, the soil’s shear strength parameters—cohesion and internal friction angle—also gradually increased. These studies show that the strength properties of biochar-amended soil are an important consideration in soil modification research.
Although many studies have investigated the strength characteristics of biochar-amended soil, most have focused on the influence of biochar content and particle size on the soil’s strength characteristics. For example, Xu et al. [18] and Hussain et al. [17] studied the effect of biochar content on the soil’s shear strength and showed that it increased as the amount of biochar increased. Reddy et al. [19] investigated the strength properties of various biochar-modified soils (5%, 10%, and 20% of biochar) and particle size (size −10, size −20, and size −40) and found that the samples’ shear strength not only increased as the biochar content increased but also as the biochar’s particle size decreased.
Most current research considers the interaction of biochar and soil in the shear strength of mixed soil and the effect of soil microorganisms [20,21,22]. However, adding microbial methanotrophs to a landfill’s overlying soil and measuring the effect of methane aeration time on the soil’s strength characteristics have not been examined. Therefore, this study investigates the effect of the amount of biochar in the soil and the aeration time of the methane oxidizing bacteria on the soil’s strength characteristics. Using the Humboldt pneumatic direct shear test device, the study investigates the effect of various amounts of biochar in soil (0%, 5%, 10%, and 15%) and different aeration times (0 d, 5 d, and 10 d) on the methane oxidizing bacteria in the biochar–clay mixture, together with their effect on the soil’s shear strength. Using the scanning electron microscope (SEM) test method, the study examined the microscopic activities of the soil’s methanotrophic bacteria on the strength characteristics of biochar–clay soil with methanotrophic bacteria.

2. Materials and Methods
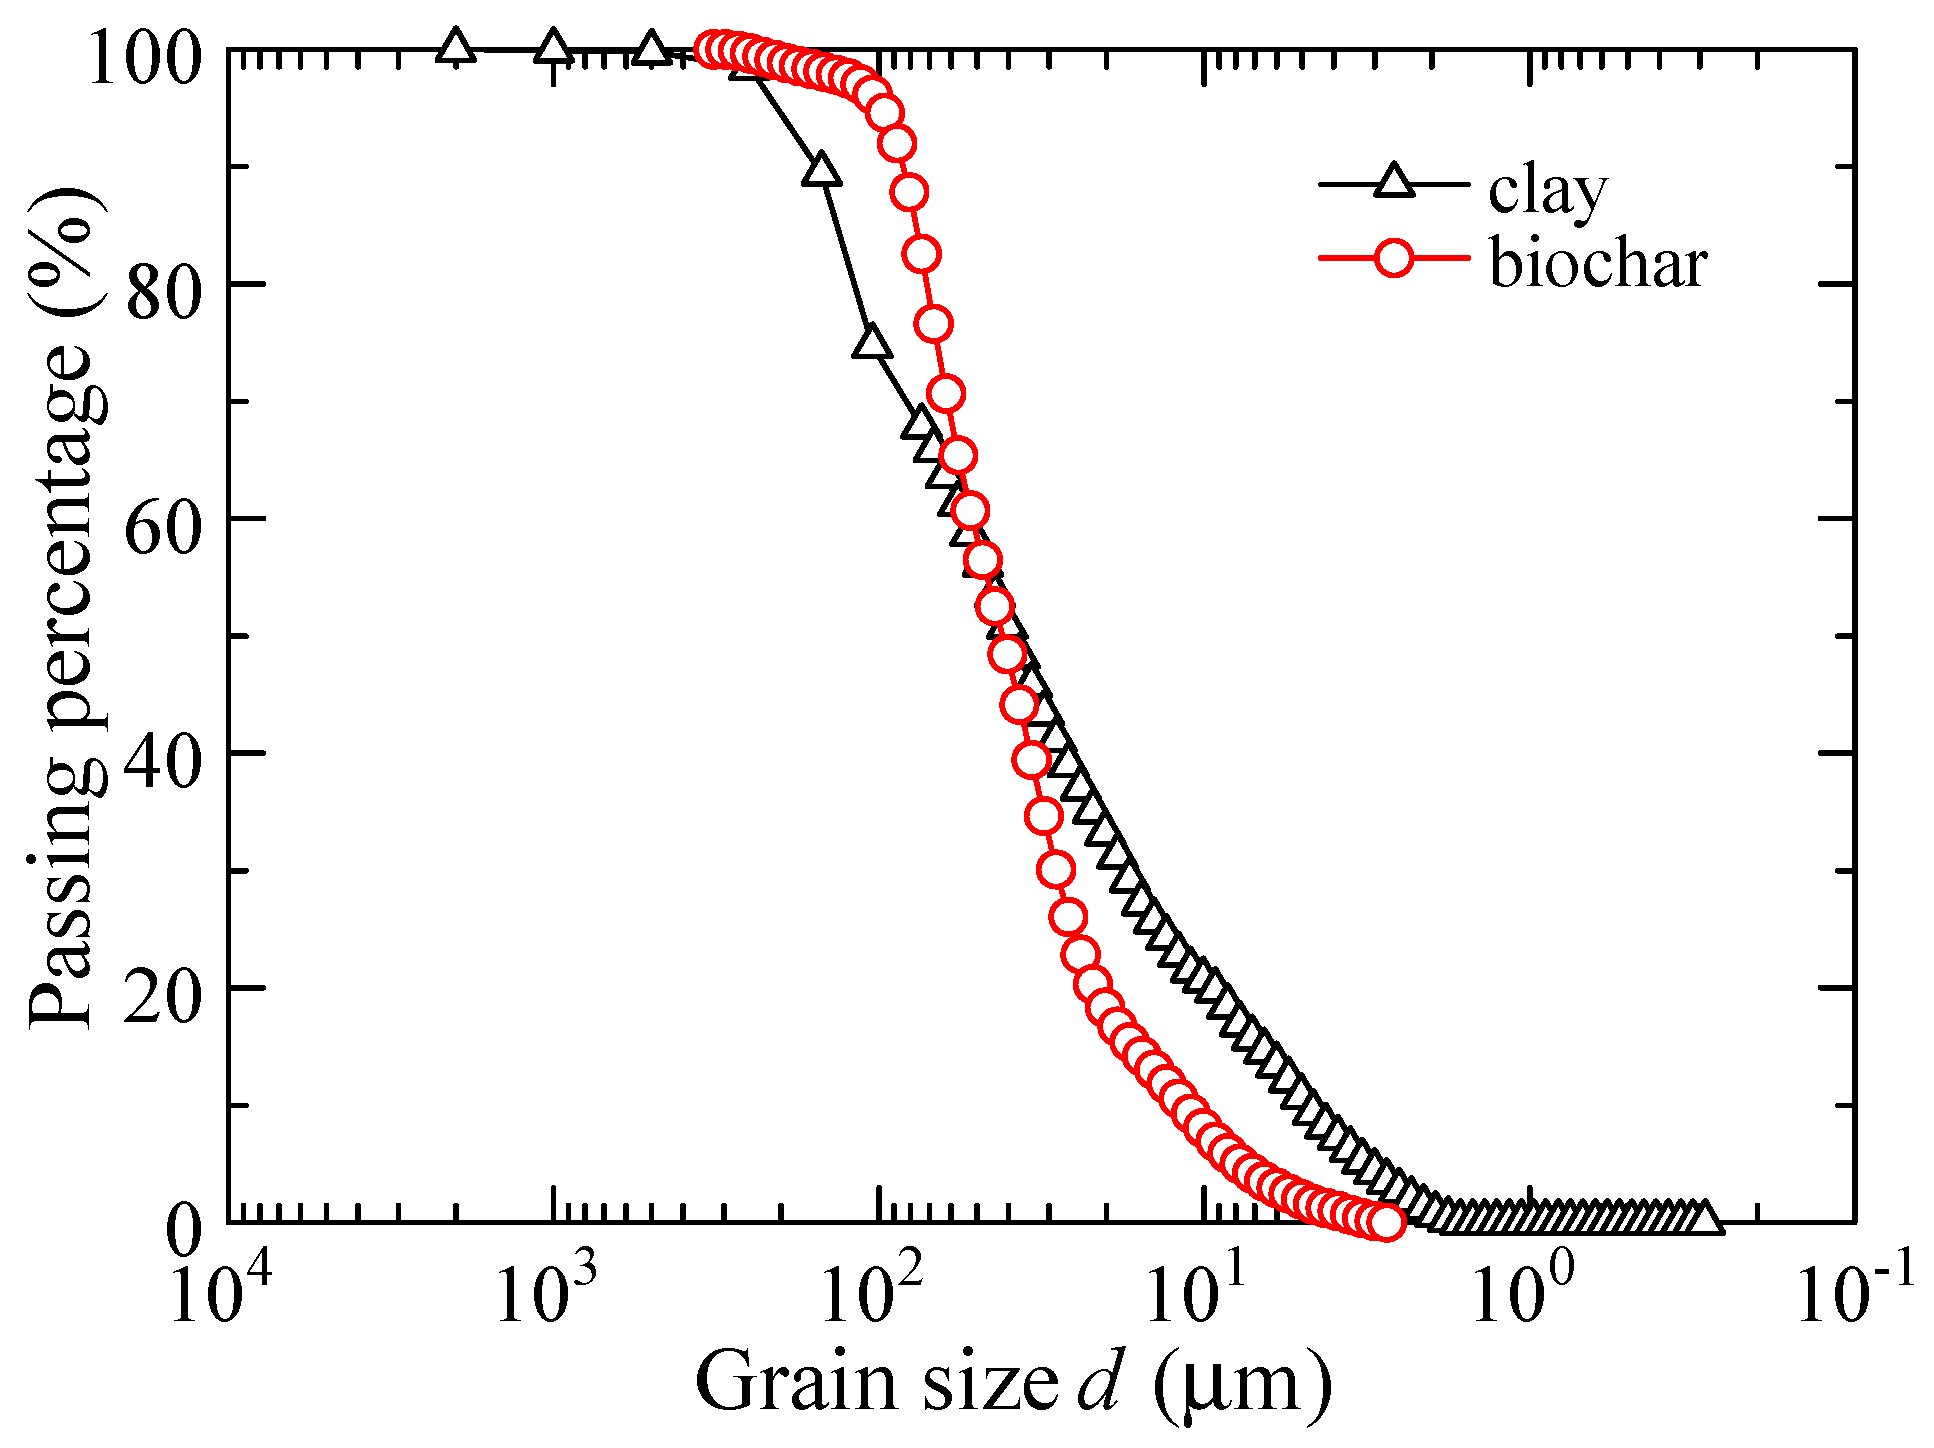
2.1. Test Materials

Table 1 shows the basic physical indexes of the clay used in the test. According to the plasticity chart for fine–grained soil, our test soil is low–liquid limit clay.
The biochar was obtained by pyrolysis of rice straw under anoxic conditions at 500 °C. Table 1 shows the basic physicochemical properties of the biochar. Its ash content was 18.8%, based on the ASTM D 1762–84 standard test method [23]. To obtain the mass loss rate, 20 g of biochar was placed in a muffle furnace at a temperature of 800 °C for 4 h, and the quality loss was obtained.
The biochar was then passed through a 74 μm sieve to obtain a sample with a particle size <74 μm. Figure 1 shows the particle gradation curve of the soil and biochar. The part with a particle size >74 μm was measured by the sieving method, and the part with a particle size <74 μm was measured using a laser particle size analyzer.
During high–temperature pyrolysis, the skeleton structure of the original biomass was not damaged. Figure 2a shows the scanning electron microscope results of the biochar. From the microscopic morphological characteristics of the rice straw biochar samples, the porosity of the internal structure of the biochar and the morphology of the pore structure can be seen.
The methanotrophs used in this study were screened from the overburdened landfill soil. Through a series of bacterial screening operations, such as enrichment, streaking, and purification, we obtained a methane oxidizing bacterium, identified as Methylobacterium extorquens, which belongs to the genus Methylobacter. Scanning electron microscopy of the biochar–clay mixture with methanotrophs revealed its morphology, as shown in Figure 2b.

2.2. Sample Preparation

The clay used in the test was placed in an oven at 105 °C and dried for 8 h. The mass percentages of the biochar mixed with soil were 0%, 5%, 10%, and 15%. We calculated the quality of the required bacterial liquid, biochar, and clay according to the set bacterial liquid-containing ratio, mixed the biochar–clay mixture and bacterial liquid in the container evenly, and then packed the biochar–clay mixed soil in a sealed container for 12 h. The bacterial solution rate of the control sample was 14%. We prepared a compacted sample with a diameter of 5.09 cm, a height of 2.00 cm, and a dry density of 1.50 g/cm3. The initial dry density was selected according to the technical code for municipal solid waste sanitary landfill closure [24]; the degree of compaction of the landfill cover soil should not be less than 90% of the standard proctor maximum dry density (SPMDD) of clay.
To study the influence of methane oxidizing bacteria on soil strength after growing the bacteria in the soil for a set time, we placed the prefabricated direct shear sample in the drying dish and coated the connection between the upper and lower parts of the dish with silicone grease to ensure the tightness of the interface. We plugged the hole on the lid with a butyl rubber stopper. A syringe needle, which could be inserted into the butyl rubber stopper, was used for filling the drying dish with methane. The methane concentration in the dish was maintained at 3% during the process of preparation. For this study, we investigated the shear strength of the prefabricated soil samples at 0, 5, and 10 days of aeration time. Three parallel samples were prepared under each working condition, and the samples were subjected to unconsolidated fast shear tests under vertical pressures of 100 kPa, 200 kPa, and 400 kPa, respectively. The shear rate was 0.80 mm/min.

2.3. Microstructure Investigation

Quanta FEG450 field emission scanning electron microscope (SEM) was used to test the microstructure and pore size distribution characteristics of the bacteria doped biochar–clay soil, and the change rule of biochar content in soil was analyzed from the microscopic level.
Before scanning, the samples were frozen in liquid nitrogen (−195 °C) for 5 min and then placed in a Labconco™ freeze dryer for vacuum freeze drying [25]. The freeze dried sample was pasted onto a copper sheet with conductive tape, and the surface sprayed with was gold; the sample was placed on the sample stage of the SEM for scanning and photographing.
A Thermo Scientific Nicolet iS5 Fourier transform infrared spectrometer made in America was used for the functional group test. The resolution of the test was 4 cm−1, the number of scans was 32, and the test range was 400–4000 cm−1 [26]. The attenuated total reflection iD Foundation Multi bounce ATR ZnSe horizontal channel accessory was selected for spectrum collection, and the biochar powder was smeared on the ATR crystal by the coating method for testing. Thermo Scientific OMNIC and TQAnalyst were used as the spectrum analysis software.

3. Experimental Results and Analysis

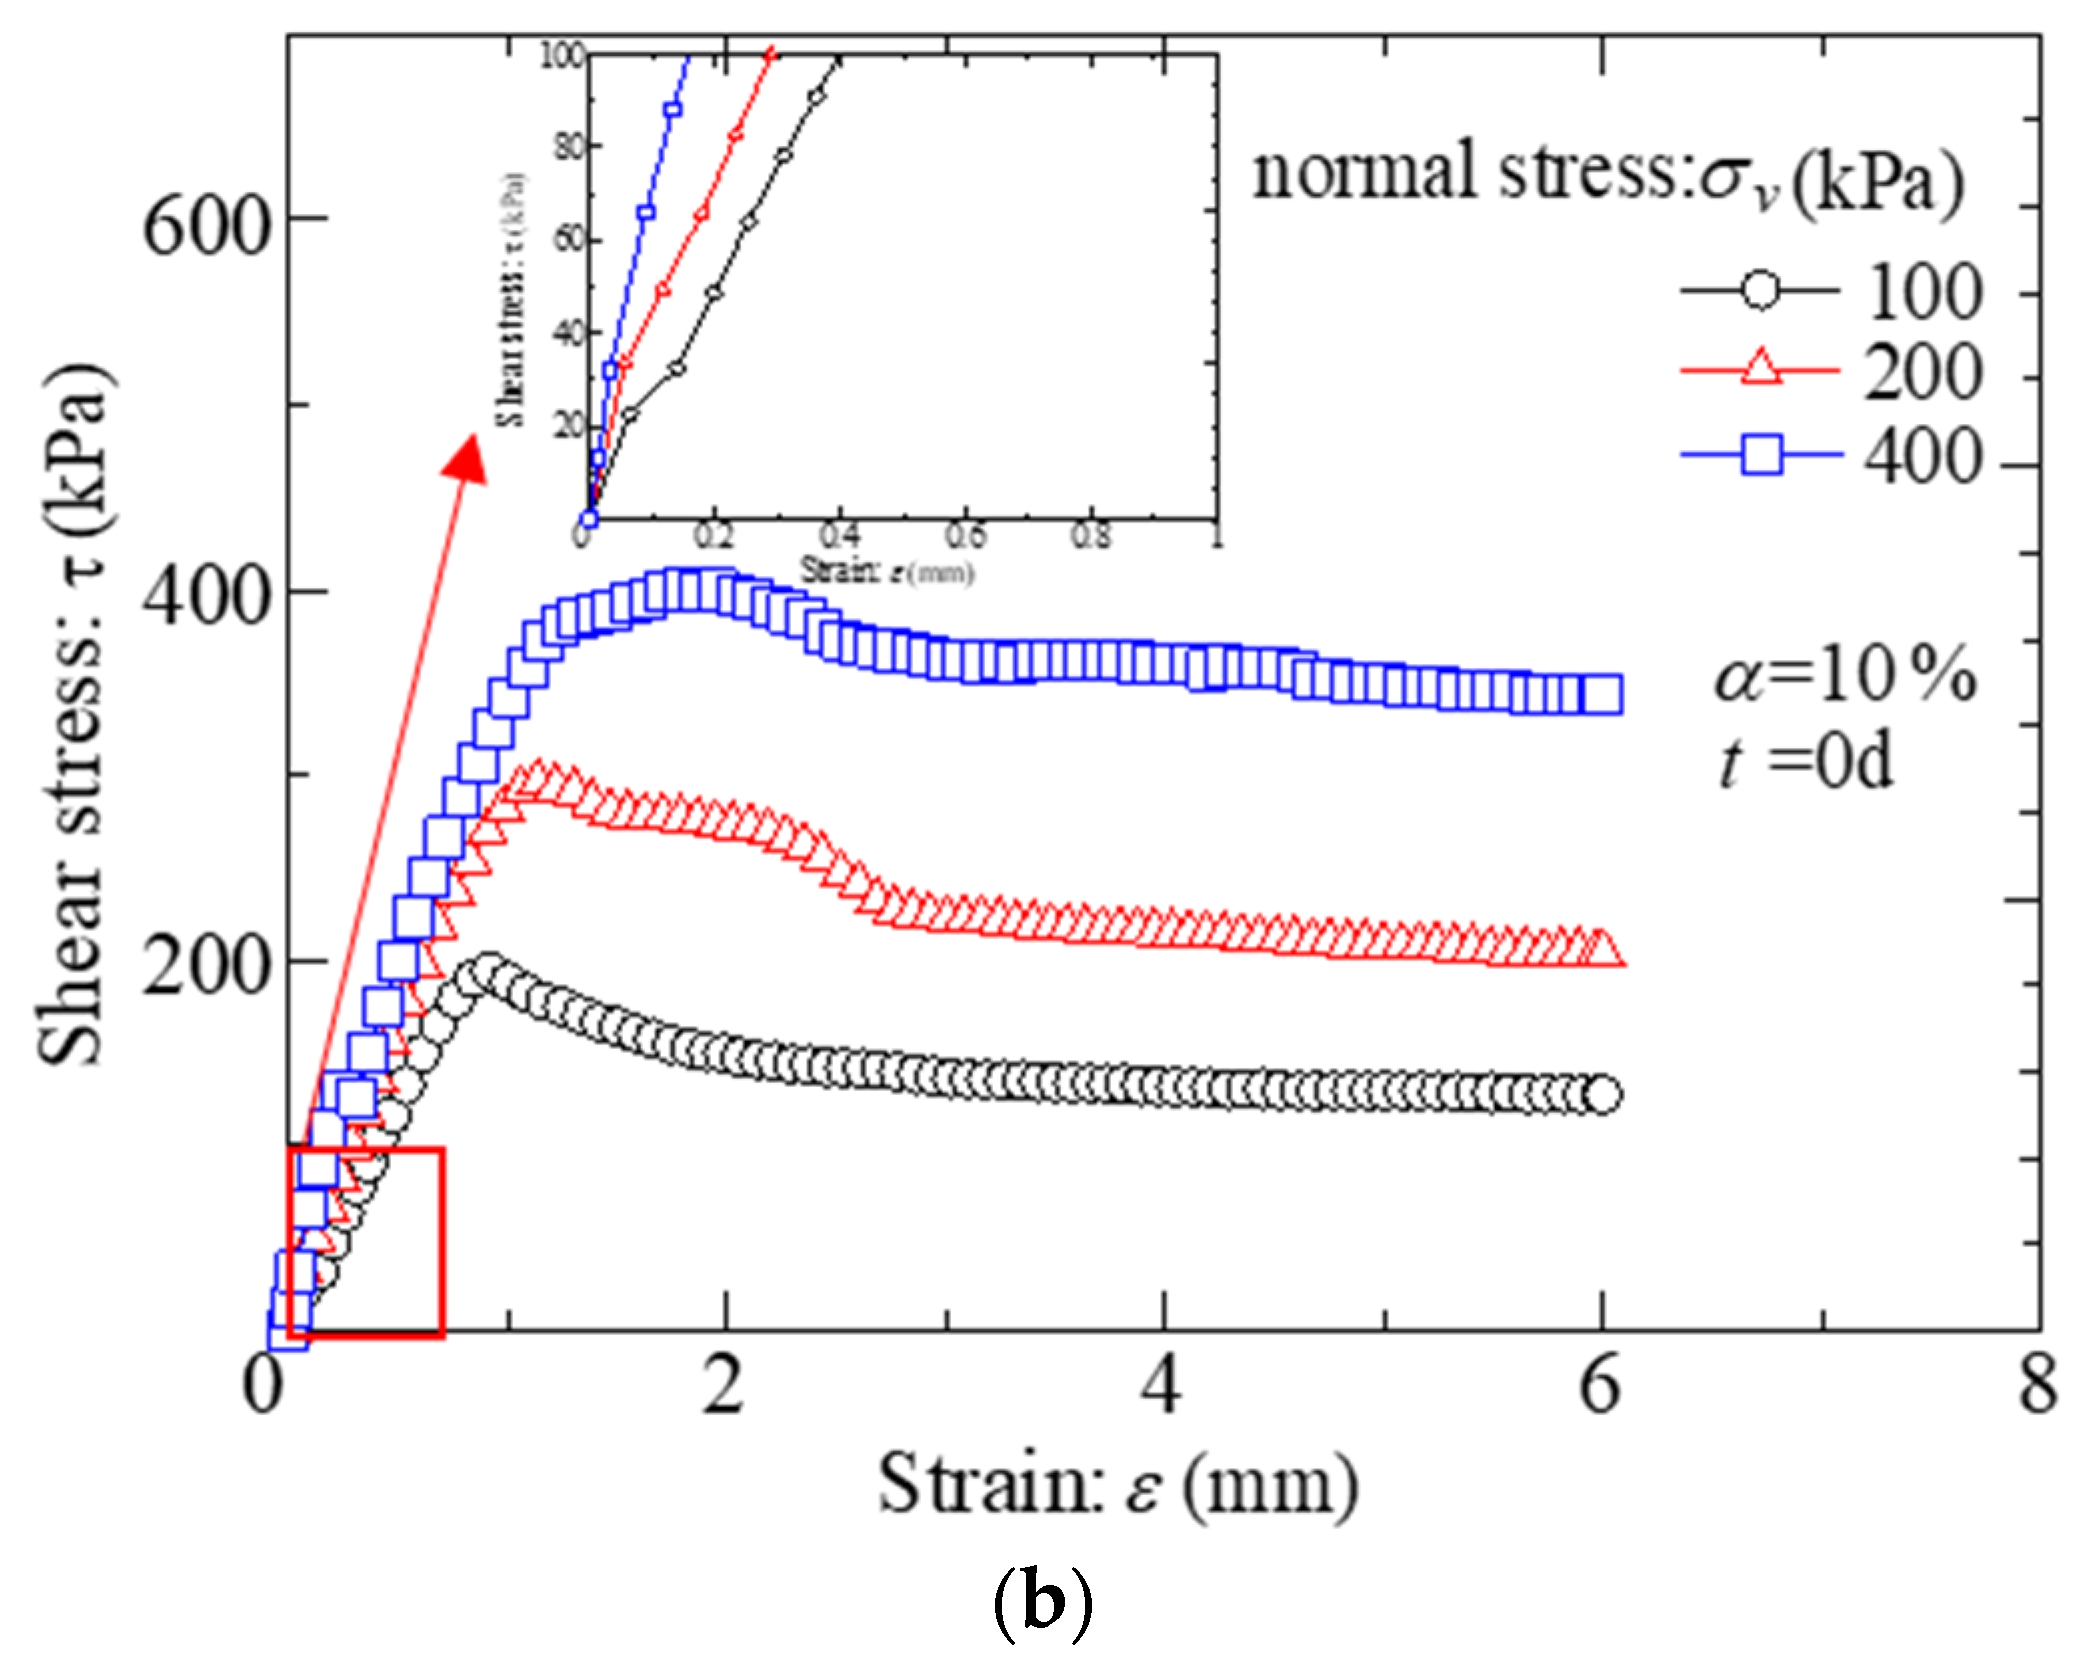
3.1. Effects of Normal Stress on Strength Properties of Biochar–Clay with Methane-Oxidizing Bacteria

Figure 3 shows the shear stress of biochar–clay with methane oxidizing bacteria with 0% and 10% biochar under different vertical loads (σv = 100 kPa, σv = 200 kPa, and σv = 400 kPa).
It can be seen from Figure 3a that when the biochar content was 0%, the shear stress and strain curves of the soil samples of the biochar–clay with methane oxidizing bacteria under vertical stress of 400 kPa have no peak strength. When the strain increases, the sample’s stress–strain curve shows a strain hardening state. Under 100 kPa and 200 kPa of vertical stress, the peak strength of the shear stress and strain curve of the soil sample is not obvious; that is, the softening phenomenon is not apparent. When the carbon content is 10%, as shown in Figure 3b, the shear stress and strain curves of the biochar–clay soil with methane oxidizing bacteria under different vertical loads (σv = 100 kPa, σv = 200 kPa, and σv = 400 kPa) have obvious peaks, and the shear strength increases as the vertical normal stress increases. The principle of effective stress can be used to explain this phenomenon; that is, when normal stress increases, the soil particles can be arranged more closely, and the soil’s particle skeleton can resist soil deformation. With the same amount of biochar and a higher vertical normal stress, which indirectly increases the frictional resistance between the soil particles, the compaction effect of the soil sample is more significant. Thus, the greater the sample’s normal stress, the greater its shear strength.
Figure 3 shows the shear stress–strain curve of the mixed soil, from which we can obtain the elastic modulus of the soil sample at the initial approximate elastic stage of the curve. It can be seen from the figure that with an increase in vertical stress, the elastic modulus of the samples with biochar content of 0% and 10% showed a gradually increaing trend.

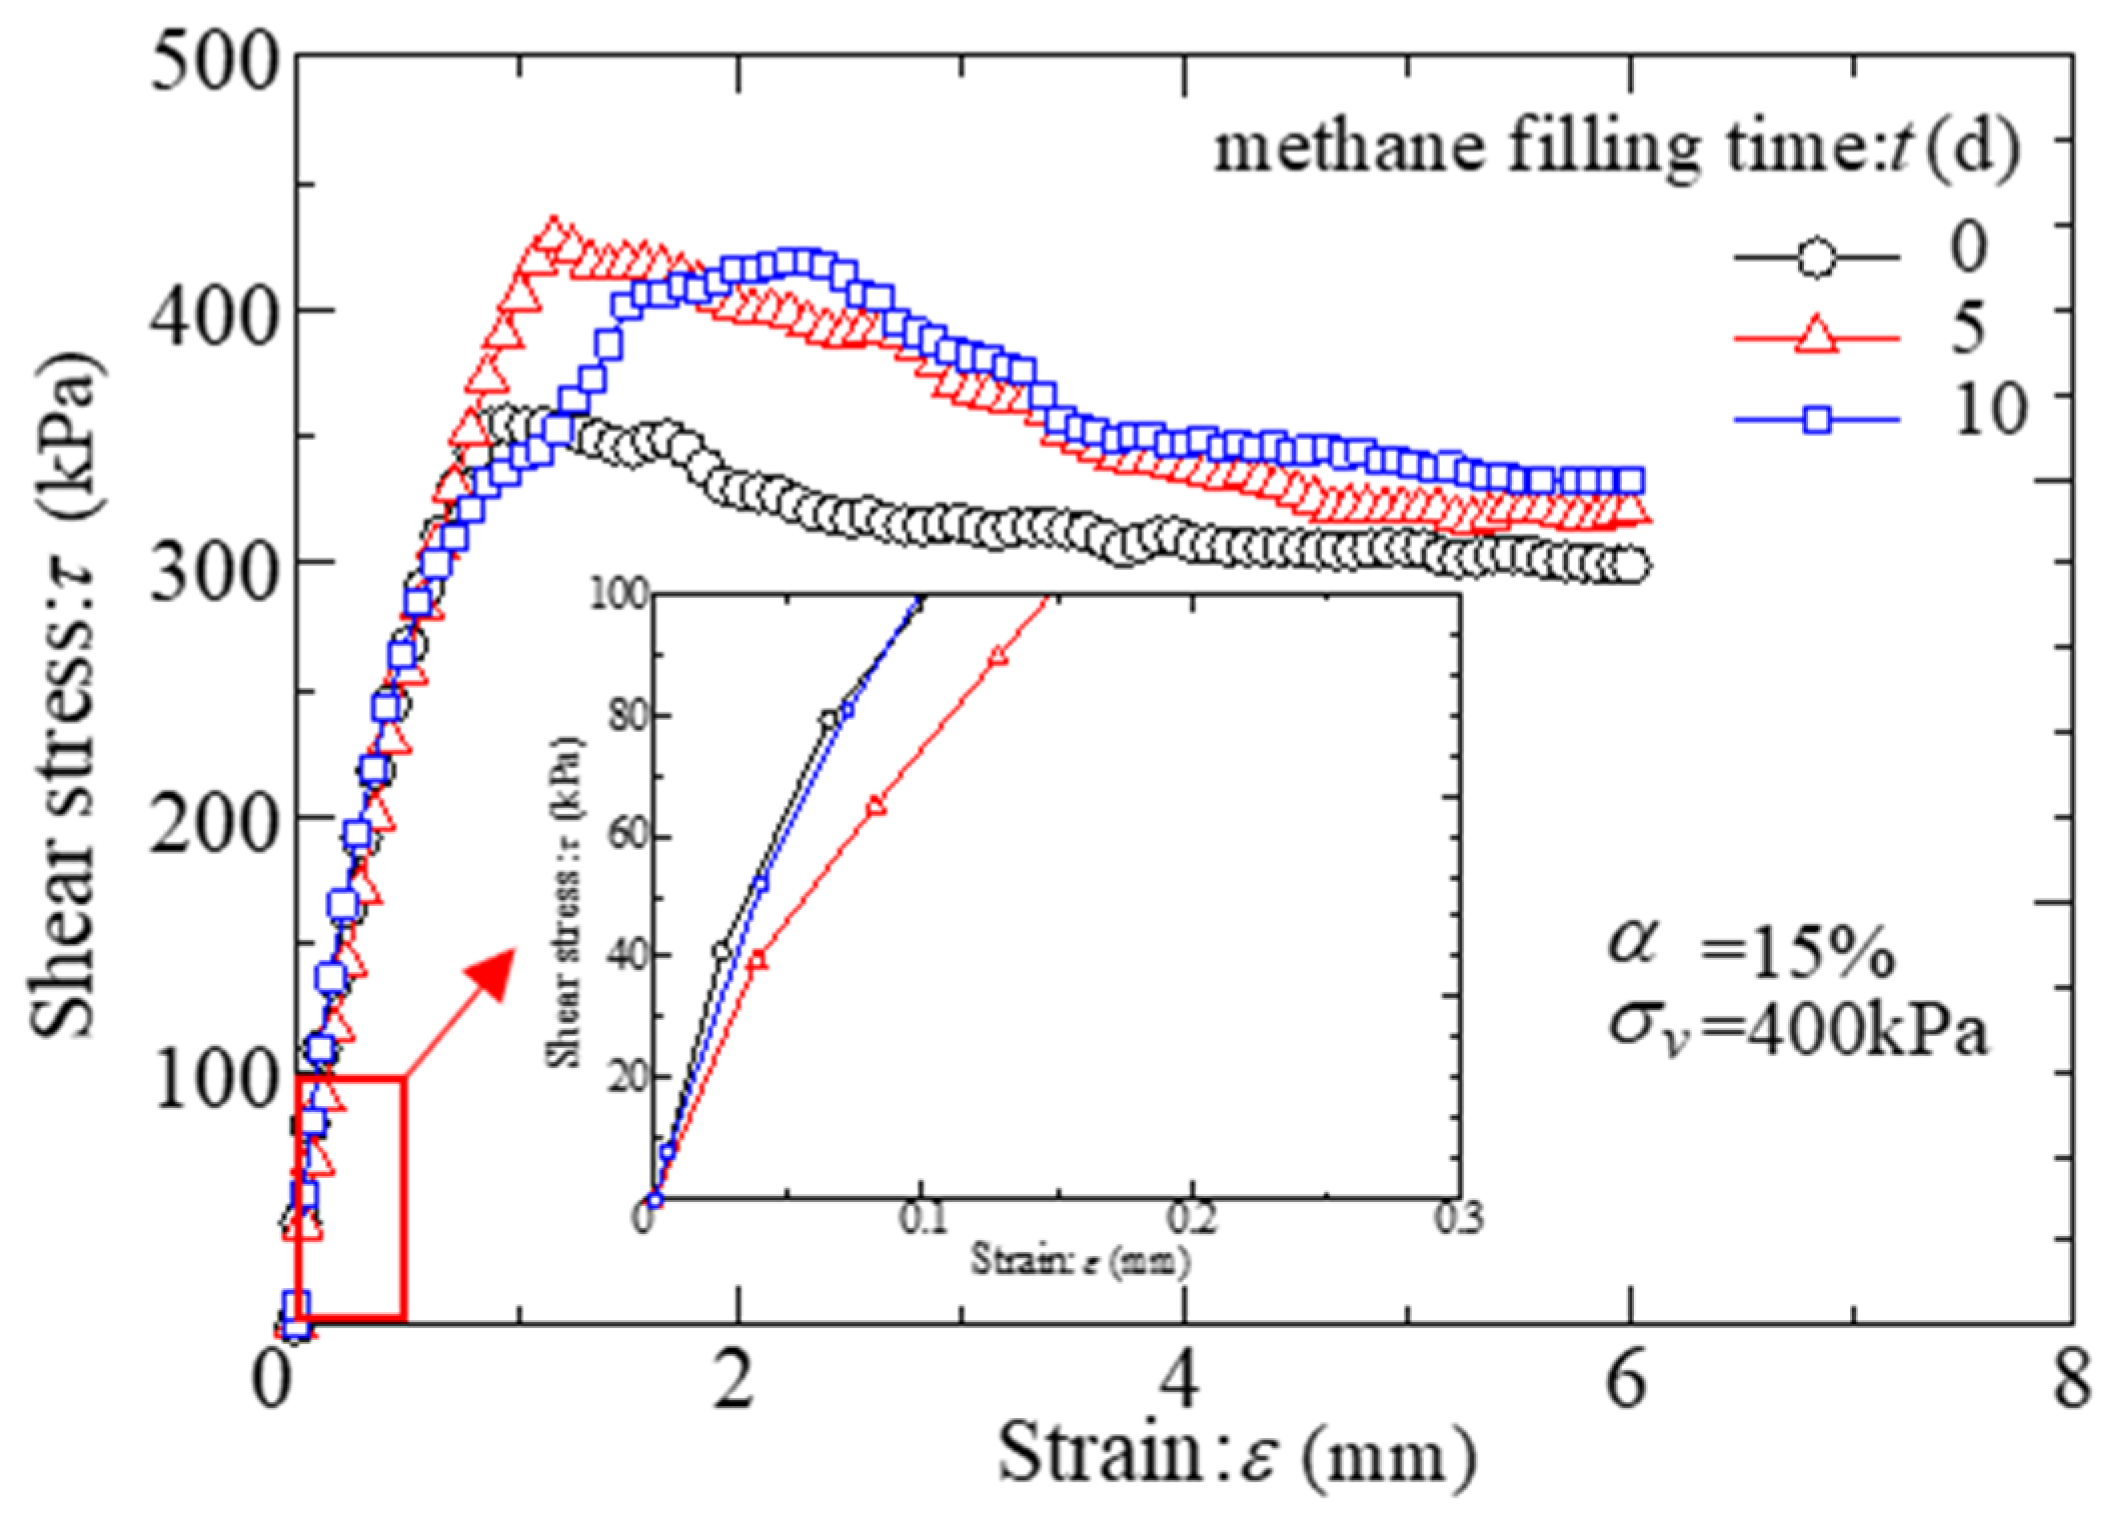
3.2. Effects of Methane Filling Time on the Strength Properties of Biochar–Clay with Methane-Oxidizing Bacteria

Figure 4 shows the relationship between the shear stress and strain of the biochar–clay soil with methane oxidizing bacteria when the biochar content is 15% and the methane filling time is 0 d, 5 d, and 10 d. The figure shows that the stress–strain curves of the soil samples are all strain softening under the biochar content. Under 400 kPa normal stress, the peak strength of the soil samples increased gradually as the methane filling time increased, but the peak strengths of the samples were similar at 5 d and 10 d. The ductility and residual strength of the biochar–clay mixture with methane oxidizing bacteria improved with the methane filling time of 10 days. This is because the longer the methanogenesis time, the more metabolites (extracellular polymers) the methanotrophs produced.

3.3. Effects of Carbon Content in Biochar on the Strength Properties of a Biochar–Clay Mixed Soil with Methane-Oxidizing Bacteria

Figure 5 shows the relationship between the shear stress and strain of biochar–clay mixed soil with methane oxidizing bacteria with various amounts of biochar. It can be seen from the figure that with an increase in biochar, the soil’s stress–strain curve transitioned from strain hardening to strain softening. However, with an increase in the biochar, the small particles fill the voids in the soil and the large particles form carbon–soil and carbon–carbon frameworks. Due to the weak strength of the biochar particles, as the confining pressure increases, the carbon particles are compressed, and the soil’s stress–strain curve peaks, showing strain softening.
Analysis of Figure 5a shows that with an increase in the biochar, the soil’s peak value of the stress–strain curve increases and then decreases. When the biochar content is less than 10%, its particles chiefly fill the voids between the soil particles, compressing the soil sample. Therefore, under the same vertical load, the peak strength of the soil sample increases as the biochar content increases. When the biochar is more than 10%, some of its particles fill the gaps between the soil particles, and some of the carbon particles connect to form a carbon particle skeleton. The strength decreases when the content of biochar is 15%. This experimental phenomenon is consistent with the results of [15,17]; that is, under a certain dry density, the shear strength of the sample does not continuously increase with the increase of the content of biochar.
Analysis of Figure 5b,c shows that the relationship between the shear stress and strain of the soil sample after 10 d of aeration is similar to that after 5 d of aeration, and the peak strength of the soil sample increases with an increase in biochar. The variation law of the peak intensity at this time is different from that at 0 d. Therefore, the soil’s shear strength gradually increases as the curing age increases.

3.4. Effect of Aeration Time on the Shear Strength Index of a Biochar–Clay with Methanotrophs

According to the sample’s peak shear strength under three vertical stresses, the cohesion and internal friction angle of the biochar–clay mixture with methane oxidizing bacteria at various curing times were determined by τ = c + σtanφ, as shown in Figure 6. It can be seen from the Figure 6a that with an increase in the amount of biochar, the internal friction angle of the biochar–clay mix with methane oxidizing bacteria does not change significantly. However, cohesion c increased with an increase in the amount of biochar from the Figure 6b. Therefore, it can be shown that the strength of the biochar–clay mixture with methane oxidizing bacteria depends on the increase in cohesion. Li et al. [27] used microbial-induced calcium carbonate precipitation to solidify and repair contaminated soil. The results showed that when the mineralization time was 10 d, the strength of soil samples was increased by 8.4% compared with untreated soil samples. Moreover, in the literature [3,19], Sadasivam and Reddy attributed the increased internal friction angle in biochar amended soil to the higher organic carbon (OC) in biochar. Similarly, in a previous study on an organically modified clay (bare soil), Bate et al. [28] observed an increase in the internal friction angle with an increase in total OC. Behzadipour et al. [29] proposed the method of microbial-induced calcite precipitation (MICP), in which the calcite nanoparticles produced by MICP increased the granular soil’s internal friction angle and cohesion. The results show that the shear strength of granular soil increases as these two parameters increase. Although MICP increased the cohesion intercept and the angle of internal friction of the specimen, most of the increase in strength was due to the increase in cohesion.

3.5. Influence Mechanism of Strength Properties of Biochar–Clay Mixed Soils with Methanotrophs

Figure 7 shows the biochar–clay mixed soil and methane oxidizing bacteria with a carbon content of 15%. The soil was magnified 1000 times using SEM, and microscopic scanning images at 0 d, 5 d, and 10 d of aeration time were obtained.
It can be seen from the figure that with an increase in aeration time, the microstructure characteristics, such as soil pore size and skeleton morphology, of the soil samples changed with the methane filling time. When the methane oxidizing bacteria were incorporated into the biochar–clay mixed soil on the 0th day, the soil samples with 15% showed two main distribution forms of biochar in the soil. One is that the biochar particles were used to fill the gaps between the clay particles and clay aggregates. The other was that the carbon particle skeleton was formed by mutual contact between the biochar particles. Kong et al. [30] showed that the most probable pore diameter of the standard sand is larger than biochar particle size. Therefore, the pores among sand particles could be filled by biochar. Chen et al. [31] and Wong et al. [14] studied the optimal pore size distribution of clay, which is between 0.01 and 1 μm from the MIP results of clay, that is, the pore size of those pores with maximum probability. Therefore, it can be judged that the biochar acts as the soil skeleton in the mixtures.
Figure 7 shows that the strength characteristics of the biochar–clay mixture with methane-oxidizing bacteria are affected by the biochar content.
It can also be seen from Figure 7b,c that with an increase in methane filling time (5 d and 10 d), the extracellular polymers (such as polysaccharides and proteins), which have strong surface adsorption, good biological flocculation, and stable soil structure, increase the shear strength of the biochar–clay mixture. Hu et al. [32] investigated multi-year-old desert algal crusts, field artificial algal crusts, and indoor artificial algal crusts with different strengths and concluded that the algae in the biological crusts on the desert surface can secrete exopolysaccharides. These bind the loose sand grains to achieve sand fixation and thereby enhance the sand’s strength. To enhance the strength of cohesive–free soils and remediate soil contaminants, Sharma et al. [33] used microbially produced metabolites to show that combining Bacillus sphaericus and Candida for biological treatment can form CaCO3 and PbCO3 in sandy soil, which improves its strength, reduces permeability, and increases the fixation of pollutants. For granular soil, the flocculation of the extracellular polymer tends to make the particles stick together to form larger agglomerates, and the pores’ contact form changes from surface–surface to point–point. Therefore, the pores between the soils increase with an increase in aeration time.

3.6. Analyze the Relationship between Macro Strength Characteristic Change and Microstructure

The results of the macroscopic shear strength test show that the soil’s shear strength can be improved with an increase in the amount of biochar and aeration time. The soil sample’s macro–strength characteristics are related to its microstructure, pore size structure, particle gradation, biochar particle size, relative particle size, and the interaction effect between them. For materials whose clay particle size is larger than that of biochar, the latter is used to fill the pores of the particles and render the particle distribution of the soil sample denser, as shown in Figure 8A. However, when the biochar content is larger than a certain optimal biochar content value, some biochar particles fill the gaps between the soil’s particles, and some form a carbon particle skeleton. It can be seen from the left side of Figure 8B that when the biochar content is greater than 10%, a biochar particle skeleton forms in the soil sample. Converting the biochar’s particle size curve in Figure 1 into a particle size distribution curve, the optimal particle size is about 70 μm. From the MIP results of the clay, it can be seen that the optimal pore size distribution is between 0.01 and 1 μm [34] and that the biochar’s optimal particle is much larger than the clay’s optimal pore size. This shows that the distribution of biochar in clay is chiefly in the form of filling and forming the carbon skeleton. Due to the biochar’s low strength, there is a trend of decreasing peak strength of the mixed soil sample at 0 d (see Figure 4). The reason for this may be that when the aeration time is 0 d, the soil’s bacterial liquid has not played its role. At this time, the strength of the soil sample chiefly includes the force between the soil particles and the biochar particles and the bonding force between them.
Soil is a heterogeneous multiphase system. Its microorganisms are living organic colloids that directly participate in mineral formation and evolution. Therefore, the activities of the microorganisms influence the soil’s macroscopic properties. Zhang et al. [35] suggested that microbial activity can improve the strength of soils with various properties. For clay, the soil strength is chiefly improved by microorganisms and their metabolites.
Bacteria secrete an extracellular polymer during the growth and reproduction process, which changes the soil microstructure. An extracellular polymer, a mushroom-like biofilm structure secreted by bacteria in the process of growth and reproduction, attaches to the surface or around the bacteria. Scholars who study microorganisms generally believe that EPS (extracellular polymeric substance) is relatively complex. Zhurina et al. [36] investigated the role of the extracellular polymer matrix (EPM) components in biofilms. Extracellular polymers widely exist on cell surfaces, have strong surface adsorption and good bioflocculation, can stabilize soil structure [37], and have an important role in the process of microbial mineralization.
It can be seen from the diagram of the microstructure evolution of the biochar–clay mixed soil with bacteria (see Figure 8B) that with an increase in curing time, the metabolites (EPS) in the growth process of the methanotrophic bacteria and the polysaccharide components in EPS have a strong flocculation and cementation effect on the soil particles. To confirm the existence of polysaccharides in the metabolites of the methanotrophs, we performed FTIR spectral scanning on the samples with a biochar content of 0% and 15% after aeration for 10 days. Figure 8C shows a broad transmittance peak between 3610 cm−1 and 3624 cm−1. The assigned functional group is –OH, and the vibrational mode is intramolecular hydrogen bonding [38]. We conclude that sugar nutrients exist in the soil samples. This also supports that the above-mentioned polysaccharides enhance the macroscopic strength of the bacteria-incorporated organism–clay mixture. The SEM image of the aerated biochar–clay mixed soil for 10 days (Figure 8D) shows metabolites produced by methanotrophic bacteria. The products are chiefly distributed in the voids of the soil particles and increase the amount of soil cementation. Therefore, the cohesion value of the aerated 10 d soil sample is larger, as is its shear strength. Chen et al. [31] showed that, in the liquid state, biopolymer solutions are weak gels. Therefore, after curing for 10 days, the sample’s peak strength appeared later due to the bonding effect of this extracellular polymer, which increased the ductility between the soil particles.

4. Conclusions

This study investigated the effects of vertical normal stress, amount of biochar, and methane filling time on the strength characteristics of biochar–clay mixed soil with methane-oxidizing bacteria, and their effect on biochar–clay was explained from a microscopic perspective. The following conclusions are drawn about the mechanism of the strength performance of the mixed soil:
The results show that the vertical normal stress, aeration time, and the biochar content could affect the stress–strain curve and strength characteristics of biochar-amended clay with methane-oxidizing bacteria. As the vertical normal stress on the strength characteristics of a biochar–clay mixed soil with methane-oxidizing bacteria increases, its shear strength also increases. When the aeration time was 0 days, the peak strength of the soil samples increased and then decreased when the biochar content increased. As the aeration time and the amount of biochar increased, the peak intensity of the soil samples increased. The shear strength of a biochar–clay mixed soil with methane-oxidizing bacteria with a carbon content of 15% increases as the aeration time increases. The ductility and residual strength of this soil with an aeration time of 10 days also increased. Combined with SEM, the mechanism of strength change of biochar clay mixed with methane oxidizing bacteria with the increase of aeration time was explained from the microscopic level. The formation of extracellular polymer (polysaccharide) in soil was verified by FTIR scanning.

Author Contributions

Conceptualization, M.L. and Z.C.; methodology, M.L., W.S. and Z.C.; investigation, M.L.; resources, W.S. and Z.C.; writing—original draft preparation, M.L., W.S. and Z.C.; writing—review and editing, M.L.; visualization, Z.C.; supervision, M.L. and Z.C.; funding acquisition, W.S. All authors have read and agreed to the published version of the manuscript.

Funding

This study is financially supported by the National Sciences Foundation of China (Grant No. 41977214).

Institutional Review Board Statement

Not applicable.

Informed Consent Statement

Not applicable.

Data Availability Statement

Not applicable.

Conflicts of Interest

The authors declare no conflict of interest.

References

  1. Solomon, S.; Qin, D.; Manning, M.; Chen, Z.; Marquis, M.; Averyt, K.B.; Tignor, M.; Miller, H.L. (Eds.) Climate Change 2007—The Physical Science Basis: Contribution of Working Group I to the Fourth Assessment Report of the IPCC; Cambridge University Press: New York, NY, USA, 2007. [Google Scholar]
  2. United States Environmental Protection Agency. Available and Emerging Technologies for Reducing Greenhouse Air Emissions from Municipal Solid Waste Landfills; US Environmental Protection Agency: Washington, DC, USA, 2011.
  3. Sadasivam, B.Y.; Reddy, K.R. Engineering properties of waste wood-derived biochars and biochar-amended soils. Int. J. Geotech. Eng. 2015, 9, 521–535. [Google Scholar] [CrossRef]
  4. Moon, K.E.; Lee, S.Y.; Lee, S.H.; Ryu, H.W.; Cho, K.S. Earthworm cast as a promising filter bed material and its methanotrophic contribution to methane removal. J. Hazard. Mater. 2010, 176, 131–138. [Google Scholar] [CrossRef] [PubMed]
  5. Chen, B.; Sun, D.A.; Gao, Y.; Li, J. Experimental study of pore-size distribution of Shanghai soft clay. Rock Soil Mech. 2017, 38, 2523–2530. [Google Scholar] [CrossRef]
  6. Lehmann, J. Bio-energy in the black. Front. Ecol. Environ. 2007, 5, 381–387. [Google Scholar] [CrossRef] [Green Version]
  7. Jeffery, S.; Verheijen, F.G.A. Veldt MVD. Bastos AC. A quantitative review of the effects of biochar application to soils on crop productivity using meta-analysis. Agric. Ecosyst. Environ. 2011, 144, 175–187. [Google Scholar] [CrossRef]
  8. Wong, J.T.F.; Chen, Z.; Ng, C.W.W.; Wong, M.H. Gas permeability of biochar-amended clay: Potential alternative landfill final cover material. Environ. Sci. Pollut. Res. 2016, 23, 7126–7131. [Google Scholar] [CrossRef]
  9. Laird, D.A.; Fleming, P.; Davis, D.; Horton, R.; Wang, B.Q.; Karlen, D.L. Impact of biochar amendments on the quality of a typical Midwestern agricultural soil. Geoderma 2010, 158, 443–449. [Google Scholar] [CrossRef] [Green Version]
  10. Lu, S.G.; Sun, F.F.; Zong, Y.T. Effect of rice husk biochar and coal fly ash on some physical properties of expansive clayey soil. Catena 2014, 114, 37–44. [Google Scholar] [CrossRef]
  11. Zhao, D.; Huang, S.; Huang, J. Effects of biochar on hydraulic parameters and shrinkage-swelling rate of silty clay. Trans. Chin. Soc. Agric. Eng. 2015, 31, 136–143. [Google Scholar] [CrossRef]
  12. Jaafar, N.M.; Clode, P.L.; Abbott, L.K. Microscopy observations of habitable space in biochar for colonization by fungal hyphae from soil. J. Integr. Agric. 2014, 13, 483–490. [Google Scholar] [CrossRef]
  13. Gul, S.; Whalen, J.K.; Thomas, B.W.; Sachdeva, V.; Deng, H. Physico-chemical properties and microbial responses in biochar-amended soils: Mechanisms and future directions. Agric. Ecosyst. Environ. 2015, 206, 46–59. [Google Scholar] [CrossRef]
  14. Wong, J.T.F.; Chen, Z.; Wong, A.Y.Y.; Ng, C.W.W.; Wong, M.H. Effects of biochar on hydraulic conductivity of compacted kaolin clay. Environ. Pollut. 2018, 234, 468–472. [Google Scholar] [CrossRef]
  15. Yaghoubi, P. Development of Biochar-Amended Landfill Cover for Landfill Gas Mitigation; University of Illinois at Chicago: Chicago, IL, USA, 2011. [Google Scholar]
  16. Villagra-Mendoza, K.; Horn, R. Effect of biochar addition on hydraulic functions of two textural soils. Geoderma 2018, 326, 88–95. [Google Scholar] [CrossRef]
  17. Hussain, R.; Ghosh, K.K.; Garg, A.; Ravi, K. Effect of biochar produced from mesquite on the compaction characteristics and shear strength of a clayey sand. Geotech. Geol. Eng. 2021, 39, 1117–1131. [Google Scholar] [CrossRef]
  18. Xu, K.; Yang, B.; Wang, J.; Wu, M.Z. Improvement of mechanical properties of clay in landfill lines with biochar additive. Arab. J. Geosci. 2020, 13, 584. [Google Scholar] [CrossRef]
  19. Reddy, K.R.; Yaghoubi, P.; Yukselen-Aksoy, Y. Effects of biochar amendment on geotechnical properties of landfill cover soil. Waste Manag. Res. 2015, 33, 524–532. [Google Scholar] [CrossRef]
  20. Chang, I.; Im, J.; Cho, G.C. Geotechnical engineering behaviors of gellan gum biopolymer treated sand. Can. Geotech. J. 2016, 53, 1658–1670. [Google Scholar] [CrossRef] [Green Version]
  21. Cabalar, A.F.; Awraheem, M.H.; Khalaf, M.M. Geotechnical properties of a low-plasticity clay with biopolymer. J. Mater. Civ. Eng. 2018, 30, 04018170. [Google Scholar] [CrossRef]
  22. Chen, C.; Wu, L.; Perdjon, M.; Huang, X.Y.; Peng, Y.X. The drying effect on xanthan gum biopolymer treated sandy soil shear strength. Constr. Build. Mater. 2019, 197, 271–279. [Google Scholar] [CrossRef] [Green Version]
  23. ASTM D1762–84; Standard Test Method for Chemical Analysis of Wood Charcoal. ASTM International: West Conshohocken, PA, USA, 2007.
  24. GB 51220; Technical Code for Municipal Solid Waste Sanitary Landfill Closure. China Building Industry Press: Beijing, China, 2017.
  25. Gallé, C. Effect of drying on cement-based materials pore structure as identified by mercury intrusion porosimetry: A comparative study between oven-, vacuum-, and freeze-drying. Cem. Concr. Res. 2001, 31, 1467–1477. [Google Scholar] [CrossRef]
  26. Nian, T.F.; Li, P.; Mao, Y.; Zhang, G.H.; Liu, Y. Connections between chemical composition and rheology of aged base asphalt binders during repeated freeze-thaw cycles. Constr. Build. Mater. 2018, 159, 338–350. [Google Scholar] [CrossRef]
  27. Li, C.; Tian, L.; Dong, C.H.; Zhang, Y.F.; Wang, Y.X. Experimental study on zinc-lead composite contaminated soil solidified/stabilized by MICP technology combined with porous silicon adsorption materials. Rock Soil Mech. 2022, 43, 307–316. [Google Scholar] [CrossRef]
  28. Bate, B.; Zhao, Q.; Burns, S.E. Impact of organic coatings on frictional strength of organically modified clay. J. Geotech. Geoenviron. Eng. 2013, 140, 228–236. [Google Scholar] [CrossRef]
  29. Behzadipour, H.; Pakbaz, M.S.; Ghezelbash, G.R. Effects of bio-cementation on strength parameters of silty and clayey sands. Bioinspired Biomim. Nanobiomater. 2019, 9, 24–32. [Google Scholar] [CrossRef]
  30. Kong, L.M.; Wang, Y.S.; Sun, W.J.; Qi, J.L. Influence of plasticity on unfrozen water content of frozen soils as determined by nuclear magnetic resonance. Cold Reg. Sci. Technol. 2020, 172, 102993. [Google Scholar] [CrossRef]
  31. Chen, M.; Dai, J.; Liu, X.; Kang, Y.; Qin, M.J.; Wang, Z.T. Contribution of pore-throat size distribution to reservoir quality and fluid distributio from NMR and MIP in tight sandy conglomerate reservoirs. Arab. J. Geosci. 2019, 12, 9. [Google Scholar] [CrossRef]
  32. Hu, C.X.; Liu, Y.; Song, L.; Zhang, D.K. Effect of desert soil algae on the stabilization of fine sands. J. Appl. Phycol. 2002, 14, 281–292. [Google Scholar] [CrossRef]
  33. Sharma, M.; Satyam, N.; Reddy, K.R. Strength enhancement and lead immobilization of sand using consortia of bacteria and blue-green algae. J. Hazard. Toxic Radioact. Waste 2020, 24, 04020049. [Google Scholar] [CrossRef]
  34. Sun, W.J.; Li, M.Y.; Zhang, W.J.; Tan, Y.Z. Saturated permeability behavior of biochar-amended clay. J. Soils Sediments 2020, 20, 3875–3883. [Google Scholar] [CrossRef]
  35. Zhang, Y.L.; Yang, P. Research progress in microorganism improving soil properties. Microbiol. China 2014, 41, 2122–2127. [Google Scholar] [CrossRef]
  36. Zhurina, M.V.; Gannesen, A.V.; Zdorovenko, E.L.; Plakunov, V.K. Composition and functions of the extracellular polymer matrix of bacterial biofilms. Microbiology 2014, 83, 713–722. [Google Scholar] [CrossRef]
  37. Ledin, M. Accumulation of metals by microorganisms processes and importance for soil systems. Earth-Sci. Rev. 2000, 51, 1–31. [Google Scholar] [CrossRef]
  38. Senvaitiene, J.; Smirnova, J.; Beganskiene, A.; Kareiva, A. XRD and FTIR characterisation of lead oxide-based pigments and glazes. Acta Chim. Slov. 2007, 54, 185–193. [Google Scholar]
Figure 1. Grain−size distributions of the clay and biochar.
Applsci 12 12954 g001
Figure 2. SEM images of biochar and biochar–clay mixture mixed with methanotrophs. (a) Morphological characteristics of the test biochar. (b) SEM images of biochar–clay mixture mixed with methanotrophs.
Applsci 12 12954 g002
Figure 3. Stress–strain curves of biochar–clay mixtures with methane oxidizing bacteria under various normal stresses: (a) α = 0%, t = 0 d. (b) α = 10%, t = 0 d.
Applsci 12 12954 g003aApplsci 12 12954 g003b
Figure 4. Stress–strain curves of biochar–clay mixed soil under various aeration times.
Applsci 12 12954 g004
Figure 5. Effect of biochar content on a stress–strain curve of biochar–clay with bacteria. (a) σv = 400 kPa, t = 0 d. (b) σv = 400 kPa, t = 5 d. (c) σv = 400 kPa, t = 10 d.
Applsci 12 12954 g005aApplsci 12 12954 g005b
Figure 6. Cohesion force and friction angle of biochar–clay mixed soil with methanotrophs and various biochar content. (a) φα. (b) cα.
Applsci 12 12954 g006
Figure 7. SEM images of biochar–clay mixed soil with bacteria (0 d, 5 d, and 10 d). (a) α = 15%, 1000 times magnification, 0 d. (b) α = 15%, 1000 times magnification, 5 d. (c) α = 15%, 1000 times magnification, 10 d.
Applsci 12 12954 g007
Figure 8. Microstructure and schematic diagram of biochar–clay mixed with bacteria. (A) SEM images of biochar–clay mixed soils with various biochar content: (a) α = 0%; (b) α = 5%; (c) α = 10%; (d) α = 15%. (B) Schematic diagram of the microstructure evolution of the biochar–clay mixed with bacteria. (C) Fourier transform infrared spectroscopy analysis of biochar–clay mixed soil. (D) Fourier transform infrared spectroscopy analysis of biochar–clay mixed soil.
Applsci 12 12954 g008aApplsci 12 12954 g008b
Table 1. Basic physical and chemical indexes of clay and biochar.
Clay
Liquid limit (LL/%)35.98
Plastic limit (PL/%)22.20
Plastic index (PI)13.78
Max. dry density (g/cm3)1.65
Optimum water content wopt (%)22.50
Specific gravity2.67
pH7.70
CEC (cmol kg−1)10.70
Biochar
Specific gravity1.99
Specific surface area (SSA m2/g)385.60
pH10.00
Ash content (%)18.80
Publisher’s Note: MDPI stays neutral with regard to jurisdictional claims in published maps and institutional affiliations.

