Article

Expediting the Search for Climate-Resilient Reef Corals in the Coral Triangle with Artificial Intelligence

by
Anderson B. Mayfield
1,2,*,
Alexandra C. Dempsey
3,
Chii-Shiarng Chen
4,5,6 and
Chiahsin Lin
4,5,6
1
Coral Reef Diagnostics, Miami, FL 33129, USA
2
International Coral Reef Society, Tavernier, FL 33070, USA
3
Khaled bin Sultan Living Oceans Foundation, Annapolis, MD 21403, USA
4
National Museum of Marine Biology and Aquarium, Checheng, Pingtung 944, Taiwan
5
Graduate Institute of Marine Biotechnology, National Dong-Hwa University, Checheng, Pingtung 944, Taiwan
6
Department of Marine Biotechnology and Resources, National Sun Yat-Sen University, Kaohsiung 804, Taiwan
*
Author to whom correspondence should be addressed.
Appl. Sci. 2022, 12(24), 12955; https://doi.org/10.3390/app122412955
Submission received: 21 November 2022 / Revised: 6 December 2022 / Accepted: 13 December 2022 / Published: 16 December 2022
(This article belongs to the Special Issue New Frontiers in Reef Coral Biotechnology)

Abstract

:

Featured Application

We have developed a machine-learning approach for identifying climate-resilient corals in the Solomon Islands.

Abstract

Numerous physical, chemical, and biological factors influence coral resilience in situ, yet current models aimed at forecasting coral health in response to climate change and other stressors tend to focus on temperature and coral abundance alone. To develop more robust predictions of reef coral resilience to environmental change, we trained an artificial intelligence (AI) with seawater quality, benthic survey, and molecular biomarker data from the model coral Pocillopora acuta obtained during a research expedition to the Solomon Islands. This machine-learning (ML) approach resulted in neural network models with the capacity to robustly predict (R2 = ~0.85) a benchmark for coral stress susceptibility, the “coral health index,” from significantly cheaper, easier-to-measure environmental and ecological features alone. A GUI derived from an ML desirability analysis was established to expedite the search for other climate-resilient pocilloporids within this Coral Triangle nation, and the AI specifically predicts that resilient pocilloporids are likely to be found on deeper fringing fore reefs in the eastern, more sparsely populated region of this under-studied nation. Although small in geographic expanse, we nevertheless hope to promote this first attempt at building AI-driven predictive models of coral health that accommodate not only temperature and coral abundance, but also physiological data from the corals themselves.

1. Introduction

Models seeking to predict the fates of coral reefs generally rely on temperature [1,2] and coral cover [3,4,5] alone. At most, coral diversity, algal cover, and fish biomass may also be included [6]. Although this simplistic approach underestimates the complexity of these fragile ecosystems, the fact that extended periods of abnormally high temperatures elicit bleaching in many, if not most, of the world’s corals [7] means that, at km to multi-km scales, models based on temperature alone, such as NOAA’s “Coral Reef Watch” [8], actually have quite high predictive power in terms of forecasting the onset of bleaching in certain areas. However, at smaller spatial scales (cm-km), more heterogeneity may be seen [9], particularly when markedly different reef assemblages exist within close proximity to one another. For instance, an acroporid-dominated reef would likely bleach before and/or more severely than a nearby reef dominated by massive corals [10], though the actual genera of the coral present are excluded from current predictive models. Furthermore, the physiological responses of individual coral colonies do not feature in current models of coral health and resilience. This is despite the fact that even clonemates in close proximity, and presumably exposed to similar seawater conditions, may show distinct responses to environmental change due to, for instance, differences in dinoflagellate communities within the host anthozoans’ tissues [11,12]. Microbial activity, host autofluorescence, and a diverse array of other physiological properties displayed by these multicompartmental holobionts can influence their capacity for acclimatization [13,14] and certainly must account for at least some of the variability in resilience observed during bleaching and disease surveys [15].
It follows, then, that environmental data (e.g., temperature), ecological data (i.e., benthic survey), and physiological data from the corals themselves could be used to devise superior models (vs. temperature alone) that would allow us to predict where resilient corals may be located (Figure 1), yet to date no such comprehensive model has been constructed. The current approach for doing so is generally post-hoc; resilient corals are found in situ during post-bleaching surveys or in the laboratory (inevitably entailing a large amount of research effort to deduce). Given that only a minuscule fraction of Earth’s coral reefs has been surveyed, these reactionary approaches for identifying resilient corals do not yield conservation-oriented data within a timeframe that is commensurate with the dramatic rate at which reefs are being lost. In other words, by the time we find the resilient reefs, many others will have perished. Could we expedite our search for resilient corals by leveraging the immense quantity of data the marine biology field has acquired over these past few decades? As a step towards this goal of “coral reef triage” [16,17], we explored herein a subset of environmental+ecological+coral physiological data collected during the Solomon Islands leg (Figure 2) of the world’s largest-ever coral reef survey, the Khaled bin Sultan Living Oceans Foundation’s (LOF) “Global Reef Expedition” (GRE; [18,19]). We hypothesized that we could probe this “molecules-to-satellites” dataset with an artificial intelligence (AI) developed in JMP® Pro (ver. 16-17; Cary, NC, USA) that would create machine learning (ML) and other predictive models for forecasting the locations and/or environmental conditions in which resilient corals will be found. This involved, for the first time ever, integrating seawater quality, satellite imagery, reef benthic survey, and physiological data (molecular biomarker-derived “stress tests”) from biopsies of the model reef coral Pocillopora acuta sampled from diverse habitats in this vastly under-studied Coral Triangle nation [20].

2. Materials and Methods

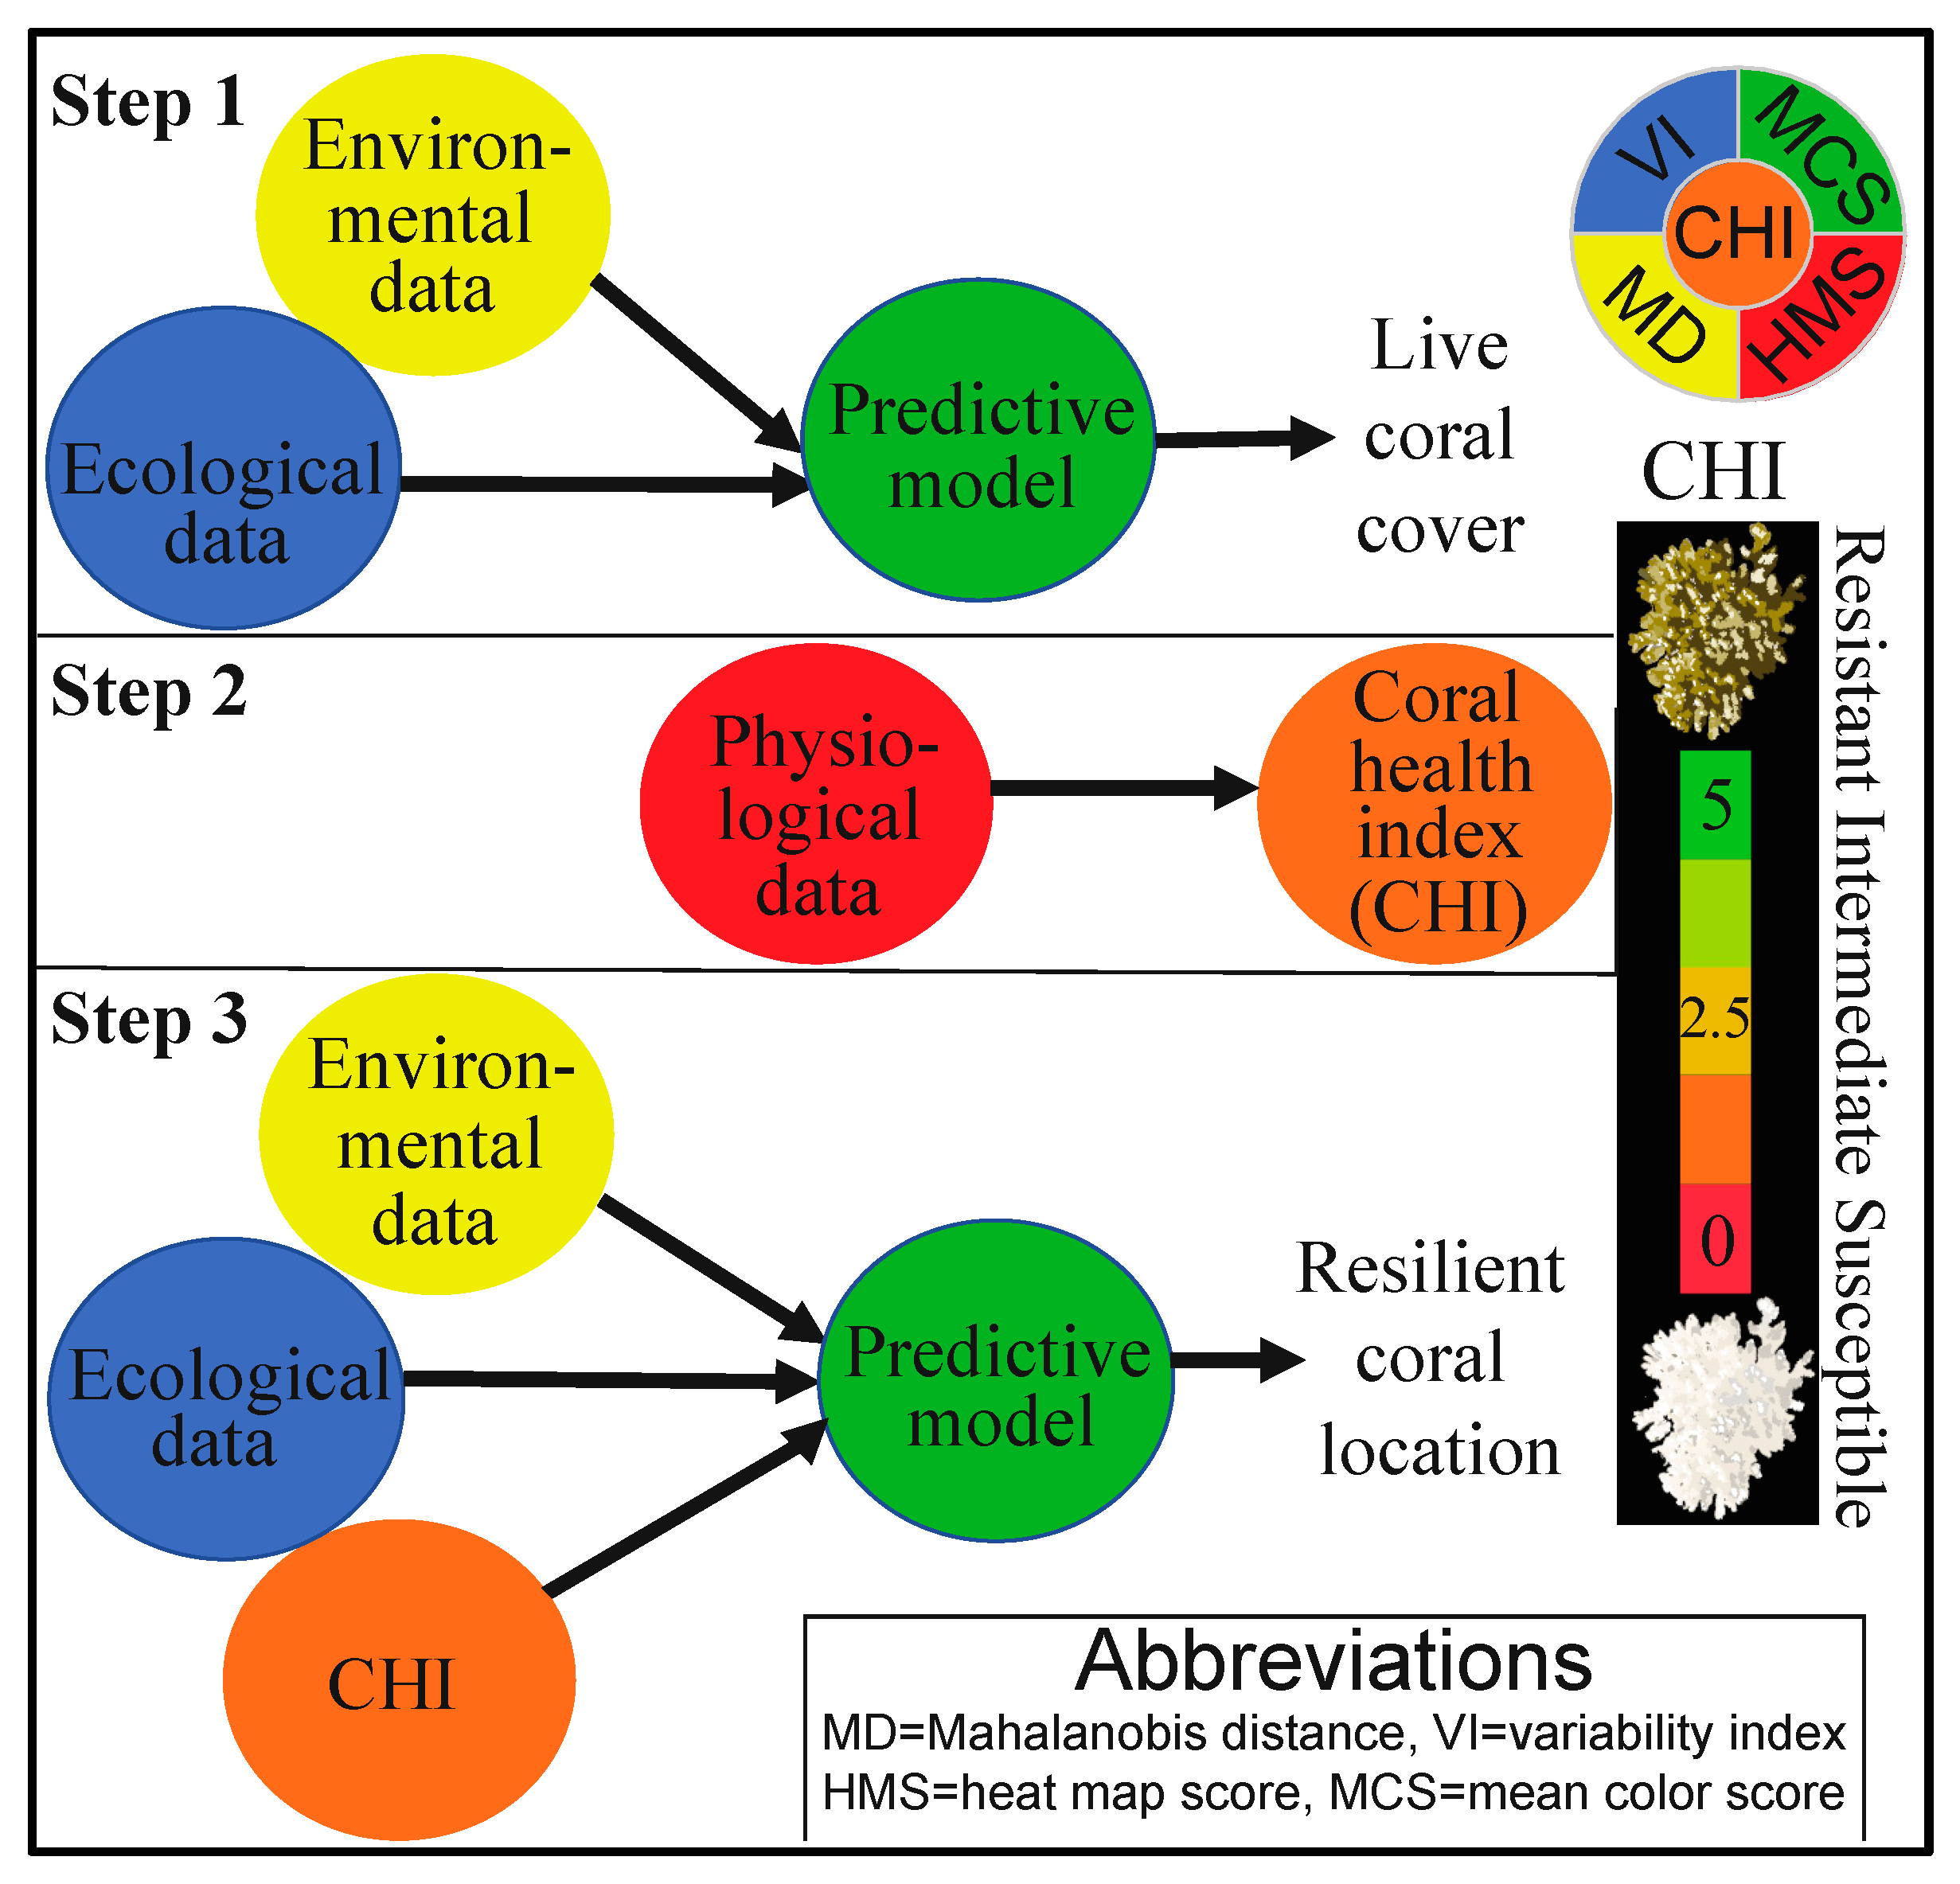
2.1. Overview of Approach

Although some general remarks on the reef survey data are made herein, we generally point readers to the field report [20], as well as a companion article [21], for this information. While the goal of our prior work with this dataset [21] was to develop predictive models of live coral cover (Figure 1-Step 1), there is actually no correlation between coral abundance and resilience [22]. A reef with 100% cover of a weedy species (e.g., Acropora sp.) is no more resilient to climate change than one with a low cover of a resilient one (Porites sp.). We aimed to exploit a diverse array of analytical approaches (Table 1, Tables S1 and S2 [Supplementary File S1]) to instead understand environmental influences on the health and resilience of a model coral, Pocillopora acuta, and develop more holistic predictive models of its resilience. This involved profiling the stress levels of colonies sampled across a diversity of environmental gradients within and among a subset of the study sites (Figure 1-Step 2). Rather than simply presenting a “current baseline” [23,24], we developed a large number of statistical models that sought to predict the environmental and benthic characteristics associated with the most resilient corals in the country. Upon validating these models by withholding data from the AI, we hypothesized that we could devise a robust ML algorithm that could identify locations in which high percentages of resilient corals would be found (Figure 1-Step 3). Not only would such a model be useful for managers looking to triage local conservation efforts, but it could also dramatically cheapen the resilient reef identification process since the response metric used as a proxy for coral resilience, the “coral health index” (CHI; described in detail below), would not need to be measured. Instead, cheaper, more easily obtained survey data could theoretically be used.

2.2. Field Surveys and Sampling

P. acuta colonies were sampled across a range of environmental gradients in the country as described previously [25]. Care was taken to ensure a 10-m separation among colonies to avoid sampling clonemates; however, given that the host genetic analyses [18] resolved species-level differences only, it cannot be ruled out that members of the same clone were sampled on the same reef site in certain instances. Corals were sampled between 5 and 30 m in the vicinity of the benthic surveys, which were undertaken as described previously [20], such that coral physiology could be related to both environmental and ecological characteristics. Please see a prior work [21] for details on these in-water SCUBA diver-based point-intercept transect surveys (merged with simultaneously obtained, diver-based photo-quadrat imagery data) at depths ranging from 5 to 30 m, as well as environmental data collection.
Fourteen environmental parameters were initially hypothesized to influence coral health: island (n = 10; see Figure 2), reef site (n = 69, of which corals were sampled from 33), latitude, longitude, sampling date (n = 19), sampling time (as either morning [<10:00], midday [10:00–14:00], or afternoon [>14:00] for certain analyses), temperature (°C), salinity, reef type (fringing, barrier, or patch reef), reef exposure (protected, intermediately exposed, or exposed), reef location (fore reef or lagoon), lagoon (inside vs. outside), reef emergence (emergent vs. submergent), and depth (m; as continuous or as four bins: <8 m, 8–12 m, 12–18 m, or 18–25 m). Fifty benthic survey categories were observed in the vicinity of the sampled corals (presented as % of total benthic cover): barren substrate (PB), invertebrates (PITS), six algal taxa, and 42 coral genera. See Supplementary File S2 (hereafter the “online supplemental data file” [OSDF]) for a complete list of all taxa, as well as additional abbreviations used in the manuscript’s figures and tables.

2.3. Coral Sample Analysis

RNAs, DNAs, and proteins were extracted from the small (50–100 mg) pocilloporid coral biopsies (n = 110) as in prior works [26,27,28]. It is worth emphasizing that a standard operating procedure was used for all LOF-GRE samples to improve data comparability across research missions. In addition to genotyping the dinoflagellate communities to genus-level and host corals to species-level from the co-extracted DNAs as in prior work [18], 13 additional response variables were measured for each colony: an in situ, qualitative coral health assessment based on pigmentation and disease presence (either “normal” or “abnormal”), maximum colony length (cm), surface area (cm2; via ImageJ analysis of underwater imagery), the Symbiodiniaceae genome copy proportion (GCP; a molecular proxy for dinoflagellate endosymbiont density [29]), the RNA/DNA ratio, and the expression of four Symbiodiniaceae and four host coral genes. The former included the large subunit of ribulose-1,5-bisphosphate carboxylase/oxygenase (rbcL), ubiquitin ligase (ubiq-lig), heat shock protein 90 (hsp90), and zinc-induced facilitator-like 1-like (zifl1l). The coral genes included green fluorescent protein (GFP)-like chromoprotein (gfp-cp), lectin, carbonic anhydrase (ca), and copper-zinc superoxide dismutase (cu-zn-sod); all eight mRNAs have been shown previously to be thermosensitive [30,31]. Since surface area inherently covaries with colony length, it was excluded from the analysis. The qualitative color health assessment data were recoded as 0 and −1 for normal and abnormal colonies, respectively, and these “qualitative color scores” were added to the standardized values of the Symbiodiniaceae GCP (the more quantitative measure of endosymbiont density) for those standardized values between −2 and 2 (the stress tolerance threshold; described below); standardized GCP values ≥2 were first converted to negative values as a penalty for aberrant behavior. In other words, the penalty-weighted and standardized Symbiodiniaceae GCP values were added to the qualitative color scores to create a new response metric called the “mean color score”. Higher values of this parameter were hypothesized to reflect healthier corals. In analyses that featured 12 physiological response variables (see table and figure captions for details.), these included the eight genes, mean color score, RNA/DNA ratio, colony length, and Symbiodiniaceae GCP.
In addition to the mean color score, three additional measures of aberrancy were derived. First, the “heat map score” [32] was calculated. This is simply the summed total of all response variables whose standardized levels fell below two standard deviations below the mean or above two standard deviations above the mean. The response variables included were the Symbiodiniaceae GCP, the RNA/DNA ratio, and the eight target genes. For instance, if a sample’s standardized values (i.e., z-scores) for these parameters were −2.5 (+1), −1.9 (0), −1 (0), 0 (0), 1 (0), 1.2 (0), 1.5 (0), 1.9 (0), 2.3 (+1), and 3 (+1), respectively, it would be given a heat map score of 3. Higher heat map scores are indicative of more stressed corals. To assess intrasample variability, the variability index [33] was calculated. This is simply the standard deviation calculated across the z-scores for the same 10 response variables used for the heat map score calculation, and high variability index scores are hypothesized to be evidence for the loss of control of homeostasis and therefore putative stress. To assess inter-sample aberrancy, the Mahalanobis distance was calculated across the same 10 response variables; as per the variability index, high values (i.e., significant deviation from normal behavior) were presumed to reflect the loss of control of homeostasis.
Since the mean color score scales positively with coral health, and the other three coral health metrics—the heat map score, variability index, and Mahalanobis distance—scale inversely, the z-scores of the latter three were multiplied by −1. These penalized z-scores were then averaged with the mean color score to generate the CHI. The CHI values were converted to cumulative probabilities (0–100%) and then multiplied by five such that values of 0–5 were generated, with 0 and 5 representing the most and least stressed corals, respectively (Figure 1). Further details on this benchmark can be found in another work [34]. For those analyses that featured 16 physiological response variables (see figure and table captions for details.), these included the 12 from the preceding paragraph with the addition of the heat map score, variability index, Mahalanobis distance, and CHI.

2.4. Data Analysis I-Multivariate Physiology

Two approaches were taken to model coral health data. First, a multivariate analysis was undertaken in which the 12–16 physiological response variables were analyzed in tandem as model Y’s. Multi-dimensional scaling (MDS), principal components analysis (PCA), and non-parametric multivariate ANOVA (NP-MANOVA) of each of the 14 environmental parameters were undertaken as described in a prior work [21], except that for the latter, loading scores (n = 4) from a factor analysis (84% of variation explained) were used as Y’s instead of MDS coordinates since we hypothesized that latent variables might explain a portion of the variation in the coral physiological response (α = 0.01). Partial least squares (PLS) was undertaken for each of the two model Y input types (16 physiological response variables and four factor loading scores). Four factorial combinations of the environmental parameters (first-, second-, and third-order factorials, plus a response surface), four factorial combinations of the 50 benthic categories, and four factorial combinations of all 64 environmental + ecological parameters were tested. Note that several of these analyses could not be performed on a computer with only 64 GB of RAM (see Table S1). The 15 factor loading scores from a factor analysis of the benthic data were also considered (all four X modeling schematics analyzed in isolation and with the 14 environmental parameters). In total, 20 PLS models were built for each of the two Y’s (5 groupings of X’s × 4 factorial combinations) for each of three validation types (n = 120 PLS models in total): kfold7, validation column (75% training and 25% validation), and validation with test samples (75, 15, and 10% for training, validation, and test samples, respectively).

2.5. Data Analysis II-CHI

In a simpler analysis (Table 1), the CHI alone was used as the model Y, with the same combinations of environmental and benthic parameters tested with predictor screening (first-order effects for the 14 environmental parameters alone, the 50 benthic categories alone, and all 64 parameters), model screening (first-order effects only for the 14 environmental parameters alone, the 50 benthic categories alone, and all 64 predictors), and PLS (first-, second-, and third-order factorials, as well as a response surface for the 14 environmental parameters; first-order, second-order, and response surface effects for the benthic predictors). The following 11 modeling types were included in the JMP Pro 16 model screen: ordinary least squares, stepwise regression, generalized regression (gen-reg), PLS (NIPALS), decision tree, bootstrap forest, boosted tree, k-nearest neighbors, support vector machines, neural network, and XGBoost. When the model with the highest validation R2 in the model screen was a neural network, a model-tuning GUI described previously [35] was used to generate an additional 1500–3000 models to attempt to boost the R2 by modifying a large number of input parameters (e.g., number of hidden layers). The a priori cutoff considered to be of sufficient predictive power for field coral health diagnostics was 0.80 (corresponding to an accuracy of 80%). For these models, the most important predictor was determined via dependent resampled inputs analysis. As discussed in detail below, the neural network GUIs were rerun post-hoc with a subset of the environmental predictors that would be most useful for planning future research projects.

3. Results and Discussion

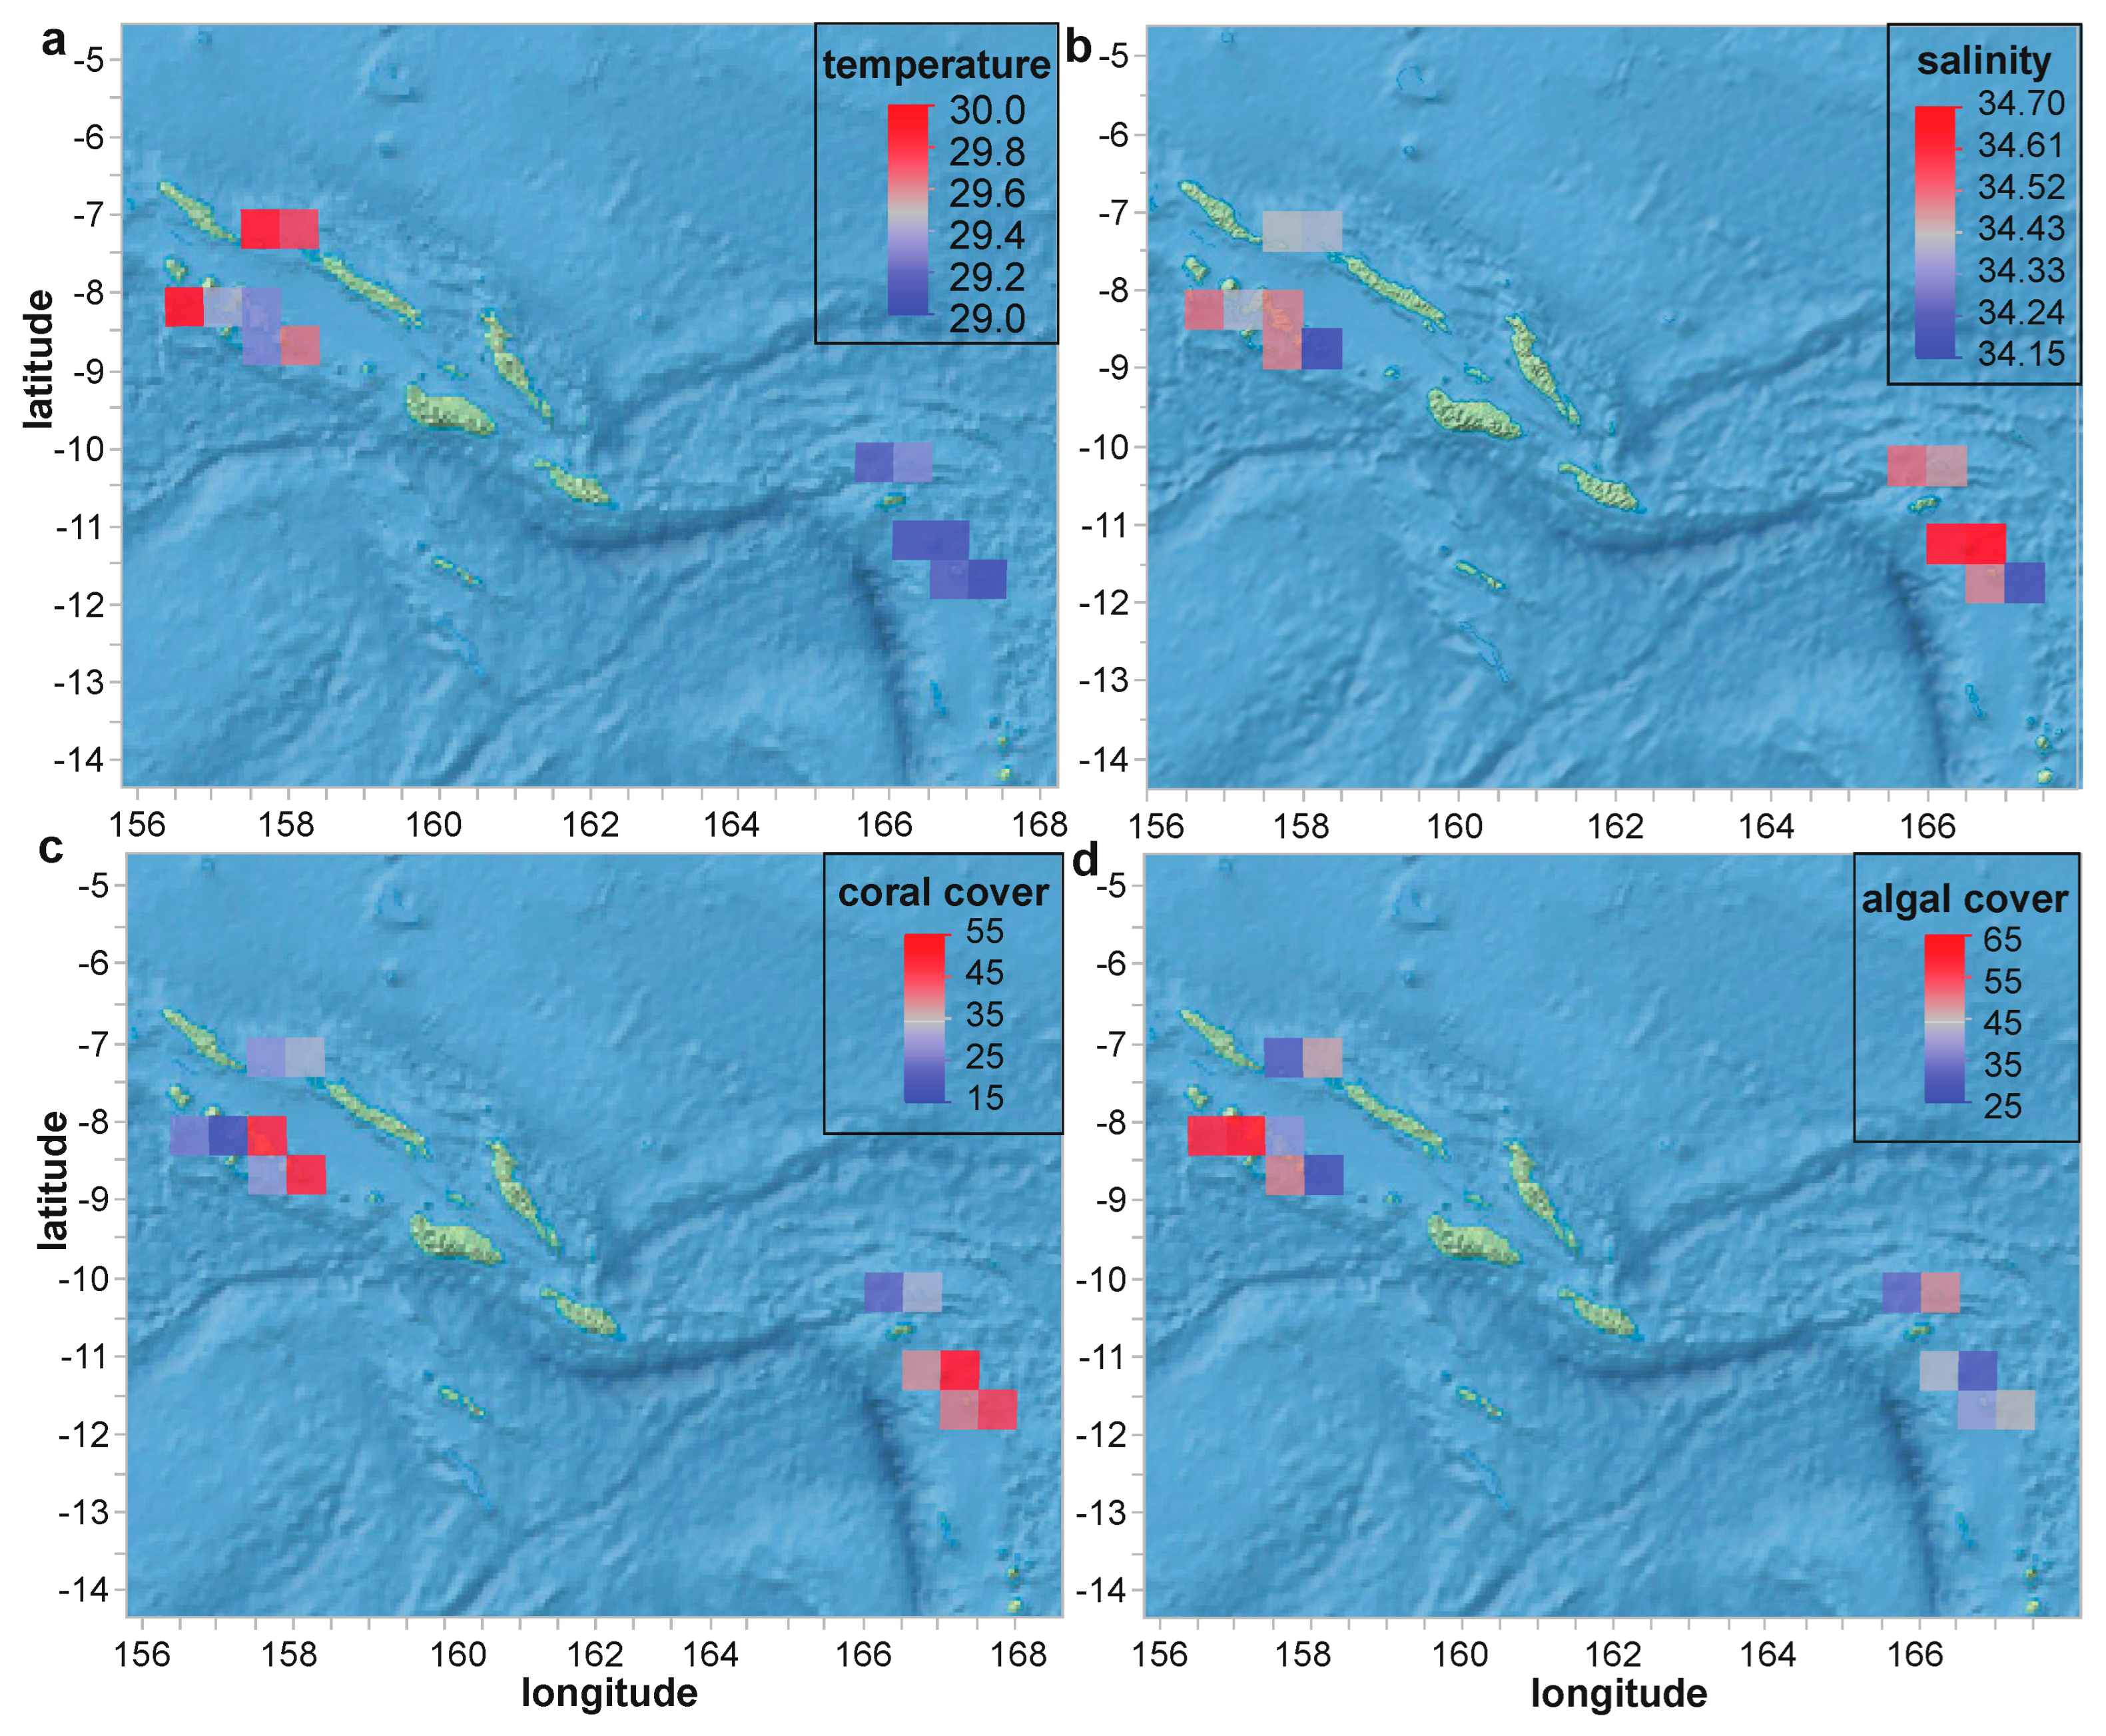
3.1. Overview of the Research Cruise

The LOF science team focused its survey efforts on two major regions of the Solomon Islands archipelago: the more populated western half of the country and the sparsely populated islands of the country’s far east (Figure 2). Given the short-term (one-month) nature of the cruise, neither temperature (Figure 3a) nor salinity (Figure 3b) varied appreciably across the sites or over time (ranges of 28.9–30.9 °C and 34.0–34.8, respectively). Live coral cover (Figure 3c), which is described extensively in a sister article [21], averaged 35% across the 69 survey sites (of which reef corals were sampled from 33), even reaching 84% at one (see OSDF.). Algae was actually more common than coral, averaging 46 ± 19% (std. dev. for this and all other error terms unless noted otherwise). That being said, the mean coral/algae ratio was slightly above one (1.1 ± 1.2). Although it is tempting to link the higher coral cover (and lower algal cover) of the remote, eastern half of the country with its markedly lower number of human inhabitants (see OSDF for population and other demographic data.), we regrettably did not measure key parameters, such as nutrient levels, that could more directly attest to human impacts [36,37]. As mentioned in detail below in the context of the CHI predictive models, nutrient data, and additionally abundance of key coral food sources (e.g., zooplankton [38,39]) should certainly be incorporated, if at all possible, in future such AI modeling analyses of coral health.
Figure 3. Spatial variation in seawater quality (a,b) and general benthic parameters (c,d). Values in (c,d) represent percentages (%) of total benthos.
Applsci 12 12955 g003

3.2. Coral Physiological Data

From a PCA of 12 coral physiological response variables (Figure 4a), a two-dimensional ordination explained nearly 70% of the variation, and MDS (Figure 4b) revealed a strong outlier. Only island and site significantly affected the multivariate coral phenotype (Table 2), and the PLS models of multivariate coral physiology were generally not robust (Table S1). Even those with several thousand predictors (representing various interactions among the environmental and benthic parameters) could explain <60% of the variation in the coral phenotype. For this reason, we have generally focused the remainder of the article on attempting to instead predict a singular coral health metric: the CHI. Over 80,000 predictive models of the CHI were built, with the goal of ultimately using a series of cheaper, easier-to-measure environmental and/or ecological survey parameters to instead assess coral resilience. Reef site explained the highest percentage of spatio-temporal variation in the CHI (37%) of the initial 14 environmental parameters assessed (Figure 4c), with depth as the second most influential parameter.
Table 2. Non-parametric multivariate ANOVA of the effects of the 14 environmental parameters on coral phenotype (as four-factor loading scores derived from a factor analysis of 16 coral physiological response variables). Statistically significant differences (α = 0.01) have been highlighted in bold.
Environmental ParameternFp
 Island102.20<0.01a
 Site331.56<0.01
 Latitude330.980.42
 Longitude333.240.02
 Survey date191.690.16
 Survey time30.780.54
 Survey depth41.310.21
 Reef exposure31.190.31
 Reef type31.940.06
 Lagoon22.360.06
 Reef emergence20.460.76
 Reef location31.850.07
 Temperature130.630.64
 Salinity100.990.42
a Scales with the magnitude of longitudinal distance.
Of the large number of models featuring various combinations of the environmental and ecological parameters (Table 3 and Table S2), in virtually all cases the superior model type for robustly predicting a coral’s CHI was the machine-learning-based neural network. The most parsimonious neural network whose validation (or test) R2 was above the a priori cutoff of 0.8 featured only the 14 environmental parameters in a 1st-order factorial (Table 3 and Figure S1a; R2 = 0.83). The machine-learning-based desirability analysis associated with this model was programmed to output the environmental conditions that would yield the highest theoretical CHI (Figure S1b), and it projected that a relatively deep (28 m), protected, fringing fore reef would be characterized by corals with the highest CHI based on data held back from the model (i.e., validation column data). One other neural network with a single hidden layer (Table 3) was characterized by a higher R2 (0.86), yet it required more boosting (a type of ensemble modeling approach) and so was far more complex with only a modest increase in fit.
Figure 4. Multivariate analysis of the coral physiological data and a predictor screen of the coral health index (CHI). Both principal components analysis (PCA; on correlations; [a]) and multi-dimensional scaling (MDS; on standardized data; [b]) were undertaken with the 12-physiological response variable coral dataset (n = 110 samples). The biplot rays in (a) are as follows: colony length (1), Symbiodiniaceae (Sym) rbcL (2), Sym zifl1l (3), host coral lectin (4), host coral ca (5), host coral gfp-cp (6), RNA/DNA ratio (7), mean coral color score (8), Sym hsp90 (9), host coral cu-zn-sod (10), Sym ubiq-lig (11), and Sym genome copy proportion (GCP; 12). The legend in (a) extends to (b). In the predictor screen of CHI (c), a bootstrap forest model with 100 random trees was used to estimate the contribution of each of the 14 environmental parameters to the CHI.
Applsci 12 12955 g004
Upon adding in the 50 ecological parameters, R2 increased to 0.92 for the best neural network (Table 3 and Figure S2a). The 12 most influential model terms from a dependent resampled inputs algorithm are shown in Figure S2b, and the associated desirability analysis projected that a fore reef in the Reef Islands without the following coral genera would be associated with pocilloporids with the highest CHI: Symphyllia, Montastrea, Leptastrea, and Stylophora. In the case of the latter genus, this is unsurprising since Pocillopora spp. and Stylophora spp. are closely related and known to compete with one another [40]. However, three of the environmental parameters would likely not be of use to managers and future researchers: date (since future surveys would inherently occur on different dates), site (since the goal is to use the model to find other locations with resilient or highly stress-prone corals), and time of day (important for coral molecular physiology but the timescale is not commensurate with a resilience assessment). This is why the two aforementioned neural networks have been shown in Supplementary File S1 only.
Table 3. Environmental and ecological (i.e., benthic) predictors of the coral health index (CHI; sinH-arcsineH [SHASH]-transformed). In all models, CHI was the Y, and first, second, and third-order factorial combinations of the 11–14 environmental parameters and/or 50 ecological predictors were considered. “ENV(14)” = those of Table 2. “ENV(11)” = the former 14 minus site, date, and time of day. The neural network (NN) GUI, models (n > 1500) were run with either one (“HL(1)”) or two (“HL(2)”) hidden layers (HL); with the former, up to 20 boosts were allowed (learning rate: 0.05–0.3). The number of activation nodes ranged from 0 to 4, the weight decay penalty was used, and up to 100 tours were considered. When test samples were used in addition to validation (Val) samples (Val w/test), the test R2 is shown in the “R2” column; all other values represent validation R2 (from 10–20% holdback [HB] or validation column [Val col]-based validation). Models with R2 < 0.8 are instead shown in Table S2. For the predictor screening analysis, the percent variation explained by the most important predictor has been shown in parentheses. Superscripts following text in the “X’s (#)” column correspond to factorial degree (i.e., first-order). NA = not applicable.
X’s (#)Validation TypeModel TypeR2Model DetailsMost Important
Predictor
ENV(11) 1NAPredictor screenNA100 treesSite (45%)
ENV(14) 1NAPredictor screenNA100 trees aSite (37%)
ENV(14) 1Val w testNN GUI-HL(1)0.83TanH(1)-Linear(1)-Gaussian(3)-Boost(6) bLongitude
ENV(14) 120% HBNN GUI-HL(1)0.86TanH(3)-Linear(1)-Gaussian(1)-Boost(11) cDate
ECO(50) 1NAPredictor screenNA100 treesTurf-sediment (19%)
ENV(11)+ECO(50)10% HBNN GUI-HL(1)0.98HL1: TanH(4)-Linear(2)-Gaussian(3)-Boost(8) c,d,eReef emergence
ENV(14)+ECO(50)20% HBNN GUI-HL(1)0.92TanH(4)-Linear(1)-Boost(11) fSite
a See Figure 4c. b See Figure S1a. c Covariates transformed. d Robust fit. e See Python script in the online supplemental data file (OSDF; Supplementary File S2). f See Figure S2a.
We therefore re-ran the ML GUI with the resulting 11 environmental parameters as predictors, and, for those characterized by validation R2 > 0.8, we took the mean value of 9–20 additional simulations. Although several with R2 > 0.8 were uncovered, the means of the simulated runs fell below this value (Table S2). We then combined these 11 environmental parameters with the 50 benthic categories as predictors and re-ran the ML GUI with all 61 predictors. The mean of 20 simulations with a neural network featuring 10% holdback validation was associated with a validation R2 of 0.83 ± 0.13 (Table 3 and Figure 5). Note that the maximum R2 obtained across all simulations (0.98) is instead shown in Table 3. Of the 12 most influential model terms derived from the dependent resampled inputs analysis, several are the same as those of the environmental parameter-only neural network of Figure S1 and the environmental parameter (n = 14) + benthic data neural network of Figure S2. All predict that fore reefs in the eastern region of the country will be characterized by corals with the highest CHI, and both the models of Figure S2 and Figure 5 predict that pocilloporid corals with the highest theoretical CHI will be found in areas with low abundance of Millepora and Alveopora. Perhaps, like Stylophora (mentioned above), corals of these genera actively compete with P. acuta for space on the reef. Indeed, both fire coral and P. acuta occupy similar shallow reef areas in Southern Taiwan (authors’ observations).
The models of Figure S1 and Figure 5 also predict that more resilient corals will be found on submerged vs. emergent reefs; whether this is simply because emergent reefs are more likely to subject corals to stress-inducing periods of aerial exposure periodically remains to be determined. A scientist or conservation practitioner planning a trip to the country, and with limited time and a need for identifying climate-resilient pocilloporids, should therefore seek out deeper fringing submergent fore reefs in the eastern half of the country. In a companion work [21], the theoretical highest live coral cover was also predicted to occur on submerged fringing reefs, albeit at shallower depths (8–12 m). Although seemingly similar to those conditions projected herein for corals with the highest climate resilience, it is important to note that CHI vs. live coral cover, pocilloporid coral cover, and P. acuta cover were associated with R2 values of 0.01, 0.02, and 0.001, respectively (all correlations being slightly negative). Although this is not to say that climate-resilient corals may never be found on reefs with high coral abundance, pocilloporid cover is clearly not a useful predictor of this family’s climate resilience. In much of the Coral Triangle, P. acuta is more commonly found in more stagnant lagoonal environments [18] given its relatively more delicate branches than closely related congenerics (e.g., P. damicornis and P. verrucosa). The fact that more resilient genotypes of this species are predicted to be found on fringing fore reefs, then, was an unexpected finding and could be related to differences in water circulation, food supply, or other undocumented variables. It could also simply be that colonies of this species demonstrate higher resilience when not found in the vicinity of high densities of competitors.

3.3. Caveats and Future Work

It is important to note two caveats. First, the CHI was derived for a single pocilloporid coral species. Models will fundamentally differ for species with different environmental physiologies. Secondly, although the CHI was designed to accommodate a wealth of information on the biology of P. acuta [41,42,43,44], extensive model ground-truthing was not conducted due to the difficulty in accessing the study sites at multiple time points. Return trips, as well as continued engagement with our in-country colleagues and collaborators, will be critical for further model training and validation. For instance, during the warmest times of the year, we will advise these researchers to survey those sites with low predicted CHI values to ensure that the models are indeed accurate in situ using future data. If a bleaching event is expected based on seawater temperature trends, these models also provide managers and future researchers clues as to where to go to find resilient corals likely to survive such events [45]. Specifically, they would want to explore deeper areas (25–30 m) of fringing fore reefs in the country’s far east. The extent and magnitude (severity) of bleaching of corals of differing CHI values during marine heat waves could also be compared to levels projected by temperature-exclusive models, such as NOAA’s Coral Reef Watch, though it is important to note that the approach herein aims to make predictions at the colony-to-reef scale, while Coral Reef Watch predicts at a multi-km scale.
The ML models may have utility not only in bioprospecting for resilient corals [46,47,48,49] but also simply for estimating the CHI in areas currently under study. This is achieved by inserting data into the “simulator” (Figure 6). In the example presented in Figure 6, the depth was changed to 40 m, and the CHI subsequently rose from the mean of 2.5 to 2.7. This tool, which is freely accessible at coralreefdiagnostics.com/environmental-consultation-and-evaluation, could be useful for outputting the optimal environmental parameters [50] for the establishment of a new coral nursery in the Solomon Islands. However, it is important to note that, unless constraints are incorporated, particularly with respect to temperature, the ML-derived desirability analyses tethered to these models may inherently yield environmental conditions that may no longer exist. Even if, for instance, the “optimal temperature” is lower than what will be experienced by the corals in situ, perhaps other environmental properties, including many not measured herein (e.g., food supply [51] or nutrient levels), could be modulated in an effort to foster the resilience of farmed or out-planted corals.

4. Conclusions

Herein we devised a series of ML models known as neural networks to predict an expensive- and difficult-to-derive resilience metric, the CHI, from cheaper, easier-to-measure survey parameters. Although models featuring only very rudimentary environmental parameters that do not necessitate in-water surveys or SCUBA training (e.g., type of reef) failed to yield accuracies that were deemed high enough to have utility in environmental management and bioprospecting for resilient corals, neural networks featuring both environmental data and survey-derived benthic data were of sufficient predictive power to be useful in proactively identifying areas with high densities of climate-resilient P. acuta colonies. This first approach to integrating coral reef data across multiple scales of biological organization within an AI framework for the purpose of predicting shifts in coral health consequently shows promise, though it is important to emphasize that this article describes a single species in an isolated, poorly characterized region of the Coral Triangle. A concerted effort by coral scientists elsewhere (and with additional coral species) will be needed to grow this technological and computational capacity to where it can more robustly inform reef-scale decision making.

Supplementary Materials

The following are available online at https://www.mdpi.com/article/10.3390/app122412955/s1: a Supplementary File S1 including Figures S1 and S2 and Tables S1 and S2, and a tab-delineated file featuring all data presented in the article (Supplementary File S2, i.e., the online supplemental data file [OSDF]).

Author Contributions

Conceptualization, A.B.M. and A.C.D.; methodology, A.B.M. and A.C.D.; software, A.B.M. and A.C.D.; validation, A.B.M. and A.C.D.; formal analysis, A.B.M. and A.C.D.; investigation, A.B.M. and A.C.D.; resources, A.B.M., A.C.D., C.L. and C.-S.C.; data curation, A.B.M. and A.C.D.; writing—original draft preparation, A.B.M.; writing—review and editing, A.B.M., A.C.D., C.L. and C.-S.C.; visualization, A.B.M. and A.C.D.; supervision, A.B.M., A.C.D., C.L. and C.-S.C.; project administration, A.B.M., A.C.D., C.L. and C.-S.C.; funding acquisition, A.B.M., A.C.D., C.L. and C.-S.C. All authors have read and agreed to the published version of the manuscript.

Funding

This work was funded by the Khaled bin Sultan Living Oceans Foundation (A.C.D.). Funds from the Friendly Bear Editorial Service were used for purchasing some laboratory reagents/chemicals. Funds from Taiwan’s Ministry of Science and Technology (MOST) covered the article processing charges (MOST 110-2313-B-291-001-MY3 to C.L.).

Institutional Review Board Statement

Corals were collected under a CITES permit to A.B.M. (EX2014/123) and legally exported from the Solomon Islands to Taiwan under this same permit.

Informed Consent Statement

Not applicable.

Data Availability Statement

The data presented within this article have been coalesced into a single tab-delineated file that is hosted on the website home page for this article (https://www.mdpi.com/article/10.3390/app122412955/s1). All images of the surveyed reefs and sampled corals can be found on coralreefdiagnostics.com, and high-resolution coral habitat maps can be found on maps.lof.org.

Acknowledgments

A.B.M. would like to thank Diedrich Schmidt for designing the machine-learning GUI that permitted the parallel assessment of thousands of AI models on a personal laptop.

Conflicts of Interest

The authors declare no conflict of interest. The funders had no role in the design of the study; in the collection, analyses, or interpretation of data; in the writing of the manuscript, or in the decision to publish the results.

References

  1. Liu, G.; Heron, S.F.; Eakin, C.M.; Muller-Karger, F.E.; Vega-Rodriguez, M.; Guild, L.S.; De La Cour, J.L.; Geiger, E.F.; Skirving, W.J.; Burgess, T.F.R.; et al. Reef-scale thermal stress monitoring of coral ecosystems: New 5-km global products from NOAA Coral Reef Watch. Remote Sens. 2014, 6, 11579–11606. [Google Scholar] [CrossRef] [Green Version]
  2. UNEP. Coral Bleaching Futures—Downscaled Projections of Bleaching Conditions for the World’s Coral Reefs, Implications of Climate Policy and Management Responses; United Nations Environment Programme: Nairobi, Kenya, 2017. [Google Scholar]
  3. Woesik, R.V.; Köksal, S.; Ünal, A.; Cacciapaglia, C.W.; Randall, C.J. Predicting coral dynamics through climate change. Sci. Rep. 2018, 8, 17997. [Google Scholar] [CrossRef] [PubMed] [Green Version]
  4. Sully, S.; Burkepile, D.E.; Donovan, M.K.; Hodgson, G.; van Woesik, R. A global analysis of coral bleaching over the past two decades. Nat. Commun. 2019, 10, 1264. [Google Scholar] [CrossRef] [PubMed] [Green Version]
  5. Quigley, K.M.; van Oppen, M.J.H. Predictive models for the selection of thermally tolerant corals based on offspring survival. Nat. Commun. 2022, 13, 1543. [Google Scholar] [CrossRef]
  6. McClanahan, T.R.; Donner, S.D.; Maynard, J.A.; MacNeil, M.A.; Graham, N.A.; Maina, J.; Baker, A.C.; Alemu I, J.B.; Beger, M.; Campbell, S.J.; et al. Prioritizing key resilience indicators to support coral reef management in a changing climate. PLoS ONE 2012, 7, e42884. [Google Scholar] [CrossRef] [PubMed]
  7. Hughes, T.P.; Kerry, J.T.; Álvarez-Noriega, M. Global warming and recurrent mass bleaching of corals. Nature 2017, 543, 373–377. [Google Scholar] [CrossRef] [PubMed]
  8. Eakin, C.M.; Sweatman, H.P.; Brainard, R.E. The 2014–2017 global-scale coral bleaching event: Insights and impacts. Coral Reefs 2019, 38, 539–545. [Google Scholar] [CrossRef] [Green Version]
  9. Gintert, B.E.; Manzello, D.P.; Enochs, I.C.; Kolodziej, G.; Carlton, R.; Gleason, A.C.R.; Gracias, N. Marked annual coral bleaching resilience of an inshore patch reef in the Florida Keys: A nugget of hope, aberrance, or last man standing? Coral Reefs 2018, 37, 533–547. [Google Scholar] [CrossRef] [Green Version]
  10. McClanahan, T.R.; Darling, E.S.; Maina, J.M.; Muthiga, N.A.; D’agata, S.; Leblond, J.; Arthur, R.; Jupiter, S.D.; Wilson, S.K.; Mangubhai, S.; et al. Highly variable taxa-specific coral bleaching responses to thermal stresses. Mar. Ecol. Prog. Ser. 2020, 648, 135–151. [Google Scholar] [CrossRef]
  11. Keshavmurthy, S.; Meng, P.J.; Wang, J.T.; Kuo, C.Y.; Yang, S.Y.; Hsu, C.M.; Gan, C.H.; Dai, C.F.; Chen, C.A. Can resistant coral-Symbiodinium associations enable coral communities to survive climate change? A study of a site exposed to long-term hot water input. Peer J. 2014, 2, e327. [Google Scholar] [CrossRef]
  12. Rubin, E.; Enochs, I.C.; Foord, C.; Kolodziej, G.; Basden, I.; Manzello, D.P.; Mayfield, A.B. Molecular mechanisms of coral persistence within highly urbanized locations in the Port of Miami, Florida. Front. Mar. Sci. 2021, 8, 695236. [Google Scholar] [CrossRef]
  13. Mayfield, A.B. Uncovering spatio-temporal and treatment-derived differences in the molecular physiology of a model coral-dinoflagellate mutualism with multi-variate statistical approaches. J. Mar. Sci. Eng. 2016, 4, 63. [Google Scholar] [CrossRef] [Green Version]
  14. Putnam, H.M.; Mayfield, A.B.; Fan, T.Y.; Chen, C.S.; Gate, R.D. The physiological and molecular responses of larvae from the reef-building coral Pocillopora damicornis exposed to near-future increases in temperature and pCO2. Mar. Biol. 2013, 160, 2157–2173. [Google Scholar] [CrossRef]
  15. Cruz-García, R.; Rodríguez-Troncoso, A.P.; Rodríguez-Zaragoza, F.A.; Cupul-Magaña, A.L.; Mayfield, A.B. Ephemeral effects of El Niño southern oscillation events on an eastern tropical Pacific coral community. Mar. Freshw. Res. 2020, 71, 1259–1268. [Google Scholar] [CrossRef]
  16. Mayfield, A.B.; Chen, C.S. Enabling coral reef triage via molecular biotechnology and artificial intelligence. Platax 2019, 16, 23–47. [Google Scholar]
  17. Mayfield, A.B. Exploiting the power of multivariate statistics for probing the cellular biology of thermally challenged reef corals. Platax 2020, 17, 27–52. [Google Scholar]
  18. Mayfield, A.B.; Chen, C.S.; Dempsey, A.C.; Bruckner, A.W. The molecular ecophysiology of closely related pocilloporids from the South Pacific: A case study from the Austral and Cook Islands. Platax 2016, 13, 1–25. [Google Scholar]
  19. Mayfield, A.B.; Dempsey, A.C. Environmentally-driven physiological variation in a New Caledonian reef coral. Oceans 2022, 3, 15–29. [Google Scholar] [CrossRef]
  20. Bruckner, A.W. Global Reef Expedition: Solomon Islands; Field Report; Khaled bin Sultan Living Oceans Foundation: Landover, MD, USA, 2015; 39p. [Google Scholar]
  21. Mayfield, A.B.; Dempsey, A.C.; Chen, C.S. Predicting the abundance of corals from simple environmental predictors with a machine-learning approach. Platax 2022, 19, 1–24. [Google Scholar]
  22. Mayfield, A.B.; Tsai, S.; Lin, C. The Coral Hospital. Biopreserv. Biobank. 2019, 17, 355–369. [Google Scholar] [CrossRef]
  23. Rodríguez-Troncoso, A.P.; Rodríguez-Zaragoza, F.A.; Mayfield, A.B.; Cupul-Magaña, A.L. Temporal variation in invertebrate recruitment on an Eastern Pacific coral reef. J. Sea Res. 2019, 145, 8–15. [Google Scholar] [CrossRef]
  24. Mayfield, A.B.; Chen, C.S. A coral transcriptome in the Anthropocene as an “alternative stable state”. Platax 2020, 17, 1–26. [Google Scholar]
  25. Mayfield, A.B.; Bruckner, A.W.; Chen, C.H.; Chen, C.S. A survey of pocilloporids and their endosymbiotic dinoflagellate communities in the Austral and Cook Islands of the South Pacific. Platax 2015, 12, 1–17. [Google Scholar]
  26. Mayfield, A.B.; Chen, C.S.; Dempsey, A.C. Biomarker profiling in reef corals of Tonga’s Ha’apai and Vava’u Archipelagos. PLoS ONE 2017, 12, e0185857. [Google Scholar] [CrossRef] [Green Version]
  27. Mayfield, A.B.; Chen, C.S.; Dempsey, A.C. Identifying corals displaying aberrant behavior in Fiji’s Lau Archipelago. PLoS ONE 2017, 12, e0177267. [Google Scholar] [CrossRef] [PubMed] [Green Version]
  28. Mayfield, A.B.; Chen, C.S.; Dempsey, A.C. The molecular ecophysiology of closely related pocilloporid corals of New Caledonia. Platax 2017, 14, 1–45. [Google Scholar]
  29. Mayfield, A.B.; Hirst, M.B.; Gates, R.D. Gene expression normalization in a dual-compartment system: A real-time PCR protocol for symbiotic anthozoans. Mol. Ecol. Res. 2009, 9, 462–470. [Google Scholar] [CrossRef]
  30. Mayfield, A.B.; Chen, C.S.; Liu, P.J. Decreased green fluorescent protein-like chromoprotein gene expression in specimens of the reef-building coral Pocillopora damicornis undergoing high temperature-induced bleaching. Platax 2014, 11, 1–23. [Google Scholar]
  31. Mayfield, A.B.; Wang, Y.B.; Chen, C.S.; Chen, S.H.; Lin, C.Y. Compartment-specific transcriptomics in a reef-building coral exposed to elevated temperatures. Mol. Ecol. 2014, 23, 5816–5830. [Google Scholar] [CrossRef] [Green Version]
  32. Mayfield, A.B.; Chen, C.S.; Dempsey, A.C. Modeling environmentally-mediated variation in reef coral physiology. J. Sea Res. 2019, 145, 44–54. [Google Scholar] [CrossRef]
  33. Mayfield, A.B.; Dempsey, A.C.; Inamdar, J.; Chen, C.S. A statistical platform for assessing coral health in an era of changing global climate-I: A case study from Fiji’s Lau Archipelago. Platax 2018, 15, 1–35. [Google Scholar]
  34. Mayfield, A.B.; Dempsey, A.C.; Chen, C.S. Assessing coral health in the Kingdom of Tonga with a coral health index. Platax 2021, 18, 53–78. [Google Scholar]
  35. Mayfield, A.B. Machine-learning-based proteomic predictive modeling with thermally-challenged Caribbean reef corals. Diversity 2022, 14, 33. [Google Scholar] [CrossRef]
  36. Chen, C.C.; Hsieh, H.Y.; Mayfield, A.B.; Chang, C.M.; Wang, J.T.; Meng, P.J. The key impact of water quality on the coral reefs of Kenting National Park. J. Mar. Sci. Eng. 2022, 10, 270. [Google Scholar] [CrossRef]
  37. Lin, H.J.; Lee, C.L.; Peng, S.E.; Hung, M.C.; Liu, P.J.; Mayfield, A.B. Anthropogenic nutrient enrichment may exacerbate the impacts of El Niño-Southern Oscillation (ENSO) events on intertidal seagrass beds. Glob. Chang. Biol. 2018, 24, 4566–4580. [Google Scholar] [CrossRef]
  38. Huang, Y.L.; Mayfield, A.B.; Fan, T.Y. Effects of feeding on the physiological performance of the stony coral Pocillopora acuta. Sci. Rep. 2020, 10, 19988. [Google Scholar] [CrossRef]
  39. Lin, C.; Tsai, S.; Mayfield, A.B. Physiological differences between cultured and wild coral eggs. Biopreserv. Biobank. 2019, 17, 370–371. [Google Scholar] [CrossRef]
  40. Horwitz, R.; Hoogenboom, M.; Fine, M. Spatial competition dynamics between reef corals under ocean acidification. Sci. Rep. 2017, 7, 40288. [Google Scholar] [CrossRef]
  41. Mayfield, A.B.; Fan, T.Y.; Chen, C.S. Physiological acclimation to elevated temperature in a reef-building coral from an upwelling environment. Coral Reefs 2013, 32, 909–921. [Google Scholar] [CrossRef]
  42. Mayfield, A.B.; Fan, T.Y.; Chen, C.S. Real-time PCR-based gene expression analysis in the model reef-building coral Pocillopora damicornis: Insight from a salinity stress study. Platax 2013, 10, 1–29. [Google Scholar]
  43. Mayfield, A.B.; Chen, Y.J.; Lu, C.Y.; Chen, C.S. The proteomic response of the reef coral Pocillopora acuta to experimentally elevated temperature. PLoS ONE 2018, 13, e0192001. [Google Scholar] [CrossRef] [PubMed]
  44. McRae, C.; Mayfield, A.B.; Fan, T.Y.; Huang, W.B.; Cote, I. Differing proteomic responses to high-temperature exposure between adult and larval reef corals. Front. Mar. Sci. 2021, 8, 716124. [Google Scholar] [CrossRef]
  45. Enochs, I.C.; Formel, N.; Manzello, D.P.; Morris, J.; Mayfield, A.B.; Boyd, A.; Kolodziej, G.; Adams, G. Coral persistence despite extreme periodic pH fluctuations at a volcanically acidified Caribbean reef. Coral Reefs 2020, 39, 523–528. [Google Scholar] [CrossRef]
  46. Mayfield, A.B.; Wang, L.H.; Tang, P.C.; Hsiao, Y.Y.; Fan, T.Y.; Tsai, C.L.; Chen, C.S. Assessing the impacts of experimentally elevated temperature on the biological composition and molecular chaperone gene expression of a reef coral. PLoS ONE 2011, 6, e26529. [Google Scholar] [CrossRef] [Green Version]
  47. Mayfield, A.B. Proteomic signature of corals from thermodynamic reefs. Microorganisms 2020, 8, 1171. [Google Scholar] [CrossRef]
  48. Mayfield, A.B.; Aguilar, C.; Enochs, I.C.; Kolodziej, G.; Manzello, D.P. Shotgun proteomics of thermally challenged Caribbean reef corals. Front. Mar. Sci. 2021, 8, 660153. [Google Scholar] [CrossRef]
  49. Mayfield, A.B.; Chan, P.H.; Putnam, H.M.; Chen, C.S.; Fan, T.Y. The effects of a variable temperature regime on the physiology of the reef-building coral Seriatopora hystrix: Results from a laboratory-based reciprocal transplant. J. Exp. Biol. 2012, 215, 4183–4195. [Google Scholar] [CrossRef] [Green Version]
  50. Chen, T.Y.; Hwang, G.W.; Lin, H.J.; Mayfield, A.B.; Chen, C.P. The development of a habitat suitability model for sub-tropical tidal flat fiddler crabs. Ocean Coast. Manag. 2019, 182, 104931. [Google Scholar] [CrossRef]
  51. Chang, T.C.; Mayfield, A.B.; Fan, T.Y. Culture systems influence the physiological performance of the soft coral Sarcophyton glaucum. Sci. Rep. 2020, 10, 20200. [Google Scholar] [CrossRef]
Figure 1. A schematic of the approach. First (Step 1), the environmental and ecological (benthic) data (model X’s) were used to develop a predictive model for coral cover (model Y; discussed in a sister manuscript [21]). The coral physiological data were next used to calculate the “coral health index” (CHI; Step 2). Finally, the CHI data were co-analyzed with the environmental and ecological data to develop a model capable of predicting where resilient corals can be found through a machine-learning “desirability analysis” (Step 3). The relative scale of the CHI (0–5) has been shown as an inset to the right.
Applsci 12 12955 g001
Figure 2. Map of the Solomon Islands with mean “coral health index” (CHI) scores plotted. The upper left, upper right, lower left, lower right, and center wedges of the pie graphs represent the variability index (VI), mean color score (MCS), Mahalanobis distance (MD), heat map score (HMS), and CHI, respectively (as depicted in the Malakobi pie graph).
Applsci 12 12955 g002
Figure 5. A desirability analysis derived from a neural network for predicting the coral health index (CHI) from both 11 environmental (ENV) parameters and 50 benthic surveys (ECO) parameters. Since the neural network was so complex (TanH(4)-Linear(2)-Gaussian(3)-Boost(8) with covariates transformed [single hidden player]), the Python script needed to reproduce it is shown in the online supplemental data file with a crude, low-resolution approximation showing the underlying structure (Supplementary File 2). Ten percent of coral samples were randomly excluded from the model and then used as validation samples (validation R2 = 0.82 and mean absolute deviation = 0.33). The highest plotted values in each of the sub-panels represent the condition in which the CHI was maximized; only the 12 most influential predictors have been shown (based on a dependent resampled inputs algorithm), and they are presented in order of model influence, from most (top-left) to least (bottom-right) important. Note that the maximum CHI of 6.3 is technically beyond the highest value of this parameter (Figure 1).
Applsci 12 12955 g005
Figure 6. JMP® Pro’s “simulator,” which allows users to input data from their study reefs and then calculate a theoretical coral health index (CHI) score. In this example, the depth was increased to 40 m, causing the predicted CHI value to increase from the local mean of 2.5 to 2.67. A manager in the Solomon Islands can modify the input parameters of reef areas of interest, and the AI will update the theoretical CHI accordingly. This GUI is hosted at https://coralreefdiagnostics.com/environmental-consultation-and-evaluation.
Applsci 12 12955 g006
Table 1. Environmental (ENV) effects on coral physiology. For the multivariate analyses, either all coral physiological response variables (PRV) were considered (“16 PRV” or “12 PRV,” depending on the analysis) or the factor loading scores derived from a factor analysis of these PRV were analyzed (“4 PRV factors,” which explained 84% of the variation). In addition to all 50 benthic categories found in the vicinity of the sampled corals (“ECO”), the 15-factor loading scores from a factor analysis of the benthic data were also considered (“ECO(15)”). Those NIPALS (non-iterative partial least squares [PLS]) models whose PRESS was minimized with zero factors (i.e., no statistically meaningful conclusion) are instead found in Tables S1 and S2 (Supplementary File S1) for the multivariate and univariate (coral health index [CHI]) data, respectively. Superscripts following values in the “Model X’s” column denote the factorial degree (1st, 2nd, or 3rd). HB = holdback. HL = hidden layer. MDS = multi-dimensional scaling. NA = not applicable. NN = neural network. NP-MANOVA = non-parametric multivariate ANOVA. PCA = principal components analysis. RS = response surface. Val col = validation column. Val w/test = both validation and test data columns used for validation.
Model/Analysis TypeModel Y(’s)Model X’sValidation TypeData Location
CORAL PHYSIOLOGICAL DATASET EXPLORATION
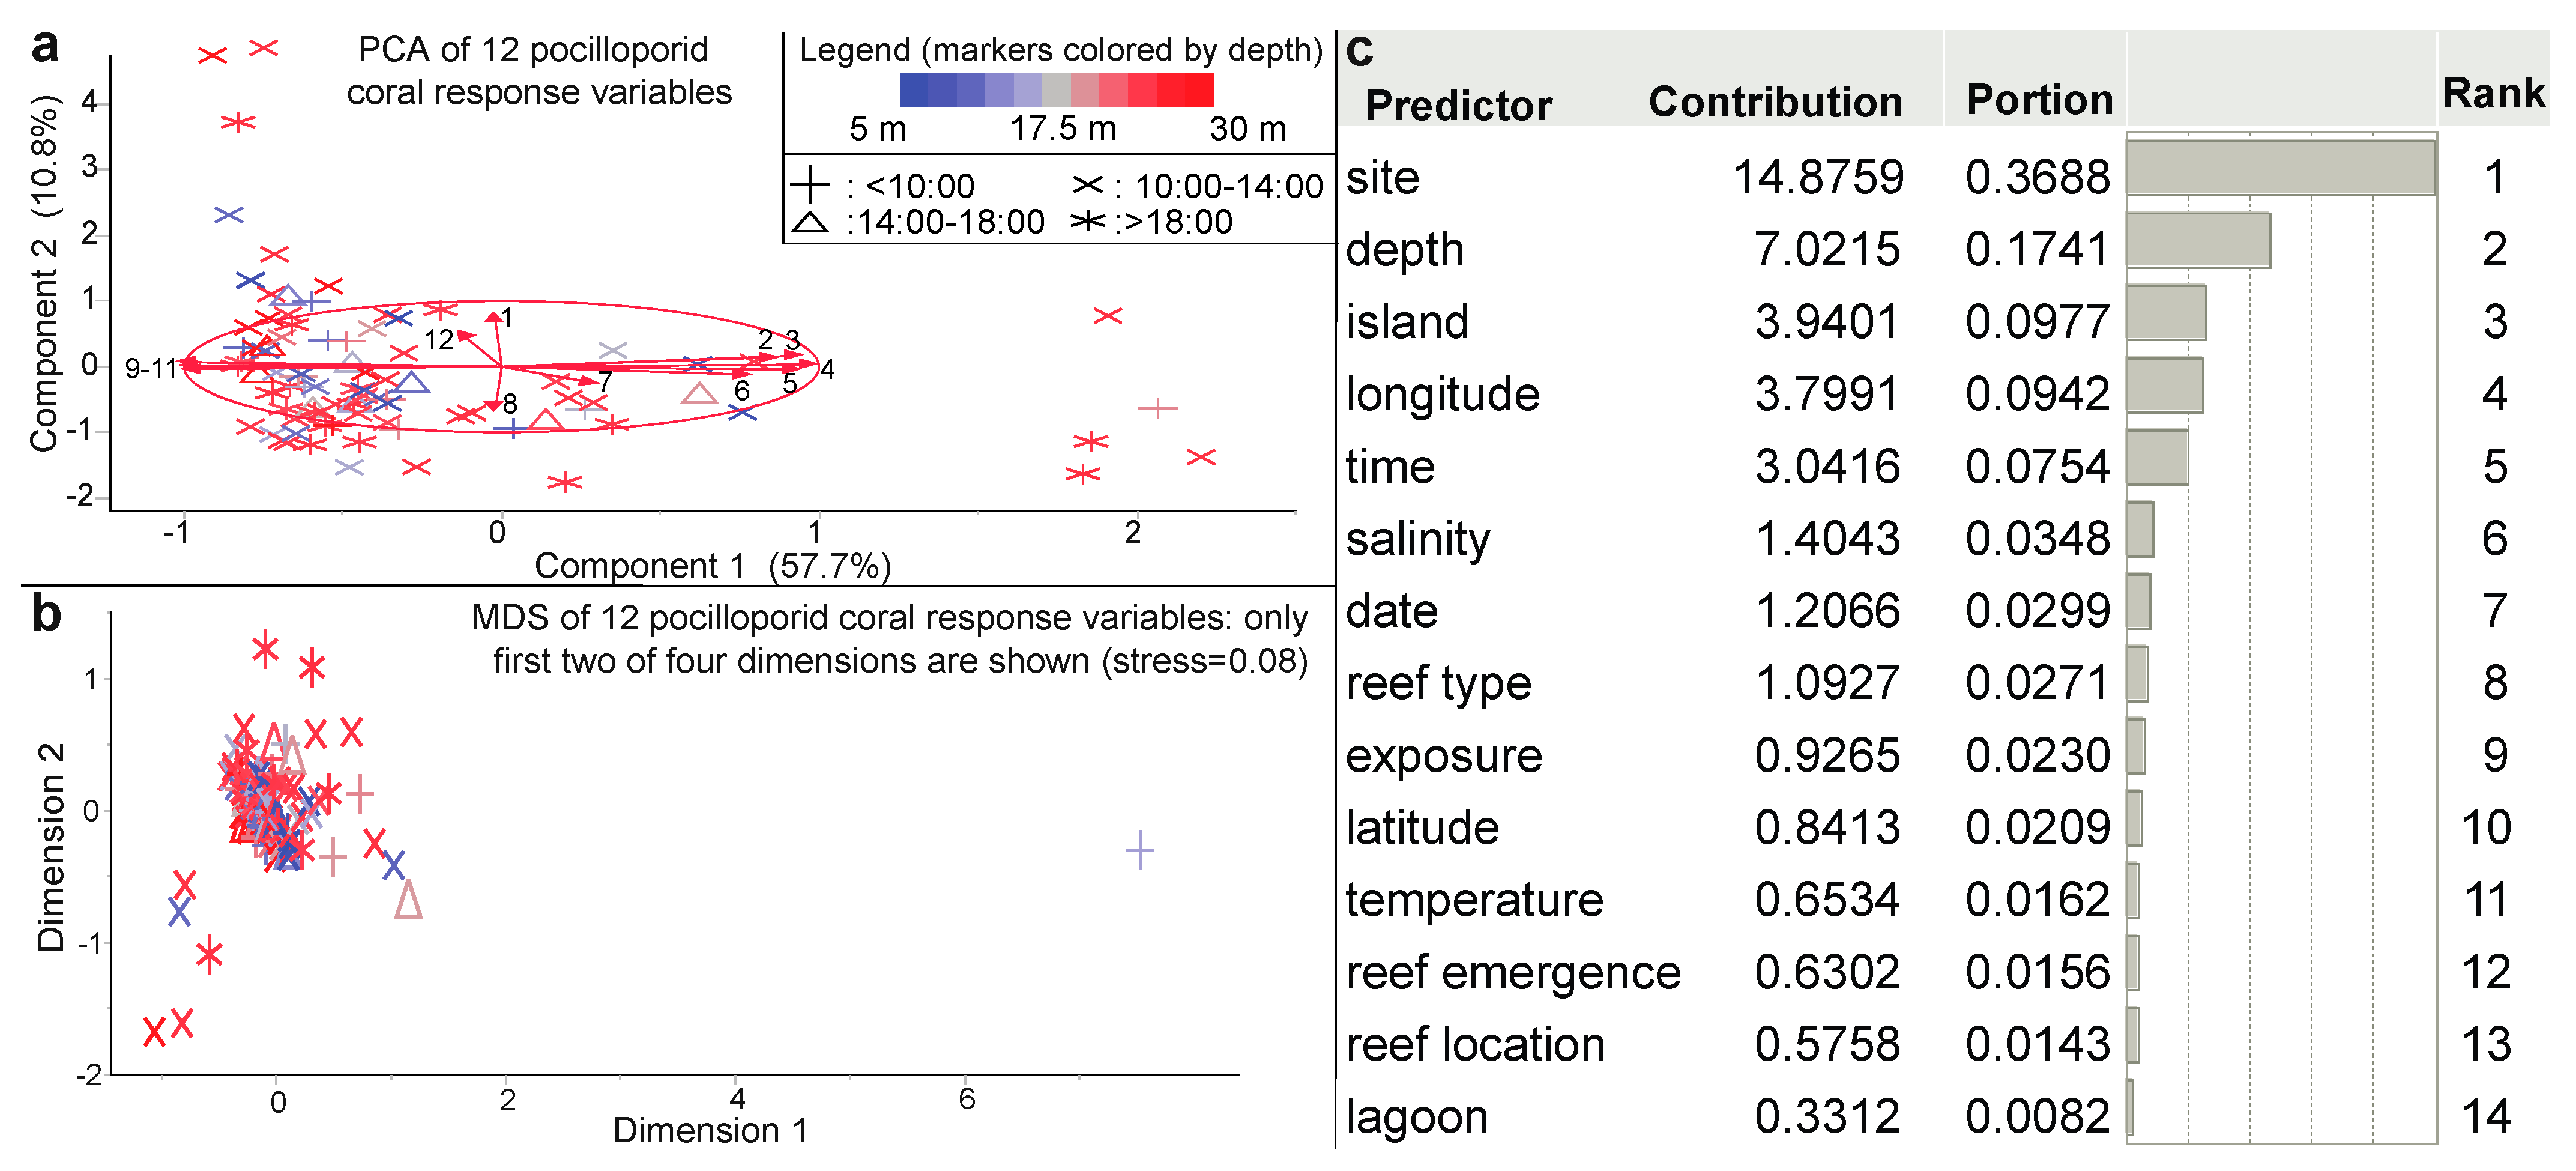
PCA12 PRV aNANAFigure 4a
MDS12 PRV aNANAFigure 4b
Factor analysis16 PRVNANANot shown
ENVIRONMENTAL EFFECTS ON CORAL PHYSIOLOGY
NP-MANOVA4 PRV factorsENV 1NATable 2
NIPALS4 PRV factorsENV 1, ENV 2, ENV 3, ENV-RSKfold7, val col, val w/testTable S1
NIPALS4 PRV factorsECO 1, ECO 2, ECO-RSKfold7, val col, val w/testTable S1
NIPALS4 PRV factors(ENV + ECO) 1, (ENV + ECO) 2Kfold7, val col, val w/testTable S1
NIPALS16 PRVENV 1, ENV 2, ENV 3, ENV-RSKfold7, val col, val w/testTable S1
NIPALS16 PRVECO 1, ECO 2, ECO-RSKfold7, val col, val w/testTable S1
NIPALS16 PRV(ENV + ECO) 1, (ENV + ECO) 2Kfold7, val col, val w/testTable S1
Predictor screenCHIENV 1NAFigure 4c
Model screenCHIENV 1Kfold7, val col, val w/testTable 3 and Table S2
NN GUI-HL(1)CHIENV 1, ENV 2, ENV 3, ENV-RSKfold7, val col, val w/test, 20% HB Table 3 and Table S2
NN GUI-HL(2)CHIENV 1, ENV 2, ENV 3, ENV-RSKfold7, val col, val w/test, 20% HB Table 3 and Table S2
NIPALSCHIENV 1, ENV 2, ENV 3, ENV-RSKfold7, val col, val w/testTable 3 and Table S2
ECOLOGICAL EFFECTS ON CORAL PHYSIOLOGY
Predictor screenCHIECO 1NATable 3 and Table S2
Model screenCHIECO 1Kfold7, val col, val w/testTable 3 and Table S2
NN GUI-HL(1)CHIECO 1, ECO(15) 1Kfold7, val col, val w/test, 20% HBTable 3 and Table S2
NN GUI-HL(2)CHIECO 1, ECO(15) 1Kfold7, val col, val w/testTable 3 and Table S2
NIPALSCHIECO 1, ECO(15) 1Kfold7, val col, val w/testTable 3 and Table S2
ENVIRONMENTAL + ECOLOGICAL EFFECTS ON CORAL PHYSIOLOGY
Predictor screenCHIENV 1 + ECO 1Kfold7, val col, val w/testTable 3 and Table S2
Model screenCHIENV 1 + ECO 1Kfold7, val col, val w/testTable 3 and Table S2
NN GUI-HL(1)CHIENV 1 + ECO 1Kfold7, val col, val w/testTable 3 and Table S2
NN GUI-HL(2)CHIENV 1 + ECO 1Kfold7, val col, val w/testTable 3 and Table S2
NIPALSCHIENV 1 + ECO 1Kfold7, val col, val w/testTable 3 and Table S2
a SinH-ArcsinH (SHASH)-transformed data.
Publisher’s Note: MDPI stays neutral with regard to jurisdictional claims in published maps and institutional affiliations.

