Characteristics of the Shock Wave and Its Pro-Healing Effect on the Living Organism
Shock waves used in physiotherapeutic procedures (outpatient treatment) and aesthetic medicine are an example of an acoustic wave [
13], whose propagation medium, in this case is the tissue of a living organism, is, de facto, the hydrated environment [
2,
13,
14]. An acoustic wave is a disturbance involving the propagation of mechanical energy into an elastic medium (here, water) through its particles, more precisely, as a result of vibrations of these particles. The source of the shock wave is violent phenomena, such as an explosion, exceeding the speed limits, or ultimately collisions [
13,
14]. The latter phenomenon is used in the devices of physiotherapists to generate a shock wave. Every person has experienced the effect of shock wave in many occasions while hearing the sound of a balloon bursting with air, a supersonic plane flying over, or a collision of objects [
13,
14].
One of the parameters of the acoustic wave propagation medium is acoustic impedance, defined as a measure of the wave resistance created by this medium [
13]. Due to the fact that the acoustic wave is a mechanical wave, it is possible to distinguish the phenomena of propagation, diffraction, and absorption depending on the previously mentioned wave impedance of the medium [
1,
13]. Shock wave propagation in living organisms is possible, as the tissues consist mainly of water molecules. This makes the treatment using waves of this type a non-invasive therapy—a sought innovation in medical treatments. Depending on the type of shock wave, it can penetrate the tissue up to 3 cm (radial wave EPAT, the case further discussed in paper [
15]) and up to 12 cm with a focused wave (lithotripsy procedure) [
1].
The wave injected into the tissue penetrates it until it hits a target with a completely different acoustic impedance. In this point, we deal with refraction and absorption as positive side effects of the wave, which confirms the therapeutic nature of the wave [
2]. In other words, a collision of a shock wave in the tissue with, for example, a calcareous deposit or a degenerative change, i.e., a solid target with a different impedance than the tissue, results in the disruption of this pathological area. The shock wave effect takes place here. It is worth mentioning the importance of all the means of coupling the waves generated by the apparatus with the operated tissue. The preparations are selected in such a way that they have a similar acoustic impedance to the tissue—then an anechoic propagation of the shock wave from the apparatus to the body is possible. Examples include ultrasound gel or castor oil [
1,
2]. However, lubricants should not be used because the air they contain significantly reduces the possibility of wave coupling [
2]. Unfortunately, due to the difference in the acoustic impedance of the apparatus applicator (more precisely, the applicator transmitter) and the operated tissue, only 10% of the generated energy is actually transferred to the body [
13,
16]. In addition to the above-mentioned conductive medium (with an acoustic impedance similar to that of water), researchers also use preparations when constructing measurement stands, for example; in paper [
7], a 5 mm layer of sanitary silicone was used, and in [
13], viscoelastic substances were suggested [
17].
The shock effect is not the only phenomenon occurring in the shock wave. Below, we discuss all the phenomena occurring in the wave propagation medium using the example of a registered wave.
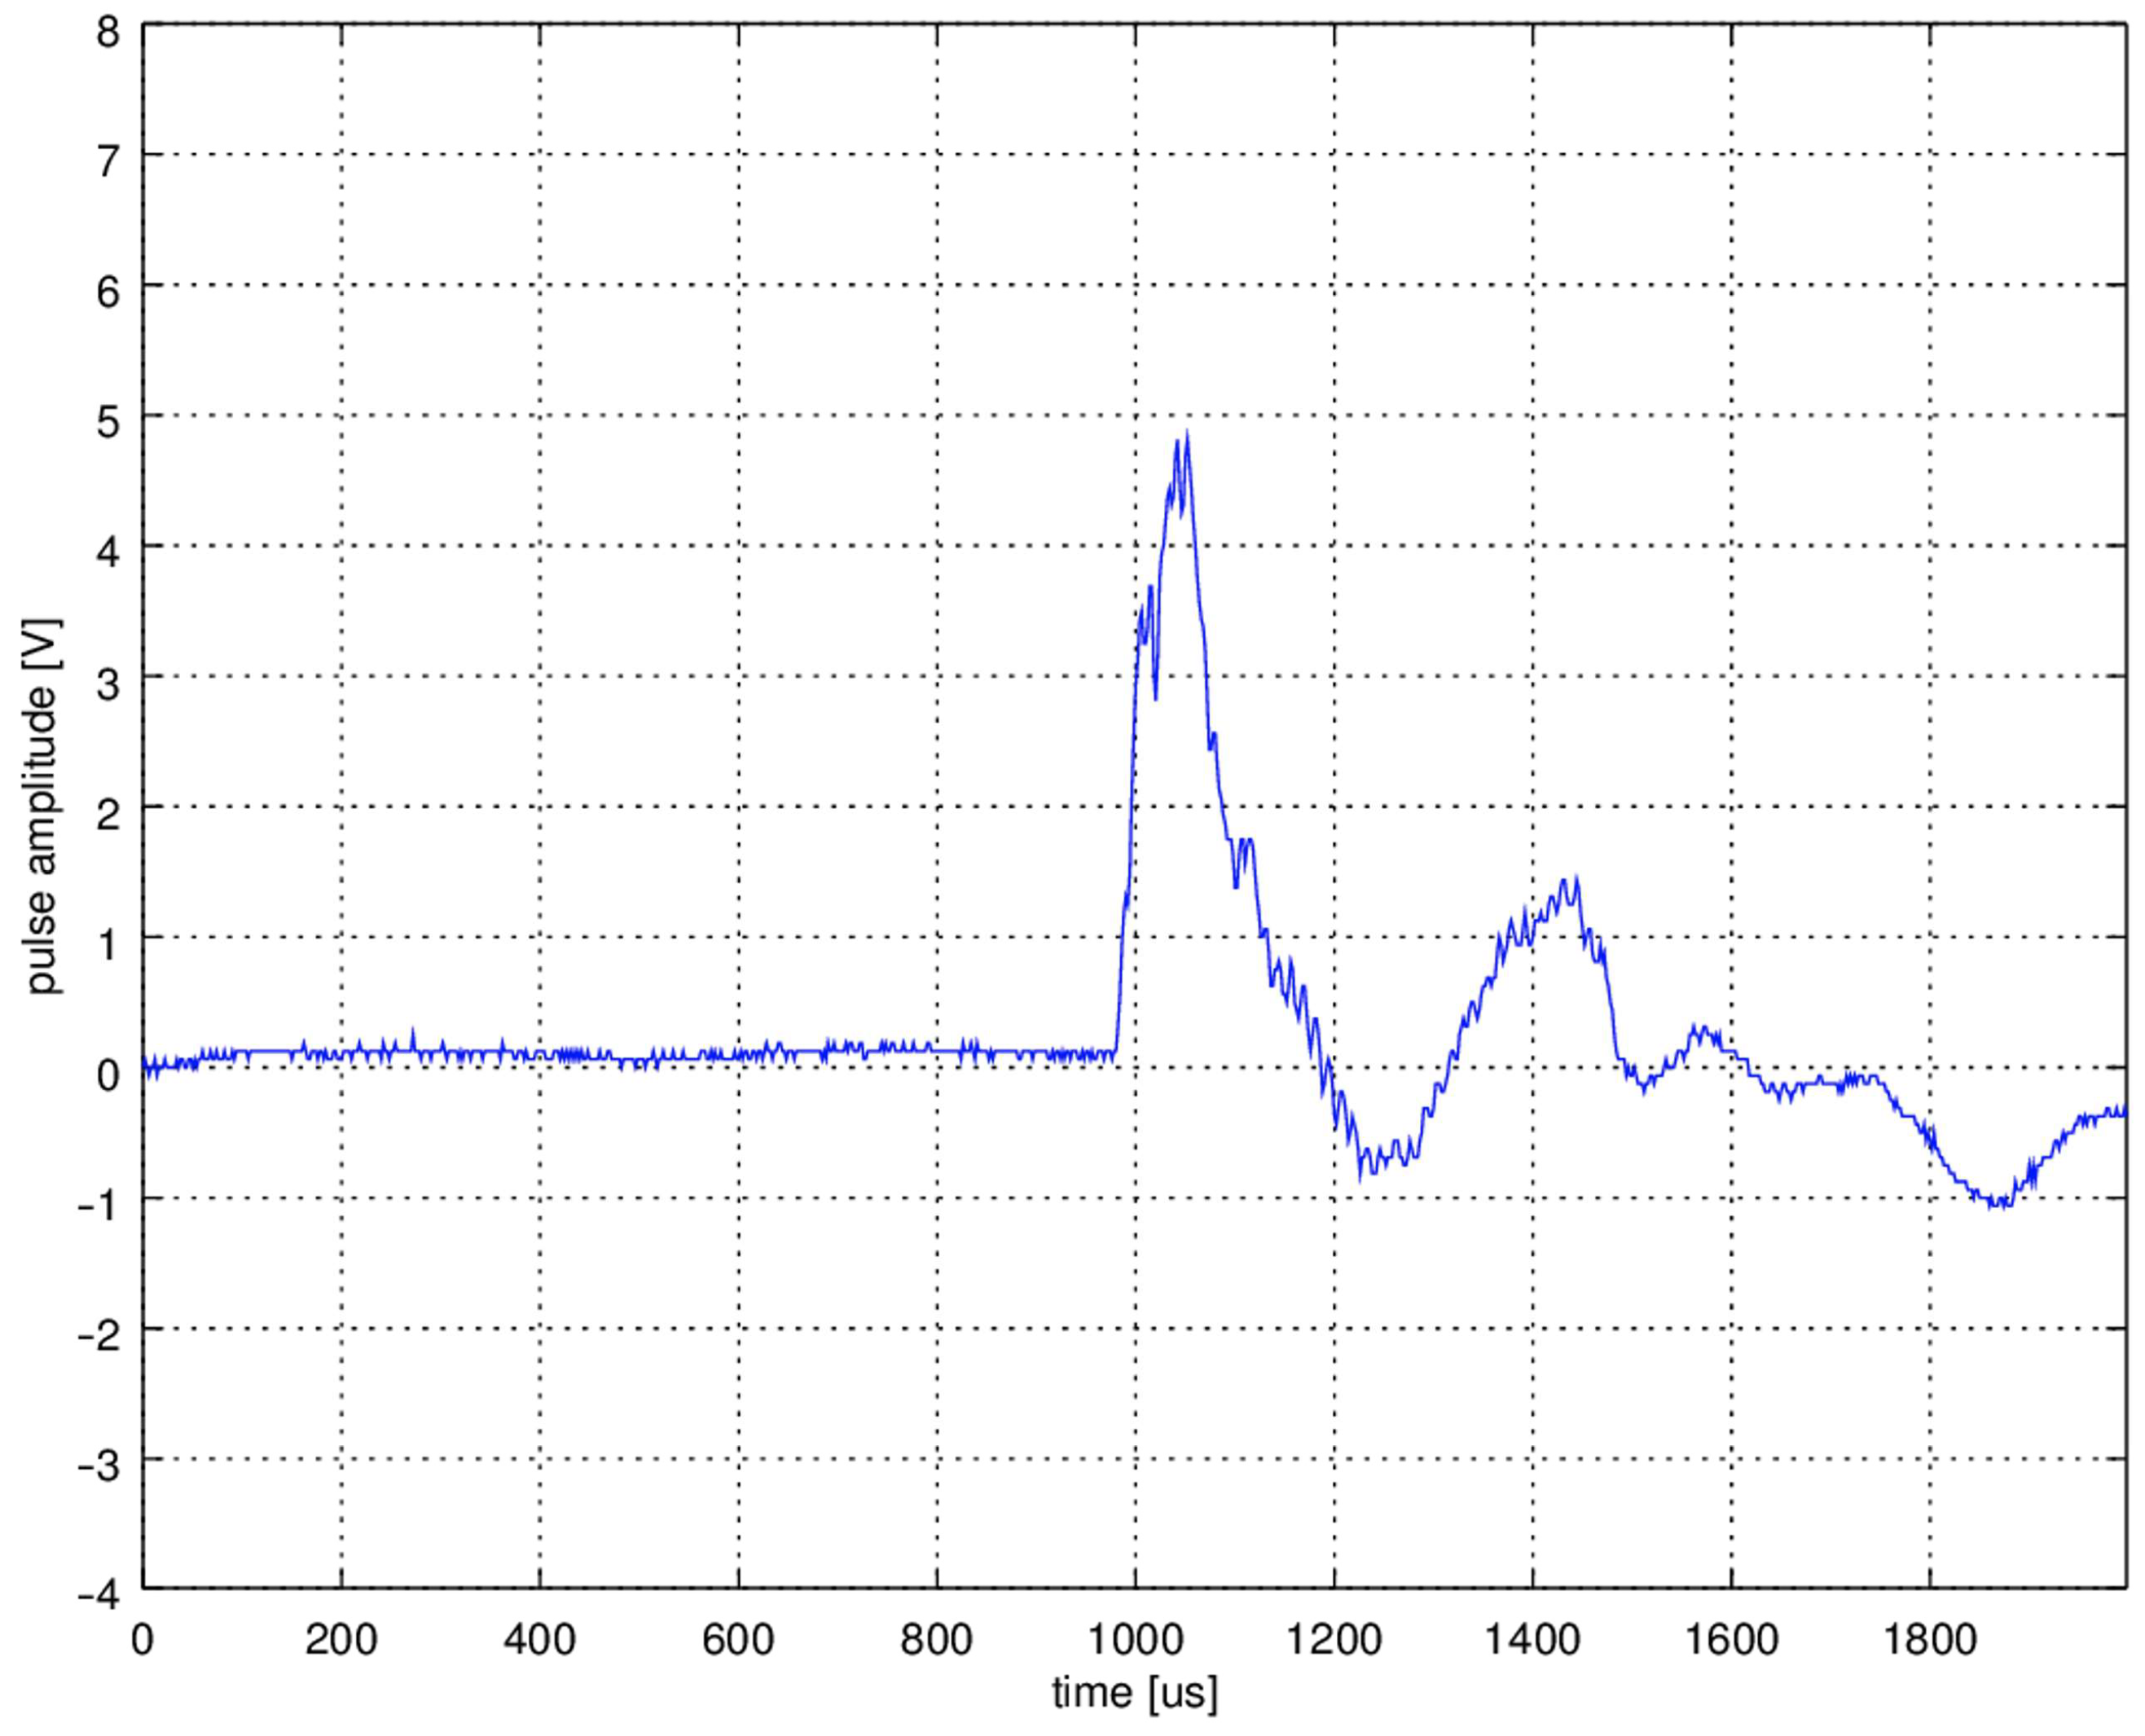
Figure 1 shows an example of a shock wave registered on the test bench presented in further sections of the paper. The presented shock wave signal was registered using a stand with a hydrophone and a pneumatic shock wave generator (operating parameters 5 bar, 1 Hz). Details are provided later in the paper. The amplitude of the pulse is expressed in the measured quantity—the voltage at the hydrophone terminals, which corresponds to the instantaneous acoustic intensity.
The first non-negative part of the wave, called the positive phase, stands for a sharp pressure increase in the medium. This phase typically lasts 1–100 μs, and the generated pressure can reach 80 MPa [
1,
13,
14,
15].
The wavefront, in the form of a monotonic pressure increase in the positive phase is responsible for the shock effect [
14] consisting in alternating compression and stretching of the material, for example, in water [
18]:
where:
tr—duration of the rising edge of the positive phase,
Δp—pressure amplitude change.
It then breaks deposits and stones into smaller pieces—generally speaking, hard objects in the tissue. In the case of stones, under specific conditions, we can observe the Hopkins effect, which is the spallation of broken deposits as a result of reflection in the counter-phase of the shock wave from the boundaries of the stone and tissue centers [
1,
2]. The broken material is absorbed and then excreted by the body. As already mentioned, the positive phase of the shock wave consists in a sharp increase in pressure. Due to the inertial nature of physical phenomena, the return to the state of pressure equilibrium in the tissue is associated with the occurrence of a temporary negative pressure (the so-called negative phase—a non-positive wave fragment in
Figure 1). It is worth noting that the same inertia causes the return to the state of equilibrium associated with the occurrence of damped shock wave resonance at a given point in the medium, i.e., alternating progressively smaller positive and negative phases. It relates both to the inertia of the particle vibration itself and also to the formation of further shock waves on a micro scale resulting from an explosion of deposits and hardening in the tissue [
1]. In addition, it will also be related to another phenomenon called cavitation—described as a momentary phase change in the medium related to the occurrence of sudden negative pressure. A typical example of cavitation is air bubbles flowing around a rotating ship propeller.
where:
dp/dT—pressure derivative along the phase transition curve,
L—enthalpy of phase change,
T—tissue water temperature,
ΔV—volume change.
Tissue pressure drop by Clausius-Clapeyron is given by Equation (2), causing a rapid decrease in the boiling point of water in the tissue, which results in the formation of gas bubbles [
2,
13] (unidirectional diffusion [
14] according to Fick’s Laws [
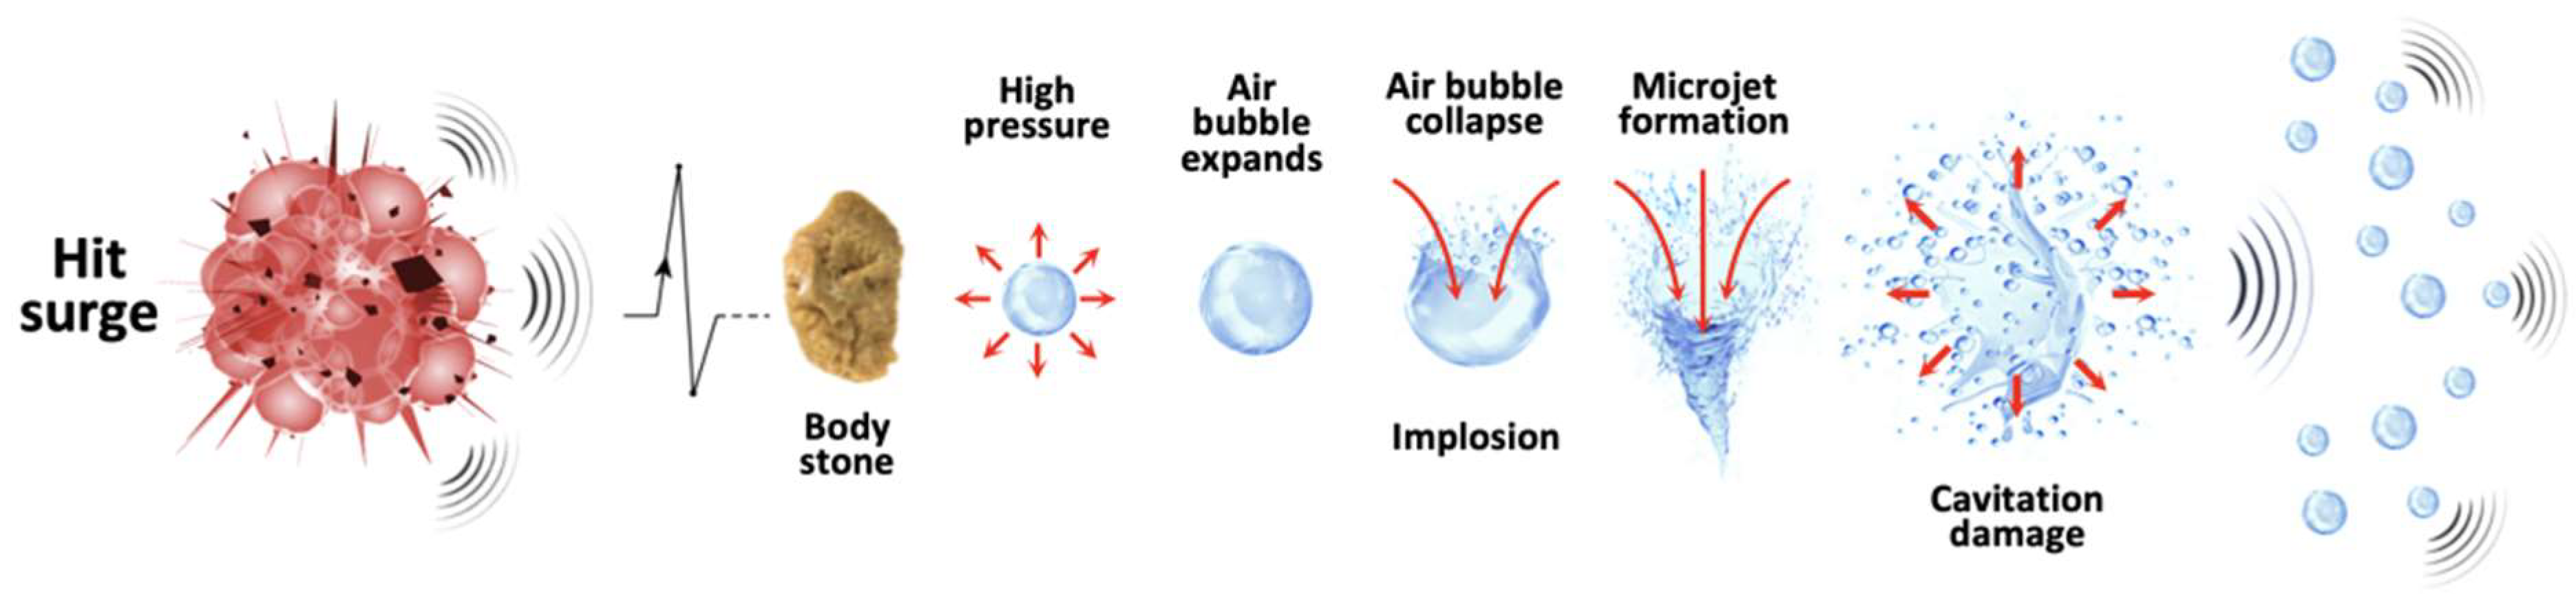
17]). Immediately afterward, the bubbles, while collapsing, implode and generate successive shock waves, which, as in the example with the ship, are the source of the sound and allow you to track the object by listening to the water tank with a hydrophone. Referring to the example at the beginning of the section, a cavitation bubble rupture can be compared to an air balloon rupture. Successive shock waves generate further local cavitation phenomena, which, in turn, are the source of the shock waves. This is an example of a typical chain reaction that is quenched in each subsequent step. Another pro-healing effect is associated with the collapse of the follicles, i.e., microjets (funnel-shaped microstructure) supporting the rupture of degenerative areas [
14]. Experts estimated the speed of this stream at 130–170 m/s [
14].
To sum up, all the above-mentioned phenomena, i.e., the shock effect, cavitation generating penetrating gas bubbles, and microjets, are pro-therapeutic in nature. They can be used in the non-invasive crushing of kidney stones (lithotripsy), treatment of tennis elbow, heel spurs, and elimination of cellulite (aesthetic medicine). The entire shock wave healing process is shown in
Figure 2. However, some believe that implosions of caviar bubbles may break the covalent bonds of water molecules [
14]; in other words, they may promote the formation of free radicals, which in turn may have a negative impact on the health of the living organism.
Each therapy requires selecting the appropriate parameters. Inadequate values can have completely different, catastrophic consequences for a living organism. Therefore, what is crucial is to consider metrics that allow us to assess and compare generated shock waves without empirical tests of the wave in vivo and with no comparison of its effects. The basic parameter describing the shock wave is the acoustic pressure amplitude (expressed in MPa) at a given point in the medium and at a given time [
19]. This means that it is a value that depends on the distance from the wave source and the time that has elapsed since its generation. This will significantly influence the accuracy of measurements we made on experimental test benches, which we describe later in the paper. The tests include measurement with a piezoelectric vibration sensor and hydrophone measurement. Based on the acoustic pressure value, it is possible to determine the instantaneous acoustic intensity in the direction of the wave vector, given by the formula (2) [
1,
14]:
where:
p—sound pressure,
—medium density,
c—speed of wave in the medium (1500 m/s for water).
The denominator of formula (3) is, in fact the acoustic impedance, which is 1.5 × 10
6 kg m
−2 s
−1 for water, 1.4 × 10
6 kg m
−2 s
−1 for urine, and 5 × 10
6 for kidney stones 5 × 10
6 kg m
−2 s
−1. The mentioned parameters (3) are important for the researcher of acoustic waves, but not for the physiotherapist, who should be able to assess the therapeutic usability of the shock wave. For this purpose, the energy flux density (expressed in mJ/mm
2) was introduced. It depends on the acoustic pressure of the point
ξ in the medium throughout the duration of the shock wave. The energy flux density [
1,
2,
13,
15,
19] can be determined based on the formula:
where:
p—sound pressure at point ξ at time t,
—medium density,
c—speed of wave in the medium,
λ—duration of the shock wave at point ξ.
The value of quantity (4) is important for physiotherapists and shows them whether the generated shock wave will have a therapeutic effect by penetrating the operated tissue or focusing only on a small area of it. The literature defines some energy thresholds (energy flux density values) above which pro-therapeutic effects occur. The square of the integrand in the formula (4) allows us to consider both phases of the wave: positive and negative. In practice, the value of energy flux density in the operated tissue ranges from 0.004 to 0.6 (sometimes 0.8) mJ/mm
2 [
1]. There are many classifications of a shock wave due to its energy flux density. Generally, there are three energy classes [
1]: low, medium, and high (
Table 1). For the low-class energy flux, density should not exceed 0.1 mJ/mm
2; for the medium class 0.3 mJ/mm
2, and, for the high class, 0.6 mJ/mm
2. An alternative to the measure (4), which is rarely used, is the displacement given in the paper [
13].
Due to the radial nature of the tested shock wave, different energy densities (4) are obtained at different points of the cross-section perpendicular to the wave vector, therefore the total energy measure for the cross-section
Φ [
1,
11], which corresponds to the shock wave passing the surface, is used based on the previous Equation (4):
This seems to be the clinically more important parameter of the shock wave in case of tissue treatment. Moreover, the measure (5) is supplemented with the number of delivered shock wave pulses during the treatment or the frequency (6), with which successive pulses are delivered. Therefore, assuming the limitation of the experimental test benches consisting in the possibility of measuring the energy flux density only in one specific point ξ of the medium, the energy flux density measure (4) per point of the medium during the entire shock wave pulse is used in the following part of the study.
If the shock wave pulses are generated with the frequency
f, then the energy flux density of one pulse at the point
ξ is:
where:
ΣE (ξ)—total energy supplied to the point ξ in one unit of time.
Formula (6)—the total energy supplied to the point
ξ is the product of the frequency and the energy flux density at the point
ξ, which seems trivial. However, in real design solutions, it turns out that the following dependence holds:
where there is factor
k dependent on the frequency. This factor reduces the energy flux density per point
ξ. In other words, the energy flux density (4) at point
ξ depends not only on the acoustic pressure and the pulse duration, but also on the frequency with which the pulses are delivered. This is the hypothesis of the authors of the paper [
7,
8]. In real solution
k > 1, this factor reduces the energy flux density (4), (5) with increasing frequency. The authors of work [
7] blame this effect on the design of the applicator, but only for the pneumatic solution. In our study, we tried to experimentally verify the hypothesis from [
7] for two different versions of the shock wave equipment: pneumatic and electromagnetic. Moreover, we put forward our hypothesis that the effect described by authors of paper [
7] is caused also by the transmitter elastomer affecting the motion of the projectile (bullet)/piston and transmitter. We discuss this issue in detail in further sections. In the paper [
20], it can also be found that increasing the frequency
f reduces the cavitation effect of the treatment. This seems to be the result of the phenomenon shown in [
7]. The design of a typical shock wave therapy generator is presented.
The most common source of the EPAT shock wave in devices available on the market is the collision of two elements of the device structure. A typical apparatus (sometimes called a generator) consists of a controller and a shock wave applicator [
21]. The design of the applicator seems interesting from the work point of view, so the description of the controller should only be based on the assumption that it is the component of the apparatus responsible for supplying energy (electric, potential) to the applicator.
During the treatment, the physiotherapist uses the applicator by putting it on the area of the tissue with deposits or degeneration. The applicator is pressed against the patient’s body in such a way that the head (also called the transmitter) is in direct contact with the skin surface. In the gap between the transmitter (more precisely, the transmitter front) and the skin, there may be a preparation favoring the coupling of the shock wave [
1,
13].
To create a shock wave on the front side of the transmitter, we need a rapid collision of the applicator structural elements with the transmitter. The elements hitting the transmitter can be a projectile (in the case of a pneumatic solution of the apparatus [
2,
21]) or a piston (in the case of an electromagnetic generator). During the research, we used two pneumatic solutions: Hunan Astiland Medical Aesthetics Technology AS-ESWT and Longest LGT-2500S—and one electromagnetic generator, Rosetta ESWT. In the first solution, the electricity supplied to the controller is converted into potential energy (in the form of compressed air), which, in turn, is converted in the applicator into kinetic energy (a bullet rushing along a linear trajectory in the closed guiding tube). The kinetic energy of the projectile during a collision (inelastic) with the transmitter is converted into the energy of the shock wave, which can be described according to the measures presented in the previous section.
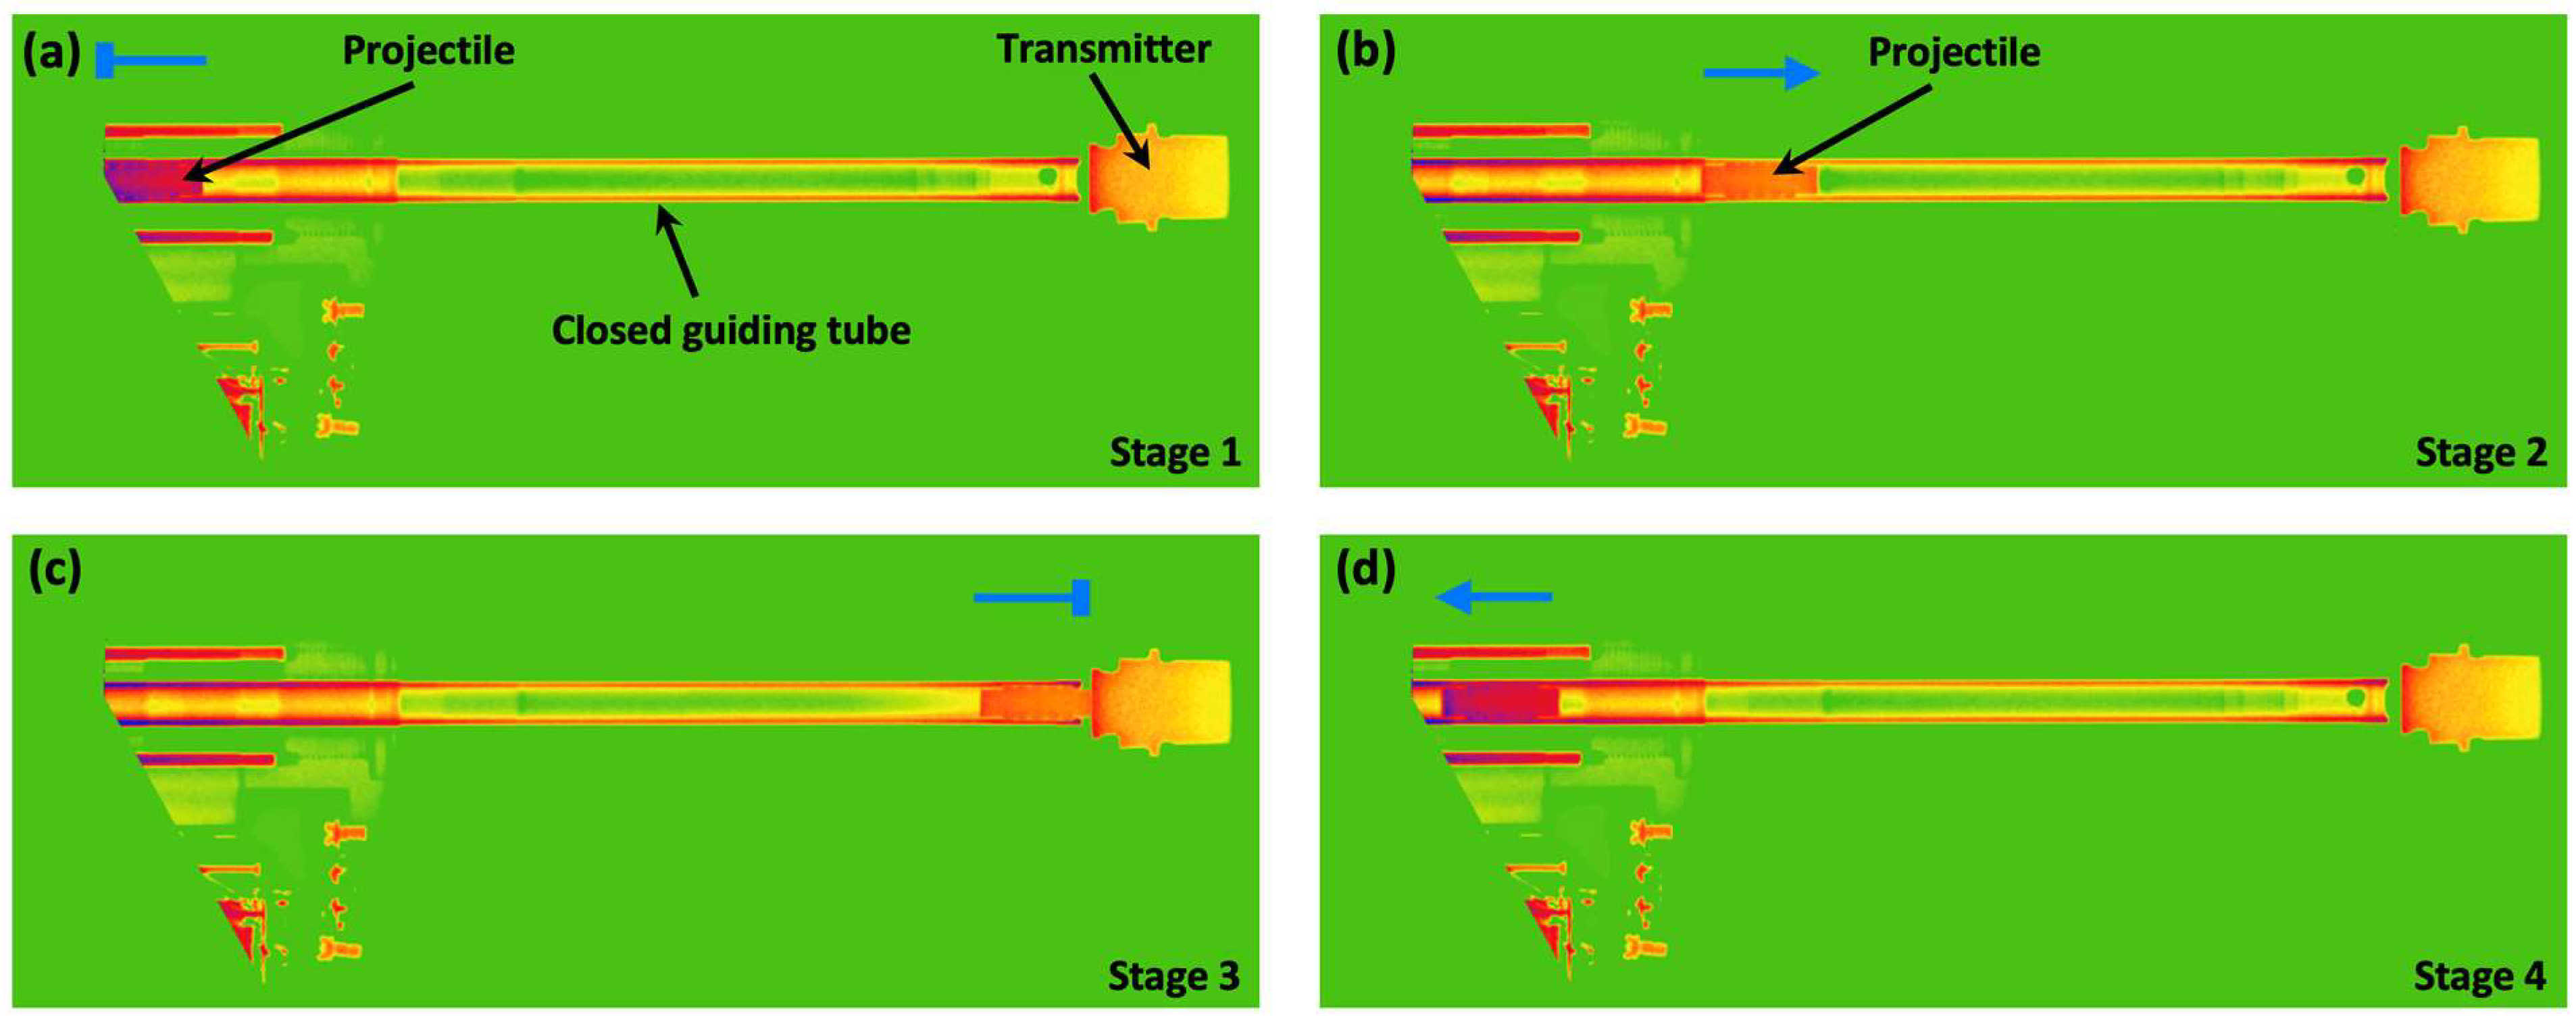
For a better understanding of the operation of the pneumatic applicator, we recorded the operation of the applicator on a time-lapse technique of X-ray imaging in an angiography device with fluoroscopy in the visual path.
Figure 3 shows the operation cycle of the pneumatic applicator in the form of selected frames registered in the light of X-rays. We colored the film frames to improve the visual effect, however, the color in the drawing has nothing to do with the type of material or its parameter. The figure is only illustrative. We can distinguish the following stages of the applicator work:
- 1.
Stage 1: Projectile in the initial position (
Figure 3a).
- 2.
Stage 2: The projectile moves uniformly accelerated in the closed guiding tube towards the transmitter (
Figure 3b). Under Pascal’s law and Newton’s second law of motion, the projectile acceleration is:
where:
p—pressure of compressed air forced to the beginning of the barrel,
Sb—projectile working surface (conical surface),
mb—mass of the projectile.
The projectile moving towards the transmitter increases the
ph pressure in the counter-pressure chamber coaxial to the closed guiding tube according to the Boyle-Mariotte law:
where:
V—volume of the counter-pressure chamber and the closed guiding tube in the bullet-transmitter section,
α = const.
- 3.
Stage 3: The projectile collides inelasticity [
2,
13,
22] (a perfectly inelastic collision was assumed) with the transmitter (
Figure 3c) having the speed (module):
where:
dr—the closed guiding tube length.
- 4.
Stage 4: Return of the projectile to its initial position in the closed guiding tube (
Figure 4d).
Purposefully, the speed of the projectile (10) depended on the pressure of the air forced into the closed guiding tube because, in the construction of a pneumatic generator, pressure is a parameter that a physiotherapist can set. Other values, such as the weight of the projectile, its working surface area, and the closed guiding tube length, are the values that result from the design of the device; hence, they cannot be changed during operation. For a typical applicator, the bullet speed does not exceed 25 m/s [
1,
2,
13,
23].
The described collision is inelastic; therefore, based on the conservation of momentum, we can determine the initial velocity of an isolated system consisting of a projectile and a transmitter:
where:
mt—mass of the transmitter (a steel 15F type transmitter was used during the experiments).
Thus, the kinetic energy accumulated in the transmitter after the collision is given by:
Formula (12) shows that the energy accumulated in the transmitter after the collision depends directly proportional to the pressure of air forced into the tube (a parameter set by the user).
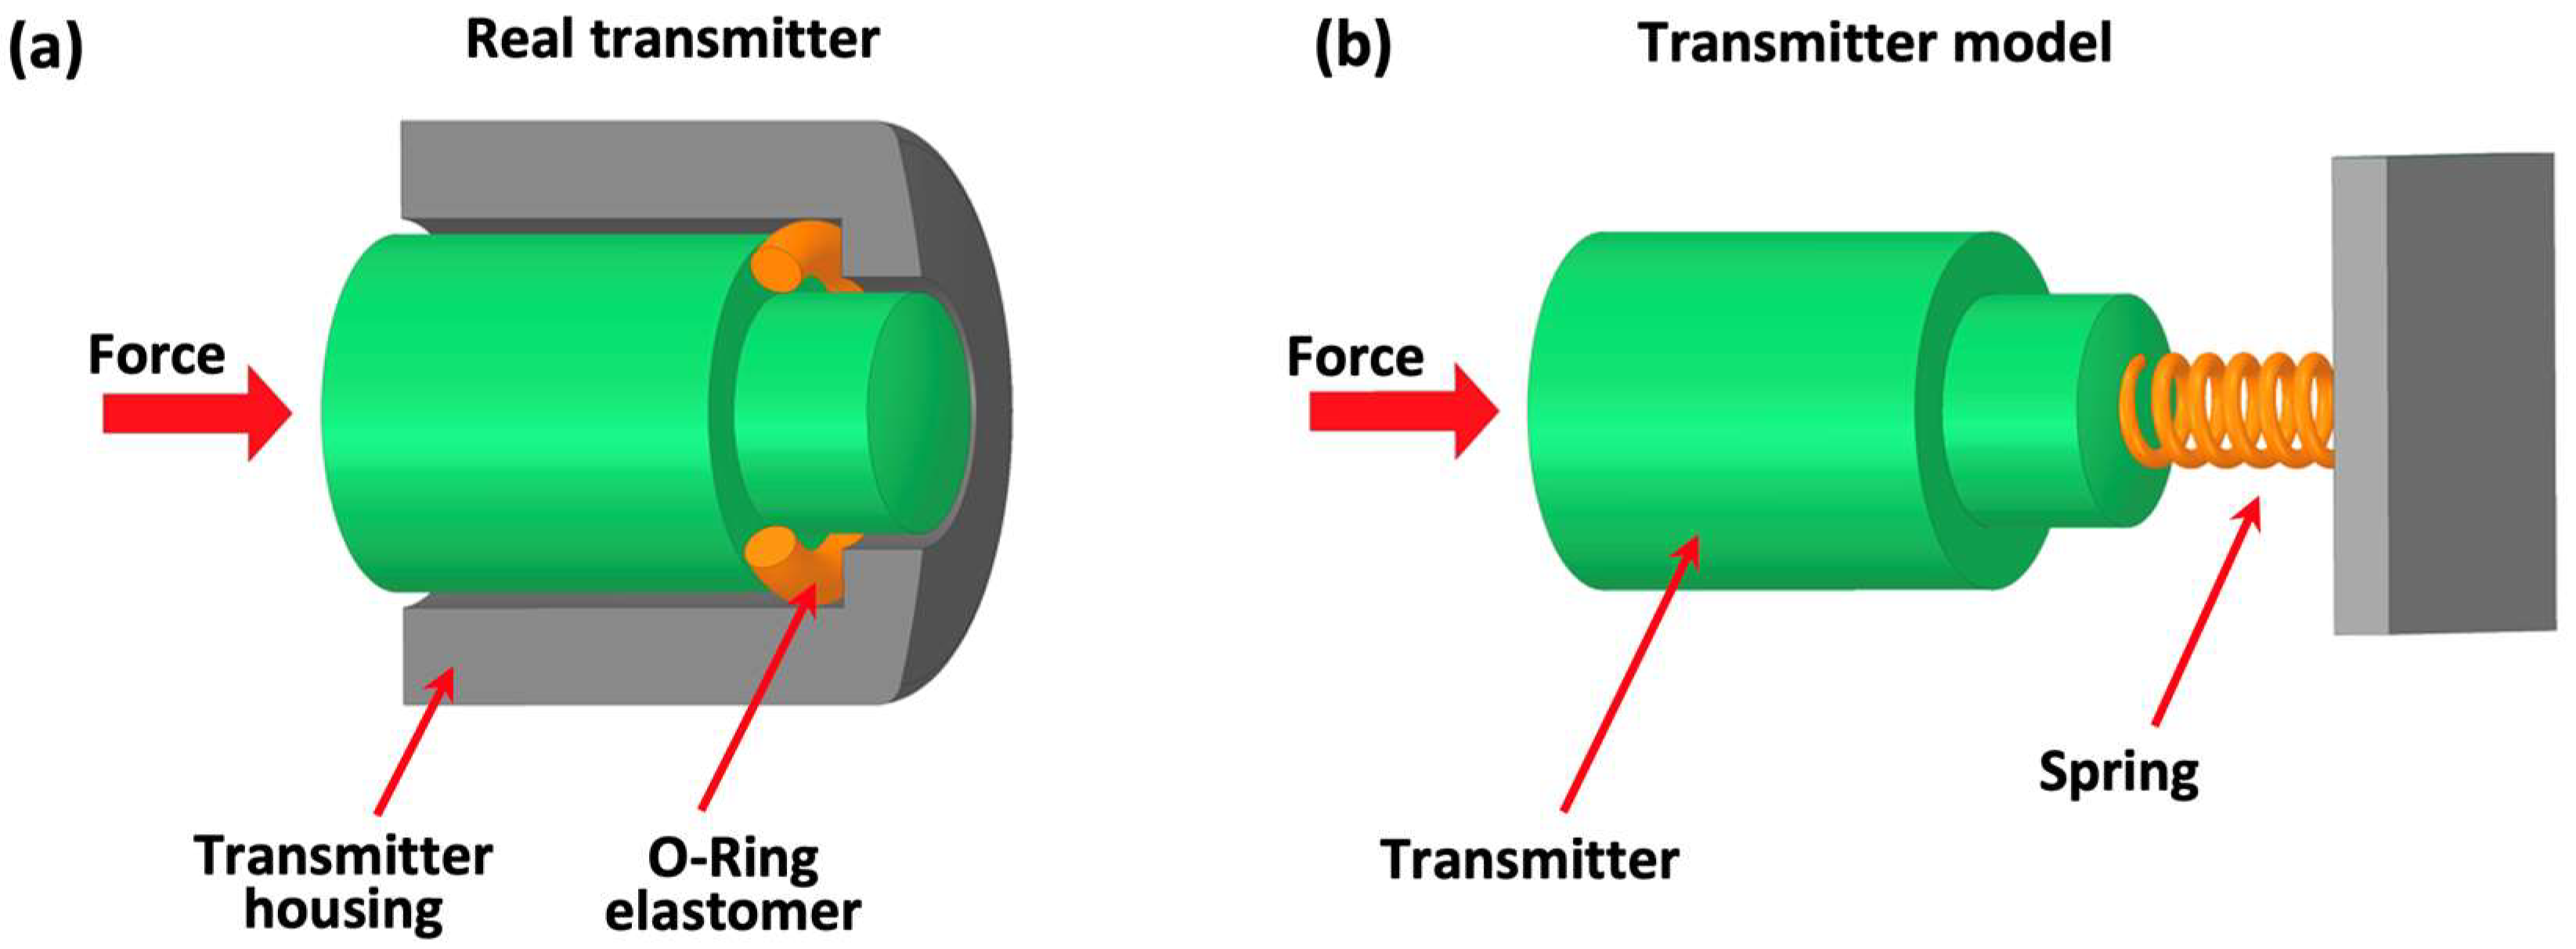
Figure 4a shows a model of a typical transmitter. It is held in the applicator holder by a torus-shaped elastomer. It makes the movement of the projectile and transmitter system a delayed movement that can be modeled with a progressive spring system (
Figure 4b). The elasticity coefficient depends on the hardness of the elastomer (expressed in Shore A degrees). When the system stops, it returns to its initial position (elastomer decompression), and the projectile is ejected [
22]. In practical solutions, the elastomer, during compression, reduces its thickness (the path of the transmitter) by a maximum of 1 mm [
1,
23].
The authors in formula (12) omitted the component responsible for the momentum of the transmitter in the numerator, as the transmitter was at the initial state before the first hit. Nevertheless, as it turned out in the experiments, this component was not zero. We suspect that this explains the hypothesis that increasing the applicator frequency corresponds to a decrease in the energy flux density of the shock wave. It can be described according to the following:
In other words, the projectile collides with a transmitter that has not returned to rest after the previous cycle (g ≠ 0). Moreover, as the experiments show, the energy flux density decreases with increasing frequency, which would mean that the return of the transmitter to the rest state is a vibrating motion (damped), and the g component depends on the current amplitude of these vibrations. To put it simply, the higher the frequency, the earlier in the vibration cycle of the transmitter the collision with the projectile takes place, i.e., with the greater the amplitude the transmitter counteracts the collision with the projectile.
Electromagnetic generators have a simpler design, and they transform the electrical energy supplied to the device into kinetic energy of the piston (accelerated in the magnetic field of the electromagnet).
Figure 5 shows an example of an electromagnetic solution. A ferromagnetic piston set in motion and accelerated in a magnetic field, after crossing the length of the solenoid, hits the transmitter. In practical solutions, a spring is also used to counteract the force of pulling the piston into the solenoid—thus solving the problem of the free return to the initial position of the piston after the disappearance of the magnetic field (coil voltage). Nevertheless, this elastic force is ignored in the following considerations. Secondly, it is quite important in the context of the applicator construction to ensure good cooling of the device, something that was not required in the pneumatic version. It is important not only to ventilate the solenoid itself, but also to prevent the piston from heating up because the increase in temperature deteriorates the ferromagnetic properties of the piston and thus reduces the force with which it is pulled into the solenoid. The magnetic permeability of the piston decreases as it approaches the Curie temperature.
The parameters controlling the solenoid work in this case are the current
i. Based on the Biot-Savart law, the magnetic induction of the solenoid can be determined as follows:
where:
μk—magnetic permeability of the piston,
N—number of turns in a winding,
L—solenoid length.
The study uses scalar calculus of vector quantities (e.g., with the Biot-Savart law) while maintaining the appropriate sign depending on the result of the vector product appearing as vector formulas. The force with which the piston is pulled into the solenoid, assuming that the cross-section (area
Sk) of the piston is perpendicular to the magnetic field line, is:
where:
μ0—magnetic permeability of vacuum.
Formula (15) is, in fact, a use of Pascal’s Law in magnetism because, by separating the surface area from the fraction (15), the remaining factors make up the magnetic pressure defined as follows:
The piston retracted inside the solenoid hits the transmitter with velocity (according to Biot-Savart’s law (14) and Newton’s second law of motion (15)):
where:
dk—the distance the piston is pulled into the solenoid,
mk—mass of the piston.
The collision of the ferromagnetic piston with the transmitter, besides triggering a shock wave, also has negative consequences for the construction of the device. It is obvious that each impact weakens the striker (here, the piston, and earlier, the projectile), but in this case, the compressive stresses appearing during the impact adversely affect the ferromagnetic properties of the piston.
It is worth noting a certain analogy of formula (17) to the equivalent of the pneumatic solution. In both cases, the projectile impact velocity (from Pascal’s law) and the piston collision velocity are directly proportional to the working surface area (cross-section) and inversely proportional to the mass of the accelerated element.
Moreover, just as in the pneumatic version, the only parameter influenced by the user is the intensity of the current flowing through the solenoid. The number of coils, lengths, and material the piston is made of (i.e., magnetic permeability) are dictated by the construction of the apparatus. However, in typical electromagnetic solutions, the electronic system controlling the applicator operation does not control the intensity of the current flowing through the solenoid in a direct manner, but only by changing the voltage applied to the solenoid. Thus, by increasing the coil voltage, the speed of the piston colliding with the transmitter is increased.
As in the pneumatic solution case, here, the collision of the piston with the transmitter is inelastic due to the use of a decelerating elastomer. Thus, the speed of the piston and transmitter system after a collision, in the principle of conservation of momentum, is:
Eventually, the kinetic energy converted into the energy of the shock wave, accumulated in the transmitter after hitting the piston, is given by the formula:
The energy (19) depends on the square of the current through the solenoid (depends on the magnetic pressure). This is similar to the formula for energy in an electric circuit (based on the formula for power and Ohm’s law), and, in fact, it is. In formula (19), the second factor in the form of a fraction is expressed after simplification in units of Ωs, i.e., it is used in the analogy of Ohm’s law and includes the time of electricity supply.
All considerations regarding the movement of the transmitter for the pneumatic version of the apparatus remain valid. This means that, also in the case of the electromagnetic solution, the effect of reducing the energy flux density of the shock wave appears with the increase in the operating frequency of the apparatus.
Unfortunately, to this day, there is no mathematical apparatus that allows one to directly transform the value of electric energy (not to mention the kinetic energy of the transmitter) consumed by the device into the shock wave energy flux density of the selected cross-section
Φ (even the cross-section coinciding with the transmitter front end). The authors of the study have attempted to find such a relationship using computer simulation with the finite element method, trying to determine the deformation of the transmitter elastomer based on the force exerted by the projectile/piston on the transmitter. A similar approach present papers [
21,
22]. In paper [
22], the authors attempted to relate the speed (11, 18) with the energy flux density (4), assuming that the speed (11, 18) is proportional to the sound pressure (3). In paper [
10], measure (4) depends on the force applied by the transmitter on the tissue.
Nevertheless, as the principle of conservation of energy claims, the shock wave energy is part of the kinetic energy of the transmitter. In other words, it is a supremum of the shock wave energy in the plane containing the transmitter front. Corresponding to the pneumatic version, the following is obtained:
The electromagnetic is also obtained:
The rest of the energy is lost in the form of heat and kinetic energy after the projectile/piston has hit the transmitter. Due to the transitivity of inequalities (20, 21), it is possible to use them to determine the equivalents of the parameters of pneumatic and electromagnetic solutions. Practically speaking, for the known operating parameters of a pneumatic generator, its electromagnetic equivalent can be selected, and vice versa.
To sum up, having the problem outlined, in the next step, we prepared an experimental test bench to measure the energy of the shock wave in relation to the device settings—more precisely, for the device constant power, the frequency of its operation was increased.


