Article

Surface Subsidence Monitoring in Kunming City with Time-Series InSAR and GNSS

1
Faculty of Land Resources Engineering, University of Science and Technology, Kunming 650093, China
2
Yunnan Basic Surveying and Mapping Technology Center, Kunming 650228, China
*
Author to whom correspondence should be addressed.
Appl. Sci. 2022, 12(24), 12752; https://doi.org/10.3390/app122412752
Submission received: 20 November 2022 / Revised: 5 December 2022 / Accepted: 9 December 2022 / Published: 12 December 2022

Abstract

:
Kunming city is located in the middle of Yunnan Province. Due to large-scale groundwater exploitation and urban development in recent years, this area has been affected by surface subsidence. In this paper, Interferometric Synthetic Aperture Radar (InSAR) and Global Navigation Satellite System (GNSS) data are used to monitor the surface subsidence in Kunming city area for better analysis and understanding. The study used data of Sentinel-1A from 2018 to 2020 with atmospheric correction based on GACOS to calculate the average annual subsidence rate in Kunming city area, and the results show that the maximum subsidence rate is 48 mm/year. The subsidence obtained by InSAR is compared with the vertical deformation information obtained by eight GNSS stations in continuous operation in the study area. The subsidence rate trend show by the two methods is consistent, which further verifies the validity of InSAR data to reflect the local deformation. Experimental results shown that the eastern and northeastern Dianchi lake areas were affected by underground resources mining, and the induced surface subsidence characteristics were obvious, with the surface subsidence rate reachde 48 mm/year and 37 mm/year respectively. The Kunyang Phosphate Mine also had different degrees of mining subsidence disaster, with the maximum subsidence rate reached 36 mm/year. The subsidence rate of InSAR and GNSS has the same trend on the whole. However, GNSS sites are generally located in stable areas, the settlement amount obtained in the same time period is somewhat different from that of InSAR.

1. Introduction

The traditional deformation monitoring is carried out by laying leveling network, but it is easy to be affected by human error due to the large observation workload and long observation duration. Moreover, the control surface and control accuracy are poor, and the spatial sampling rate is insufficient, so the deformation region cannot be effectively obtained from the monitoring data. Especially in the case of a wide monitoring range, it is difficult to systematically, comprehensively, timely and reliably grasp the distribution and development law of regional surface subsidence. Therefore, in the early identification and monitoring of surface deformation, a method is needed to monitor the deformation area on a large range in a short period of time, so as to provide reliable results for the early identification and continuous monitoring of the geological disaster areas [1,2,3,4,5]. InSAR has the advantages of high precision, large area and high resolution [6]. In the past decade, InSAR has been widely used in the study of glacier movement [7,8], seismic activity [9,10,11] and volcanic activity [12]. GNSS has a high temporal resolution. Therefore, combining the advantages of InSAR and GNSS, the GNSS vertical displacement measurement in a long observation period with the InSAR vertical deformation observation in a high density is of great significance for further understanding of the formation mechanism of surface deformation. It is mainly used in earthquake [13], landslide [14], fault [15] and other geological disasters and urban deformation monitoring [16]. In the study of large-scale regional subsidence, Orhan et al. monitored the subsidence velocity of the Karapinar Basin by using Sentinel-1 and COSMO-SkyMed SAR data [17]. Tosi et al. used TerraSAR-X data to obtain the monitoring results of surface subsidence in the coastal areas of Venice [18]. Neelmeijer et al. used ENVISAT ASAR data to monitor the surface deformation around the Toktogul reservoir in Kyrgyzstan [19]. Yang Zhang et al. used RADARSAT-2 data to monitor Wuhan and concluded that the surface subsidence was related to three factors: groundwater exploitation, subway excavation and urban construction [20]. In these cases, InSAR technology provides researchers with a reliable means of monitoring. introduction should briefly place the study in a broad context and highlight why it is important.
Differential InSAR (D-InSAR) uses external DEM or three-track/four-track differential to monitor surface deformation. However, D-InSAR technology is prone to the interference of time and space discoherence, and its measurement accuracy is affected due to atmospheric factors, which is difficult to eliminate [21,22,23]. In order to overcome the shortcomings of D-InSAR, many scholars in China and other countries have carried out a series of researches on time series InSAR, such as Small Baseline Subset (SBAS) InSAR technology. This method is a time-series insar surface deformation inversion technique proposed by Berardino [24] in 2002. SBAS technique can reduce the influence of space-time discoherence by setting time and space thresholds, so as to screen out interference pairs with high coherence. This technique can make use of highly coherent targets of persistent scatterers (such as buildings) in the region to monitor the deformation of the region in a wide range, with accuracy up to millimeter [25]. Based on the above advantages, SBAS technology has been successfully applied to urban surface subsidence monitoring, landslide monitoring and mining subsidence monitoring [26,27,28,29,30,31]. Although the SBAS-InSAR has made remarkable progress in monitoring subsidence accuracy, the observation data based on only one InSAR is too single.
Based on the above background, this paper uses SBAS-InSAR method and adds GACOS for atmospheric correction to analyze the correction effect of GACOS on interference pairs delay error. Kunming city is located in Dianchi basin, where surface subsidence caused by excessive extraction of confined water and large-scale construction has attracted much attention. Therefore, accurate acquisition of surface subsidence in Kunming city is particularly important for understanding the complex geological environment. Most of the previous literatures focused on the surface subsidence obtained from single data in Kunming city [32,33], while few inversion combined with GNSS data for large-scale surface subsidence. In this paper, 35 Sentinel-1A descenting orbit data covering Kunming city from March 2018–December 2020 are obtained, and the surface subsidence information of Kunming city during this period is extracted by time series processing. At the same time, the data of 8 Continuously Operating Reference Stations (CORS) in this area during January 2019–December 2020 are combined. The GAMIT/GLOBK software is used to solve the problem. The projection results of SBAS-InSAR based on GACOS and CORS in the direction of radar line of sight are compared, and the time series comparison results of the same period are analyzed. GNSS monitoring data are used for comparative analysis to support the reliability of the results obtained by InSAR technology.
Therefore, under the complex background environment of large area, urban area combined with mountain area, dense vegetation, excessive exploitation of groundwater and wide distribution of wetland water body in Kunming City, this paper tries to apply SBAS time series analysis technology combined with GNSS technology to land subsidence monitoring in Kunming City, and compares and verifies the observation results, so as to provide reference for land subsidence monitoring under complex background.

2. Methods

2.1. Fundamental Principle of SBAS-InSAR Technique

SBAS-InSAR is an InSAR time series analysis method proposed by Berardino [24], which improves the problems of spatial and atmospheric incoherence existing in D-InSAR method. Compared with the Permanent Scatterer (PS) InSAR, it reduces the requirement of SAR data volume and has the advantage of continuous deformation sequence in space monitoring. The core idea is to use a reasonable spatio-temporal baseline to set one of the scene images as the main image, and the other slave images are registered with the main image to obtain several interference pairs. Then the singular value decomposition (SVD) method of matrix is used for joint solution [34], so as to obtain the deformation information of the study area within the time span.
Assuming that N + 1 SAR images ( t 1 , t 2 , , t N ) are acquired within the time range of the same region, M differential interferograms can be generated. M satisfies the following formula:
N + 1 2 M N N + 1 2
If t 1 is set as the initial time, then for values in t A , t B ( t A < t B ) time obtained image generated interferogram, the phase of any point ( x ,   r ) is as follows:
δ φ j x , r = φ t B , x , r φ t A , x , r φ f l a t + φ t o p o + φ d e f + φ a t m o + φ n o i s e
In the formula, φ f l a t , φ t o p o , φ d e f , φ a t m o , φ n o i s e respectively represent the flat phase, terrain phase, surface deformation phase, atmospheric phase and noise phase. φ t B ,   x ,   r , φ t A ,   x ,   r represent the t A , t B time two images in ( x ,   r ) point of phase [35].
φ a t m o is separated from the interferometric phase by a time high pass filter and a space low pass filter. After removing the atmospheric component, the interferometric phase is mainly composed of the surface deformation phase and the residual elevation component. Suppose that a rate vector can be used to represent a linear model. In order to obtain surface deformation information and residual elevation component, the surface deformation phase φ d e f in Equation (2) can be converted into the product of average phase rate and adjacent time interval:
v T = v 1 = 2 t 2 t 1 , , v N 1 = N N 1 t N t N 1
φ t o p o = 4 π λ B j z R s i n θ
In the formula,   λ represents radar wavelength, B j represents the perpendicular baseline of the interference on j, θ is the incident angle, z is the height error, Matrix C is defined as follows:
C M × 1 = 4 π λ B 1 R s i n θ , , 4 π λ B M R s i n θ
Then the observation equation is as follows:
C v = D · z = δ
where D corresponds to the M × (N − 1) coefficient matrix, and the deformation rate can be extracted from Equation (6) by SVD method. Finally, the corresponding time series can be calculated according to the time interval between image acquisition.

2.2. Data Processing Flow

In this paper, Kunming city is taken as the research object, InSAR and GNSS technologies are combined to obtain the information of surface deformation in the study area, and the temporal and spatial distribution trend of surface deformation is analyzed. The research content is mainly divided into the following four points: First, based on the GACOS-assisted SBAS-InSAR technology, the land vertical deformation field characteristics of the 2018–2020 time series in Kunming city area are obtained, and the spatio-temporal distribution is analyzed. Secondly, the vertical deformation of typical areas are analyzed. Thirdly, CORS observation data from 2019 to 2020 is utilized for networking solution and adjustment with neighboring IGS stations. Obtain the precise three-dimensional coordinates of the single-day CORS station under the framework of International Terrestrial Reference Frame 2014 (ITRF2014) and the Eurasian reference frame, transfer the velocity under the ITRF frame to the background of the Eurasian plate. The vertical velocity field of CORS station with no net rotation is obtained, and the vertical motion characteristics of CORS station is analyzed. Fourthly, compare and analyze the vertical deformation rate of CORS station and InSAR under the Eurasian reference frame. The data processing flow is shown in Figure 1.

3. Dataset and Processing

3.1. Study Area

Kunming city in central Yunnan province (24°23′–26°33′ N, 102°10′–103°40′ E) is selected as the research area. The specific research area is located in the yellow rectangle covered area in Figure 2. The triangle represents 8 CORS sites. It is located in the Yunnan-Guizhou Plateau. The overall terrain gradually decreases from north to south, the central uplift, the east and west sides are lower, and the average elevation is 1900 m. The Kunming Basin is located in the Late Cenozoic fault basin of Kunming. The Quaternary loose sediments with thickness of 100–400 m are widely developed. The main composition structure is loose, and there are a large amount of clay rich in pore water, large void and high compression ratio [35]. The groundwater in the land part is rich, mainly karst water. The geological structure in the region is complex, the crustal movement is active, and many active faults are developed, such as Pudu River West Hill fault, Heilongtan-Guandu fault, etc. The study area is dominated by lacustrine landform, and the soil types are mainly silty soil and soft clay of lacustrine facies, which are easy to be eroded by running water. In recent years, with the acceleration of urbanization and the concentration of population and economy in large and medium-sized cities, the rapid increase of industrial water consumption has led to the rapid reduction of confined water level and the frequent occurrence of serious geological disasters such as surface subsidence.

3.2. Data

In this paper, 35 Sentinel-1A descenting orbit images are selected from about 3 years from March 2018–December 2020. The imaging mode is IW, the image incidence angle is 39.61°, the polarization mode is VV and the resolution is 5 m × 20 m. Furthermore, the Digital Elevation Model (DEM) selected in this paper is derived from the Shuttle Radar Topography Mission (SRTM) data of NASA with a resolution of 30 m. At the same time, the CORS data sampled in the 30 s during January 2019–December 2020 are obtained. Since the ascending orbit images during the same period could not completely cover the study area, the monitoring situation of deformation in the study area can’t be compared, so the comparative analysis is carried out based on the CORS data.

3.3. SBAS-InSAR Data Processing

Using ISCE + StaMPS software, SBAS-InSAR is used to process time series data. Firstly, in order to suppress spatio-temporal de-correlation images, the time baseline threshold is set as 150 d, and the spatial baseline threshold is set as 180 m. Based on the spatio-temporal baseline distance, images with the date 2 June 2018 is selected as the main image, and the remaining images are registered with the main image respectively as the slave image, to generate 92 pairs of differential interferometry pairs. Figure 3 shows the combination of the selected differential interferometry pairs. DEM is then used to remove terrain phase.
In order to improve the monitoring accuracy of SBAS-InSAR technology, the error term of Equation (2) should be effectively estimated and removed. On this basis, the linear relationship between the elevation error and the baseline is analyzed. On this basis, the linear relationship between the elevation error and the baseline was analyzed. 981,456 candidate points are obtained by setting the amplitude deviation index of the registered image. Combined with the noise characteristics of pixels, 205,336 PS points are finally selected and extracted. The distance and azimuth multivisual ratio is 4:1. The filtering method is Goldstein, and the unwrapping method is the Minimum Cost Flow based on Delaunay triangulation network. During this process, 82 interference pairs are retained for SBAS data after the interferogram with large unwrapping errors and orbit errors in the initial differential interference pair is removed. In the conventional InSAR analysis methods for temporal sequences, time high-pass filtering and space low-pass filtering are usually used to separate the atmospheric phase, but some scholars find that this spatio-temporal filtering method is carried out on the assumption that the atmospheric delay is not time dependent. Therefore, this paper proposes to use GACOS model to correct the atmosphere.
The atmospheric correction delay is corrected using StaMPS SBAS from GACOS, which is based on the high resolution European Centre for Medium-Range Weather Forecasts (ECMWF) atmospheric numerical product of 0.1° × 0.1° grid [36]. In this paper, GACOS data corresponding to SAR images involved in unwrapping are obtained. The GACOS data corresponding to the main image is shown in Figure 4a. The atmospheric delay phase standard deviation STD is used as the atmospheric evaluation index. As shown in Figure 4b, it can be seen that the STD change rate after correction is significantly reduced by 76.8%, which indicates that GACOS has a certain effect on the correction of atmospheric delay.

3.4. GNSS Data Processing

The integrated satellite positioning service system of Yunnan province is put into network operation at the end of 2015, and there are 220 base stations in uniform distribution. As shown in Figure 3, 8 CORS stations in Kunming city are selected, the data sampling interval is 30 s, and 5 IGS stations in China and its surrounding areas are combined, namely BJFS, CHAN, CUSV, HYDE and ARTU. The aim is to introduce the IGS station coordinates and frame into the baseline solution process and reduce the calculation error caused by the inaccurate station coordinates. GAMIT/GLOBK software developed by Massachusetts Institute of Technology is used for baseline solution and adjustment. Due to the lack of data of CORS related sites in 2018, only the single-day solution time series of CORS stations in Kunming city during January 2019–December 2020 and the accurate three-dimensional coordinates under the ITRF2014 framework is obtained.
In the vertical time series of each station, although high-precision data processing software is adopted, there is noise pollution in both the collection and mathematical modeling of the original data. In order to better eliminate noise pollution and reduce errors, the nonlinear low-frequency reconstruction of the original time series obtained from the station is carried out. The Chebyshev function is used as the basis function to construct a low-frequency curve for each observation time series, and then the curve obtained in the above step is the baseline for gross error detection. The threshold value of gross error detection and elimination is set as 3 times the standard deviation to obtain the time series after gross error detection and elimination, and then linear term separation and nonlinear term low-frequency reconstruction were carried out. The time series of vertical deformation of CORS station is obtained by adding the nonlinear term, constant term and linear term after low-frequency reconstruction. Limited by space, only 3 CORS station time series are shown in this paper, as shown in Figure 5. Red represents the original time series, blue represents the low-frequency reconstruction terms, black represents linear changes, and green represents residuals. It can be seen from the figure that the time series presents certain rules in the same time period.

4. Results and Discussion

Through data processing, the surface deformation rate of 2018–2020 time series in the study area is finally obtained, as shown in Figure 6. As can be seen from the figure, there is no large area of violent vertical movement in Kunming city area, and the subsidence rate ranges from −48 mm/year to 26 mm/year (Negative value indicates land subsidence, while positive value indicates uplift). The surface subsidence area is mainly distributed in the southwest, east and northeast of Dianchi Lake, and there is no continuous subsidence field. However, relevant departments should pay attention to it and prevent geological disasters such as surface subsidence in advance. In the Kunyang Phosphate Mine in the southwest of Dianchi Lake, the maximum deformation rate exceeds 35 mm/year due to the surface subsidence caused by underground mining.

4.1. The Northeast Area of Dianchi Lake

The surface subsidence in the northeast of Dianchi Lake has been serious for a long time. As can be seen from the monitoring results, the surface subsidence in this region is still significant, with the maximum deformation rate exceeding 37 mm/year, as shown in Figure 7a. The area with obvious subsidence characteristics is divided into three areas, namely P1, P2 and P3. The P1 region is the area of Fuhai-Hewei village- Yuhu village, which shows a zonal distribution, and the average annual subsidence rate is about −20.51 mm/year–−2.64 mm/year. Area P2 is the convention and exhibition center with a zonal distribution, and the average annual subsidence rate is about −33.71 mm/year–−9.94 mm/year. Area P3 is the area of Xiaobanqiao-Guangwei village. It is a traditional settlement area with an oval shape, and the average annual subsidence rate is −24.66 mm/year–−6.51 mm/year.
In order to analyze the deformation law of each subsidence area in this region over time, time series cumulative subsidence maps of P1, P2 and P3 are extracted, as shown in Figure 7b. The cumulative deformation of P1, P2 and P3 in this period reached 30 mm, 70 mm and 50 mm respectively, showing a continuous downward trend. In the area of the convention and exhibition center, the cumulative subsidence accelerated from February 2019–March 2019 and September 2019–October 2019 but slowed down from November 2019– December 2020.

4.2. The Eastern Area of Dianchi Lake

Figure 8 shows the deformation results in eastern of Dianchi Lake. As can be seen from the figure that a relatively obvious settlement occurred. Xinjie town is taken as the settlement center and moved eastward to Pingzheng village-Sanjieqiao area, with the average annual subsidence rate is −33.39 mm/year–−9.57 mm/year. The area with the largest deformation magnitude is located near the central hospital of Xinjie town, with the maximum settlement rate exceeding −33 mm/year. The time series cumulative settlement diagram of a typical deformation P4 is selected, and it can be seen that with the passage of time, there is a continuous downward trend, and the subsidence rate is fast. By the end of 2020, the cumulative settlement has exceeded 75 mm.

4.3. Mining Area

Underground mining is also one of the causes of surface subsidence. The surface subsidence caused by mining is becoming more and more serious. As a result, land, cultivated land and farmland were destroyed and a large number of cave-in pits were produced, which had a great impact on people’s life, property and social and economic development. Kunyang Phosphate Mine is a large open pit, consisting of a dump, reclamation area and 6 stopes. Due to dense vegetation and other reasons, the high coherence points obtained in this area are few, resulting in less deformation information available. It can be seen from the results of this monitoring that there is an obvious settlement with a zonal distribution, and the maximum deformation rate exceeds 35 mm/year. The maximum deformation is located in the dump around the second mining area. With the passing of mining time, the deformation range gradually becomes larger, and the cumulative settlement of P5 points in this area exceeds 90 mm, as shown in Figure 9. At present, mining operations have been stopped in the first mining area and the northern part of the second mining area, and the reclamation work has been completed. The restricted mining area is gradually reduced, and the restricted mining area plays a good role in controlling the regional surface subsidence.

4.4. Factors of Land Subsidence in Kunming City

According to the partial settlement analysis of the above three parts, in the northeast of Dianchi Lake, the settlement of the area around the Convention and Exhibition Center is the most obvious. The main reason is related to the soft soil bottom around the Dianchi Lake. In recent years, large-scale projects have been built in this area, and due to its proximity to Dianchi Lake, the bottom layer of soft soil has been compressed, resulting in ground settlement under the action of building load and its own gravity. The area of Fuhai-Hewei village- Yuhu village has a relatively small settlement. Since the introduction of Kunming City groundwater exploitation policy, groundwater exploitation around this area has been restricted. Meanwhile, after the long-term compression of Quaternary sediments, soil consolidation and compression to the extreme result in the disappearance of large settlement area. The subsidence factor of Kunyang Phosphate Mine is due to the exploitation of underground resources. The regional subsidence of Kunming City is influenced by the structure of central Dianchi Lake. The geological structure can make the surface area descend or uplift, displace the rock layer, and land disturbance affect the underground water flow field, which leads to the crustal deformation. Secondly, due to the industrial development, a large amount of groundwater is drawn, which leads to the subsidence phenomenon in the urban center area far away from Dianchi Lake.

4.5. Comparative Analysis of Vertical Deformation Informationining

In order to better study the accurate relative deformation in Kunming city area, it is necessary to transfer the velocity under the ITRF2014 framework to the background of the Eurasian plate. In order to analyze the vertical velocity field under the overall no-net rotation datum of the CORS reference station. 5 reference points are taken as the stable reference datum. Based on the measured velocity of the CORS station under the ITRF2014 framework. The ordinary least squares is used to estimate the Euler vector of the whole site relative to ITRF2014 frame, and then the measured velocity and the Euler vector model can be inversely calculated. Since there are only 8 stations used, in order to better reflect the deformation effect, this paper adopts the Kriging method to interpolate the velocity field in Kunming city area. This method is an unbiased and optimal interpolation method for the interpolation of discrete points with uneven space. According to the distribution of 8 CORS stations in this paper, 10 m × 10 m grid division is carried out in the range of 102° E–103° E, 24° N–25° N, and the velocity field in the vertical direction was interpolated. As shown in Figure 10, the error ellipse represents 95% confidence. The vertical velocity field obtained by CORS station is compared with the deformation rate of InSAR in the same time period, and the results are shown in Table 1.
According to the comparison results of deformation rates between InSAR and CORS, the vertical motion trend of Dianchi Lake rising in the west and falling in the east is generally reflected. As shown in Figure 10, the area around Xinjie town in the east of Dianchi Lake presents a downward trend, with the maximum settlement velocity reaching about 40 mm/year, while the area in the west presents an upward trend, with a rising velocity of 2–17 mm/year. The settlement trends obtained by two different monitoring methods are consistent. The average annual subsidence rate of site XIAH and QINL are high, reaching −45.57 mm/year and −40.53 mm/year, respectively, while the CHG0 site is stable and the average annual subsidence rate is low, reaching 0.58 mm/year. The Root Mean Square Error (RMSE) is taken as the evaluation index, see Formula (7). The RMSE of ANNI, BJIE, CHGO and other 5 stations are respectively 0.78 mm, 0.63 mm, 6.20 mm, 0.41 mm, 3.50 mm, 1.83 mm, 0.34 mm and 1.56 mm. Through calculation, the residuals of the two stations are all within 10 mm and the maximum is 7.04 mm, the minimum is 1.65 mm. It shows that SBAS-InSAR method is suitable for monitoring surface subsidence and has certain reliability.
R M S E = 1 m i = 1 m H i h i 2
In the formula, h i is the settlement value of CORS of data point i. H i is the settlement value of the i point corresponding to the CORS position on the SAR image. m is the number of SAR data points corresponding to CORS points.
Generally, stable sites are selected for the construction of CORS station. In order to more accurately analyze the cumulative deformation of InSAR time series. Equation (8) is used to convert the settlement value in LOS direction monitored by SBAS method into the settlement value in vertical direction, and points within 100 m radius around CORS station are selected for comparison. The results are shown in Figure 11.
D = h L O S c o s θ
In the formula, h L O S represents the settlement value of radar line of sight. D represents the deformation value in the vertical direction.
As can be seen from Figure 11, InSAR and CORS have different data acquisition means, observation time, processing methods, error models, etc., and certain systematic deviations may exist in the settlement results of different time series obtained. Because the accuracy of the two inversion is not in the same order of magnitude, the jump of CORS solution results is obvious. Due to the geometric characteristics of GNSS tech-nology, the accuracy in the vertical direction is slightly lower than that in the plane coor-dinate. Therefore, in the comparison of the variation trend of the Cumulative settlement amount of the sites, the monitoring results of GNSS technology showed an abnormal change of 10–18 mm residual. InSAR vertical deformation plane information reflects the local surface subsidence of Kunming city in detail, and several subsidence areas are detected. However, at present, there are few or no CORS sites in the subsidence area, so reliable point and linear vertical deformation information in the subsidence area cannot be obtained. The vertical deformation and range of its interpolation have certain deviations from the vertical deformation of InSAR. However, on the whole, InSAR and CORS show consistency in amplitude and trend.
SBAS-InSAR technology can monitor large-scale deformation, and by adding GACOS model for atmospheric correction, remove the tropospheric atmospheric delay error, and obtain more accurate inversion results. The accuracy of the CORS solution in the vertical direction is 2–3 times lower than that in the horizontal direction, but the error is within millimeter compared with that of the SBAS. Although the CORS sites are not distributed in the subsidence center, the subsidence results obtained by interpolating the velocity field in the vertical direction are highly consistent with those obtained by the SBAS. At the same time, through the analysis of the cumulative deformation of time series of 8 stations, due to the difference of data acquisition means, observation time, processing method and error model of SBAS and CORS, the deformation results of different time series may have some systematic deviation, but generally in the same period of time, the trend is consistent with the results of SBAS. Therefore, GNSS technology can be applied to the deformation region of SBAS monitoring results.

5. Conclusions

In this study, a total of 35 Sentinel-1A images during 22 March 2018–24 December 2020 were used for SBAS processing, and the observation data of 8 CORS stations during 2019–2020 were used to monitor surface deformation in the study area It can be seen from the data processing results that the two different monitoring methods have the ability to monitor the surface deformation no matter from the region or the site. This study can draw the following conclusions.
(1)
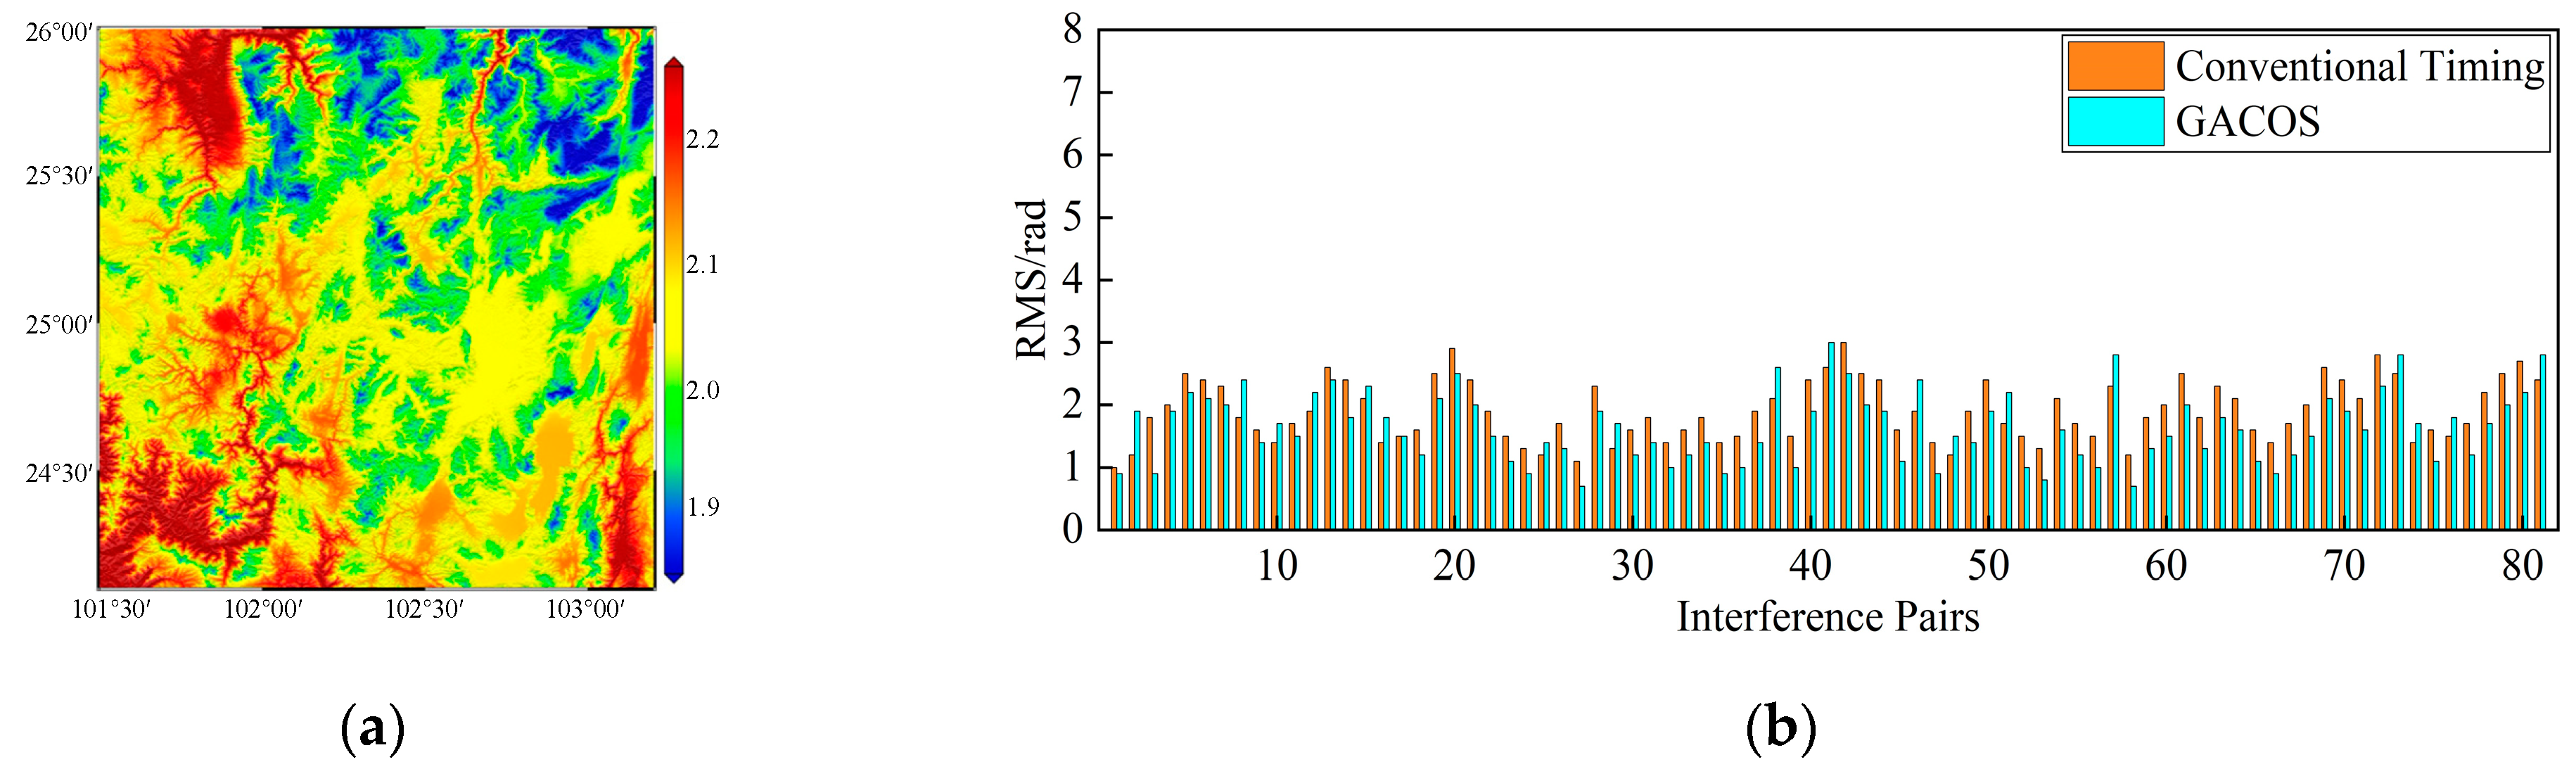
The surface deformation of Kunming City was monitored by GACOS-assisted SBAS technology, and the standard deviation of STD was corrected by 76.8%. The overall subsidence rate of Kunming City was obtained in the range of −48 mm/year–26 mm/year.
(2)
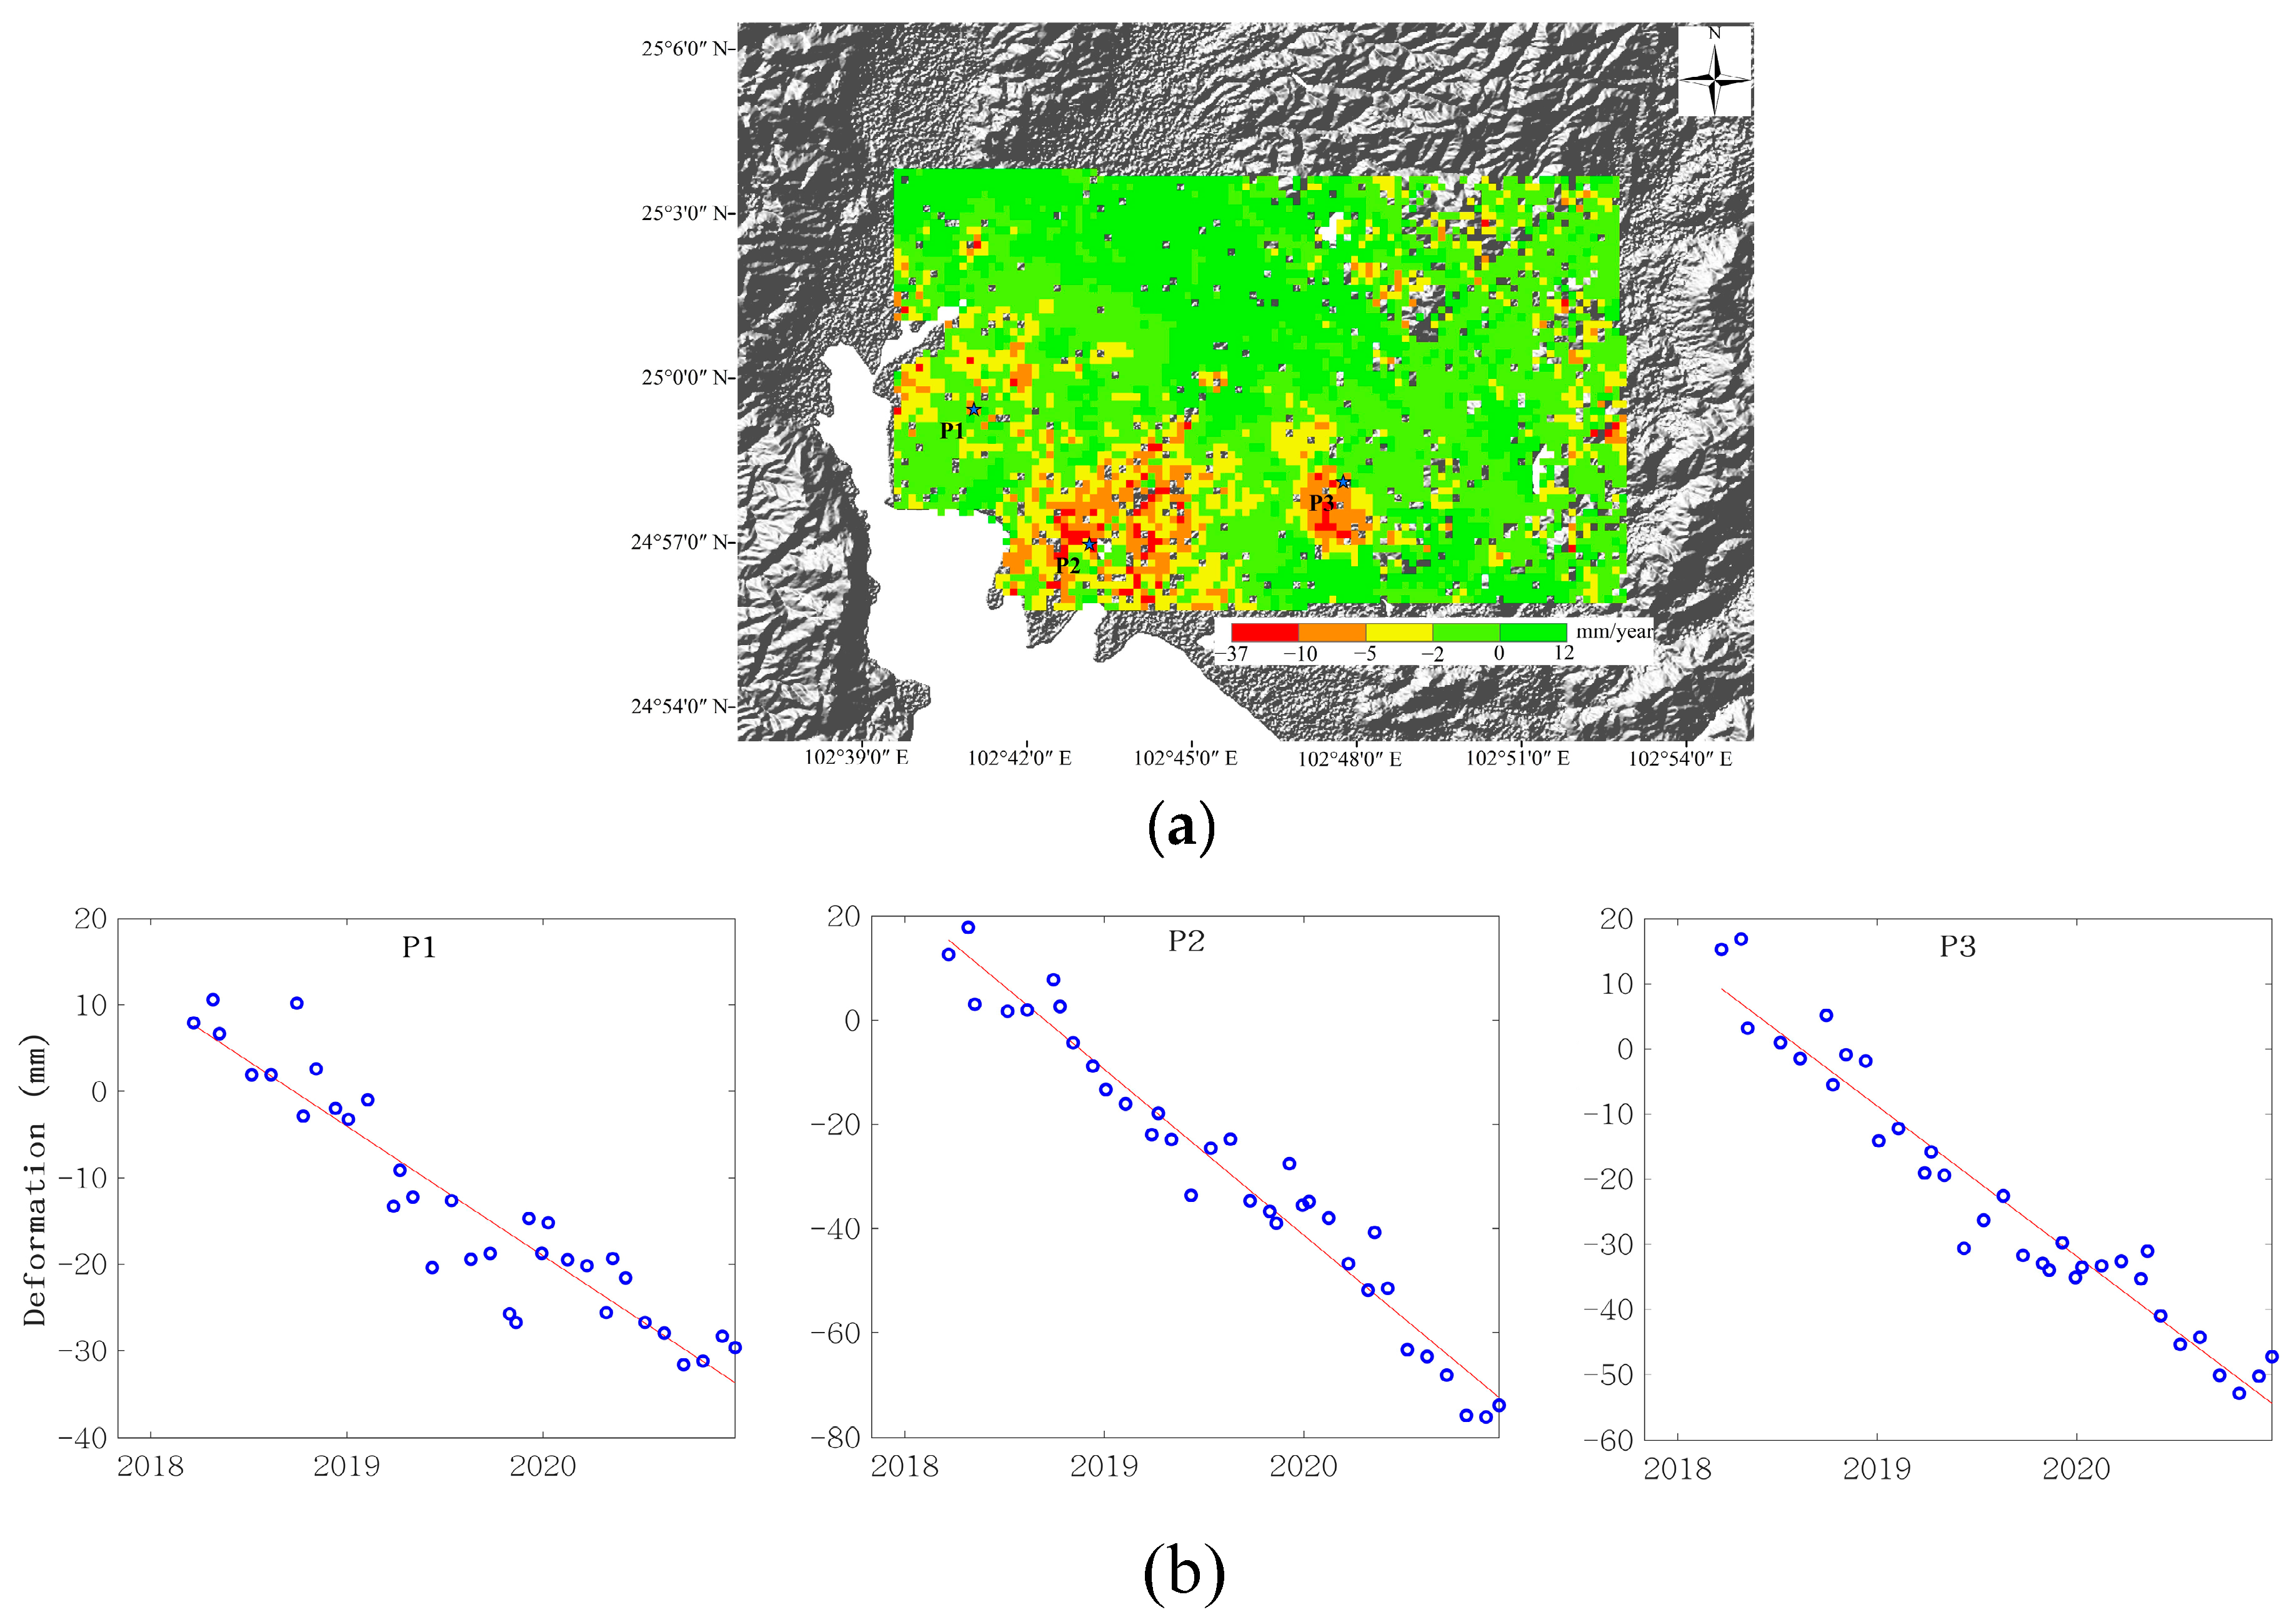
The main settlement areas are Fuhai-Hewei village- Yuhu village, Convention and Exhibition Center, Xiaobanqiao-Guangwei village, Pingzheng village-Sanjieqiao area and Kunyang Phosphate Mine. Fuhai-Hewei Village- Yuhu Village area, Convention Center area, Xiaobanqiao-Guangwei Village area, Pingzheng Village-Sanjie Bridge area and Kunyang phosphate mining area. The maximum subsidence rate reached −35 mm/year. The subsidence factor is related to the compression of soft soil layer caused by large-scale development projects and the exploitation of groundwater.
(3)
The observation data of 8 CORS stations during 2019–2020 were calculated, and Kring interpolation was performed on them. The results were compared and verified with the SBAS results in the same period. The maximum RMSE value was 6.20 and the minimum RMSE value was 0.34.
(4)
Since the accuracy of SBAS and CORS inversion is not in the same order of magnitude, the jump of CORS solution is relatively clear. The settlement results of different time series have some systematic deviation.
Considering the factors of surface deformation in Kunming city, it is mainly due to the excessive exploitation of groundwater, excessive urban construction load and underground mining of mineral resources. The deformation area is mainly distributed in the eastern and northeastern Dianchi Lake and Kunyang Phosphate Mine area, which seriously restricts the urban development process. Therefore, relevant departments should pay attention to the deformation area, strengthen the real-time monitoring and formulate relevant prevention and control measures.

Author Contributions

Designed the experiment, S.Z.; methodology, X.Z., S.G. and Y.L.; carried out the experiment. S.Z.; analyzed the experimental results, S.Z. and C.L.; participated in the discussion of the experimental conclusion, S.Z., Y.L. and S.G.; resources, X.Z. and K.S.; writing—original draft preparation, S.Z.; writing—review and editing, S.Z.; visualization, C.L. All authors have read and agreed to the published version of the manuscript.

Funding

This research was funded by the National Natural Science Foundation of China (No: 42161067).

Institutional Review Board Statement

Not applicable.

Informed Consent Statement

Not applicable.

Data Availability Statement

The data used to support the findings of this study are available from the corresponding author upon request.

Acknowledgments

We thank the European Space Agency for providing the Sentinel-1A SAR data freely. Thanks to Shi Ke of Yunnan Basic Surveying and Mapping Technology Center for providing Kunming city CORS data, which provides available validation data for this paper.

Conflicts of Interest

The authors declare no conflict of interest.

References

  1. Xu, J.Q.; Ma, T.; Lu, Y.K.; Bai, W.M.; Zhao, S. Land subsidence monitoring in North Henan plain based on SBAS-InSAR technology. J. Jilin Univ. 2019, 49, 1182–1191. [Google Scholar]
  2. Zhu, J.J.; Li, Z.W.; Hu, J. Research progress and methods of InSAR for deformation monitoring. Acta Geod. Cartogr. Sin. 2017, 46, 1717–1733. [Google Scholar]
  3. Hu, B.; Chen, J.; Zhang, X. Monitoring the surface subsidence area in a coastal urban area with InSAR and GNSS. Sensors 2019, 19, 3181. [Google Scholar] [CrossRef] [Green Version]
  4. Perissin, D.; Wang, T. Time-series InSAR applications over urban areas in China. IEEE J. Sel. Top. Appl. Earth Obs. Remote Sens. 2010, 4, 92–100. [Google Scholar] [CrossRef]
  5. Herrera, G.; Gutiérrez, F.; García-Davalillo, J.C.; Guerrero, J.; Notti, D.; Galve, J.P.; Fernández-Merodo, J.A.; Cooksley, G. Multi-sensor advanced DInSAR monitoring of very slow landslides: The Tena Valley case study (Central Spanish Pyrenees). Remote Sens. Environ. 2013, 128, 31–43. [Google Scholar] [CrossRef]
  6. Wang, Z.; Zhang, J.; Huang, G. Precise monitoring and analysis of the surface subsidence in Jining coal mining area based on InSAR technique. J. China Univ. Min. Technol. 2014, 43, 169–174. [Google Scholar]
  7. Reinosch, E.; Gerke, M.; Riedel, B.; Schwalb, A.; Ye, Q.; Buckel, J. Rock glacier inventory of the western Nyainqêntanglha Range, Tibetan Plateau, supported by InSAR time series and automated classification. Permafr. Periglac. Process. 2021, 32, 657–672. [Google Scholar] [CrossRef]
  8. Brencher, G.; Handwerger, A.L.; Munroe, J.S. InSAR-based characterization of rock glacier movement in the Uinta Mountains, Utah, USA. Cryosphere 2021, 15, 4823–4844. [Google Scholar] [CrossRef]
  9. Magen, Y.; Ziv, A.; Inbal, A.; Baer, G.; Hollingsworth, J. Fault rerupture during the July 2019 Ridgecrest earthquake pair from joint slip inversion of InSAR, optical imagery, and GPS. Bull. Seismol. Soc. Am. 2020, 110, 1627–1643. [Google Scholar] [CrossRef]
  10. Liu, F.; Elliott, J.R.; Craig, T.J.; Hooper, A.; Wright, T.J. Improving the resolving power of InSAR for earthquakes using time series: A case study in Iran. Geophys. Res. Lett. 2021, 48, e2021GL093043. [Google Scholar] [CrossRef]
  11. Cheloni, D.; De Novellis, V.; Albano, M.; Antonioli, A.; Anzidei, M.; Atzori, S. Geodetic model of the 2016 Central Italy earthquake sequence inferred from InSAR and GPS data. Geophys. Res. Lett. 2017, 44, 6778–6787. [Google Scholar] [CrossRef]
  12. Gatsios, T.; Cigna, F.; Tapete, D.; Sakkas, V.; Pavlou, K.; Parcharidis, I.S. Copernicus sentinel-1 MT-InSAR, GNSS and seismic monitoring of deformation patterns and trends at the Methana Volcano, Greece. Appl. Sci. 2020, 10, 6445. [Google Scholar] [CrossRef]
  13. He, Z.; Chen, T.; Wang, M.; Li, Y. Multi-segment rupture model of the 2016 Kumamoto earthquake revealed by InSAR and GPS data. Remote Sens. 2020, 12, 3721. [Google Scholar] [CrossRef]
  14. Maurya, V.K.; Dwivedi, R.; Martha, T.R. Site scale landslide deformation and strain analysis using MT-InSAR and GNSS approach-A case study. Adv. Space Res. 2022, 70, 3932–3947. [Google Scholar] [CrossRef]
  15. Lazos, I.; Papanikolaou, I.; Sboras, S.; Foumelis, M.; Pikridas, C. Geodetic Upper Crust Deformation Based on Primary GNSS and INSAR Data in the Strymon Basin, Northern Greece—Correlation with Active Faults. Appl. Sci. 2022, 12, 9391. [Google Scholar] [CrossRef]
  16. Yalvac, S. Validating InSAR-SBAS results by means of different GNSS analysis techniques in medium-and high-grade deformation areas. Environ. Monit. Assess. 2020, 192, 120. [Google Scholar] [CrossRef]
  17. Orhan, O.; Oliver-Cabrera, T.; Wdowinski, S.; Wdowinski, S.; Yalvaç, S.; Yakar, M. Surface subsidence and its relations with sinkhole activity in Karapınar region, Turkey: A multi-sensor InSAR time series study. Sensors 2021, 21, 774. [Google Scholar] [CrossRef]
  18. Tosi, L.; Lio, C.D.; Teatini, P.; Strozzi, T. Surface subsidence in coastal environments: Knowledge advance in the Venice coastland by TerraSAR-X PSI. Remote Sens. 2018, 10, 1191. [Google Scholar] [CrossRef] [Green Version]
  19. Neelmeijer, J.; Schöne, T.; Dill, R.; Klemann, V.; Motagh, M. Ground deformations around the Toktogul reservoir, Kyrgyzstan, from Envisat ASAR and Sentinel-1 data—A case study about the impact of atmospheric corrections on InSAR time series. Remote Sens. 2018, 10, 462. [Google Scholar] [CrossRef] [Green Version]
  20. Zhang, Y.; Liu, Y.; Jin, M.; Jing, Y.; Liu, Y.; Liu, Y.; Sun, W.; Wei, J.; Chen, Y. Monitoring surface subsidence in Wuhan city (China) using the SBAS-InSAR method with radarsat-2 imagery data. Sensors 2019, 19, 743. [Google Scholar] [CrossRef] [Green Version]
  21. Ferretti, A.; Prati, C.; Rocca, F. Permanent scatterers in SAR interferometry. IEEE Trans. Geosci. Remote Sens. 2001, 39, 8–20. [Google Scholar] [CrossRef]
  22. Lanari, R.; Mora, O.; Manunta, M.; Mallorquí, J.J.; Berardino, P.; Sansosti, E. A small-baseline approach for investigating deformations on full-resolution differential SAR interferograms. IEEE Trans. Geosci. Remote Sens. 2004, 42, 1377–1386. [Google Scholar] [CrossRef]
  23. Nonaka, T.; Asaka, T.; Iwashita, K.; Ogushi, F. Evaluation of the trend of deformation around the Kanto Region estimated using the time series of PALSAR-2 Data. Sensors 2020, 20, 339. [Google Scholar] [CrossRef] [PubMed]
  24. Berardino, P.; Fornaro, G.; Lanari, R.; Sansosti, E. A new algorithm for surface deformation monitoring based on small baseline differential SAR interferograms. IEEE Trans. Geosci. Remote Sens. 2002, 40, 2375–2383. [Google Scholar] [CrossRef] [Green Version]
  25. Zhang, Z.; Wang, C.; Wang, M.; Wang, Z.; Zhang, H. Surface deformation monitoring in Zhengzhou city from 2014 to 2016 using time-series InSAR. Remote Sens. 2018, 10, 1731. [Google Scholar] [CrossRef] [Green Version]
  26. Zhang, L.; Dai, K.; Deng, J.; Ge, D.; Liang, R.; Li, W.; Xu, Q. Identifying potential landslides by stacking-InSAR in southwestern China and its performance comparison with SBAS-InSAR. Remote Sens. 2021, 13, 3662. [Google Scholar] [CrossRef]
  27. Yuan, M.; Li, M.; Liu, H.; Lv, P.; Li, P.C.; Zheng, W. Subsidence monitoring base on SBAS-InSAR and slope stability analysis method for damage analysis in mountainous mining subsidence regions. Remote Sens. 2021, 13, 3107. [Google Scholar] [CrossRef]
  28. Du, Q.; Li, G.; Zhou, Y.; Chai, M.; Chen, D.; Qi, S.; Wu, G. Deformation monitoring in an alpine mining area in the Tianshan Mountains based on SBAS-InSAR technology. Adv. Mater. Sci. Eng. 2021, 2021, 9988017. [Google Scholar] [CrossRef]
  29. Chen, Y.; Yu, S.; Tao, Q.; Liu, G.; Wang, L.; Wang, F. Accuracy verification and correction of D-InSAR and SBAS-InSAR in monitoring mining surface subsidence. Remote Sens. 2021, 13, 4365. [Google Scholar] [CrossRef]
  30. Tao, Q.; Guo, Z.; Wang, F.; An, Q.; Han, Y. SBAS-InSAR time series ground subsidence monitoring along Metro Line 13 in Qingdao, China. Arab. J. Geosci. 2021, 14, 2628. [Google Scholar] [CrossRef]
  31. Wu, Q.; Jia, C.; Chen, S.; Li, H. SBAS-InSAR based deformation detection of urban land, created from mega-scale mountain excavating and valley filling in the Loess Plateau: The case study of Yan’an City. Remote Sens. 2019, 11, 1673. [Google Scholar] [CrossRef]
  32. Guo, S.P.; Zhang, W.F.; Kang, W.; Zhang, T.W.; Li, Y. Study on surface subsidence in Kunming city by integrating PS, SBAS and DS InSAR. Remote Sens. Technol. Appl. 2022, 37, 460–473. [Google Scholar]
  33. Zhang, J.M.; Gan, S.; Yuan, X.P.; Qiu, P.R. The extraction and analysis of Kunming city groud deformation characteristics based on PS-InSAR. Sci. Surv. Mapp. 2019, 44, 53–59. [Google Scholar]
  34. Pu, C.H.; Xu, Q.; Jiang, Y.N.; Zhao, K.Y.; Jiang, Y.N.; Liu, J.L.; Kou, P.L. Land Uplift Monitoring and Analysis in Yan’an New District Based on SBAS-InSAR Technology. Geomat. Inf. Sci. Wuhan Univ. 2021, 46, 983–993. [Google Scholar]
  35. Xue, C.D.; Li, X.; Li, B.Z.; Meng, G.T.; Li, F. Mechanism analysis of land subsidence in Kunming city area. Chin. J. Geol. Hazard Control 2004, 3, 51–58. [Google Scholar]
  36. Zhang, C.L.; Li, Z.H.; Yu, C.; Song, C.; Xiao, R.Y.; Peng, J.B. Landslide Detection of the Jinsha River Region Using GACOS Assisted InSAR Stacking. Geomat. Inf. Sci. Wuhan Univ. 2021, 46, 1649–1657. [Google Scholar]
Figure 1. Data processing flow chart.
Applsci 12 12752 g001
Figure 2. SAR data coverage of the study area.
Applsci 12 12752 g002
Figure 3. Time-position of Sentinel-1A image interferometric pairs. Blue line represents the interferometric pairs. The red points are the master and slave Synthetic Aperture Radar (SAR) images.
Applsci 12 12752 g003
Figure 4. (a) GACOS data corresponding to the main image; (b) Standard deviation of atmospheric delay phase.
Applsci 12 12752 g004
Figure 5. CORS sites time series. (a) Temporal analysis of geodetic height change at ANNI station; (b) Temporal analysis of geodetic height change at CHG0 station; (c) Temporal analysis of geodetic height change at KMCH station.
Applsci 12 12752 g005aApplsci 12 12752 g005b
Figure 6. Velocity maps in line of sight (LOS) of the study area.
Applsci 12 12752 g006
Figure 7. (a) Deformation rate in the northeast of Dianchi Lake; (b) Time series cumulative settlement diagram of P1, P2 and P3 points.
Applsci 12 12752 g007
Figure 8. Deformation rate in the east of Dianchi Lake and time series cumulative settlement diagram of P4.
Applsci 12 12752 g008
Figure 9. Deformation rate in the mining area and time series cumulative settlement diagram of P5.
Applsci 12 12752 g009
Figure 10. Vertical velocity field after interpolation.
Applsci 12 12752 g010
Figure 11. Comparison diagram of CORS sites and InSAR time series cumulative shape variables.
Applsci 12 12752 g011
Table 1. Comparison of annual average deformation rates between InSAR and CORS data.
StationCORS/(mm/Year)InSAR/(mm/Year)RMSE/mm
ANNI5.993.500.78
BJIE−10.10−12.340.63
CHG00.587.626.20
JINN−31.76−33.570.41
KMCH2.497.783.50
QINL−40.53−44.361.83
TJIE−16.28−17.930.34
XIAH−45.57−49.101.56
Publisher’s Note: MDPI stays neutral with regard to jurisdictional claims in published maps and institutional affiliations.

