Article

Investigating the Antioxidant Potential of Bell Pepper Processing By-Products for the Development of Value-Added Sausage Formulations

1
Faculty of Food Engineering, University of Life Sciences “King Michael I” from Timisoara, Calea Aradului 119, 300645 Timisoara, Romania
2
Faculty of Veterinary Medicine, University of Life Sciences “King Michael I” from Timisoara, Calea Aradului 119, 300645 Timisoara, Romania
3
Faculty of Agriculture, University of Life Sciences “King Michael I” from Timisoara, Calea Aradului 119, 300645 Timisoara, Romania
*
Authors to whom correspondence should be addressed.
The two authors contributed equally to the work.
Appl. Sci. 2022, 12(23), 12421; https://doi.org/10.3390/app122312421
Submission received: 14 November 2022 / Revised: 28 November 2022 / Accepted: 1 December 2022 / Published: 5 December 2022

Abstract

:
Nowadays, when the supply chain of natural compounds for the production of value-added meat products is limited, the use of by-products from vegetable processing could become an attractive solution, contributing to the concept of circular economy. In this regard, our study investigated the effectiveness of yellow and red bell pepper processing by-products used in dried form (DYBPB, DRBPB) in the sausages recipe, instead of synthetic nitrites, to enhance their oxidative stability during cold storage (4 °C) for 20 days. Two types of nitrite-free sausages were obtained, such as smoked and dried sausages (I) and smoked and blanched sausages (II). Nitrite-free sausage formulations were designed by adding DYBPB and DRBPB at a dose to ensure a total phenolic compounds (TPC) level of 50, 90, 180, and 270 mg gallic acid equivalents (GAE)/kg of processed meat. The formulations developed were compared with control samples of sausages obtained with added sodium nitrite or without any additive. The DYBPB and DRBPB were investigated for total and individual phenolic content, total flavonoid content and antioxidant activity. The obtained sausages were investigated in terms of proximate composition as well as lipid oxidation progression based on specific chemical indices such as peroxide value (PV), p-anisidine value (p-AV), TOTOX index, and thiobarbituric acid (TBA) test during cold storage for 1, 10, and 20 days. The antioxidant activity of DYBPB and DRBPB has been shown to be closely related to their total phenolic content and total flavonoid content. It was found that a higher inhibitory potential against oxidative damage was evidenced in smoked and scalded sausages compared to smoked and dried formulations when the same dose of bell pepper processing by-products was applied. Our results showed that the use of dried bell pepper processing by-products in a dose that provides a TPC of a minimum of 180 mg GAE/kg processed meat for DRBPB and 270 mg GAE/kg processed meat for DYBPB have the potential to ensure lipid oxidative stability during cold storage of sausages for 20 days and can be considered for obtaininginnovative nitrite-free sausage formulations. Bearing in mind that the meat industry is currently looking for natural and sustainable ingredients to replace synthetic ones, our research recommends bell pepper processing by-products as promising substitutes for sodium nitrite to develop value-added meat products.

1. Introduction

Oxidation is a major problem that reduces the gallantry life of fresh, frozen, chilled, or processed meat and meat products. Antioxidants are used to stabilize free radicals by delaying the oxidation of lipids and proteins and the late development of unpleasant odours, as well as to improve colour stability [1].
Due to the potentially toxic effects of synthetic antioxidants, the demand for natural antioxidants has increased in recent years [2]. Regarding toxicity, studies have shown that these substances can have adverse health effects when not used within the established safety limits [3].
Sodium nitrite and nitrate are some of the most widely used in the meat industry as curing salts. Regardless, an excess of these ingested substances can interact with amines and amides, giving rise to N-nitroso compounds such as nitrosamines with mutagenic, teratogenic, and carcinogenic potential [4].
Given the negative health effects of synthetic antioxidants, consumers are now opting for healthier meat products containing natural antioxidants. Recently, researchers have focused on identifying new antioxidants from plants, fruits, and vegetables due to their high content of phenolic components and offering an alternative to the conventional antioxidants currently used [5]. These natural antioxidants contain certain active compounds that exert antioxidant potential in meat and meat products through different mechanisms of action. The efficient extraction of these antioxidants from natural sources, together with the establishment of their activity in vitro and antioxidant products, has been a great challenge for researchers involved in this field [6].
Peppers (Capsicum annuum) as vegetables are botanically classified in the family Solanaceae, genus Capsicum [7]. The production of bell peppers has increased considerably in recent years. In 2019, the production was 35.98 million kg/year, and in 2020, it increased to 36.09 million kg/year; however, the annual losses of this crop are estimated at 40% [8].
The bell pepper is a vegetable with a high nutritional value. After processing, it generates significant quantities of by-products (5–30%) (peel, seeds, leaves, stems, seeds and unused pulp) rich in phytochemical compounds. The by-products resulting from the processing of peppers contain significant amounts of bioactive compounds (phenols, flavonoids, carotenoids, tocopherol, and pectic polysaccharides) which exhibit antioxidant, antibacterial, antifungal, immunosuppressive, and immunostimulating properties and antidiabetic, antitumour, and neuroprotective activities, and they have potential use as functional food additives. In this context, the valorisation of by-products is an area of great interest in technology and innovation, with beneficial effects for the population, economy, and environment [9,10], contributing to low-waste technology in agribusiness and providing economic benefits to producers [11].
Due to their content in bioactive compounds, special attention is needed in characterising and exploiting these multi-purpose plant products, which are currently under-studied. Thus, this work aims to develop a new type of nitrite-free meat products with increased functionality by introducing yellow and red bell pepper processing by-products into the manufacturing recipe as a substitute for the synthetic antioxidant (sodium nitrite). In a previous study [12], we assessed the antioxidant potential of a tomato processing by-product and its effectiveness in providing protection against lipid oxidation in nitrite-free sausage formulas. Encouraging results in this respect have led us to extend our research to other types of plant-based powders obtained from vegetable processing by-products.
In this study, the following research directions were addressed: (i) investigating the total polyphenol content (TPC), total flavonoid content (TFC), individual polyphenol content, and total antioxidant activity of red and yellow bell pepper pulp and processing by-products, fresh and after drying at 60 °C; (ii) replacing the description of the technology for obtaining sausage formulations in which the synthetic antioxidant (sodium nitrite) with various amounts of dried yellow and red bell pepper processing by-products calculated to provide a total phenolic content of 50, 90, 180, and 270 mg gallic acid equivalents (GAE)/kg of processed meat; (iii) evaluating the proximate composition of the obtained sausage formulations; and (iv) assessing the oxidative stability of the obtained sausage formulations.

2. Materials and Methods

2.1. Materials

Fresh meat and fat were purchased from a local producer (SC Smithfield SRL, Timisoara, Romania). Fresh red and yellow bell peppers (Capsicum annuum) and garlic were purchased from a local market (Timisoara, Timis county, Romania). Ingredients such as ground black pepper (Fuchs Condimente RO SRL, Curtea de Argeș, Romania), paprika (Fuchs Condimente RO SRL, Curtea de Argeș, Romania), and salt (Salrom, Bucharest, Romania) were purchased from a local supermarket. All reagents used for chemical analysis were purchased from Sigma-Aldrich (St. Louis, MO, USA), Geyer GmbH (Renningen, Germany), Fluka (Madrid, Spain), and Chimreactiv (Bucharest, Romania) and were of analytical quality.

2.2. Obtaining the Red and Yellow Bell Pepper By-Products

Two types of bell peppers (red and yellow bell peppers) were processed with pulp separation, and the resulting by-products (consisting of seeds and the part remaining after pulp separation) were collected and conditioned by drying in a forced air oven (Froilabo AC60/France, 1000 W) for 16 h at 60 °C to avoid the degradation of bioactive compounds.
The main fractions of bell peppers (bell pepper pulp and bell pepper processing by-products) were investigated both fresh and dried.
The dried bell pepper processing by-products were ground with a Grindomix GM 2000 laboratory mill (Retsch GmbH, Haan, Germany) until transformed into a fine powder passed through a 60 mesh sieve. This powder was further used in sausage making. The following abbreviations are used for the fresh samples investigated: RBPP—red bell pepper pulp; YBPP—yellow bell pepper pulp; RBPB—red bell paper by-product; YBPB—yellow bell pepper by-product. Similarly, for samples that resulted after drying, the following abbreviations have been used: DRBPP—dried red bell pepper pulp; DYBPP—dried yellow bell pepper pulp; DRBPB—dried red bell pepper by-product; DYBPB—dried yellow bell pepper by-product.

2.3. Phytochemical Profile of Red and Yellow Bell Pepper By-Products

2.3.1. Preparation of the Alcoholic Extracts

From each sample of bell pepper pulp and processing by-products, both fresh and dried, 1 g were weighed in containers with lids, over which was added 10 mL of 70% (v/v) ethanol (Chimreactiv, Bucharest, Romania). The containers were hermetically sealed and, with the help of a magnetic stirrer (IDL, Freising, Germany), were subjected to shaking for 30 min, after which they were filtered through the Whatman N°1 filter paper. The extracts thus obtained were further used to determine the total and individual polyphenols content, the total flavonoid content, and total antioxidant activity.

2.3.2. Assessment of Total Phenolic Content (TPC)

The total polyphenol content (TPC) of red and yellow bell pepper pulp and processing by-products, both fresh and dried, was determined according to the Folin-Ciocalteu method with minor modifications [13]. Thus, 0.5 mL of each extract was taken in test tubes, and 1.25 mL Folin-Ciocalteu reagent (Sigma-Aldrich Chemie GmbH, München, Germany) diluted 1:10 (v/v) with demineralised water was added. After 5 min of standing at room temperature, 1 mL from a Na2CO3 aqueous solution of 60 g/L concentration (Geyer GmbH, Renningen, Germany) was added to the mixture. After 30 min of incubation in a thermostat at 50 °C, the absorbance of the samples was read at 750 nm using a Specord 205 UV-VIS spectrophotometer, Analytik Jena Inc. (Jena, Germany) against a control sample prepared under the same conditions. The TPC values were expressed as mg gallic acid equivalents (GAE)/g dry substance (d.s) based on a calibration curve made with a gallic acid solution (Fluka, Madrid, Spain) of concentrations in the range 20–200 mg/L. Analyses were performed in triplicate and results were reported as mean value ± standard deviation (SD).

2.3.3. Assessment of Total Flavonoid Content (TFC)

The total amount of flavonoids of red and yellow bell pepper pulp and corresponding processing by-products, both fresh and dried, was determined according to the procedure described by Hulea et al. [14] with minor modifications. Thus, 1 mL was taken from each extract, over which 4 mL of distilled water, 0.3 mL of 5% NaNO2, and 10% Al(NO3)3 solution were added. After 6 min of incubation, 2 mL of 1 M NaOH solution was added, and the entire reaction mixture was brought to 10 mL with 70% ethanol. After 15 min of standing at room temperature, the absorbance of the mixture was read using a UV-VIS spectrophotometer (Specord 205; Analytik Jena AG, Jena, Germany) at a wavelength of 510 nm. Ethanol 70% (v/v) was used as a control sample. Three replicates of each sample were made, and the results were expressed as mg QUE/100 g. Quercetin in the concentration range of 0.5–50 g/mL was used for the calibration curve.

2.3.4. Chromatographic Determination of Non-Anthocyanin Polyphenols by LC-MS

Non-anthocyanin polyphenols were identified from previously obtained extracts from bell pepper pulp and processing by-products, both fresh and dried, with a liquid chromatography–mass spectrometry (LC-MS) method using a Shimadzu LCMS-2010 EV system (Shimadzu, Kyoto, Japan) equipped with electrospray ionization (ESI) [12]. The chromatographic system consists of an HPLC unit and an MS-2010 mass spectrometer connected in-line, an automated sampler, a degasser, and solvent delivery pumps (LC-10AD). Using a 2.0 mm NUCLEODUR CE 150/2 C18 Gravity SB 150 mm column, the reversed-phase was separated with a particle size of 5 m and run at 20 °C at a flow rate of 0.2 mL/min (Macherey-Nagel GmbH & Co. KG, Düren, Germany). Compounds were separated using gradient elution A (aqueous formic acid, pH = 3) and B (acetonitrile and formic acid solution, pH = 3). The gradient program was as follows: 5% B (0.01–20 min), 5–40% B (20.01–50 min 10 min), 40–95% B (50–55 min), and 95% B (55–60 min). The injection had a volume of 20 L, and the detector was set to an acquisition range of 200–700 nm. Monitoring was performed at 280 and 320 nm. In addition, 1.25 scans/s served as the spectral acquisition rate (peak width: 0.2 min). The data was collected and integrated using Shimadzu’s state-of-the-art Solution software with prior calibration. The calibration curves were performed in the 20–50 g/mL range. Individual polyphenolic compounds detected in the samples were expressed as mg/g dry substance (d.s). All determinations were carried out in triplicate, and the results were reported as mean ± standard deviation (SD).

2.3.5. Antioxidant Activity

The antioxidant activity of the samples was assessed based on a 1,1-diphenyl-2-picrylhydrazyl (DPPH) radical scavenging assay as well as the ferric reducing antioxidant power (FRAP) assay.

DPPH Assay

The free radical scavenging activity of investigated samples was evaluated using a 0.03 mM 1,1-diphenyl-2-picrylhydryl (DPPH, Sigma-Aldrich, Taufkirchen, Germany) ethanolic solution according to the method described by Ciulca et al. [13] with slight modifications. This method is commonly used to evaluate a food’s ability to act as an antioxidant, especially for fruits and vegetables. Thus, from each extract prepared as described in Section 2.3.1, 1 mL was taken to which 2.5 mL of DPPH solution (Sigma-Aldrich, Taufkirchen, Germany) was added. The obtained mixture was shaken energetically and then incubated in the dark for 30 min at room temperature. The absorbance was read using a UV-VIS spectrophotometer (Specord 205; Analytik Jena AG, Jena, Germany) at 518 nm against a 70% (v/v) ethyl alcohol control sample. Each sample was analysed in triplicate, and their mean value was reported.
The radical scavenging activity of the Investigated samples was expressed as a percentage of DPPH free radical inhibition relative to the control using the Equation (1):
D P P H   i n h i b i t i o n ( % ) = A c o n t r o l A s a m p l e A c o n t r o l × 100
where Acontrol is the absorbance value of control and Asample is the absorbance value of the tested sample.

FRAP Assay

The ferric reducing ability of yellow bell pepper pulp and corresponding processing by-products, both fresh and dried, was evaluated with the FRAP assay according to the protocol described by Benzie and Strain [15]. This assay is based on the ability of antioxidant compounds contained in the investigated samples to reduce Fe3+ to Fe2+ in the presence of tripyridyltriazine (TPTZ) at a temperature of 37 °C in a sodium acetate buffer solution with pH of 3.6. As a result, the Fe2+-TPTZ complex is formed, which has a deep blue color and a maximum absorption at a wavelength of 593 nm [16].
Prior to analysis, the alcohol extracts prepared in Section 2.3.1 from RBPP, YBPP, RBPB, and YBPB were diluted 1:5 (v/v) with distilled water, while those obtained from DRBPP, DYBPP, DRBPB, and DYBPB were diluted 1:50 (v/v) with distilled water. Then, 2.5 mL of the FRAP reagent was added to a 0.5 mL aliquot of the diluted extracts, and the resulting mixtures were incubated for 30 min at 37 °C. The absorbance was then measured at 595 nm against a blank sample obtained under the same conditions using a UV-VIS spectrophotometer (Specord 205; Analytik Jena AG, Jena, Germany). The FRAP value of the analyzed samples was reported as µM Fe2+ equivalents/g dry substance (d.s) based on a calibration curve prepared using standard Fe2+ solutions with concentrations in the range 0.1–1.0 μM Fe2+/mL. The analyses were performed in triplicate, and the results were reported as mean value ± standard deviation (SD).

2.4. Manufacture of Sausages Formulas

Meat and fat pork were cut into 50 g pieces with a knife then grinded to 4 mm (Maxima Holland MMM 12-229, Mijdrecht, The Netherlands). All ingredients were mixed for 30 min with a mixer (La felsinea 10M, Piazzola sul Brenta, PD, Italy). The resulting mixture was left to mature for 24 h at 4 °C in the refrigerator (Maxima Holland R 400 L, Mijdrecht, The Netherlands). The matured mixture was stuffed into 20 mm ø natural sausage casings using a sprite (MAXIMA Sausage filler MSFA15L, Maxima Holland, Mijdrecht, The Netherlands) in 15 cm long pieces. Except for the control sample (SC sausages control), all other sausage formulations were subjected to 90 min of smoking at 45 °C in a smoking cell (MAXIMA Sausage filler MSFA15L, Maxima Holland, Mijdrecht, The Netherlands) and then smoked at 50 °C for 60 min in the same smoking cell. Next, all sausage formulas were divided into two batches, the first batch was dried at 10–12 °C for 72 h, and the second batch was subjected to steaming at 71–73 °C to obtain an internal temperature of 68 °C.
Table 1 details the recipes used to prepare both control sausage samples (with added sodium nitrite or without any additive) as well as nitrite-free sausages formulations that were obtained by replacing the sodium nitrite with various amounts of dried yellow and red bell pepper processing by-products calculated to provide a total phenolic content of 50, 90, 180, and 270 mg gallic acid equivalents (GAE)/kg of processed meat.
This resulted in 21 sausage formulas, as follows:
SCcontrol sausages without heat treatment
SDSCsmoked and dried sausages control
SDSCNsmoked and dried sausages with salt + nitrite (positive control)
SSSCsmoked and scalded sausages cotrol
SSSCNsmoked and scalded sausages with salt + nitrite (positive control)
DSDRBPB50Smoked and dried sausages with 4.596 mg DRBPB/kg of raw processed meat
DSDRBPB90Smoked and dried sausages with 8.274 mg DRBPB/kg of raw processed meat
DSDRBPB180Smoked and dried sausages with 16.547 mg DRBPB/kg of raw processed meat
DSDRBPB270Smoked and dried sausages with 24.821 mg DRBPB/kg of raw processed meat
SSDRBPB50Smoked and scalded sausages with 4.596 mg DRBPB/kg of raw processed meat
SSDRBPB90Smoked and scalded sausages with 8.274 mg DRBPB/kg of raw processed meat
SSDRBPB180Smoked and scalded sausages with 16.547 mg DRBPB/kg of raw processed meat
SSDRBPB270Smoked and scalded sausages with 24.821 mg DRBPB/kg of raw processed meat
DSDYBPB50Smoked and dried sausages with 5.811 mg DYBPB/kg of raw processed meat
DSDYBPB90Smoked and dried sausages with 10.460 mg DYBPB/kg of raw processed meat
DSDYBPB180Smoked and dried sausages with 20.920 mg DYBPB/kg of raw processed meat
DSDYBPB270Smoked and dried sausages with 31.380 mg DYBPB/kg of raw processed meat
SSDYBPB50Smoked and scalded sausages with 5.811 mg DYBPB/kg of raw processed meat
SSDYBPB90Smoked and scalded sausages with 10.460 mg DYBPB/kg of raw processed meat
SSDYBPB180Smoked and scalded sausages with 20.920 mg DYBPB/kg of raw processed meat
SSDYBPB270Smoked and scalded sausages with 31.380 mg DYBPB/kg of raw processed meat
After preparation, all sausage formulas were vacuum packed in low-density polyethylene (LD-PE) bags using a vacuum packing machine (VAC-20 SL 2A, Edesa, Barcelona, Spain) and stored for 20 days at 4 °C in the dark.
All obtained sausage formulations were further analysed for proximate composition and oxidative stability by evaluating PV, p-AV, TOTOX, and TBA. Oxidative stability was assessed at 1, 10, and 20 days of storage. The shelf life of smoked, dried, and cured meat products is generally 15 days, but we chose this study to follow the evolution of the oxidation degree after the shelf life. For each sausage formulation and shelf life, analyses were performed in triplicate.

2.5. Proximate Composition of Sausages

The following ISO methods were used to evaluate the proximate composition of sausage formulas: SR ISO 1443:2008 for total lipid [17], SR ISO 937:2007 for total protein [18], SR ISO 1442:2010 for moisture [19], SR ISO 936:2009 for minerals [20], and SR ISO 91-2007 for NaCl [21].
The amount of carbohydrates was calculated according to the relationship presented in Equation (2).
Carbohydrates   ( % ) = 100 [ lipids   ( % ) +   proteins   ( % ) +   ash   ( % ) +   moisture   ( % ) ]
The energy value of sausage formulas was calculated using Equation (3).
Energy   value   ( kcal / 100   g ) =   lipids   ( % ) ×   9   +   proteins   ( % ) ×   4   +   carbohydrates   ( % ) × 4  

2.6. Oxidative Stability Assessment

The oxidative stability was assessed with the determination of peroxide (PV), p-anisidine (p-AV), thiobarbituric acid (TBA), and the calculation of the TOTOX value. For the determination of PV and p-AV in sausage formulations, fat was extracted using a Soxtest equipment (SX-6, Raypa Espinar, Terrassa, Barcelona, Spain), and petrol ether (Chimreactiv, Bucharest, Romania) was used as an extraction solvent. The sausage samples as such were used to determine the TBA value, and the TOTOX value was obtained with a calculation according to Equation (4).

2.6.1. Determination of Peroxide Value (PV)

The iodometric method was used to determine the PV of sausage formulas, expressed as meq O2/kg fat [22].

2.6.2. Determination of p-Anisidine Value (p-AV)

The official AOCS Cd 18-90 spectrophotometric method [23] was used to determine the p-AV value by reading the absorbance at 350 nm.
Thus, 2 g of fat extracted from the sausage samples was dissolved in 25 mL isooctane (Sigma-Aldrich Chemie GmbH, Munich, Germany), and the absorbance was read at 350 nm using a UV-VIS spectrophotometer (Specord 205, Analytik Jena Inc., Jena, Germany) compared to a control sample consisting of isooctane. Five ml of the above-prepared solution was taken, and 1 mL of 0.25% (w/v) p-anisidine solution prepared in glacial acetic acid (Sigma-Aldrich Chemie GmbH, Munich, Germany) was added. After 10 min, the absorbance was read at 350 nm.
Using the absorbances read, p-AV was calculated using Equation (4):
p - AV = 25   ×   1.2 × A 2 A 1 W
where A1—the absorbance of the fat sample dissolved in isooctane, A2—absorbance of the fat sample dissolved in isooctane + p-anisidine solution, and W—weight of the fat sample (g).

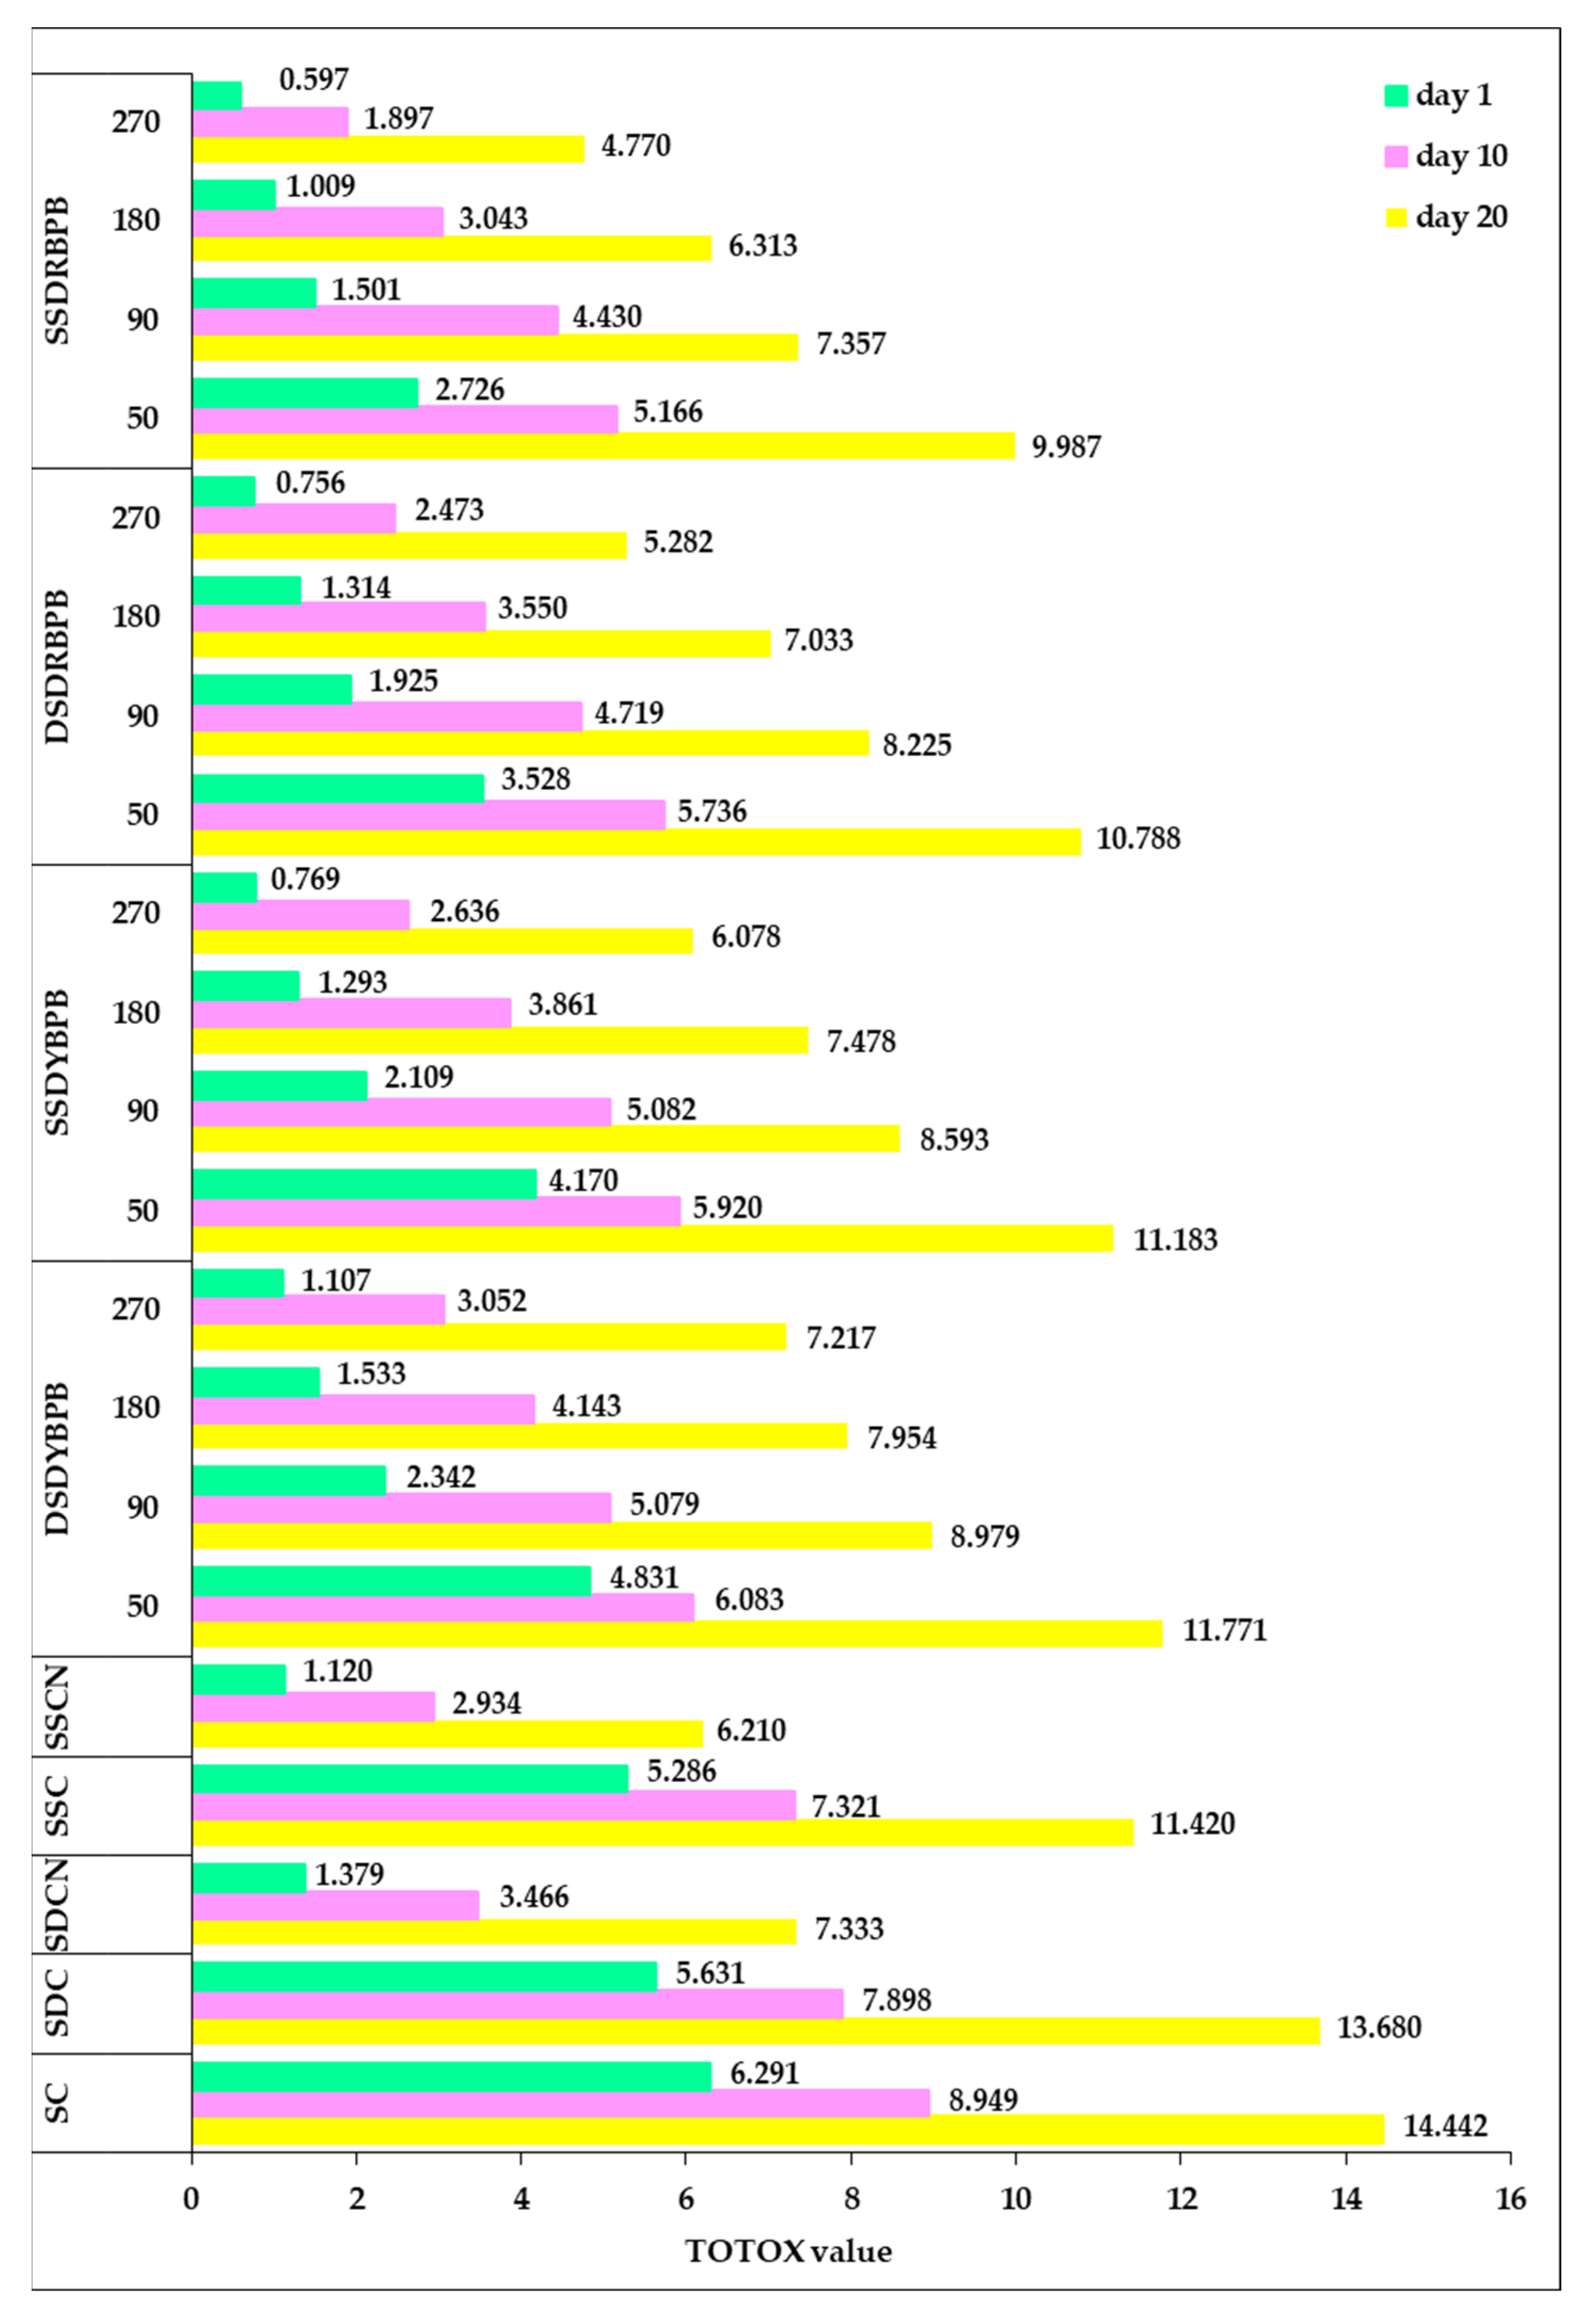
2.6.3. Total Oxidation Value (TOTOX)

Using the PV and p-AV values, the TOTOX value was calculated according to Equation (5) [24].
T O T O X = 2 × P V + p - A V

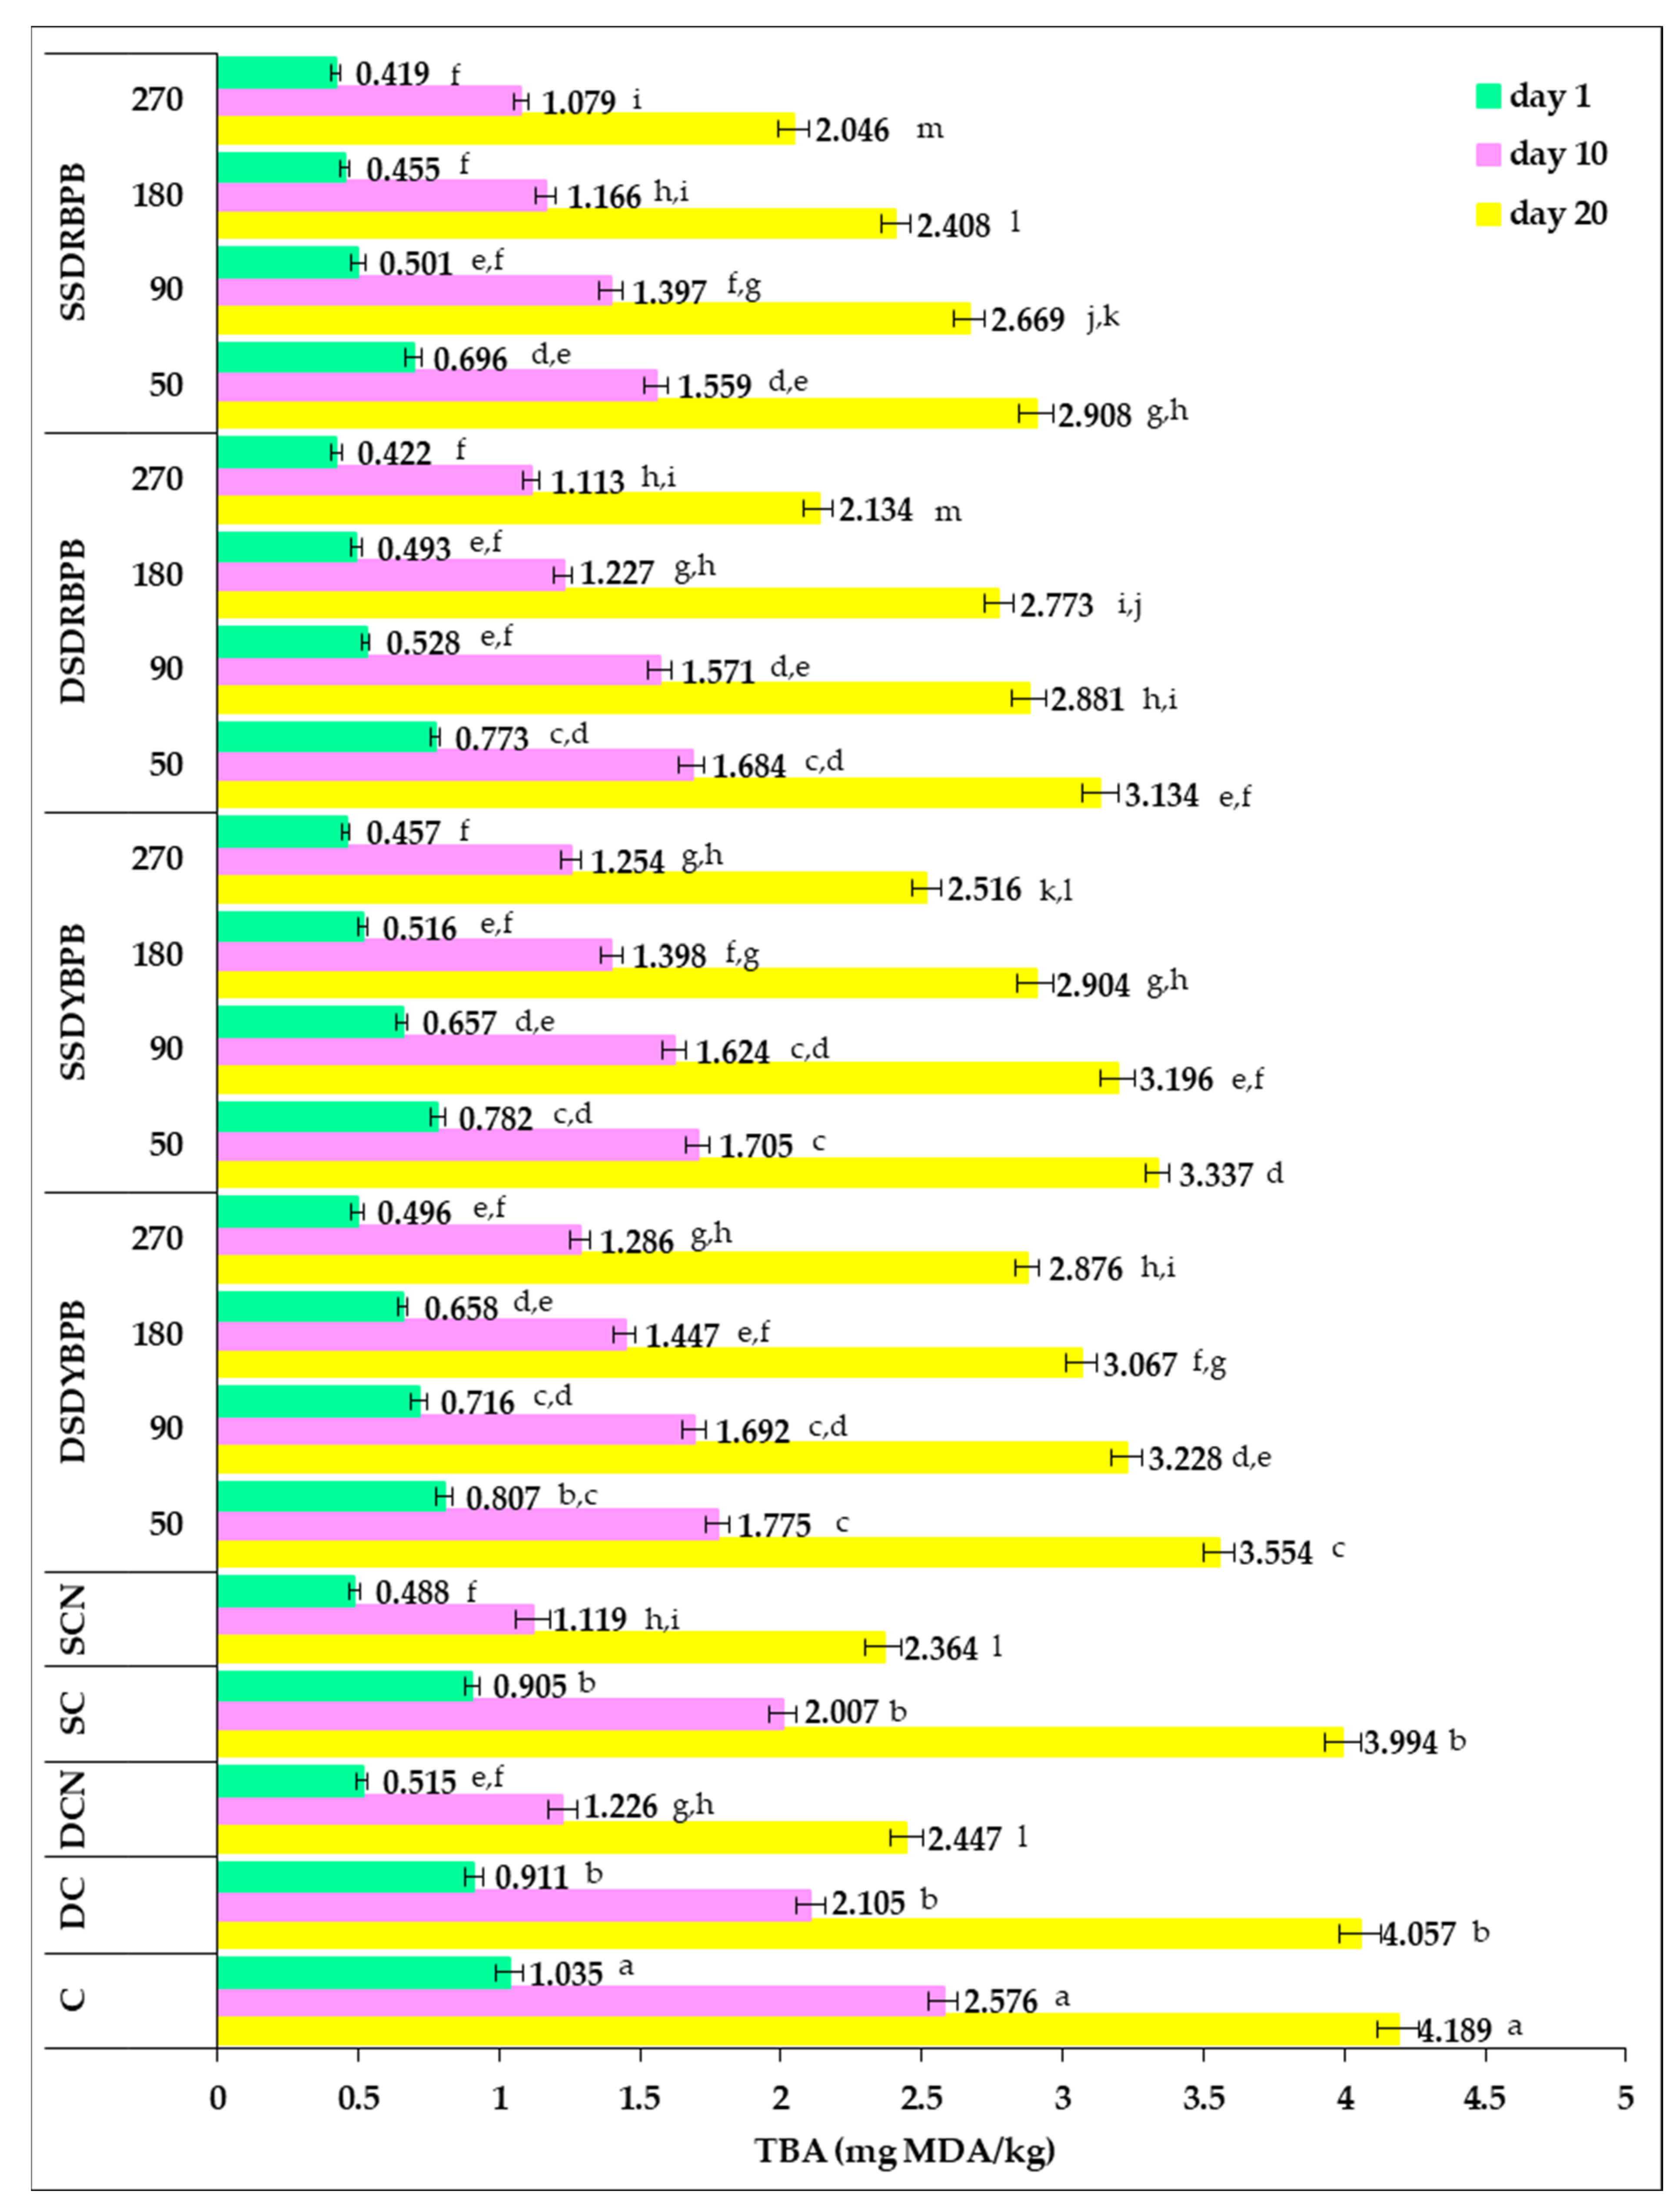
2.6.4. Thiobarbituric Acid (TBA) Test

The TBA test was performed according to the method described by Cadariu et al. [12]. Five g of sausage samples were taken in containers with lids, to which 20 mL of trichloroacetic acid (5% w/v) was added. The mixture was centrifuged for 10 min at 12,000 rpm, after which 4 mL of supernatant was collected from each sample. To the collected supernatant, 4 mL of 0.02 M TBA aqueous solution was added. The resulting mixture was incubated for 60 min at 100 °C in a water bath. After cooling the samples to room temperature, the absorbance was measured at a wavelength of 532 nm using a Specord 205 spectrophotometer, Analytik Jena Inc. (Jena, Germany). All measurements were made against a control sample which did not contain sausage. The amount of malonaldehyde (MDA) formed was calculated from the calibration curve using MDA in the concentration inter-value: 10–50 μg/mL. Three determinations were made from each sample, their mean value ± standard deviation (SD) was reported, and the results were expressed in μM MDA/g sample.

2.7. Statistical Data Analysis

All determinations were carried out in triplicate, and the results were expressed as mean ± standard deviation (SD). Statistical differences between the samples were assessed using a one-way ANOVA followed by a two-sample t-test with equal variance. The results of the statistical analyses between the samples were reported for the tables in the same row or column and for the figures with different exponents or letters in case of identifying significant differences (p < 0.05). The data presented in the same row, column, or bar with the same exponents or letters did not show significant differences (p > 0.05). The statistical tool used to process the data was Microsoft Excel 365 (Version 2208, Redmond, WA, USA).

3. Results and Discussion

3.1. Phytochemical Profile of Bell Pepper Pulp and Bell Pepper Processing By-Products

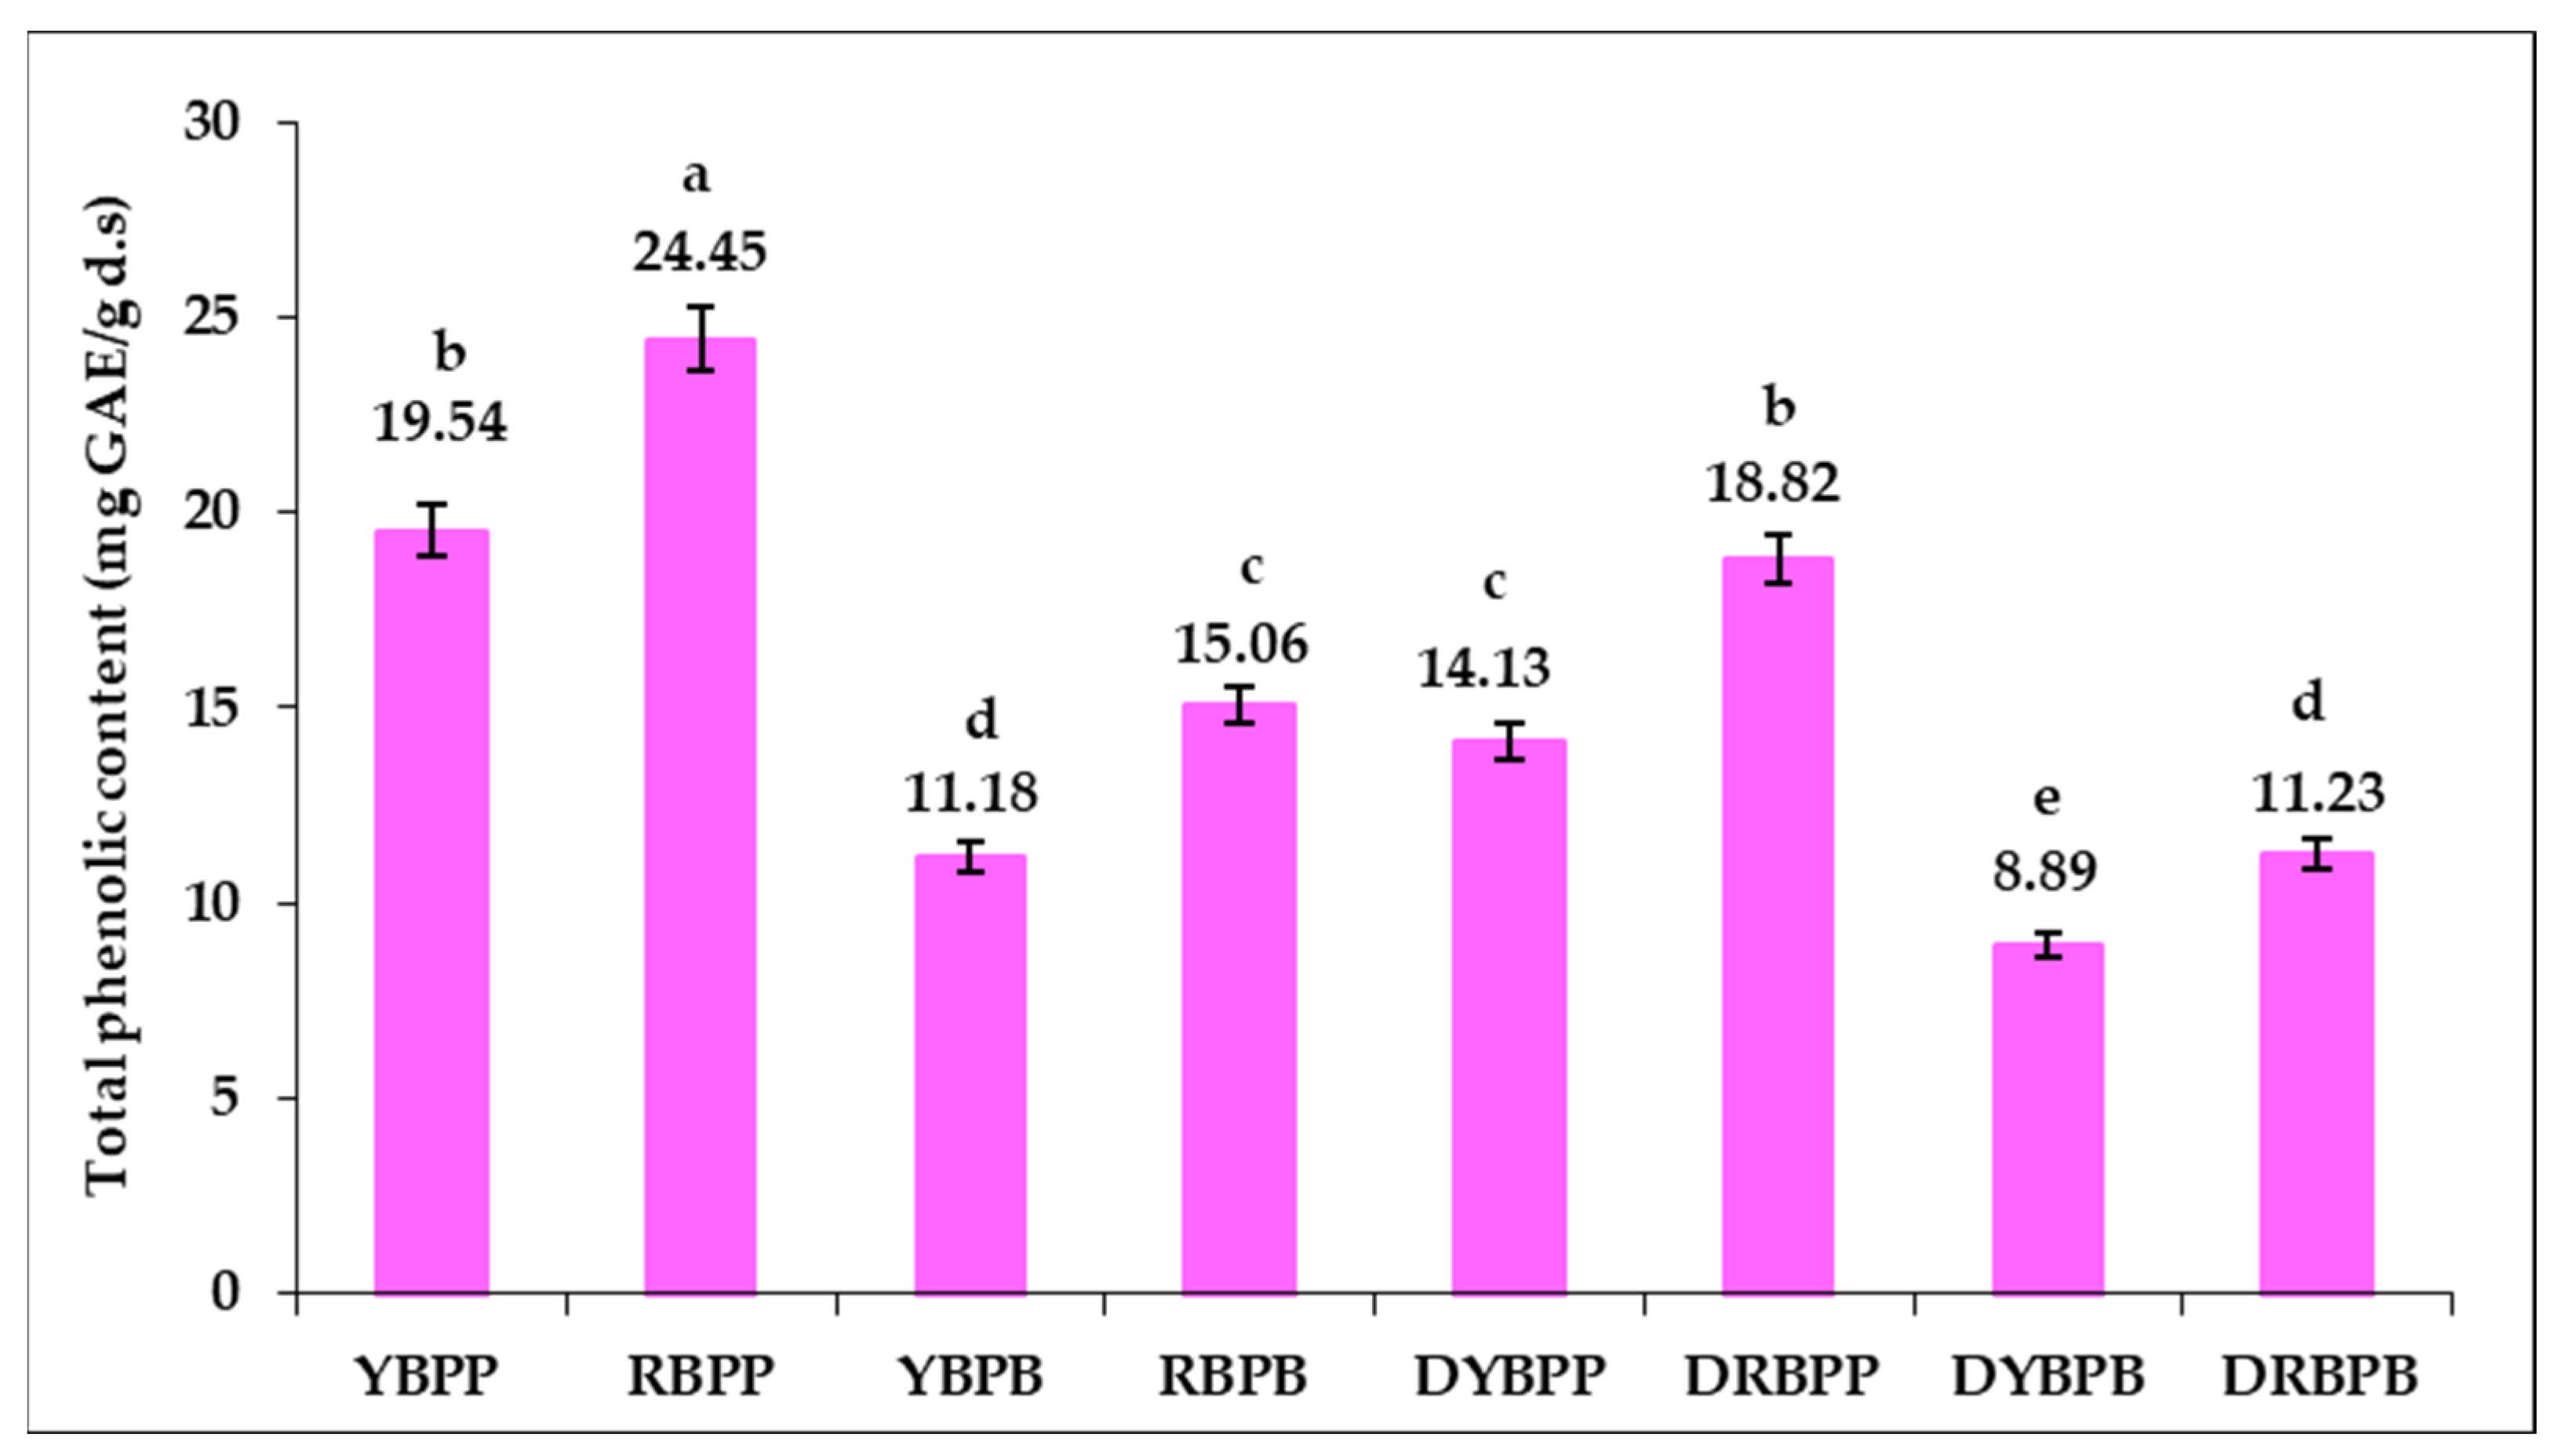
3.1.1. Assessment of Total Phenolic Content (TPC)

Figure 1 shows the TPC of both yellow and red pepper pulp and by-products resulting from processing, fresh, and after drying for 16 h at 60 °C.
For the fresh bell pepper pulp, a total polyphenol content of 19.54 mg GAE/g d.s was recorded for the YBPP and 24.45 mg GAE/g d.s for the RBPP.
The values recorded for TPC ranged from 8.89–24.45 mg GAE/g d.s. A decrease in TPC can be observed in fresh by-products of yellow and red bell peppers, but they still maintain a significant level of phenolic compounds (11.18 mg GAE/g d.s for the YBPB and 15.06 mg GAE/g d.s for the RBPB). Significant TPC values were also recorded for the dehydrated products, namely the DYBPP and the DRBPP (14.13 mg GAE/g d.s. and 18.82 mg GAE/g d.s. respectively) but also for the DYBPB and DRBPB (8.89 mg GAE/g d.s. and 11.23 mg GAE/g d.s.). By analysing the results obtained, it can be concluded that the valorisation of yellow and red bell pepper by-products is viable, as they contain significant amounts of total polyphenols. Between the two types of bell peppers, the RBPP recorded higher values than the YBPP for both the initial and by-product and the dried initial and dried by-product.
The results are consistent with other studies, which show that the amount of TPC is 28.73 mg GAE/g DW) for red bell peppers and 27.68 mg GAE/g DW for yellow bell peppers [25]. In their study, Otunola and Afolayan [26] reported a higher content of TPC in bell peppers, namely 47.18 mg/mL. Other authors reported a polyphenol content between 7.86–42.57 mg GAE/g for red bell peppers and 7.44–43.59 mg/g for yellow bell peppers [27], with the specification that concentration varies according to the anatomical portion (seeds, husk, and pulp), variety, stage of maturity, storage conditions, and processing method [8]. For yellow bell peppers, Razola-Díaz et al. [28] reported a TPC content ranging between 2.5 to 11.6 mg GAE/g d.w.
Regarding by-products, similar values were reported by Sandoval-Castro et al. [9] for by-products from different varieties of bell peppers and ranged from 10.70 to 13.09 g GAE/kg. In another study, Vega-Gálvez et al. [29] studied the effect of different heating temperatures on the polyphenol content, reporting a TPC content of 1359 g GAE/g fresh bell peppers and significantly lower values for dehydrated bell peppers.

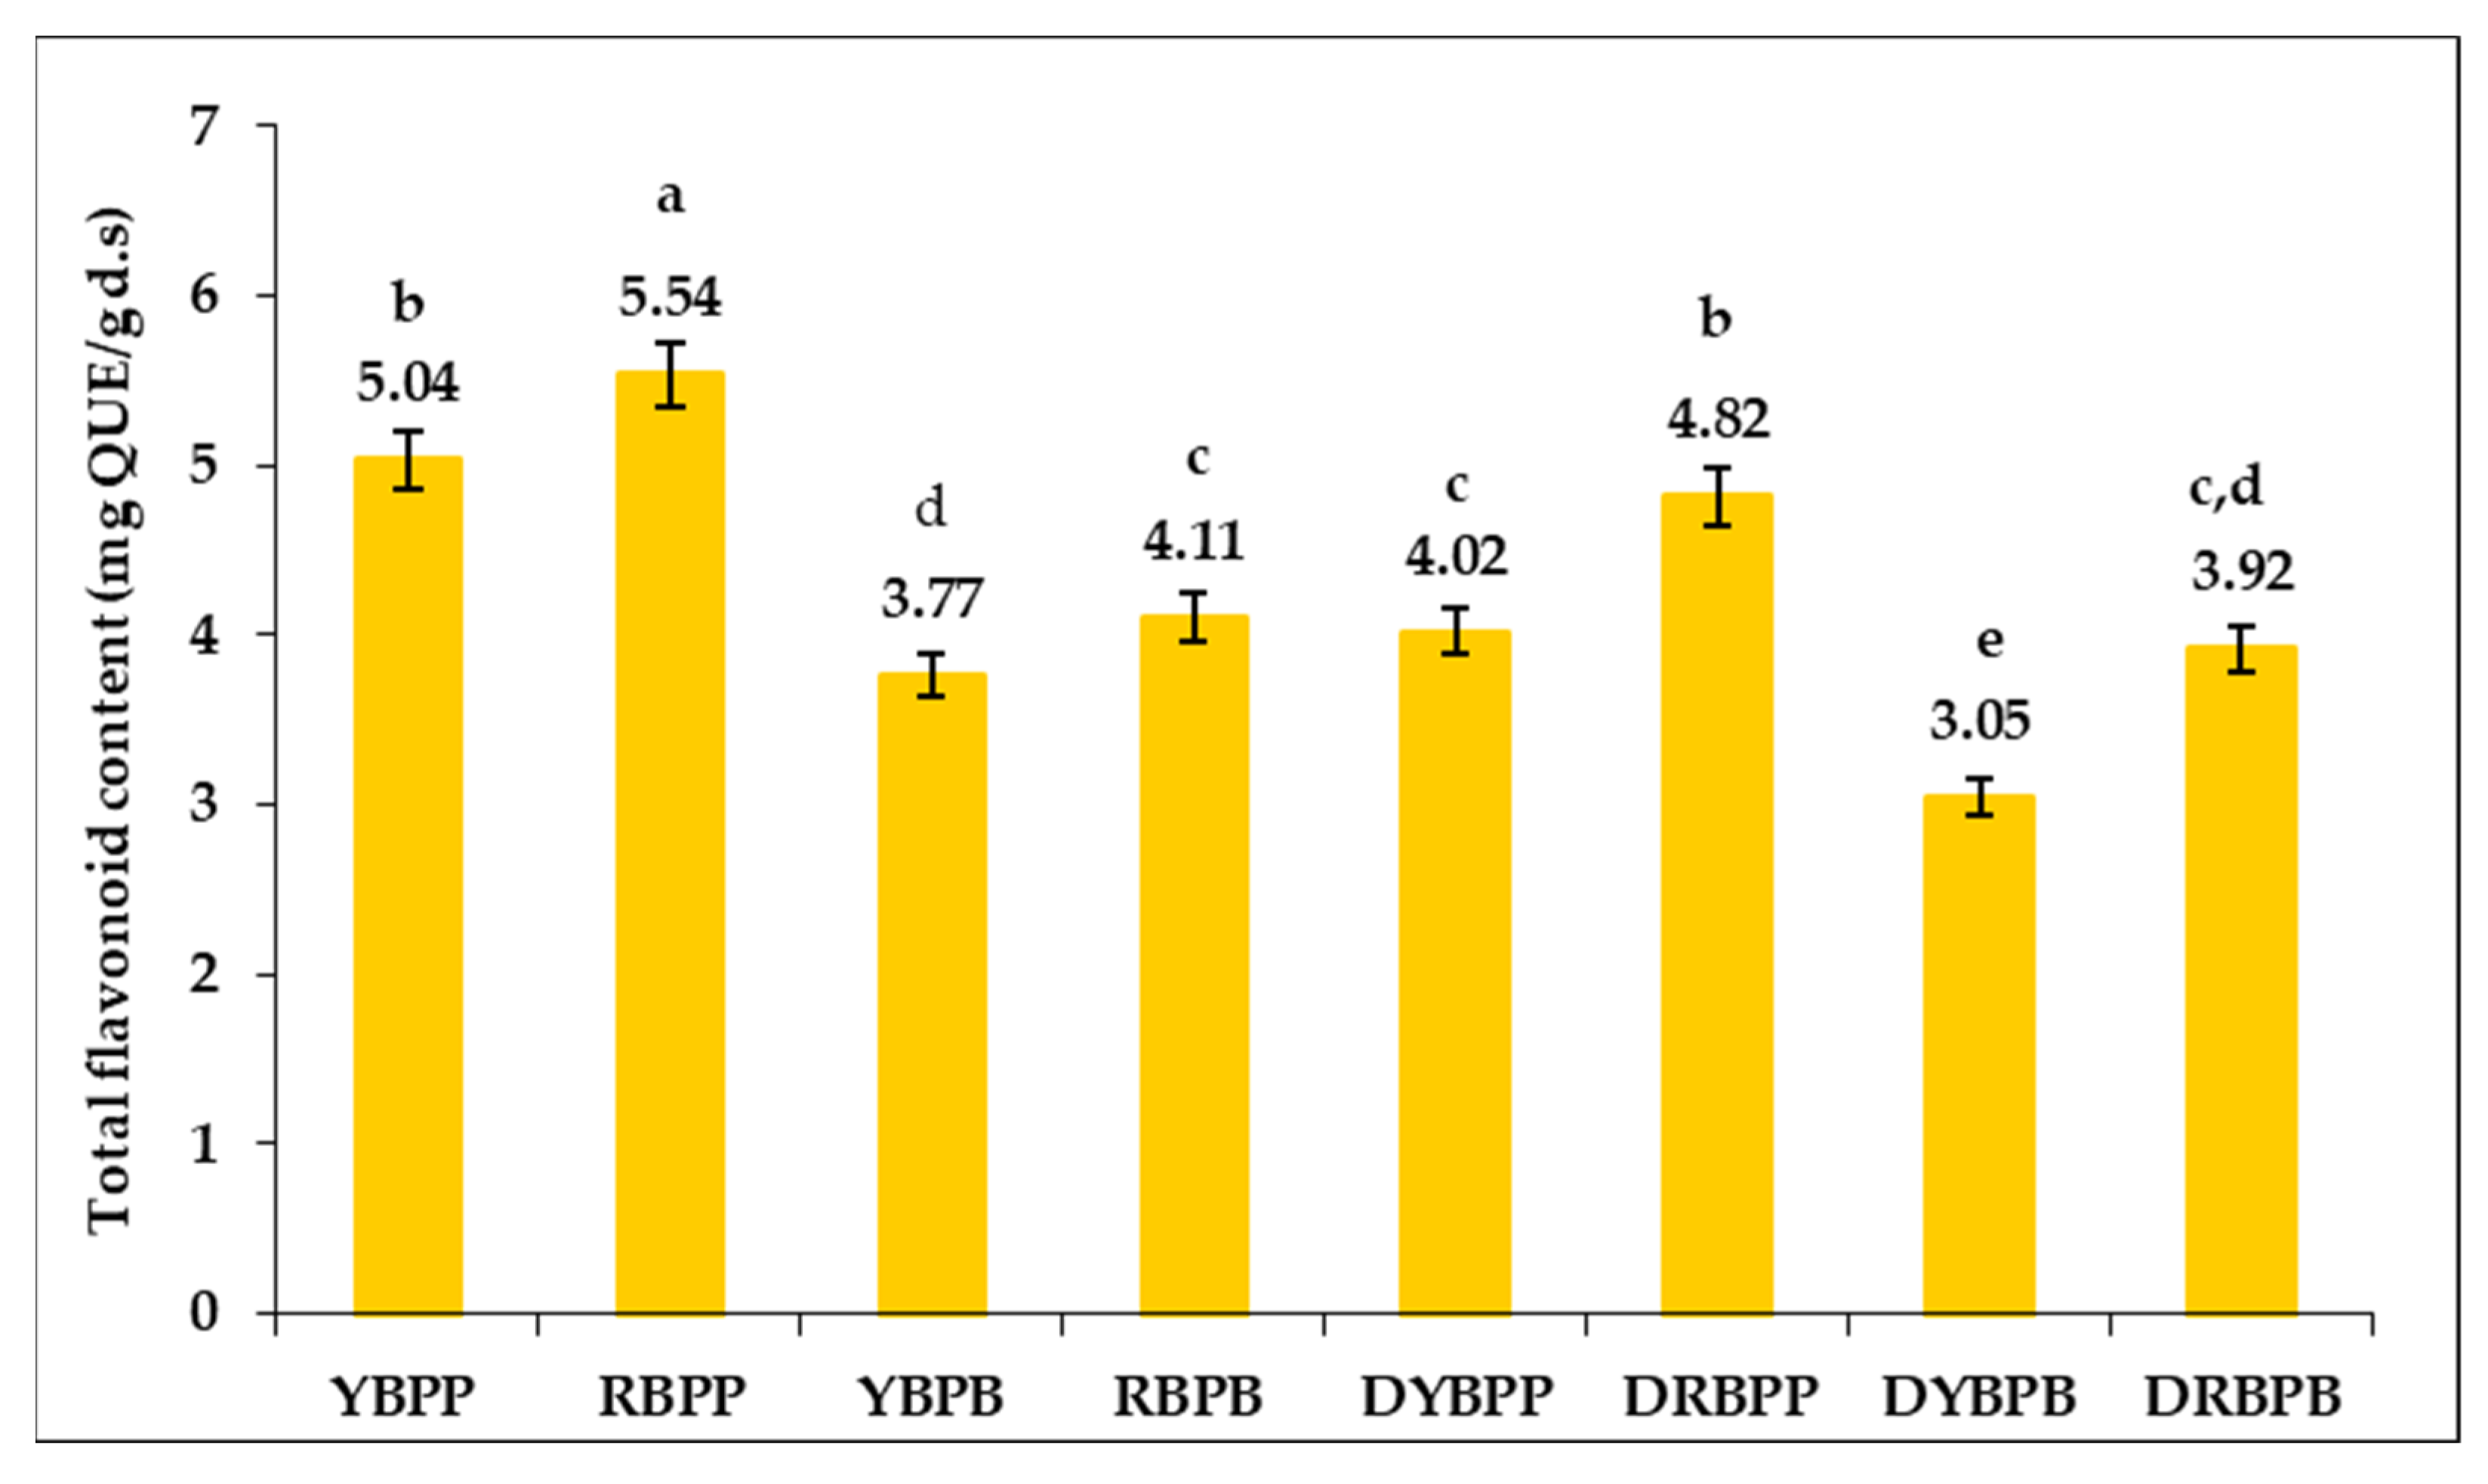
3.1.2. Assessment of Total Flavonoids Content (TPC)

The TFC of yellow and red bell pepper pulp and the processing by-products, both fresh and dried, are shown in Figure 2.
It was found that the total flavonoid content (TFC) evaluated in yellow and red pepper pulp and by-products resulting from processing, fresh and after drying, showed a similar trend to the TPC profile. The TFC ranged from 3.05–5.54 mg QUE/g d.s. For fresh bell peppers, the TFC content was 5.04 mg QUE/g d.s for the YBPP and 5.54 mg QUE/g d.s for the RBPP.
In the case of TFC, too, there were significant differences (p < 0.05) between fresh bell pepper pulp, fresh by-products, dried pulp, and dried by-products. Fresh by-products of yellow and red bell peppers recorded significantly lower values (p < 0.05) than bell pepper pulp. In addition, after drying, significantly lower values were recorded for dehydrated pulp (4.02 mg QUE/g d.s. DYBPP and 4.82 mg QUE/g d.s. DRBPP) compared to fresh pulp (5.04 mg QUE/g d.s. YBPP and 5.54 mg QUE/g d.s. RBPP) but also for dehydrated by-products (3.05 mg QUE/g d.s. DYBPB and 3.92 mg QUE/g d.s. DRBPB) compared to fresh by-products (3.77 mg QUE/g d.s. YBPB and 4.11 mg QUE/g d.s. RBPP). However, in the dehydrated by-products, a significant TFC content is retained (3.5 mg QUE/g d.s DYBRB and 3.92 mg QUE/g d.s for the DRBPB) confirming from this point of view that the valorisation of yellow and red bell pepper by-products is viable and further use is justified. As in the case of TPC, in this case, the RBPP recorded higher values than the YBPP for both fresh pulp and by-product and dry pulp and dry by-product.
The values obtained also agree with other studies, which report TFC contents between 3.5–39 mg QUE/g for red bell peppers and between 2.4–33 mg/g for yellow bell peppers [30]. In another study, Razola-Díaz et al. [28] reported lower amounts of TFC for yellow bell peppers, respectively, between 536.60 and 1111.47 µg QUE/g d.w. Mohammad Salamatullah et al. [25] reported a higher TFC content in yellow bell peppers (5.82 mg CE/g DW) than in red peppers (5.11 mg CE/g DW). Razola-Díaz et al. [28] have reported lower amounts of TFC (i.e., between 536.60 and 1111.47 μg QUE/g d.w.) for yellow bell peppers.
Leng et al. [31] studied the TFC content in pulp and seeds from green, yellow, and red bell pepper. They reported for yellow bell peppers a TFC content of 14.93 µg QUE/g fresh weight (f.w.) for pulp and 3.66 µg QUE/g f.w. for seeds, and red bell peppers 137.43 µg QUE/g f.w. for pulp and 0.54 µg QUE/g f.w. for seeds. The results can be considered in similarity to the results of our study, assessing that the reported values are for the fresh sample and that the moisture content of bell peppers can reach up to 95% [32].

3.1.3. Chromatographic Evaluation of Individual Polyphenolic Compounds by LC-MS

The content of polyphenolic compounds identified in samples of yellow and red bell pepper pulp and the processing by-products, both fresh and after drying, is shown in Table 2.
Eleven polyphenolic compounds were identified in the samples of yellow and red bell pepper pulp, as follows: gallic acid (57.461–123.240 µg/g), protocatechuic acid (65.426–128.015 µg/g), caffeic acid (0.187–1.796 µg/g), epicatechin (0.755–3.242 µg/g), p-coumaric acid (8.042–19.248 µg/g), ferulic acid (2.557–15.793 µg/g), rutin (0.567–2.057 µg/g), rosmarinic acid (0.505–4.601 µg/g), resveratrol (0.187–0.769 µg/g), quercetin (55.450–135.852 µg/g), and kaempferol (8.164–26.088 µg/g). It should be noted that in all samples examined, quercetin, protocatechuic acid, and gallic acid were found in the highest amounts. Smaller but significant amounts were recorded for p-coumaric acid, ferulic acid and kaemferol, while caffeic acid, epicatechin, rutin, rosmarinic acid and resveratrol were identified in smaller amounts. Except for gallic acid and kaemferol, all other compounds were identified in higher proportions in red bell pepper samples than in yellow bell pepper samples. During processing and dehydration, losses were recorded for each polyphenolic compound, the level of losses being higher during the dehydration process.
Significant differences (p < 0.05) were found for all identified polyphenols between samples belonging to the four categories: fresh bell pepper pulp (YBPP and RBPP), raw by-products of bell pepper processing (YBPB and RBPB), dehydrated bell pepper pulp (DYBPP and DRBPP), and dehydrated by-products (DYBPB and DRBPB).
Anaya-Esparza et al. [8] studied phenolic compounds in yellow and red bell peppers, identifying similar values to those identified in the present study for gallic acid with (115.74 µg/g for red bell peppers and 119.48 µg/g for yellow bell peppers), ferulic acid (11.88–27.67 µg/g for red bell peppers and 24.75–35.14µg/g for yellow bell peppers), p-coumaric acid (9.96–26.07 µg/g for red bell peppers and 18.14–2475 µg/g for yellow bell peppers), proto-catechuic acid (97.21 µg/g for red bell peppers and 95.37 µg/g for yellow bell peppers), quercitin (46.36–91.98 µg/g for red peppers and 9.66–102.33 µg/g for yellow bell peppers), and kaempferol (31.15 µg/g for red bell peppers and 9.53 µg/g for yellow bell peppers). In the same study, the authors identified higher amounts of caffeic acid (41.33–67.78 µg/g for red bell peppers and 52.42–62.96 µg/g for yellow bell peppers), epicatechin and rosmarinic acid only for red bell peppers (505 µg/g respectively 120 µg/g), rutin (290.39 µg/g for red bell peppers and 49.51 µg/g for yellow bell peppers), resveratrol (111.57 µg/g for red bell peppers and 90.78 µg/g for yellow bell peppers).
Tvrzník et al. [33] identified similar amounts of gallic acid (64.19–79.89 µg/g fresh product), coumaric acid (10.37–11.69 µg/g), and ferulic acid (9.37–12.16 µg/g); higher amounts of rutin (150.73–181.97 µg/g d.s.) and resveratrol (2.92–4.23 µg/g d.s.); and lower amounts of quercitin (8.57–11.69 µg/g) in red bell peppers. Lower amounts of gallic acid (5.39 µg/g) in bell peppers were reported by Wang et al. [34] in their study.
Thuphairo et al. [27] studied the content of bioactive compounds in different varieties of bell peppers, including yellow and red bell peppers. They identified amounts similar to the amounts reported in our study: quercitin (91.98 µg/g for red bell peppers and 102.33 µg/g for yellow bell peppers), p-coumaric acid (9.96 µg/g for red bell peppers and 10.67 µg/g for yellow bell peppers), and ferulic acid (27.67 µg/g for red peppers and 24.75 µg/g for yellow bell peppers). No data was found in the literature regarding the content of phenolic acids in bell pepper by-products.

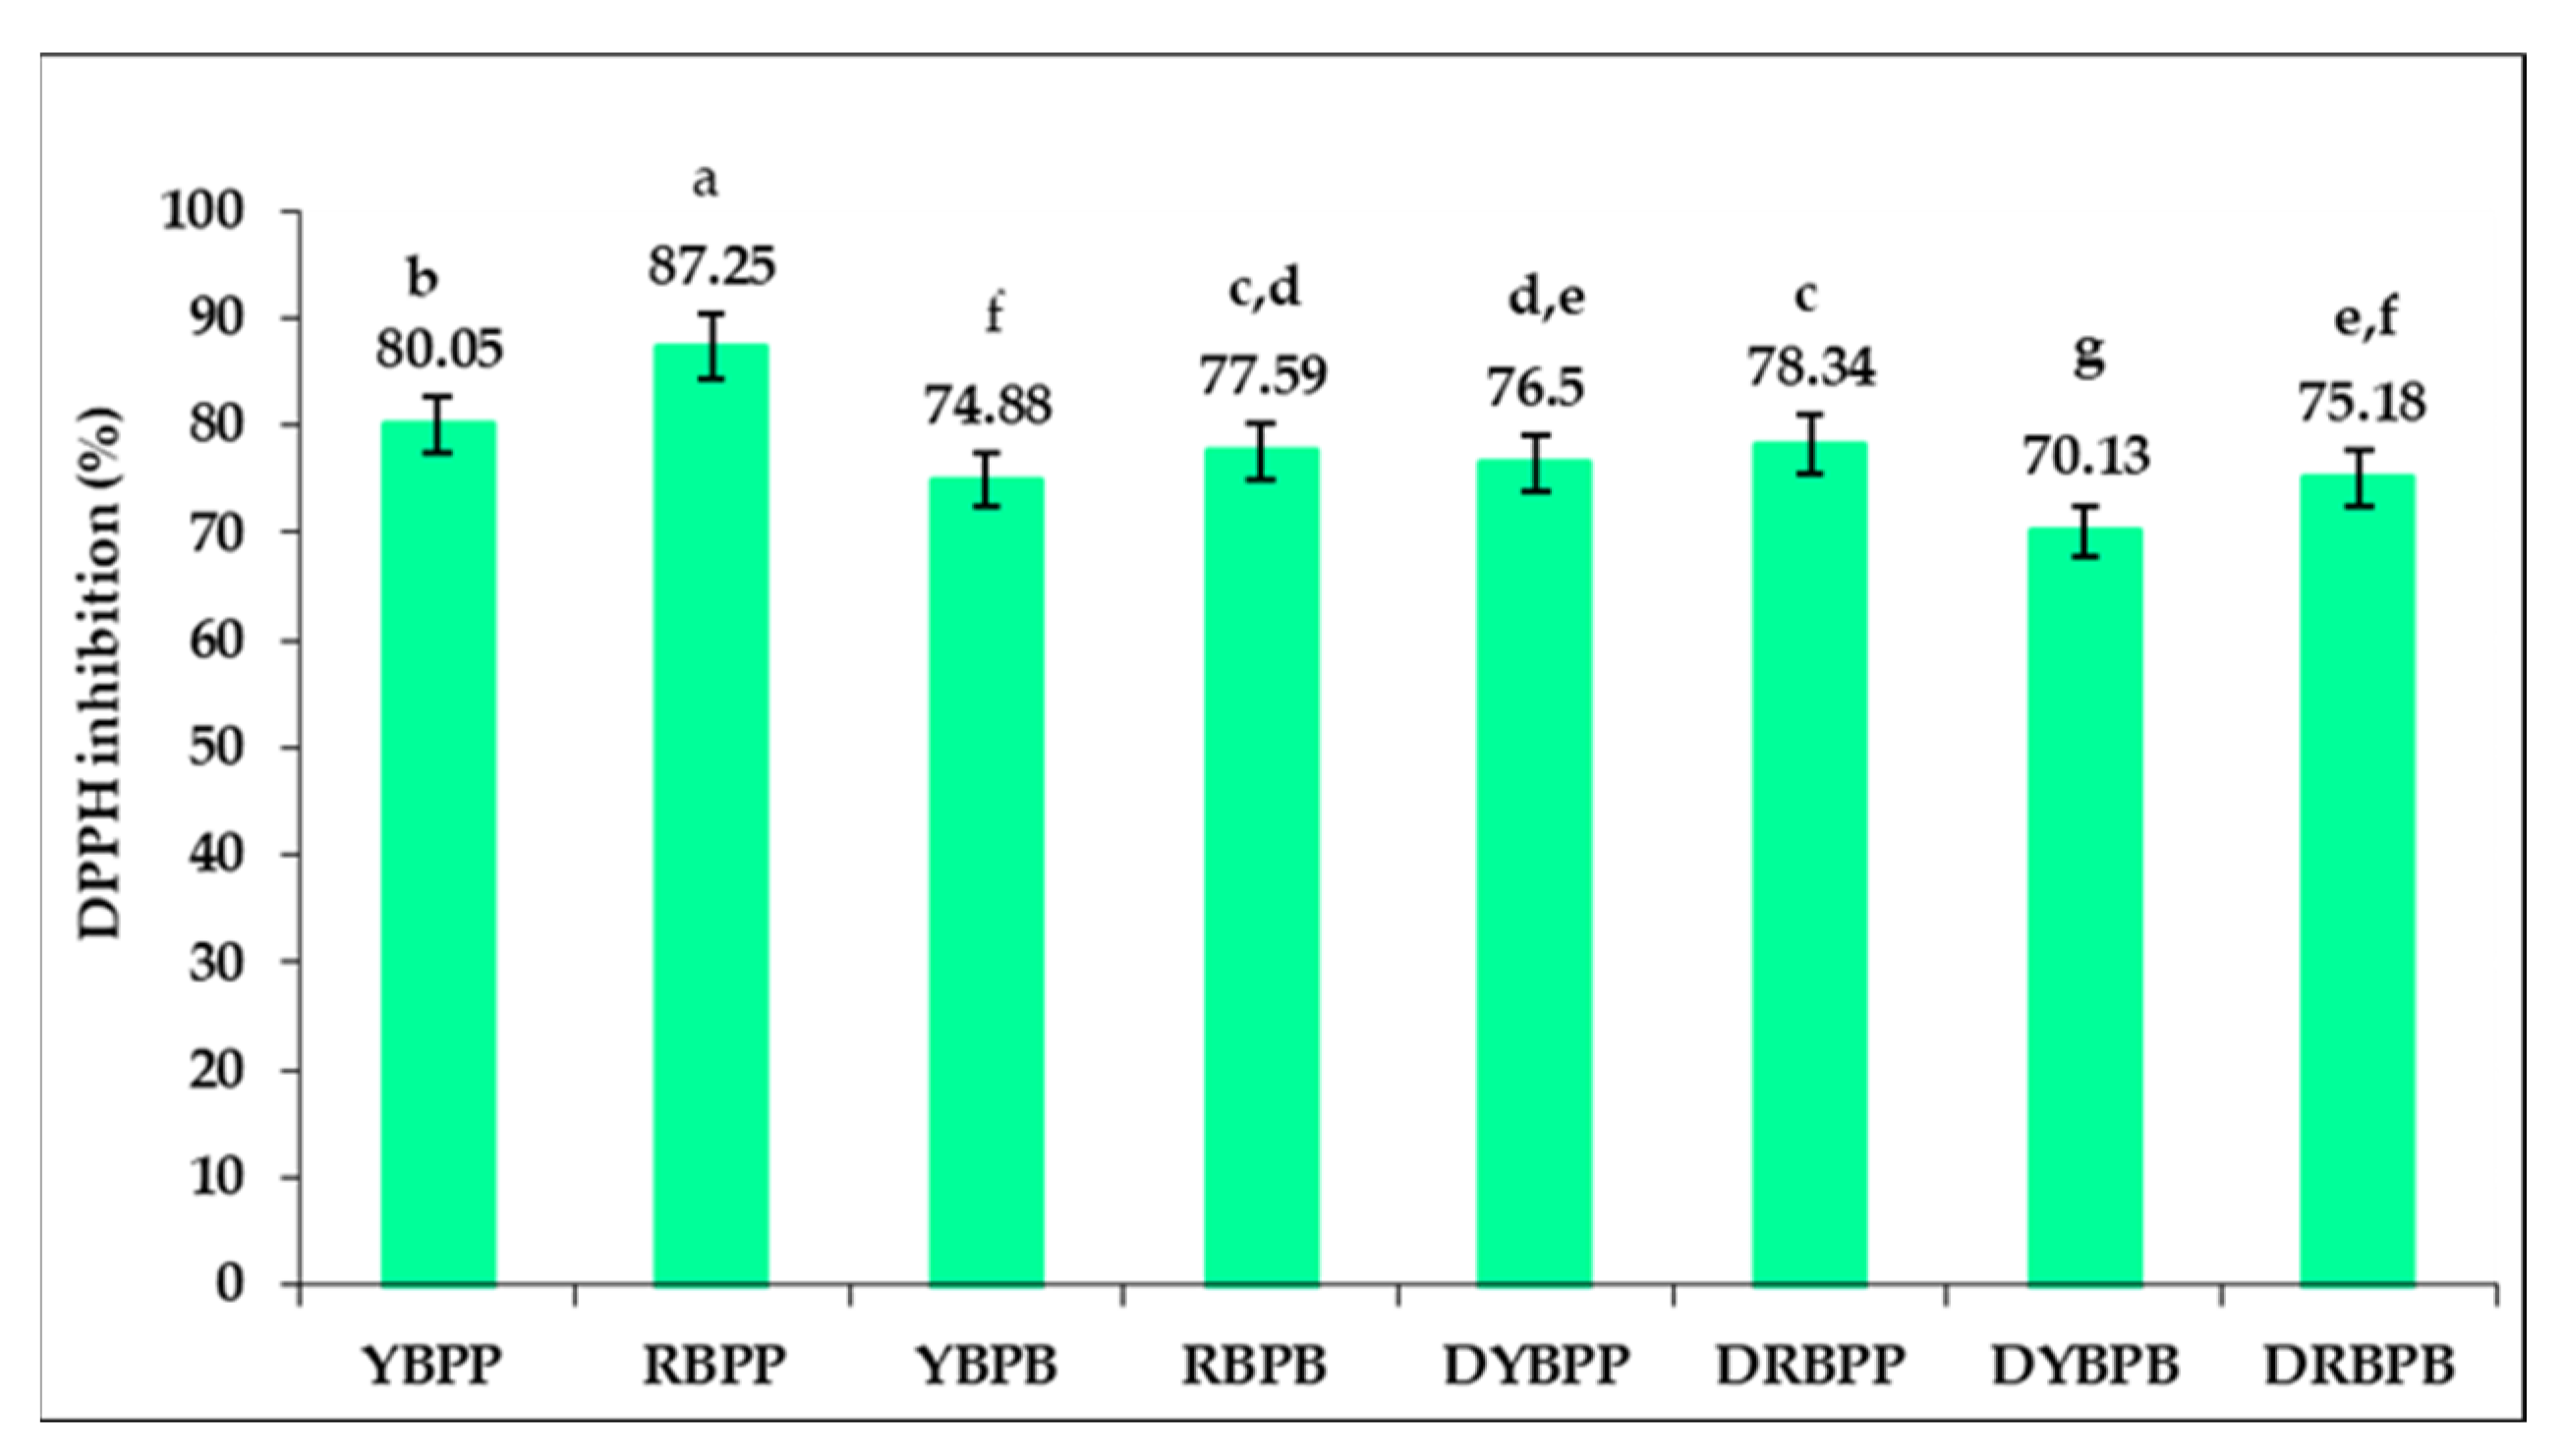
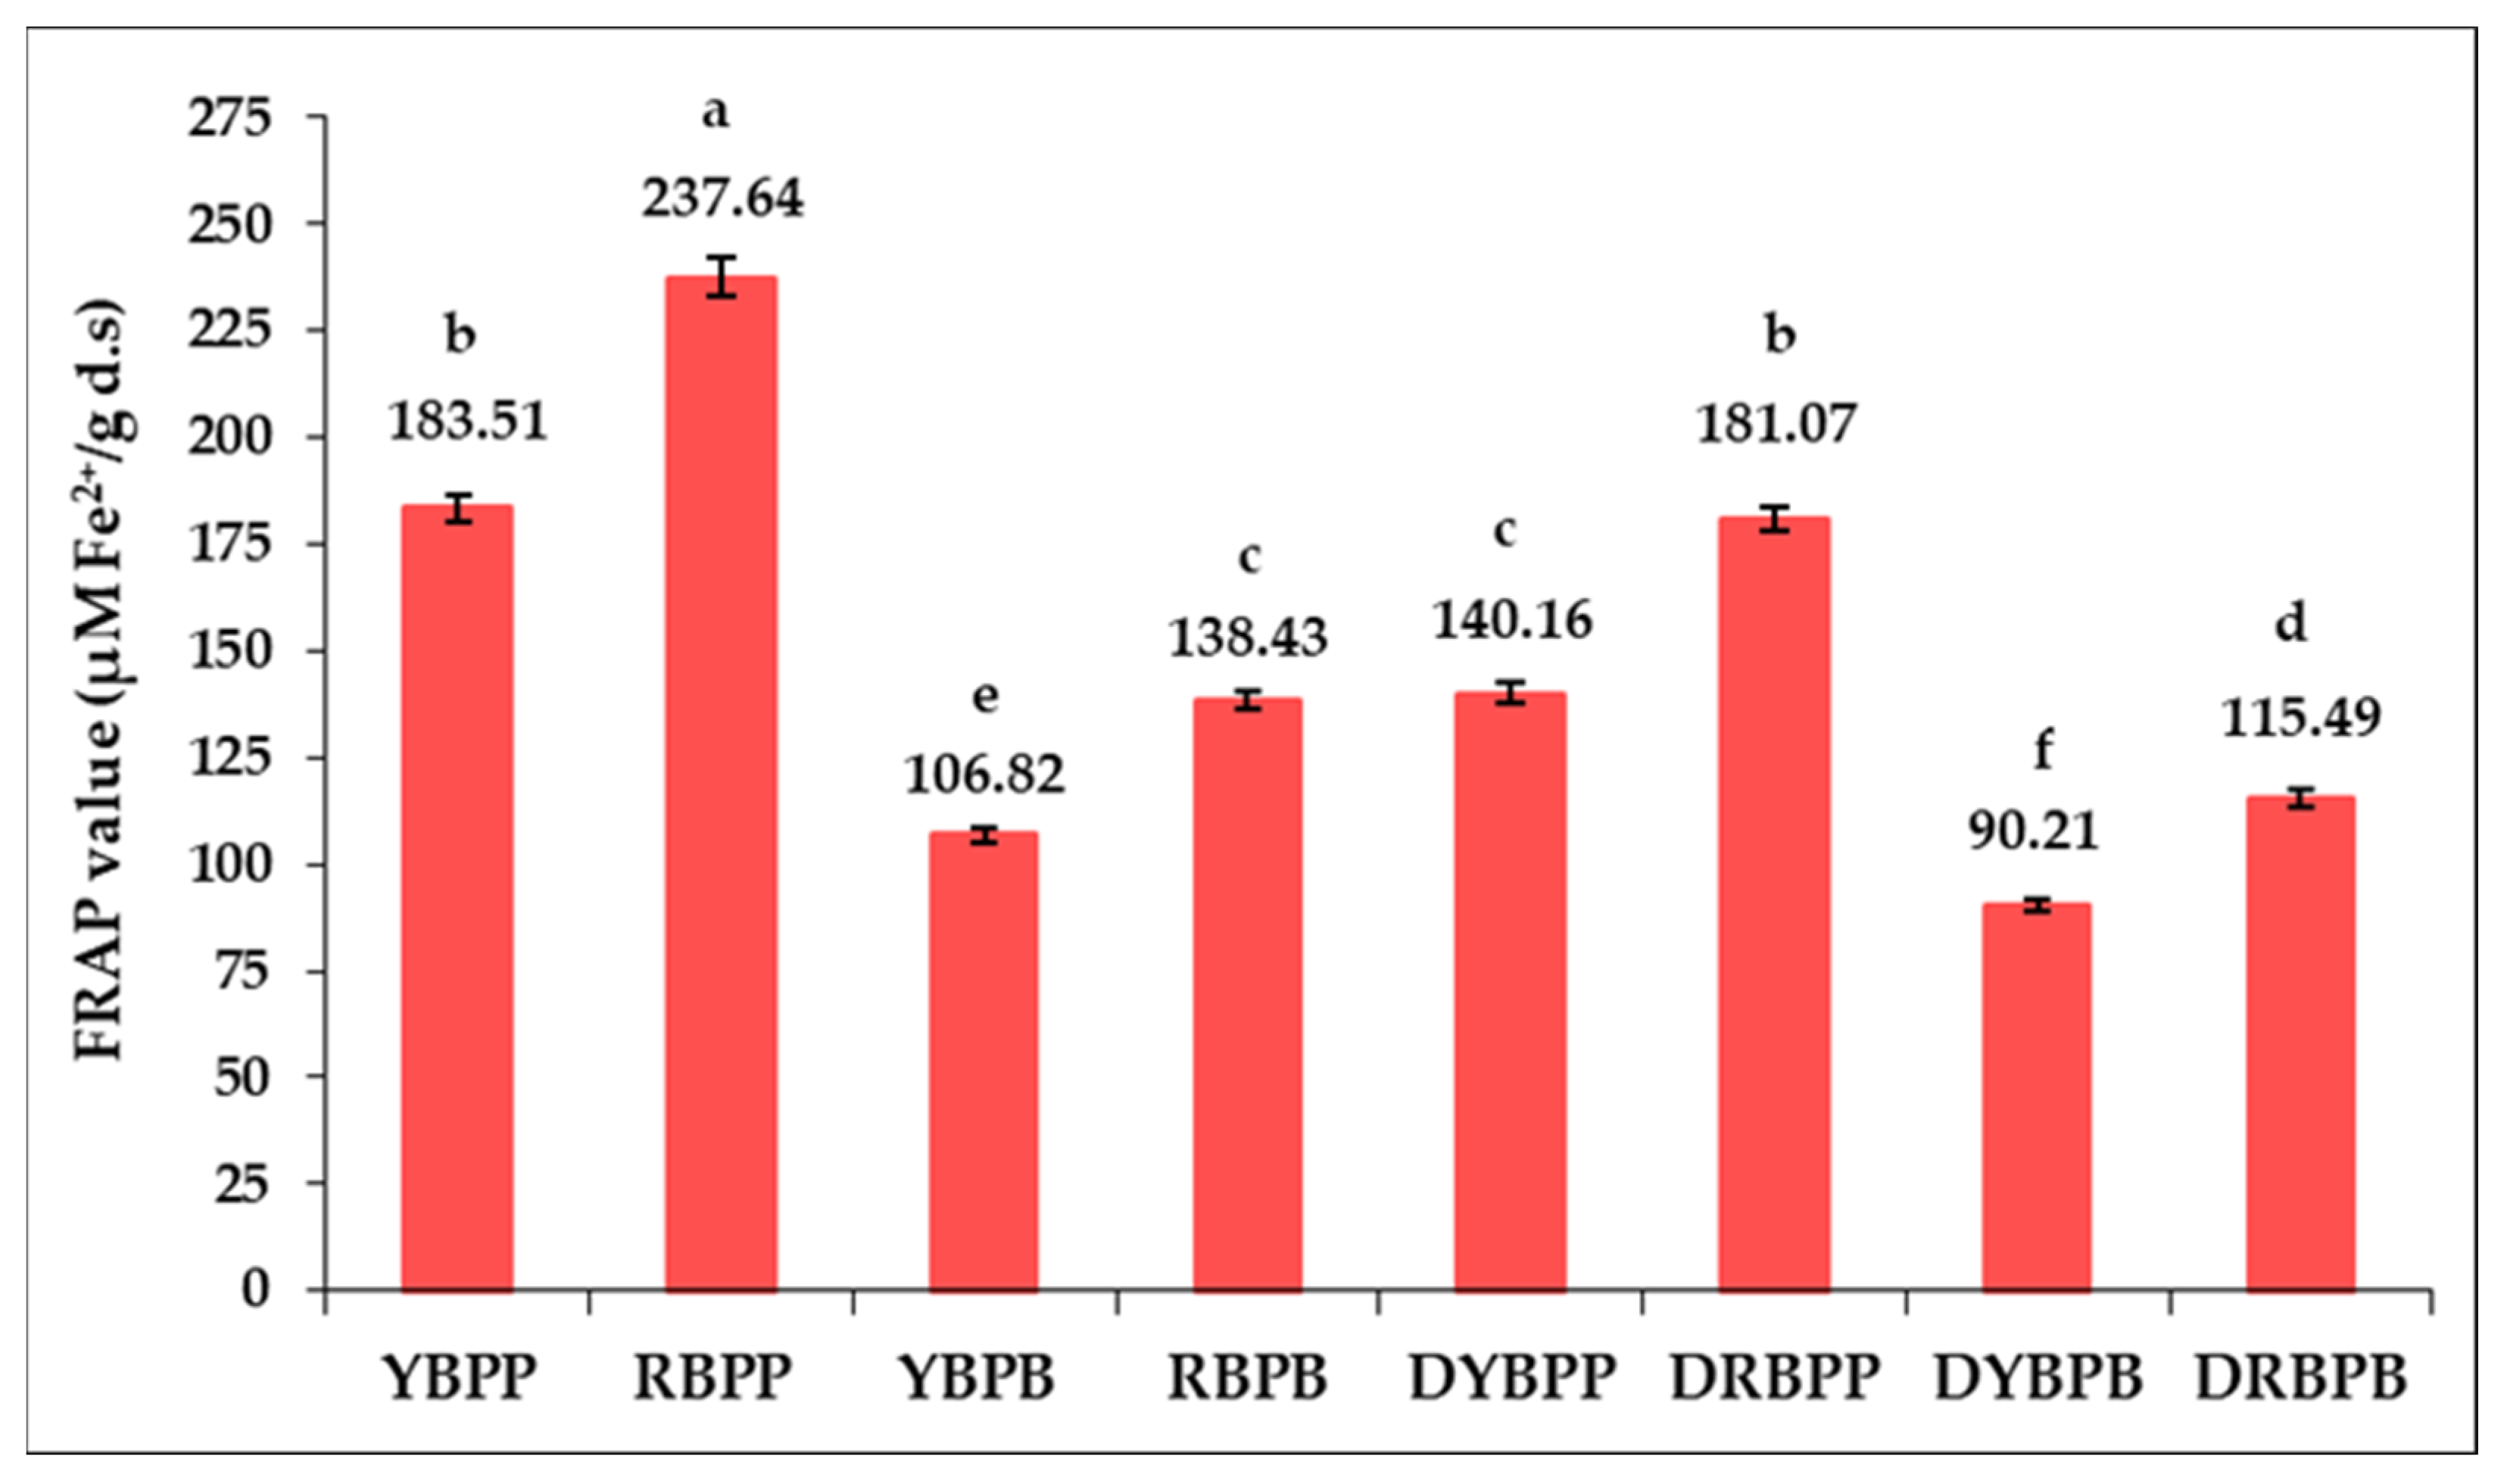
3.1.4. Antioxidant Activity

The antioxidant activity of bell pepper pulp and processing by-products, both fresh and after drying, was evaluated based on the DPPH radical scavenging activity as well as the ferric reducing antioxidant power (FRAP).
The DPPH radical scavenging activity of yellow and red bell pepper pulp and processing by-products are summarised in Figure 3. The DPPH radical scavenging activity indicates the hydrogen donating capability of the investigated samples due to the bioactive compounds possesing antioxidant properties.
The data summarised in Figure 3 shows the radical scavenging activity of the investigated samples.
The values recorded for the DPPH radical scavenging activity follow the same trend as those reported for TPC and TFC. In the case of the bell pepper samples, the DPPH inhibition ranged from 70.13% to 87.25%. The highest value was recorded for the RBPP (87.25%) and the lowest for the DYBPB (70.13%).
A decrease in free radical scavenging activity can be observed for fresh yellow and red bell pepper by-products (YBPB and RBPB), but they still maintain a significant level of DPPH inhibition (74.88% for YBPB and 77.59% for RBPB). Significant decreases (p < 0.05) were also recorded for dehydrated samples compared to fresh samples, i.e., DYBPP and DRBPP (76.50% and 78.34%, respectively) but also for DYBPB and DRBPB (70.13% and 75.18%). However, a significant level of DPPH inhibition is also maintained in the dehydrated samples, and it can be concluded that, the valorisation of yellow and red bell pepper by-products is justified, as they have a high antioxidant activity. Between the two types of bell peppers, the RBPP recorded a higher percent of DPPH inhibition than YBPP for both the initial product and the by-product, but also the initial dried product and the dried by-product.
The results are consistent with other studies on the radical scavenging activity of bell peppers. Hamed et al. [35] obtained DPPH inhibition values ranging from 59–87% for different varieties of bell peppers at different ripening stages. In the same study, the DPPH inhibition of roasted bell peppers was also evaluated, obtaining slightly lower values (31–71%), similar to our research. Similar values of DPPH inhibition were obtained by Rahim and Mat [36] in their study on the phytochemical content of different types of bell peppers, obtaining a value of 92%. In the study on the evaluation of the free radical scavenging activity of red, yellow, and green bell peppers, Mohammad Salamatullah et al. [25] reported the highest value for red bell peppers (78.5%), similar to our study, while for yellow bell peppers, it obtained 64.9%.
The antioxidant activity of the samples expressed by ferric reducing antioxidant power (FRAP) is illustrated in Figure 4.
Ferric reducing power reflects the ability of the antioxidant compounds contained in the samples investigated to donate electrons, thereby reducing oxidized intermediates of the peroxidation process [15].
The results of antioxidant activity evaluated with the FRAP assay revealed that the ferric reducing power of fresh bell pepper by-products, YBPB and RBPB, is about of 58% of the value recorded for the YBPP and RBPP.
Figure 4 also shows that drying the fresh samples at a moderate temperature of 60 °C resulted in some losses in the FRAP value, of about 24% for DYBPP and DRBPP and of 15–17% for DYBPB and DRBPB, relative to the corresponding fresh sample values. It was found that for both fresh and dried samples, the FRAP values were higher for the fractions (pulp and by-product) derived from red bell pepper compared to those from yellow bell pepper.
The trend recorded by the FRAP value is in line with that recorded by the DPPH radical scavenging activity and closely aligned with the TPC and TFC content. The results proved that the bioactive compounds present in the pulp and processing by-products of bell peppers show both ferric reducing capacity and free radical scavenging activity. These results, together with those on TPC, TFC, and DPPH radical scavenging activity, showed that a considerable part of bioactive compounds with antioxidant activity is contained in the by-products of bell pepper processing and justifies the recovery of secondary processing products and their reintegration into the food chain.
Similar results of antioxidant activity using FRAP assays have been reported by Lahbib et al. [37]. Thuphairo et al. [27] have reported slightly lowered values for the red bell pepper (125 µg/g) and the yellow bell pepper (19.87 µg/g).

3.2. The Proximate Composition of Sausages

The proximate composition of foods is of particular importance because it provides information on the quality of the raw material and a basis for determining the nutritional value and general acceptability to consumers [38]. The proximate composition of sausage samples with by-products from yellow and red bell peppers is shown in Table 3.
The moisture content of a product is the amount of water in the product, which influences the juiciness and shelf life of the product [39]. The moisture content of the samples analysed was significantly influenced (p < 0.05) by the treatments applied and the proportions of by-products used (DYBPB and DRBPB), ranging from 46.882 g/100 g to 49.583 g/100 g. Significant differences (p < 0.05) were recorded between the control sample (C: 49.583 g/100 g), and the control sausage samples heat treated by smoking and drying (SDC: 47.982 g/100 g and SDCN: 47.872 g/100 g), and the cooked and smoked samples (SSC: 48.869 g/100 g and SSCN 48.459 g/100 g). Significant differences (p < 0.05) were also found between the control samples (C, SDC, SDCN, SSC, and SSCN: 47.872–48.869 g/100 g) and the DYBPB-enriched sausage samples (DSDYBPB 50, 90, 180, and 270: 46. 882–47.872 g/100 g; SSDYBPB 50, 90, 180, and 270: 46.995–47.697 g/100 g) and DRBPB (DSDRBPB 50, 90, 180, and 270: 47.109–47.542 g/100 g; SSDRBPB 50, 90, 180, and 270: 47.205–47.562 g/100 g). Significant differences between control samples and sausage samples with the addition of tomato by-products, but also between dried and smoked sausage samples and cooked and smoked sausages, were also obtained in the previous study, which aimed to evaluate the bioactive potential of tomato by-products as a natural antioxidant in sausage formulations [12].
Similar moisture content for pork sausages was also reported by Hu et al. [39] (46.63%), and for smoked sausages, Akwetey et al. [40] reported a 49.83–55.61% moisture content. Lower moisture content for smoked pork sausages (37.4–41.2%) was reported by Amanfo et al. [41]. This may be influenced by the duration and temperature of the smoking process.
Bell pepper processing by-products have a low protein content (0.85%) [42], which influences to a small extent, the composition of the sausages to which they are added. A slight decrease in protein content in sausage samples was observed with the increasing proportion of DYBPB and DRBPB. Thus, the amounts of protein in the analysed sausage samples ranged from 18.750 g/100 g to 19.580 g/100 g, with significant differences (p < 0.05) between the control samples (SC, SDC, SDCN, SSC, SSCN with values ranging from 19.370 to 19.580 g/100 g) and the samples with added bell pepper processing by-products (DSDYBPB, SSDYBPB, DSDRBPB, and SSDRBPB with values within the range 18.750–19.260 g/100 g). Sam et al. [43] observed similar trends and reported a decrease in protein content by adding carrots to Frankfurter-type sausages. Similar values for protein content were also reported by Bhuyan et al. for sausages smoked with different methods (i.e., between 18.39–19.57%). In the previous study, which investigated the antioxidant potential of tomato processing by-products, protein content was recorded in samples of sausages fortified with tomato by-products because the tomato by-products contained up to 175.6 g/kg [12].
The lipid content of dried and ground bell pepper by-products is 1.8% [44]. Thus, the inclusion of these by-products (DYBPB and DRBPB) in sausage formulas at different doses significantly (p < 0.05) influenced the fat content, with the control samples (SC, SDC, SDCN, SSC, SSCN) recording the highest fat percentages (25.462–26.483 g/100 g), compared to the samples with added bell pepper processing by-products (DSDYBPB, SSDYBPB, DSDRBPB, and SSDRBPB), with values in the range 24.896–25.848 g/100 g. A slight reduction in fat content was observed as the level of added DYBPB and DRBPB increased (Table 3).
As regards the heat treatments applied, it can be seen that the type of heat treatment applied does not significantly influence the fat content. Reddy et al. [45] reported similar findings for turkey sausages to which he added different proportions of carrot paste, but also by Cadariu et al. [12] for sausages in which tomato processing by-product powder has been included in the recipe.
The ash content provides information on the total mineral content [46]. The mineral content (Table 2) was in the range of 2.360–3.125 g/100 g, being significantly higher (p < 0.05) in the case of sausage samples with the addition of bell pepper processing by-products, i.e., DSDYBPB, SSDYBPB, DSDRBPB, and SSDRBPB. It can also be seen that the mineral content increases proportionally with the dose of DYBPB and DRBPB added to the sausage formulations.
Similar findings were reported by Ahmad et al. [47] in chicken sausages mashed with various vegetables (oyster mushrooms, purple cabbage, spinach, bell peppers, and morel mushrooms), which were explained by the high fibre content of the vegetables. Hu et al. [39] reported a similar trend, who substituted meat from pork sausages with different proportions of tremella, obtaining values between 3.12–3.57%. Seo et al. reported similar ash contents for pork sausages, respectively 2.18–2.25%.
The NaCl content of the studied sausage samples did not differ significantly (p < 0.05) within the range of 2.050–2.180 g/100 g. Similar values for sausages were also reported by Cadariu et al. [12] (i.e., between 2.110–2.140 g/100 g), but also by Cocan et al. [24], who reported for chicken sausages, a NaCl content between 1.90 and 2.52%, and Aaslyng et al. [48] reported values between 1.74 and 2.19% for NaCl content.
Carbohydrate content ranged from 0.905 to 4.191 g/100 g, which increased with the increasing proportion of the DYBPB and DRBPB introduced in sausage formulas. The heat treatment applied to the sausage samples did not influence the carbohydrate content. Similar values for sausage samples supplemented with tomato processing by-products were obtained by Cadariu et al. [12] (i.e., between 0.261–0.981 g/100 g), but Romero et al. [49] also reported values for different types of sausages between 0.63–2.33%.
Regarding the energy value, the addition of the DYBPB and DRBPB to sausage formulas resulted in a slight reduction in energy value, the sausage samples with the addition of bell pepper processing by-products had a lower energy value (315.356–332.26 kcal/100 g) than the control samples for which values ranging from 310.979–322.742 kcal/100 g were recorded. These values are within limits reported by Cadariu et al. [12] for pork sausages supplemented with tomato processing by-products (323.564–342.562 kcal/100 g), but also by Romero et al. [49] (261.14–376.27 kcal/100 g) for different types of sausages.

3.3. Oxidative Stability Assessment

3.3.1. Peroxide Value (PV)

The peroxide value (PV) indicates information about the initial stage of fat deterioration and is a very important indicator used in food quality control and safety [50].
Table 4 shows the effect of supplementing sausage formulations with bell pepper processing by-products (DYBPB and DRBPB) on the peroxide value during the 20-day storage period compared to the control and sausage samples to which sodium nitrite was added.
In the initial stage of the degradation of fats and oils, the PV is measured to find out the level of hydroperoxide formed as a result of the oxidation process. Since oxidized products are generally toxic, the formation of hydroperoxides (the primary oxidation product of fats and oils) must be suppressed to ensure protection against the oxidation of fats and oils and the formation of secondary oxidation products, both from a food quality and food safety perspective [50].
The PV was significantly higher in the control samples (SC, SDC, and SSC) compared to the samples with added sodium nitrite, DYBPB, and DRBPB during the 20 days of storage.
During the 20 days of storage, peroxide index values were influenced by the heat treatments applied and the addition of the DYBPB and DRBPB to the sausage formulations (Table 4). Thus, with increasing doses of the DYBPB and DRBPB added to sausage formulations, a decrease in PV was observed. Lower PV values were recorded between the two sub-drugs used for the sausage samples with added DYBPB (0.327–4.773 meq O2/kg) compared to the samples with added DRBPB (0.257–4.367 meq O2/kg). This can be attributed to the higher bioactive potential of the DRBPB compared to the DYBPB.
The heat treatment applied also influenced the PV value. Thus, for the smoked and oiled samples, lower values were recorded (0.327–4.534 meq O2/kg for SSDYBPB and 0.257–4.138 meq O2/kg for SSDRBPB) compared to those that were smoked and dried (0.429–4.773 meq O2/kg for DSDYBPB and 0.308–4.367 meq O2/kg). Significant differences (p < 0.05) between the PV values of the investigated samples were recorded throughout the storage period. Comparing the PV registered for control samples with the addition of sodium nitrite (DCN and SCN) and sausage samples with the addition of the DYBPB and DRBPB can conclude that the DRBPB at doses providing a level of polyphenolic compounds of 180–270 mg GAE/kg processed raw meat and the DYBPB at an amount providing a level of 270 mg GAE can replace sodium nitrite in meat products for both smoked and dried and smoked and cooked sausage formulations.
In the previous study carried out by the authors of the article, evaluating the effect of tomato processing by-products added in different proportions to sausage formulas, a similar trend in the evolution of the primary oxidation process was obtained throughout the 20 days of storage with values obtained in the range 0.300–4.048 meq O2/kg [12]. An inhibitory effect of the oxidation process was also reported by Aguirrezábal et al. [51] in their study on the evaluation of the antioxidant potential of onion and paprika on meat. In addition, Ahmad et al. [47] obtained an inhibitory effect in the primary oxidation process for sausage samples supplemented with various vegetables (bell peppers, carrot, spinach, purple cabbage, oyster mushroom), and Ghimire et al. [52] followed the effect of using pomegranate peel extract in beef.

3.3.2. p-Anisidine Value (p-AV)

The p-AV represents the amount of aldehydes formed as secondary products during the autoxidation process of oils and fats while also providing information on the state of lipid damage. The p-AV is based on the reaction between the carbonyl group and p-anisidine, resulting in the formation of the intensely coloured Schiff base, which is determined spectroscopically (UV/VIS) [53].
Table 5 shows the effect of supplementing sausage formulas with dried bell pepper jerky products on p-AV during 20 days of storage.
A closer look at the results obtained during the 20 days of storage shows that the control samples (SC, SDC, and SSC) had a significantly (p < 0.05) higher p-AV (1.706–4.268) compared to the samples of sausages with added sodium nitrite (0.308–1.587) and the samples supplemented with DYBPB (0.115–2.225) and DRBPB (0.083–2.054), respectively.
The p-AV was influenced during the 20 days of storage by the proportion of added DYBPB and DRBPB and the heat treatment applied to the sausages (Table 5). Thus, the p-AV decreased with increasing DYBPB and DRBPB incorporated in sausage formulations. Among the two types of by-products used, better results were obtained for the sausage samples with the addition of DRBPB (0.083–2.054) against the sausage samples with the addition of DYBPB (0.115–2.225). This may be due to the higher content of antioxidants recorded in the DRBPB compared to DYBPB.
Comparing the results obtained from the two types of heat treatment, it can be seen that the samples that were subjected to smoking and scalding process (SSDYBPB and SSDRBPB) recorded lower values (0.083–2.115) compared to the smoked and dry samples (DSDYBPB and DSDRBPB) (0.140–2.225). These significant differences (p < 0.05) between the samples of sausages analysed were recorded throughout the 20 days of storage. Evaluating the results obtained for control samples with the addition of sodium nitrite (DCN and SCN) and samples with the addition of the DYBPB and DRBPB, we can conclude that the DRBPB in doses that provide a polyphenolic compound content of at least 180 mg GAE/kg processed meat can replace sodium nitrite in meat products both for dry samples and scalded samples. Regarding the DYBPB replacement in sausage formulations, promising results were recorded at a dose ensuring a polyphenolic compounds level of 270 mg GAE/kg of processed meat.
A similar trend was observed in the previous study published by the authors regarding the supplementation of pork sausages with different doses of tomatoes processing by-products [12]. In this case, the p-AV decreased with increasing doses of added by-products, and lower values were obtained for smoked and scalded sausages (0.202–2.241) than for smoked and dried sausages (0.260–2.443) [12]. Cagdas and Kumcuoglu [54] also reported a reduction in the p-AV value in their study evaluating the effect of grape seed powder on the oxidative stability of precooked chicken nuggets during five months of storage; the values were higher than in the present study. After one month of storage for the control sample, the p-AV increased from 5.99 to 7.48 and for the sample with the highest amount of grape seed powder, the p-AV increased from 4.69–5.77. Rasinska et al. [55] analyzed the evolution of the degree of lipid oxidation in meat subjected to different heat treatments and observed that cooked samples showed significantly lower values than dried samples.

3.3.3. Total Oxidation Value (TOTOX)

In the assessment of oxidative stability, to obtain the most accurate and comprehensive information, it is necessary to examine the samples in terms of primary (PV) and secondary (p-AV) oxidation. Combining the two types of tests (PV and p-AV), it is possible to calculate the total oxidation of the analyzed samples (TOTOX). This index is calculated as two PV units and one p-AV [56].
Figure 5 shows the effect of supplementing sausage samples with the DYBPB and DRBPB on TOTOX values compared to control samples and sausage samples with added sodium nitrite. Significantly higher values were recorded for the control samples (SC, SDC, and SSC), i.e., between 5.286–14.442 compared to the sodium nitrite added samples (1.120–7.333) and those supplemented with DYBPB (0.769–11.771) and DRBPB (0.597–10.788) respectively throughout the 20 days of storage.
Comparing the data presented in Figure 5, similar to the values obtained in the case of PV and p-AV and in the case of TOTOX, the dose of DYBPB and DRBPB and the type of heat treatment influenced the results obtained.
As the dose of DYBPB and DRBPB increased, TOTOX values decreased, with lower TOTOX values recorded for the DRBPB-added sausage samples (0.597–10.788) compared to the DYBPB-supplemented sausage samples (0.769–11.771). The heat treatments applied to the sausage samples also influenced the results with lower TOTOX values for smoked and cooked samples (SSDYBPB and SSDRBPB) (0.597–10.788) compared to smoked and dried sausage samples (DSDYBPB and DSDRBPB) (0.756–11.771).
Comparing the TOTOX values recorded for control sausage samples with added sodium nitrite (DCN and SCN) and sausage samples supplemented with the DYBPB and DRBPB, it can be stated that the incorporation of the DRBPB into sausage formulations in doses that ensure a level of polyphenolic compounds of at least 180 mg GAE/kg of pre-processed meat can replace sodium nitrite for both smoked and dried sausages and smoked and dry sausages. Concerning the supplementation of sausage formulations with the DYBPB, it has been observed that this by-product of processing yellow bell peppers can replace sodium nitrite when used at a dose that provides a polyphenolic compound content of 270 mg GAE/kg processed meat.
A similar trend was also reported in the previous study on the evaluation of tomato by-product supplementation of sausages, where the TOTOX value decreased with increasing dose of by-product used, and in terms of the heat treatment used, smoked and scalded samples showed lower values compared to smoked and dried samples [12]. Similar values were also reported by Nacak et al. [57], who evaluated the development of oxidation degree over 3 months in sausages to which rosemary extract and tocopherol were added. After 30 days, the values recorded for TOTOX were 5.78–8.61, compared to the control sample, for which 12.07 was recorded.

3.3.4. Thiobarbituric Acid (TBA) Value

Malondialdehyde (MDA) is a very important aldehyde for meat products, which is formed during secondary lipid oxidation of polyunsaturated (1-3-propanediol) fatty acids and is the main indicator of lipid oxidation leading to the formation of rancid odours in small amounts. Several studies have found that a value of 2–3 mg MDA/kg is required for meat and meat products to be suitable for consumption [58].
Figure 6 shows the TBA values following supplementation of sausage formulas with bell pepper processing by-products (DRBPB and DYBPB) during the 20-day storage period compared to the control samples and sausage samples with added sodium nitrite.
Significantly higher TBA values were recorded for the control samples (SC, SDC, and SSC) compared to the samples with added sodium nitrite, DYBPB, and DRBPB throughout the 20 days of storage. The doses of the DYBPB and DRBPB and the heat treatments applied significantly influenced the TBA values obtained throughout storage (Figure 6).
Thus, with increasing doses of the DYBPB and DRBPB, the TBA values of the investigated sausage samples decreased. In addition, better results in terms of TBA values were recorded for sausage samples with the added DRBPB (0.419–3.134 mg MDA/kg) compared to those with the added DYBPB (0.457–3.554 mg MDA/kg). When comparing the TBA values obtained from the two heat treatments applied, lower TBA values were obtained in the smoked and scalded samples (0.419–3.337 mg MDA/kg) compared to the smoked and dried samples (0.422–3.554 mg MDA/kg). These significant differences (p < 0.05) between the sausage samples analysed were recorded throughout the 20 days of storage.
Comparing the TBA values recorded for the DCN and SCN sausage samples and the sausages samples with the addition of the DYBPB and DRBPB, it can be seen that for both smoked and dried and smoked and scalded samples, the DRBPB in doses that provide a polyphenolic content level of at least 180 mg GAE/kg processed raw meat can replace sodium nitrite in meat products. Similarly, to replace sodium nitrite with the DYBPB in sausage formulae, a dose providing a level of polyphenolic compounds of 270 mg GAE/kg raw processed meat is required.
The TBA values of the sausage samples analysed up to day 10 of storage were below 3 mg/kg, suggesting that they were not affected by the oxidation and rancidity process. After 20 days of storage, samples of the DSDRBPB and SSDRBPB at doses providing a level of polyphenolic compounds of at least 180 mg GAE/kg of raw processed meat recorded values below 3 mg MDA/kg, demonstrating that DRBPB protected sausage samples against oxidation and rancidity.
When DYBPB was incorporated into sausage formulas at doses providing a polyphenolic compound level of 270 mg GAE/kg processed meat, no oxidation and rancidity process was found to have occurred. Both DSDYBPB and SSDYBPB were protected against rancidity and oxidation by adding the DYBPB at a dose that ensures a polyphenolic content level of 270 mg GAE/kg processed meat.
Our results are in agreement with those reported previously [12] when the effect of tomato processing by-products on the oxidation of smoked and cooked sausages and smoked and dried sausages during storage for 20 days was investigated.
A similar trend was also recorded by Martinez et al. [59], who studied the effect of adding cayenne and red sweet bell pepper in different proportions (0.1, 0.5, and 2%) as a natural antioxidant on lipid oxidation inhibition. In this case, the addition of cayenne reduced the degree of oxidation of the samples analysed, and the MDA values recorded decreased with increasing the dose of cayenne added to the sausage recipe.
Cabral et al. [60] also reported the reduction of TBA values in their study in which they added balloon pepper in different proportions (0.5, 1, and 1.5%) to the recipe of fresh and smoked sausages and followed their effect during 60 days of storage. Balloon pepper inhibited oxidation in fresh and smoked samples by day 30 of storage. The TBA values also decreased as the dose of balloon pepper was increased.

4. Conclusions

The findings generated from this study provide solid evidence of the antioxidant properties of red and yellow bell pepper processing by-products. Both the RBPB and YBPB are valued sources of bioactive compounds with proven antioxidant properties that can be exploited in a variety of food products. The trend recorded with the FRAP value of both fresh and dried bell pepper by-products is in line with that recorded with the DPPH radical scavenging activity and closely aligned with the TPC and TFC content.
The innovation of this study resides in exploiting the potential of bell pepper processing by-products to create value-added nitrite-free sausage formulations. In addition, the procedure for establishing the amounts of the DYBPB and DRBPB included in the recipe of sausage formulas to ensure particular levels of TPC represents a novel approach. It was found that the incorporation of the DRBPB and DYBPB into the sausage recipe as a substitute for sodium nitrite improved the nutritional profile of the samples, providing higher ash and lower fat content compared to the control samples. The most important aspect related to the supplementation of sausage formulations with the DYBPB and DRBPB consisted of limiting the primary and secondary oxidation processes of lipids, thus contributing to increase their oxidative stability. A dose of the DYBPB providing a minimum TPC of 270 mg GAE/kg of processed meat resulted in similar values of specific chemical indices used to assess oxidative stability to those obtained in samples with sodium nitrite. In addition, a dose of DRBPB ensuring a minimum TPC of 180 mg GAE/kg of processed meat had an effect close to that shown when sodium nitrite was used in the sausage recipe.
Our results demonstrate the effectiveness of dried red and yellow bell pepper processing byproducts to replace sodium nitrite in pork sausages in terms of antioxidant potential and promote their use as natural additives to delay or limit oxidative degradation processes in nitrite-free sausages involving different technological flows, both smoking and drying and smoking and scalding. For an in-depth evaluation of the effectiveness of bell pepper processing by-products for use as an alternative to sodium nitrite in meat products, further studies will be conducted to assess the impact of supplementation with the DRBPB and DYBPB on microbiological and sensory properties of sausage formulations. Thus, the use of bell pepper processing wastes could become a promising solution to develop innovative nitrite-free sausage formulations. Our data also contributes to the development of knowledge on enhancing the functionality of meat products by boosting levels of high-value bioactive compounds.

Author Contributions

Conceptualization, I.C., A.-I.C., M.N. and M.-A.P.; methodology, I.C., A.-I.C., M.N., E.A., D.O. and M.-A.P.; validation, I.C., E.A., I.R. and M.-A.P.; formal analysis, I.C., A.-I.C., M.N., D.O. and M.-A.P.; writing—original draft preparation, I.C., A.-I.C., M.N., E.A., D.O., I.R. and M.-A.P.; writing—review and editing, I.C., A.-I.C., M.N., E.A., D.O., I.R. and M.-A.P.; visualization, I.C., M.N., E.A., I.R. and M.-A.P.; supervision, I.C., E.A., I.R. and M.-A.P.; funding acquisition, I.R. All authors have read and agreed to the published version of the manuscript.

Funding

This research paper is supported by the project “Increasing the impact of excellence research on the capacity for innovation and technology transfer within USAMVB Timisoara”, project code 6PFE, submitted in the competition Program 1—Development of the national system of research—development, Subprogram 1.2—Institutional performance, Institutional development projects—Development projects of excellence in R.D.I.

Institutional Review Board Statement

Not applicable.

Informed Consent Statement

Not applicable.

Data Availability Statement

The report of the analyzes performed for the samples in the paper can be found at the Interdisciplinary Research Platform (PCI) belonging to the University of Life Sciences “King Michael I” from Timisoara.

Acknowledgments

We have been able to perform this research with the support of the Interdisciplinary Research Platform belonging to the University of Life Sciences “King Michael I” from Timisoara, where the analysis were made.

Conflicts of Interest

The authors declare no conflict of interest.

References

  1. Rather, S.A.; Masoodi, F.A.; Akhter, R.; Gani, A.; Wani, S.M.; Malik, A.H. Xanthan gum as a fat replacer in goshtaba—A traditional meat product of India: Effects on quality and oxidative stability. J. Food Sci. Technol. 2015, 52, 8104–8112. [Google Scholar] [CrossRef] [PubMed] [Green Version]
  2. Shah, M.A.; Bosco, S.J.D.; Mir, S.A. Plant extracts as natural antioxidants in meat and meat products. Meat Sci. 2014, 98, 21–33. [Google Scholar] [CrossRef] [PubMed]
  3. Pereira, L.F.S.; Inácio, M.L.C.; Pereira, R.C.; Angelis-Pereira, M.C. Prevalence of Additives in Processed Food Marketed in a South City of Minas Gerais. Rev. Ciênc. Saúde 2015, 5, 46–52. [Google Scholar] [CrossRef]
  4. Silva, C.; Monteiro, M.L.G.; Ribeiro, R.O.R.; Guimarães, C.F.M.; Mano, S.B.; Pardi, H.S.; Mársico, E.T. Presença de aditivos conservantes (nitrito e sulfito) em carnes bovinas moídas, comercializadas em mercados varejistas. Rev. Bras. Ciênc. Vet. 2009, 16, 33–36. [Google Scholar] [CrossRef]
  5. Karre, L.; Lopez, K.; Getty, K.J.K. Natural antioxidants in meat and poultry products. Meat Sci. 2013, 94, 220–227. [Google Scholar] [CrossRef]
  6. Kumar, Y.; Yadav, D.N.; Ahmad, T.; Narsaiah, K. Recent Trends in the Use of Natural Antioxidants for Meat and Meat Products. Compr. Rev. Food Sci. Food Saf. 2015, 14, 796–812. [Google Scholar] [CrossRef] [Green Version]
  7. Cvetković, T.; Ranilović, J.; Jokić, S. Quality of Pepper Seed By-Products: A Review. Foods 2022, 11, 748. [Google Scholar] [CrossRef]
  8. Anaya-Esparza, L.M.; de la Mora, Z.V.; Vázquez-Paulino, O.; Ascencio, F.; Villarruel-López, A. Bell Peppers (Capsicum annum L.) Losses and Wastes: Source for Food and Pharmaceutical Applications. Molecules 2021, 26, 5341. [Google Scholar] [CrossRef]
  9. Sandoval-Castro, C.J.; Valdez-Morales, M.; Oomah, B.D.; Gutiérrez-Dorado, R.; Medina-Godoy, S.; Espinosa-Alonso, J.G. Bioactive compounds and antioxidant activity in scalded Jalapeño pepper industrial byproduct (Capsicum annuum). J. Food Sci. Technol. 2017, 54, 1999–2010. [Google Scholar] [CrossRef]
  10. Ribeiro, T.B.; Voss, G.B.; Coelho, M.C.; Pintado, M.E. Chapter 33—Food waste and by-product valorization as an integrated approach with zero waste: Future challenges. In Future Foods; Bhat, R., Ed.; Academic Press: Cambridge, MA, USA, 2022; pp. 569–596. [Google Scholar]
  11. Viacava, G.E.; Ansorena, M.R.; Roura, S.I.; González-Aguilar, G.A.; Ayala-Zavala, J.F. Fruit Processing Byproducts as a Source of Natural Antifungal Compounds. In Antifungal Metabolites from Plants; Razzaghi-Abyaneh, M., Rai, M., Eds.; Springer: Berlin/Heidelberg, Germany, 2013. [Google Scholar]
  12. Cadariu, A.I.; Cocan, I.; Negrea, M.; Alexa, E.; Obistioiu, D.; Hotea, I.; Radulov, I.; Poiana, M.-A. Exploring the Potential of Tomato Processing Byproduct as a Natural Antioxidant in Reformulated Nitrite-Free Sausages. Sustainability 2022, 14, 11802. [Google Scholar] [CrossRef]
  13. Ciulca, S.; Roma, G.; Alexa, E.; Radulov, I.; Cocan, I.; Madosa, E.; Ciulca, A. Variation of Polyphenol Content and Antioxidant Activity in Some Bilberry (Vaccinium myrtillus L.) Populations from Romania. Agronomy 2021, 11, 2557. [Google Scholar] [CrossRef]
  14. Hulea, A.; Obiștioiu, D.; Cocan, I.; Alexa, E.; Negrea, M.; Neacșu, A.-G.; Hulea, C.; Pascu, C.; Costinar, L.; Iancu, I.; et al. Diversity of Monofloral Honey Based on the Antimicrobial and Antioxidant Potential. Antibiotics 2022, 11, 595. [Google Scholar] [CrossRef] [PubMed]
  15. Benzie, I.F.F.; Strain, J.J. The ferric reducing ability of plasma (FRAP) as a measure of “Antioxidant Power”: The FRAP Assay. Anal. Biochem. 1996, 239, 70–76. [Google Scholar] [CrossRef] [Green Version]
  16. Metzner Ungureanu, C.R.; Poiana, M.A.; Cocan, I.; Lupitu, A.I.; Alexa, E.; Moigradean, D. Strategies to improve the thermo-oxidative stability of sunflower oil by exploiting the antioxidant potential of blueberries processing by products. Molecules 2020, 25, 5688. [Google Scholar] [CrossRef] [PubMed]
  17. SR ISO 1443:2008; Meat and Meat Products—Determination of Total Fat Content. ISO: Geneva, Switzerland, 2008.
  18. SR ISO 937:2007; Meat and Meat Products—Determination of Nitrogen Content (Reference Method). ISO: Geneva, Switzerland, 2007.
  19. SR ISO 1442:2010; Meat and Meat Products—Determination of Moisture Content (Reference Method). ISO: Geneva, Switzerland, 2010.
  20. SR ISO 936:2009; Meat and Meat Products—Determination of Total Ash. ISO: Geneva, Switzerland, 2009.
  21. SR ISO 91-2007; Meat and Meat Products—Determination of NaCl. ISO: Geneva, Switzerland, 2007.
  22. Association of Coaching Supervisors. Official and Recommended Practices of the American Oil Chemists’ Society. In Official Methods and Recommended Practices, 5th ed.; Firestone, D., Ed.; AOAC Press: Champaign, IL, USA, 1998. [Google Scholar]
  23. AOCS. Official Method Cd 18–90, p-Anisidine Value. In Official Methods and Recommended Practices of the AOCS; AOCS: Urbana, IL, USA, 2017. [Google Scholar]
  24. Cocan, I.; Negrea, M.; Cozma, A.; Alexa, E.; Poiana, M.-A.; Raba, D.; Danciu, C.; Popescu, I.; Cadariu, A.I.; Obistioiu, D.; et al. Chili and Sweet Pepper Seed Oil Used as a Natural Antioxidant to Improve the Thermo-Oxidative Stability of Sunflower Oil. Agronomy 2021, 11, 2579. [Google Scholar] [CrossRef]
  25. Mohammad Salamatullah, A.; Hayat, K.; Mabood Husain, F.; Asif Ahmed, M.; Arzoo, S.; Musaad Althbiti, M.; Alzahrani, A.; Al-Zaied, B.A.M.; Kahlil Alyahya, H.; Albader, N.; et al. Effects of different solvents extractions on total polyphenol content, HPLC analysis, antioxidant capacity, and antimicrobial properties of peppers (red, yellow, and green (Capsicum annum L.)). Evid. Based Complement. Altern. Med. 2022, 2022, 7372101. [Google Scholar] [CrossRef]
  26. Otunola, G.A.; Afolayan, A.J. Evaluation of the polyphenolic contents and antioxidant properties of aqueous extracts of garlic, ginger, cayenne pepper and their mixture. J. Appl. Bot. Food Qual. 2013, 86, 66–70. [Google Scholar]
  27. Thuphairo, K.; Sornchan, P.; Suttisansanee, U. Bioactive compounds, antioxidant activity and inhibition of key enzymes relevant to Alzheimer’s disease from sweet pepper (Capsicum annuum) extracts. Prev. Nutr. Food Sci. 2019, 24, 327–337. [Google Scholar] [CrossRef]
  28. Razola-Díaz, M.d.C.; Gómez-Caravaca, A.M.; López de Andrés, J.; Voltes-Martínez, A.; Zamora, A.; Pérez-Molina, G.M.; Castro, D.J.; Marchal, J.A.; Verardo, V. Evaluation of Phenolic Compounds and Pigments Content in Yellow Bell Pepper Wastes. Antioxidants 2022, 11, 557. [Google Scholar] [CrossRef]
  29. Vega-Gálvez, A.; Di Scala, K.; Rodríguez, K.; Lemus-Mondaca, R.; Miranda, M.; López, J.; Perez-Won, M. Effect of air-drying temperature on physico-chemical properties, antioxidant capacity, colour and total phenolic content of red pepper (Capsicum annuum, L. var. Hungarian). Food Chem. 2009, 117, 647–653. [Google Scholar] [CrossRef]
  30. Kaur, R.; Kaur, K. Preservation of sweet pepper purees: Effect on chemical, bioactive and microbial quality. J. Food Sci. Technol. 2021, 58, 3655–3660. [Google Scholar] [CrossRef] [PubMed]
  31. Leng, Z.; Zhong, B.; Wu, H.; Liu, Z.; Rauf, A.; Bawazeer, S.; Rasul Suleria, H.A. Identification of Phenolic Compounds in Australian-Grown Bell Peppers by Liquid Chromatography Coupled with Electrospray Ionization-Quadrupole-Time-of-Flight-Mass Spectrometry and Estimation of Their Antioxidant Potential. ACS Omega 2022, 7, 4563–4576. [Google Scholar] [CrossRef] [PubMed]
  32. Guiné, R.; Barroca, M. Effect of Drying on the Textural Attributes of Bell Pepper and Pumpkin. Dry Technol. 2011, 29, 1911–1919. [Google Scholar] [CrossRef]
  33. Tvrzník, P.; Jeřábek, T.; Kráčmar, S.; Fišera, M. Changes in phenolic content in ground red pepper (Capsicum annuum L.) during storage. J. Microbiol. Biotechnol. Food Sci. 2019, 9, 345–348. [Google Scholar]
  34. Wang, H.; Wang, J.; Qiu, C.; Ye, Y.; Guo, X.; Chen, G.; Li, T.; Wang, Y.; Fu, X.; Liu, R.H. Comparison of phytochemical profiles and health benefits in fiber and oil flaxseeds (Linum usitatissimum L.). Food Chem. 2017, 214, 227–233. [Google Scholar] [CrossRef]
  35. Hamed, M.; Kalita, D.; Bartolo, M.E.; Jayanty, S.S. Capsaicinoids, Polyphenols and Antioxidant Activities of Capsicum annuum: Comparative Study of the Effect of Ripening Stage and Cooking Methods. Antioxidants 2019, 8, 364. [Google Scholar] [CrossRef] [Green Version]
  36. Rahim, R.; Mat, I. Phytochemical contents of Capsicum frutescens (Chili Padi), Capsicum annum (Chili Pepper) and Capsicum annum (Bell Peper) aqueous extracts. Int. Conf. Biol. Life Sci. 2012, 40, 164–167. [Google Scholar]
  37. Lahbib, K.; Dabbou, S.; Bok, S.E.; Pandino, G.; Lombardo, S.; Gazzah, M.E. Variation of biochemical and antioxidant activity with respect to the part of Capsicum annuum fruit from Tunisian autochthonous cultivars. Ind. Crops Prod. 2017, 104, 164–170. [Google Scholar] [CrossRef]
  38. Kavitha, S.; Parimalavalli, R. Effect of processing methods on proximate composition of cereal and legume flours. J. Nutr. Food Sci. 2014, 2, 1051. [Google Scholar]
  39. Hu, H.; Li, Y.; Zhang, L.; Tu, H.; Wang, X.; Ren, L.; Dai, S.; Wang, L. Use of Tremella as Fat Substitute for the Enhancement of Physicochemical and Sensory Profiles of Pork Sausage. Foods 2021, 10, 2167. [Google Scholar] [CrossRef]
  40. Akwetey, W.Y.; Dorleku, J.B.; Yeboah, E. Nutritional and sensory properties of smoked pork sausage produced with pig stomach as filler-meat. Int. J. Agric. Res. Innov. Technol. 2022, 12, 67–71. [Google Scholar] [CrossRef]
  41. Amanfo, D.O.; Adzitey, F.; Teye, G.A. The Effect of ‘prekese’ (Tetrapleura tetraptera) pod extract processed at different time intervals on the sensory qualities of pork sausage. Ghana J. Sci. Technol. Dev. 2015, 2, 54–58. [Google Scholar]
  42. Luz, M.; Alzate, T.; Duban, G.; Hincapié, S.; Blanca, L.; Cardona, S.; Londoño-Londoño, J.; Jiménez-Cartagena, C. The profile of bioactive substances in ten vegetable and fruit by-products from a food supply chain in Colombia. Sustain. Prod. Consum. 2017, 9, 37–43. [Google Scholar]
  43. Sam, F.E.; Ma, T.-Z.; Atuna, R.A.; Salifu, R.; Nubalanaan, B.-A.; Amagloh, F.K.; Han, S.-Y. Physicochemical, Oxidative Stability and Sensory Properties of Frankfurter-Type Sausage as Influenced by the Addition of Carrot (Daucus carota) Paste. Foods 2021, 10, 3032. [Google Scholar] [CrossRef]
  44. Nath, P.; Kale, S.J.; Kaur, C.; Chauhan, O.P. Phytonutrient composition, antioxidant activity and acceptability of muffins incorporated with red capsicum pomace powder. J. Food Sci. Technol. 2018, 55, 2208–2219. [Google Scholar] [CrossRef]
  45. Reddy, M.N.K.; Kumar, M.S.; Reddy, G.B.; Reddy, N.A.; Rao, V.K. Quality evaluation of turkey meat sausages incorporated with ground carrot. Pharma Innov. J. 2018, 7, 773–777. [Google Scholar]
  46. Font-i-Furnols, M.; Čandek-Potokar, M.; Maltin, C.; Prevolnik Povše, M. A Handbook of Reference Methods for Meat Quality Assessment; European Cooperation in Science and Technology (COST): Brussels, Belgium, 2015. [Google Scholar]
  47. Ahmad, S.; Jafarzadeh, S.; Ariffin, F.; Zainul Abidin, S. Evaluation of Physicochemical, Antioxidant and Antimicrobial Properties of Chicken Sausage Incorporated with Different Vegetables. Ital. J. Food Sci. 2020, 32, 75–90. [Google Scholar]
  48. Aaslyng, M.D.; Vestergaard, C.; Koch, A.G. The effect of salt reduction on sensory quality and microbial growth in hotdog sausages, bacon, ham and salami. Meat Sci. 2014, 96, 47–55. [Google Scholar] [CrossRef]
  49. Romero, M.C.; Romero, A.M.; Doval, M.M.; Judis, M.A. Nutritional value and fatty acid composition of some traditional Argentinean meat sausages. Food Sci. Technol. 2013, 33, 161–166. [Google Scholar] [CrossRef] [Green Version]
  50. Gotoh, N.; Wada, S. The importance of peroxide value in assessing food quality and food safety. JAOCS J. Am. Oil Chem. Soc. 2006, 83, 473. [Google Scholar] [CrossRef]
  51. Aguirrezábal, M.M.; Mateo, J.; Domınguez, M.C.; Zumalacárregui, J.M. The effect of paprika, garlic and salt on rancidity in dry sausages. Meat Sci. 2000, 54, 77–81. [Google Scholar] [CrossRef]
  52. Ghimire, A.; Paudel, N.; Poudel, R. Effect of pomegranate peel extract on the storage stability of ground buffalo (Bubalus bubalis) meat. LWT 2022, 154, 112690. [Google Scholar] [CrossRef]
  53. Skiera, C.; Steliopoulos, P.; Kuballa, T.; Holzgrabe, U.; Diehl, B. 1H NMR approach as an alternative to the classical p-anisidine value method. Eur. Food Res. Technol. 2012, 235, 1101–1105. [Google Scholar] [CrossRef]
  54. Cagdas, E.; Kumcuoglu, S. Effect of grape seed powder on oxidative stability of precooked chicken nuggets during frozen storage. J. Food Sci. Technol. 2015, 52, 2918–2925. [Google Scholar] [CrossRef] [PubMed] [Green Version]
  55. Rasinska, E.; Rutkowska, J.; Czarniecka-Skubina, E.; Tambor, K. Effects of cooking methods on changes in fatty acids contents, lipid oxidation and volatile compounds of rabbit meat. LWT—Food Sci. Technol. 2019, 110, 64–70. [Google Scholar] [CrossRef]
  56. Domínguez, R.; Pateiro, M.; Gagaoua, M.; Barba, F.J.; Zhang, W.; Lorenzo, J.M. A Comprehensive Review on Lipid Oxidation in Meat and Meat Products. Antioxidants 2019, 8, 429. [Google Scholar] [CrossRef] [PubMed] [Green Version]
  57. Nacak, B.; Kavuşan, H.S.; Serdaroğlu, M. Effect of α-tocopherol, rosemary extract and their combination on lipid and protein oxidation in beef sausages. IOP Conf. Ser. Earth Environ. Sci. 2021, 854, 012062. [Google Scholar] [CrossRef]
  58. Chouliara, E.; Badeka, A.; Savvaidis, I.; Kontominas, M. Combined effect of irradiation and modified atmosphere packaging on shelf-life extension of chicken breast meat: Microbiological, chemical and sensory changes. Eur. Food Res. Technol. 2008, 226, 877–888. [Google Scholar] [CrossRef]
  59. Martínez, L.; Cilla, I.; Antonio Beltrán, J.; Roncalés, P. Effect of Capsicum annuum (red sweet and cayenne) and Piper nigrum (black and white) pepper powders on the shelf life of fresh pork sausages packaged in modified atmosphere. J. Food Sci. 2006, 71, S48–S53. [Google Scholar] [CrossRef]
  60. Cabral, N.D.O.; Oliveira, R.F.D.; Henry, F.D.C.; Oliveira, D.B.D.; Junior, S.; Junior, M.; Martins, M.L.L. Effect of the fruit aqueous extract of balloon pepper (Capsicum baccatum var. Pendulum) on lipid oxidation, microbiological quality and consumer acceptance of fresh pork sausage and smoked. Food Sci. Technol. 2021, 42, 1–8. [Google Scholar] [CrossRef]
Figure 1. Total phenolic content (TPC) of yellow and red bell pepper pulp and processing by-products, fresh and after drying. The results are expressed as the average value of three determinations ± the standard deviation (SD) indicated by the error bars. According to t-test, the different letters (a–e) represent the significant differences (p < 0.05) between the values represented in the columns.
Applsci 12 12421 g001
Figure 2. Total flavonoid content (TPC) of yellow and red bell pepper pulp and processing by-products, fresh and after drying. Results are expressed as the mean value of three determinations ± standard deviation (SD) indicated by the error bars. According to the t-test, different letters (a–e) represent significant differences (p < 0.05) between the values represented in the columns.
Applsci 12 12421 g002
Figure 3. DPPH inhibition (%) of yellow and red bell pepper pulp and processing by-products, fresh and after drying. Results are expressed as the mean value of three determinations ± standard deviation (SD) indicated by the error bars. According to the t-test, different letters (a–g) represent significant differences (p < 0.05) between the values represented in the columns.
Applsci 12 12421 g003
Figure 4. Ferric reducing antioxidant power of yellow and red bell pepper pulp and processing by-products, fresh and after drying. Results are expressed as the mean value of three determinations ± standard deviation (SD) indicated by the error bars. According to the t-test, different letters (a–f) represent significant differences (p < 0.05) between the values represented in the columns.
Applsci 12 12421 g004
Figure 5. Effect of supplementing sausage formulas with dried bell pepper processing by-products on TOTOX value during storage.
Applsci 12 12421 g005
Figure 6. Effect of supplementing sausage formulas with bell pepper processing by-products on TBA value during 20 days of storage. Results represent the mean value of three independent analyses ± SD indicated by the error bars. a–m t-test was used to compare significant differences between the values obtained for sausage formulas (both control and sausage samples supplemented with different doses of dried bell pepper processing by-products); data from the same day of analysis showing different exponents show significant differences (p < 0.05).
Applsci 12 12421 g006
Table 1. The recipes used to obtain sausage formulas.
SamplePork Meat (g)Pork FAT (g)Salt (g)Salt + 0.5% (w/w) Sodium Nitrite (g)Sweet Paprika (g)Garlic (g)White Pepper (g)Black Pepper (g)DRBPB (g) *DYBPB (g) *Thermal Treatments Applied
SmokingDryingScalding
SC80020018-61622-----
SDC80020018-61622--++-
SDCN800200-1861622--++-
SSC80020018-61622--+-+
SSCN800200-1861622--+-+
DSDRBPB5080020018-616224.596-++-
DSDRBPB9080020018-616228.274-++-
DSDRBPB18080020018-6162216.547-++-
DSDRBPB27080020018-6162224.821-++-
SSDRBPB5080020018-616224.596-+-+
SSDRBPB9080020018-616228.274-+-+
SSDRBPB18080020018-6162216.547-+-+
SSDRBPB27080020018-6162224.821-+-+
DSDYBPB5080020018-61622-5.811++-
DSDYBPB9080020018-61622-10.460++-
DSDYBPB18080020018-61622-20.920++-
DSDYBPB27080020018-61622-31.380++-
SSDYBPB5080020018-61622-5.811+-+
SSDYBPB9080020018-61622-10.460+-+
SSDYBPB18080020018-61622-20.920+-+
SSDYBPB27080020018-61622-31.380+-+
* The quantities of DRBPB and DYBPB used provide 50, 90, 180 and 270 mg GAE/kg working meat. (+) indicate the application of the treatment; (-) indicates the non-application of the treatment.
Table 2. Polyphenolic compounds content of red and yellow bell pepper pulp and processing by-products, fresh and after drying.
Polyphenolic CompoundRT (Min) Compound Content (µg/g d.s)
YBPPRBPPYBPBRBPBDYBPPDRBPPDYBPBDRBPB
Gallic acid5.694123.240 ± 4.872 a87.245 ± 3.132 c95.754 ± 4.547 a82.548 ± 3.945 d81.648 ± 3.908 d75.546 ± 3.547 e57.431 ± 2.057 g68.458 ± 2.878 f
Protocatechuic acid12.631116.248 ± 4.471 b128.015 ± 4.751 a88.248 ± 3.871 b90.846 ± 4.051 c75.057 ± 2.887 f80.153 ± 3.887 e65.426 ± 2.119 g73.546 ± 3.015 f
Caffeic acid18.7471.426 ± 0.032 b1.796 ± 0.089 a1.079 ± 0.020 b0.880 ± 0.026 c0.582 ± 0.025 e0.698 ± 0.028 d0.187 ± 0.005 g0.335 ± 0.018 f
Epicatechin23.4173.334 ± 0.124 a3.242 ± 0.144 a2.469 ± 0.109 a2.246 ± 0.088 b1.419 ± 0.066 e1.663 ± 0.072 d0.755 ± 0.016 g1.155 ± 0.057 f
p-Coumaric acid24.95216.468 ± 0.750 b19.248 ± 0.922 a12.461 ± 0.405 b14.731 ± 0.682 d10.168 ± 0.355 f11.257 ± 0.425 e8.042 ± 0.255 h9.785 ± 0.308 g
Ferulic acid23.52112.452 ± 0.411 b15.793 ± 0.556 a8.996± 0.299 b9.138 ± 0.332 c6.640 ± 0.197 f7.132 ± 0.212 e2.557 ± 0.077 h4.789 ± 0.155 g
Rutin25.8371.588 ± 0.078 b2.057 ± 0.188 a1.334 ± 0.066 b1.225 ± 0.045 c0.881 ± 0.019 e1.005 ± 0.032 d0.567 ± 0.011 g0.698 ± 0.015 f
Rosmarinic acid28.6312.064 ± 0.080 c4.601 ± 0.190 a1.552 ± 0.050 c2.518 ± 0.081 b0.996 ± 0.033 e1.335 ± 0.051 d0.505 ± 0.015 f0.555 ± 0.017 f
Resveratrol29.2000.825 ± 0.079 a0.769 ± 0.03 a0.619 ± 0.022 a0.443 ± 0.015 b0.265 ± 0.007 c0.258 ± 0.005 c0.187 ± 0.003 0.199 ± 0.004 d
Quercetin31.871118.243 ± 3.567 b135.852 ± 5.276 a95.647 ± 2.983 b92.057 ± 2.511 c73.372 ± 2.578 f80.456 ± 3.995 e55.450 ± 1.755 h59.943 ± 1.988 g
Kaempferol34.64426.088 ± 1.224 a25.076 ± 1.256 b19.472 ± 1.607 a17.248 ± 1.444 d15.468 ± 1.106 e13.546 ± 1.006 f8.164 ± 0.750 h10.058 ± 0.890 g
The results represent the mean of three determinations ± standard deviation (SD). Different letters (a–h) on the same row represent statistically significant differences (p < 0.05) recorded using a t-test.
Table 3. Proximate composition of sausage formulas.
SampleChemical Parameters
Moisture
(g/100 g)
Protein
(g/100 g)
Lipids
(g/100 g)
Ash
(g/100 g)
Chloride Content
(g/100 g)
Carbohydrates (g/100 g)Energy Value (kcal/100 g)
SC49.583 ± 1.546 a19.550 ± 0.361 a25.462 ± 0.754 e,f2.390 ± 0.050 h2.110 ± 0.048 a,b0.905310.979
SDC47.982 ± 1.325 c19.580 ± 0.379 a26.483 ± 0.768 a2.380 ± 0.050 h2.180 ± 0.049 a1.395322.247
SDCN47.872 ± 1.321 c,d19.490 ± 0.352 a,b26.462 ± 0.759 a2.360 ± 0.049 h2.160 ± 0.049 a1.656322.742
SSC48.869 ± 1.487 b19.370 ± 0.344 a,b,c26.115 ± 0.744 b2.450 ± 0.057 h2.120 ± 0.048 a,b1.076316.818
SSCN48.459 ± 1.477 b19.420 ± 0.358 a,b,c26.082 ± 0.731 b2.410 ± 0.051 h2.140 ± 0.047 a,b1.489318.374
DSDYBPB5047.872 ± 1.269 c,d19.090 ± 0.305 d,e25.547 ± 0.699 d,e2.457 ± 0.053 g,h2.100 ± 0.047 a,b2.934318.019
DSDYBPB9047.452 ± 1.289 d,e,f,g18.930 ± 0.311 d,e,f25.334 ± 0.692 e,f,g2.664 ± 0.061 e2.150 ± 0.050 a,b3.470317.606
DSDYBPB18047.023 ± 1.275 g,h18.870 ± 0.365 e,f25.113 ± 0.685 f,g2.877 ± 0.068 d2.120 ± 0.049 a,b3.997317.485
DSDYBPB27046.882 ± 1.166 h18.750 ± 0.391 e,f25.049 ± 0.654 f,g2.998 ± 0.076 b,c2.130 ± 0.048 a,b4.191317.205
SSDYBPB5047.697 ± 1.348 c,d,e19.110 ± 0.358 d,e25.504 ± 0.703 d,e,f2.504 ± 0.055 e,f2.180 ± 0.050 a3.005317.996
SSDYBPB9047.489 ± 1.336 c,d,e,f,g18.990 ± 0.322 d,e25.338 ± 0.697 e,f,g2.704 ± 0.065 d2.170 ± 0.049 a3.309317.238
SSDYBPB18047.195 ± 1.329 f,g,h18.780 ± 0.368 e,f25.079 ± 0.682 f,g2.908 ± 0.075 c,d2.140 ± 0.048 a,b3.898316.423
SSDYBPB27046.996 ± 1.274 g,h18.690 ± 0.381 f24.896 ± 0.675 g3.125 ± 0.076 a2.160 ± 0.049 a4.133315.356
DSDRBPB5047.542 ± 1.248 c,d,e,f19.150 ± 0.361 b,c,d25.848 ± 0.709 b,c2.541 ± 0.060 f,g2.110 ± 0.048 a,b2.809320.468
DSDRBPB9047.348 ± 1.267 e,f,g,h19.080 ± 0.375 d,e25.765 ± 0.711 c,d2.679 ± 0.065 e2.100 ± 0.046 a,b3.028320.317
DSDRBPB18047.227 ± 1.164 e,f,g,h18.910 ± 0.385 d,e,f25.548 ± 0.707 c,d,e2.887 ± 0.069 d2.090 ± 0.045 a,b3.338318.924
DSDRBPB27047.109 ± 1.174 f,g,h18.760 ± 0.388 e,f25.467 ± 0.698 d,e,f3.045 ± 0.075 a,b2.140 ± 0.048 a,b3.479318.159
SSDRBPB5047.562 ± 1.096 c,d,e,f19.260 ± 0.399 b,c,d25.664 ± 0.709 c,d2.558 ± 0.059 f2.110 ± 0.048 a,b2.846319.400
SSDRBPB9047.449 ± 0.997 d,e,f,g19.180 ± 0.325 c,d25.497 ± 0.701 d,e,f2.689 ± 0.062 e2.130 ± 0.049 a,b3.055318.413
SSDRBPB18047.389 ± 1.317 d,e,f,g19.040 ± 0.314 d,e25.324 ± 0.691 e,f,g2.897 ± 0.067 d2.080 ± 0.047 a,b3.270317.156
SSDRBPB27047.205 ± 1.254 e,f,g,h18.870 ± 0.379 e,f25.207 ± 0.685 f,g3.112 ± 0.077 a2.050 ± 0.042 b3.556316.567
Results are expressed as the mean value of three independent standard deviations (SD) analyses. a–h t-test was used to compare significant differences between the values obtained for sausage formulas (both control and sausage samples supplemented with different doses of dried by-products); data in the same column showing different exponents show significant differences (p < 0.05).
Table 4. The effect of supplementing sausage formulas with bell pepper processing by-products on peroxide value (PV) during 20 days of storage.
SamplePV (meq O2/kg)
Day 1Day 10Day 20
SC2.040 ± 0.042 a3.157 ± 0.050 a5.087 ± 0.070 a
SDC1.854 ± 0.041 b2.867 ± 0.048 b4.847 ± 0.065 b
SDCN0.495 ± 0.010 h,i1.345 ± 0.022 j,k2.873 ± 0.050 i,j
SSC1.790 ± 0.042 b,c2.664 ± 0.045 c4.437 ± 0.064 c,d
SSCN0.406 ± 0.010 i,j1.228 ± 0.030 k2.547 ± 0.045 k
DSDYBPB501.624 ± 0.035 c2.113 ± 0.044 d4.773 ± 0.060 b
900.755 ± 0.018 f,g1.906 ± 0.041 d,e3.546 ± 0.058 f
1800.559 ± 0.011 h,i1.631 ± 0.040 g,h3.156 ± 0.055 h
2700.429 ± 0.010 i,j1.304 ± 0.030 j,k2.964 ± 0.053 i
SSDYBPB501.357 ± 0.030 d2.067 ±0.042 d4.534 ± 0.060 c
900.616 ± 0.013 g,h1.885 ± 0.041 e,f3.449 ± 0.058 f,g
1800.486 ± 0.014 i,j1.558 ± 0.040 h,i2.973 ± 0.052 i
2700.327 ± 0.010 j,k1.025 ± 0.038 l2.482 ± 0.051 k
DSDRBPB501.114 ± 0.042 e1.998 ± 0.045 d,e4.367 ± 0.054 d
900.595 ± 0.011 h,i1.746 ± 0.037 f,g3.335 ± 0.051 g
1800.473 ± 0.012 i,j1.476 ± 0.035 I,j2.816 ± 0.050 i,j
2700.308 ± 0.010 j,k1.076 ± 0.030 l2.254 ± 0.048 l
SSDRBPB500.822 ± 0.014 f1.824 ± 0.040 e,f4.138 ± 0.054 e
900.507 ± 0.010 h,i1.665 ± 0.034 g,h2.996 ± 0.050 h,i
1800.399 ± 0.009 j1.329 ± 0.032 j,k2.594 ± 0.045 k
2700.257 ± 0.008 k0.826 ± 0.030 m2.046 ± 0.040 m
Results represent the mean value of three independent analyses ± SD indicated by error bars. a–m t-test was used to compare significant differences between values obtained for sausage formulas (both control and sausage samples supplemented with different doses of dried bell pepper processing by-products); data from the same day of analysis showing different exponents show significant differences (p < 0.05).
Table 5. The effect of supplementing sausage formulas with bell pepper processing by-products on p-anisidine value (p-AV) during 20 days of storage.
Samplep-AV
Day 1Day 10Day 20
SC2.211 ± 0.052 a2.635 ± 0.061 a4.268 ± 0.101 a
SDC1.923 ± 0.044 b2.164 ± 0.050 b3.986 ± 0.095 b
SDCN0.389 ± 0.010 h,i0.776 ± 0.018 h1.587 ± 0.037 h
SSC1.706 ± 0.040 c1.993 ± 0.046 b,c2.546 ± 0.062 c
SSCN0.308 ± 0.008 i,j0.478 ± 0.010 i,j1.116 ± 0.025 k
DSDYBPB501.583 ± 0.036 d1.857 ± 0.043 c,d2.225 ± 0.052 d
900.832 ± 0.018 g1.267 ± 0.029 f1.887 ± 0.047 f
1800.415 ± 0.011 h0.881 ± 0.020 h1.642 ± 0.026 g,h
2700.249 ± 0.005 j,k0.444 ± 0.010 i,j1.289 ± 0.031 j,k
SSDYBPB501.456 ± 0.032 d1.786 ± 0.042 d2.115 ± 0.049 d,e
900.877 ± 0.019 g1.312 ± 0.029 f1.695 ± 0.039 g,h
1800.321 ± 0.010 i,j0.745 ± 0.017 h1.532 ± 0.025 h
2700.115 ± 0.004 k0.586 ± 0.013 i1.114 ± 0.025 k
DSDRBPB501.300 ± 0.029 e1.740 ± 0.041 d2.054 ± 0.047 e
900.735 ± 0.016 g1.227 ± 0.027 f1.555 ± 0.035 h
1800.368 ± 0.007 i0.598 ± 0.015 j1.401 ± 0.035 i
2700.140 ± 0.003 k0.321 ± 0.008 k0.774 ± 0.018 l
SSDRBPB501.082 ± 0.024 f1.518 ± 0.035 e1.711 ± 0.040 f,g
900.487 ± 0.010 h1.100 ± 0.024 g1.365 ± 0.030 i,j
1800.211 ± 0.005 j,k0.385 ± 0.010 j,k1.125 ± 0.025 k
2700.083 ± 0.002 l0.245 ± 0.005 k0.678 ± 0.015 l
Results represent the mean value of three independent analyses ± SD indicated by error bars. a–l t-test was used to compare significant differences between values obtained for sausage formulas (both control and sausage samples supplemented with different doses of dried bell pepper processing by-products); data from the same day of analysis showing different exponents show significant differences (p < 0.05).
Publisher’s Note: MDPI stays neutral with regard to jurisdictional claims in published maps and institutional affiliations.

