Article

Comparison of Lipid Profile and Oxidative Stability of Vacuum-Packed and Longtime-Frozen Fallow Deer, Wild Boar, and Pig Meat

1
Department of Food Hygiene, Technology and Safety, University of Veterinary Medicine and Pharmacy in Košice, 041 81 Košice, Slovakia
2
Department of Chemistry, Biochemistry and Biophysics, University of Veterinary Medicine and Pharmacy in Košice, 041 81 Košice, Slovakia
3
Institute of Biotechnology, Faculty of Chemical and Food Technology, Slovak University of Technology, Radlinského 9, 812 37 Bratislava, Slovakia
*
Author to whom correspondence should be addressed.
Appl. Sci. 2023, 13(6), 4059; https://doi.org/10.3390/app13064059
Submission received: 24 January 2023 / Revised: 15 March 2023 / Accepted: 15 March 2023 / Published: 22 March 2023

Abstract

:
The present study aimed to evaluate the lipid content and oxidation of fallow deer (FD), wild boar (WB), and pig meat (PM) at −18 °C for a 360-day storage period. The lowest fat content was observed in thigh meat (TM) of FD (2.53%; p ˂ 0.05). The ratio of polyunsaturated/saturated fatty acids (PUFA/SFA), n-6/n-3, hypocholesterolemic/hypercholesterolemic index (h/H), and the lipid nutritional quality indexes were calculated. The PUFA/SFA ratio of each meat sample was compared with the required value of more than 0.4 while the optimal n-6/n-3 ratio was determined only in shoulder meat (SM) of FD meat samples (3.94; p ˂ 0.001). An atherogenic index of lower than 1.0 was observed in each meat sample and a thrombogenic index of lower than 0.5 was observed only in TM of FD (0.53; p ˂ 0.001). During the storage period, the malondialdehyde (MDA) content of WB and PM samples showed a higher variability than the FD samples. On the initial day as well as on the 360th day of the storage period, the lowest MDA content in the loin of PM was measured. Long-term vacuum packaging resulted in lower lipid oxidation during meat storage (p ˂ 0.01); however, the duration of the storage period significantly affected the level of lipid oxidation (p ˂ 0.001).

1. Introduction

Lipids belong among one of the main qualitative meat variables responsible for qualitative and sensory characteristics, respectively. Sensory characteristics of meat such as softness and juiciness are very important in the evaluation of the flavor and aroma profile of meat [1].
From an evolutionary perspective, it has been determined that eating venison and other game meat is good for human health. As a result, the demand for and popularity of game meat and venison from deer species have recently increased [2]. Red meat has a long history of being recognized as a significant dietary source of key nutrients and proteins; however, new research suggests that consuming red meat may increase the chance of developing colon cancer and cardiovascular diseases [3].
The quality and origin of beef meat are now more widely known to the modern consumer. Meat from fallow deer can satisfy consumer demand which is mainly aimed at achieving and maintaining a healthy diet and lifestyle. Venison is a type of deer meat that is distinguished by having a high level of proteins and minerals whilst on the contrary, a low content of fat (which is typically not intramuscular fat) and a low content of cholesterol [4]. Game meat has a lower energetic value ranging from 90 to 110 kcal/100 g when compared to beef, pork, mutton, or poultry meat which contain energetic values ranging from 114 to 231 kcal/100 g of muscle tissue [5]. In human nutrition, fallow deer meat has a beneficial fatty acid profile [6] with increased concentration of n-3 polyunsaturated fatty acids (PUFA) than venison from other deer species [7]. Meat from farm-raised fallow deer is also an excellent source of iron and copper, and because of this, it has the potential to be suggested as a component of a healthy diet [8].
During the last decades, pork has been the most popular type of meat consumed in western countries. However, there is a growing tendency to purchase meat from European wild boars (Sus scrofa scrofa) in addition to meat from domestic pigs (Sus scrofa domesticus) due to the general fact that game meat is leaner and, consequently, healthier than meat from domesticated animal species [9].
Wild boars have fatter carcasses, larger loin regions, more slow-twitch oxidative and fast-twitch oxidative glycolytic muscle fibers, fewer fast-twitch glycolytic muscle fibers and darker, less tender, and leaner meat when compared to domestic pigs. The nutrition of animals may have an impact on the quality of the meat produced from wild boars and domestic pigs which may be positively or negatively rated by consumers after cooking the meat. When a higher proportion of lipids undergo oxidation, the fatty acid content and overall meat shelf-life may be significantly impacted [10].
Due to the high number of unsaturated phospholipids and pro-oxidant iron ions in myoglobin, the lipids in game meat might have the tendency to oxidize faster. Therefore, game meat should be kept in an oxygen-deficient container [11]. The most common way to distribute venison is in vacuum packages. Vacuum packaging extends the shelf life of meat together with freezing. Additionally, the process of tenderization and flavor development also occurs within vacuum packages. Venison can be frozen to extend its shelf life and make it more accessible to nearby and far-off markets [12]. Since freezing causes only modest and acceptable changes in meat quality and, therefore, successfully preserves meat for long-term storage, it is a widely utilized method of meat preservation. The majority of meat manufacturing and distribution businesses utilize it, as do customers who frequently buy more meat than they can eat at once and store the extra in their freezers [11].
The color and preservation of meat during storage can be effectively enhanced by selecting the proper packaging and storage methods [13]. Fresh meat could be packaged using vacuum packing, modified atmosphere packaging (MAP), or air-permeable packaging [14]. Vacuum and modified conditions of packaging offer longer meat shelf life; however, air-permeable packaging is most frequently used for raw, cold red meat [15]. Vacuum packaging creates anaerobic conditions that increase the meat’s oxidative and microbiological shelf life [16]. Packaging either with high levels of oxygen or low levels of oxygen are two different types of MAP, especially with oxygen combined with nitrogen or carbon dioxide. Compared to MAP with a high oxygen content (70–80%), vacuum packaging offers the advantages of less lipid oxidation and improved pigment stability [17].
MDA has been determined in meat samples of fallow deer [11,18], in minced products of fresh and frozen/thawed fallow deer meat [19], foal meat [20,21], pork [17,22], wild boar meat [21,23,24], and ground beef meat [13] in previously published studies. Numerous factors such as the rate of freezing, the storage temperature, and temperature fluctuations all affect the quality of frozen meat [25].
The present study was aimed to research the nutritional value of fallow deer meat, wild boar meat, and pork with special attention paid to the differences in the selected cuts of meat (loin, shoulder, and thigh meat) with the intention to evaluate the effect of long-term storage on the decomposition processes of lipids in samples packed under vacuum conditions.

2. Materials and Methods

2.1. Meat Samples

In this study, three animal species—fallow deer (FD), wild boars (WB), and pigs (PM)—were investigated. FD and WB originated from a breeding farm (Rozhanovce, Slovak Republic), and PM from the university farm (Košice, Slovak Republic). Each experimental group (FD, WB, and PM) was composed of six selected animals. They were slaughtered during the autumn–winter season. From each group (FD, WB, and PM), selected cuts were taken of the loin (LM; muscles longissimus dorsi), taken from between the 13th and 14th rib; shoulder meat (SM; muscles supraspinatus, muscles infraspinatus, muscles subscapularis, muscles triceps brachii); and thigh meat (TM; muscles semimembranosus).
On the initial day of this experiment, the meat samples (n = 54) were stored at a temperature of 4 ± 2 °C until the meat quality analysis (fatty acid profile, physicochemical analysis and lipid oxidation determination) was made. Subsequently, the meat samples (n = 216) with an approximate weight of 100 g were vacuum-packed for long-term storage. The samples were packed under vacuum conditions in plastic bags (polyethylene, thickness 70 µm, G-PACK, LLC., Slovak Republic) using the Boss Vacuum machine (NE 2746 N, Bad Homburg, Germany) and kept at freezing temperature of −18 ± 2 °C for 90, 180, 270, and 360 days until the determination of lipid oxidation.

2.2. Physicochemical Analysis

Meat samples were analyzed for their dry matter and lipid content according to standard methods [26]. The content of dry matter was determined by oven-drying to a constant weight at a temperature of 170 °C using the Universal Oven UN 110 (Memmert GmbH + Co. KG, Büchenbach, Germany). Lipids were isolated by petroleum ether in a Soxhlet apparatus (LTHS 500, Brnenská Druteva v.d., Brno, Czech Republic) and were determined gravimetrically. Triplicate measurements of the physicochemical analysis of each meat sample were performed.

2.3. Fatty Acid Analysis

In order to analyze the composition of fatty acids, they were turned into their methyl esters and separated via gas chromatography [27]. The parameters of gas chromatography analysis were set according to Gajdoš et al. [28]. The gas chromatograph (GC-6890 N, Agilent Technologies, Palo Alto, CA, USA) was equipped with a capillary column DB-23 (60 m × 0.25 mm, film thickness 0.25 μm, Agilent Technologies) and an FID detector (Agilent Technologies).
Identification and quantification were done according to Slaný et al. [29]. The ChemStation software B0103 (Agilent Technologies) was used to calculate the fatty acid concentration. The resulting values of each fatty acid in were presented as a mean of the triplicate measurements and were expressed as percentage of total fatty acid (%/total fatty acid).

2.4. Calculation of Lipid Nutritional Quality Indexes (IQN)

According to Ulbricht and Southgate [30], Fernandes et al. [31], Erickson et al. [32], and the Cardiovascular Review Group [33], the fatty acid profile was utilized to determine a number of nutritional variables regarding meat lipids. The polyunsaturated/saturated fatty acids ratio (PUFA/SFA; 1), n-6/n-3 PUFA ratio (n-6/n-3; 2), atherogenic index (AI; 3), thrombogenic index (TI; 4), peroxidability index (PI; 5), and hypocholesterolemic/hypercholesterolemic index (h/H; 6) were calculated according to the following formulas:
PUFA/SFA = (C18:2n-6 + C18:3n-3)/(C14:0 + C16:0 + C18:0)
n-6/n-3 [(∑n-6)/(∑n-3)]
AI = (C12:0 + 4 × C14:0 + C16:0)/(∑MUFA + ∑PUFA)
TI = (C14:0 + C16:0 + C18:0)/(0.5 × ∑MUFA) + (0.5 × ∑n-6 PUFA) + (3 × ∑n-3 PUFA) + (∑n-3 PUFA/∑n-6 PUFA)
PI = (monoenoicacid ∗ 0.025) + (dienoicacid ∗ 1) + (trienoicacid ∗ 2) + (tetraenoicacid ∗ 4) + (pentaenoicacid ∗ 6) + (hexaenoicacid ∗ 8)
h/H = [(C18:1n-9+C18:1n-7 + C18:2n-6 + C18:3n-6 + C18:3n-3 + C20:3n-6 + C20:4n-6 + C20:5n-3 + C22:4n-6 + C22:5n-3 + C22:6n-3)]/((C14:0 + C16:0))

2.5. Determination of Lipid Oxidation

Lipid decomposition changes were determined in individual experimental groups at the beginning of storage on the initial day of the experiment and then on the 90th, 180th, 270th, and 360th day of storage. The lipid oxidation processes were measured based on the rate of secondary damage to fats, conditioned by the oxidation of unsaturated fatty acids according to Marcinčák et al. [34]. Malondialdehyde (MDA), as a main product of secondary lipid oxidation, was determined by the spectrophotometric method as a complex with 2-thiobarbituric acid (MDA-TBA) at a wavelength of 532 nm by the spectrophotometer (Helios γ, Thermo spectronic, Cambridge, United Kingdom). The results were expressed as mg/MDA/kg per sample as an average value of three measurements per sample.

2.6. Statistical Evaluation

The results of all determined parameters presented in this study were expressed as the mean and standard deviation (SD) of measurements that were each replicated six times. The GraphPad Prism 8.3 (GraphPad Software, San Diego, CA, USA) and R-statistics 4.0.3 software [35] with “FactomineR” [36] and “factoextra” packages [37] were used for the analysis of the obtained data according to Pagès [38] and Semjon et al. [39]. One-way and multiway analysis of variance (ANOVA) with Tukey’s post hoc tests were used to express the significant differences between sample groups. MDA content was statistically investigated in experimental samples on the initial day of the experiment and, subsequently, on the 90th, 180th, 270th, and 360th day of storage in vacuum conditions at a temperature of −18 ± 2 °C. The effect of meat cuts, meat type, and storage were set as the main aspects of the multiple factor analysis (MFA). A statistical significance level of p < 0.05 was set prior to data analysis.

3. Results and Discussion

The results of the physicochemical determinations of loin, shoulder, and thigh meat samples are presented in Table 1. The loin and shoulder meat samples taken from FD, WB, and PM significantly differed in their fat content (p < 0.05). The highest fat content was observed in WB loin and shoulder meat as well as in PM thigh samples. The lowest fat content was detected in all meat samples of FD compared to the other types of meat. The fat content significantly differed in shoulder samples from the other types of meat (Table 1, p ˂ 0.001). However, in this current study, the fat content of the FD loin and shoulder meat samples were higher than those reported by Švrčula et al. [6] in both stag and doe farm-raised FD. The body weight and fat reserves of the wild boar and generally in all wild animals, depend on the nutrient composition of their diet. When the so-called “energetic cost of maintenance” is less than food intake measured in energy units, production or body growth and fat deposition can take place in wild ungulates [40].
Numerous studies have shown that the lipid composition of venison is related to the animal’s diet just like the lipid composition of meat from other ruminants and that an intensive production system including feeding with grain-based feed mixtures has a negative impact on the desirable fatty acid profile [41]. In the wild, animals naturally grow slowly when there is enough forage which results in lighter carcasses but with the production of meat of a higher quality [42].
Table 2 shows the results of the fatty acid profiles of the LM samples in FD, WB, and PM. The major SFA in all samples of wild boar meat and pig meat was palmitic acid (PA, C16:0), whereas in the samples of fallow deer meat, it was stearic acid (SA, C18:0) (p ˂ 0.001). The predominant MUFA in all the analyzed samples of meat was oleic acid (OA, C18:1). FD samples had significantly lower OA and MUFA percentages compared to the other types of meat (p ˂ 0.001). From the PUFAs, linoleic acid (LA, C18:2, n-6) was most represented in wild boar meat and pig meat, while in fallow deer meat, it was arachidonic acid (AA, C20:4, n-6). The samples of WB and PM had a higher percentage of OA (p ˂ 0.001) and a lower percentage of AAs than FD meat (p ˂ 0.001).
The highest n-3 PUFA proportion (6.44%), mainly, ALA, DPA, EPA, and DHA were represented in LM meat samples of FD. Regarding human nutrition, the increase of DPA, EPA, and DHA acids which are significantly higher compared to other types of dishes is significant.
Table 3 shows the results of the fatty acid profiles of the shoulder meat (SM) samples in FD, WB, and PM. SA was mainly represented in the SM of FD (22.67%, p ˂ 0.001). Meat samples of SM from WB and PM had a higher proportion of OA (p ˂ 0.01) and also a higher proportion of Ʃ MUFA (p ˂ 0.01) compared to FD. SM of FD had a significantly higher Ʃ SFA compared to WB and PM (p ˂ 0.05) and a higher level of Ʃ PUFA (p ˂ 0.05) compared to PM. SM of FD had the highest proportion of n-3 PUFA (ALA, DPA, EPA, and DHA) (p ˂ 0.001).
Table 4 shows the results of the fatty acid profile of the thigh meat samples of FD, WB, and PM. Out of all the SFAs, palmitic acid in PM (p ˂ 0.001) and stearic acid in FD meat samples (p ˂ 0.001) were determined as the highest. The lowest (oleic acid) was determined in the TM of FD while the TM of WB contained more than a 70% higher level of oleic acid (p ˂ 0.001). The TM meat samples of FD and WB had a comparable percentage of linoleic acid (C18:2, n-6) (p ˂ 0.01); however, the TM of FD had more than a 65% higher level of arachidonic acid (C20:4, n-6) compared to WB and PM samples (p ˂ 0.001). The TM of FD had the lowest Ʃ MUFA (p ˂ 0.001) and the highest Ʃ PUFA level (p ˂ 0.001) with a significantly higher level of n-3 PUFA (p ˂ 0.001).
The LM, SM, and TM of fallow deer are characterized by a high percentage of palmitic, stearic, linoleic, and arachidonic acid compared to the fatty acid composition stated in the literature regarding wild and farmed fallow deer [2,7,8,43]. Compared to the meat samples of wild boar and pork, fallow deer in this study showed 2-fold higher levels of stearic acid. Stearic acid is considered a healthier fatty acid compared to other SFAs and is associated with decreases in low- and high-density lipoprotein cholesterol concentrations when compared with palmitic acid [44]. Daszkiewicz et al. [11] determined that the percentage of stearic acid in fallow deer meat significantly differed between wild (17%) and farmed animals (25%) and their observations of stearic acid percentage are similar to our presented results.
Compared to wild boar and pig meat, fallow deer meat was characterized by a high representation of n-3 PUFA, especially EPA, DPA, and DHA. Practically all organisms need n-3 PUFAs for growth, development, and survival [45]. DHA is essential for the growth and operation of the brain and eyes. EPA and DHA have a variety of physiological activities that are connected to various health and clinical advantages, especially in relation to cardiovascular disease, cancer, inflammation, and neurocognitive function [46]. Most often, a person receives them in the diet by consuming fish (herrings, salmon, mackerels) and other marine products or by their use in the administration of medicinal formulations or dietary supplements [47]. Since the consumption of n-3 PUFA in human diets is low, the consumption of fallow deer meat could help to make up for this deficit.
Desaturation, chain elongation, and peroxisomal beta-oxidation, which are all mediated by the enzymes δ-6 and δ-5 desaturase, chain elongation enzymes (elongases), and oxidase, can also be used to convert ALA to DHA and produce EPA and DHA. However, only a very small percentage of ALA in humans is converted to DHA. DHA is also referred to as a conditionally necessary fatty acid since vegetarians convert DHA at a rate of 3–8%, whereas omnivores convert it at a rate of just 1–3% [48]. In our experiment, the proportion of ALA in fallow deer meat was several times higher than in wild boar meat and pig meat.
The similarity of the fatty acid composition in wild boar and pig meat can be explained by their species’ similarity. To differentiate between domestic and wild pig muscle tissues in meals requires a distinction at the subspecies level which is more difficult. Due to the strong homology between the domestic and wild pig genomes, there are extremely few subspecies-specific bases [9].
The nutritional value of meat depends on animal species, sex, age, and feeding management as well as the anatomical site. For health reasons, the ratio of PUFA to SFA in meat is more significant than the amount of total fat present [41]. Table 5 shows the lipid nutritional quality index for meat samples. All the meat samples analyzed have the ratio of PUFA to SFA in accordance with the recommended value (>0.4). Because they may cause blood cholesterol levels to rise, foods with polyunsaturated and saturated fatty acid ratios below 0.45 have been deemed unsuitable for human consumption [31]. In the LM, P/S ratios ranged from 0.51 in fallow deer to 0.97 in wild boars; in the SM, from 0.49 in fallow deer to 0.99 in wild boars; and in the TM, from 0.61 in pork to 1.04 in wild boars.
A risk factor for cancer and coronary heart disease, particularly the development of blood clots that result in heart attacks, is the ratio of n-6/n-3 PUFA. Again, certain meats have ratios higher than this, which is why less than 4.0 is advised [49]. The PUFA n-6/n-3 ratio in FD meat which ranges from 3.94 to 5.58 is close to the suggested values, indicating that these species may be considered good for promoting human health. With the exception of SM from fallow deer, which had an n-6/n-3 ratio of 3.94, all types of meat in the current investigation had a higher value than 4.0.
If the large proportion of Ʃ PUFA is out of balance with the Ʃ PUFA n-6/n-3 ratio, it may not necessarily be good. Meat from animals that have consumed grass and have high amounts of a C 18:3 n-3 has a favorable Ʃ PUFA n-6/n-3 ratio. The main fatty acids regulating the hypocholesterolemic index are the polyunsaturated fatty acids (PUFA) n-6 and n-3 and their ratio (Ʃ PUFA n-6/n-3). While n-6 predominates in the atherogenic ones, n-3 plays a significant function in controlling the thrombogenic index. Low AI and TI and a high h/H index are characteristics of a healthy animal product [50].
The link between the primary SFA (pro-atherogenic) and the main MUFA and PUFA is expressed by the atherogenicity index (AI) (anti-atherogenic). The ratio of pro-thrombogenic SFA to anti-thrombogenic MUFA and PUFA is known as the thrombogenicity index (TI) [28]. AI and TI that are less than 1.0 and 0.5 in the diet, respectively, are advised for human health [29]. All the meat samples we analyzed had an AI within the acceptable range, unlike the TIs that were higher than the acceptable range.
The link between a tissue’s fatty acid profile and its susceptibility to oxidation is represented by the peroxidizability index (PI) which identifies the technological quality of meat. However, the higher the PI value, the better the preventive potential for coronary artery disorders. The PI index is used to evaluate the stability of PUFA incorporated in food products and to protect them from potential oxidation processes. Due to their high vulnerability to lipid peroxidation, PUFA consumption in excess might have adverse effects such as oxidative stress. It has been proposed that oxidative stress, which is linked to the generation of lipid peroxides, contributes to the pathogenic processes in aging and numerous diseases including atherosclerosis [50]. Each sample of fallow deer meat had higher PI levels. The flesh of fallow deer may have a higher health value if it contains more n-3 PUFA and has a high PI value. Low PI values in wild boars and pigs indicate little oxidation of the meat’s fatty acids and, therefore, long storage times. The h/H ratios showed a larger percentage of fatty acids with low cholesterol. The wild boar meat samples showed the highest h/H levels. Low AI and TI and a higher h/H index are characteristics of an animal product that is of good quality [50]—both of which are fulfilled by the fallow deer meat samples in our experiment.
According to the existence and/or composition of the variables, the tendency of meat to lipid peroxidation is affected by the species of animal, kind of muscle, and anatomical site [51]. Lipid oxidation is a spontaneous and unavoidable process taking place during postmortem aging [52] and does not stop during long-term freezer storage.
The results of malondialdehyde determination in samples while being stored in vacuum packages are shown in Table 6. On the first day of this experiment, the lowest MDA values in pig meat were measured in the LM samples. On the 180th day of storage, an increased content of MDA in PM samples was observed followed by a decrease until the 360th day of the experiment. In WB meat samples, a decrease in MDA content was detected up to the 270th day and a repeated increase on the 360th day of storage. In FD meat during storage, a gradual decrease of MDA was noted during the first 270 days of the experiment.
In the SM meat samples of PM and WB, there was a lower MDA content than in FD. The MDA values rose up to the 90th day of storage in the vacuum-packed samples. On the 360th day the lowest values were measured in FD of PM samples.
The lowest MDA content was recorded on the initial day of the trial in the TM samples of WB. During storage, the increase of MDA was up to the 180th day of storage. Subsequently, MDA content in meat samples decreased until the end stage of the trial. At the end of the trial, comparable MDA values were measured in all TM samples.
The increase in MDA values determined during storage and TBA in pig meat samples stored over 180 days are comparable to Huang et al. [53].
The rise of MDA values is a sign that the meat lipids have been oxidized [54]. The rise in MDA content up to the 180th day of storage can be explained by the gradual transformation of primary oxidation products (hydroperoxides) into secondary oxidation products (hydrocarbons, alcohols, aldehydes, and fatty acids) where MDA is the main secondary product that is produced in the largest amount during the oxidative degradation of lipids. The decrease in MDA can be explained by the effect of vacuum packaging when access to air is prevented and further oxidation processes do not occur. Substances reacting with TBA as well as MDA reached threshold levels, then started to break down and interact with other substances resulting in lower values when kept for a long time [55]. Meat samples were vacuum-packed before being frozen which, according to Daszkiewicz et al. [11], likely reduced the extent of oxidative alterations during storage. In addition to TBARS, Maqsood et al. [53] also determined the peroxide value in the packaged meat—the peroxide values first increased slightly and then increased significantly which is related to the accumulation of primary oxidation products and their more rapid decomposition into secondary oxidation products. This corresponds with lower TBARS values in the vacuum-packed meat which may have been due to the unavailability of oxygen at the stage of propagation of lipid oxidation.
Higher MDA values at the start of the trial may be influenced by slaughter conditions or slaughter stress. Cifuni et al. [21] described the effect of pre-slaughter stress on meat quality and stability of meat in farmed ungulates. Stress is directly related to the lipid oxidation in animal muscles. Physical activity before killing increases the concentration of oxygen-containing free radicals in tissues, accelerating lipid oxidation. Moreover, the increased level of lipid oxidation in wild boars and game may be caused by stress caused by the hunting methods.
The MDA content in our experiment varied from 0.025 to 0.141 mg·kg−1. The amount of MDA did not exceed the value of 2 mg of MDA/kg during freezer storage. Several authors [56,57,58,59,60] state that only MDA values above 2.0 mg·kg−1 in meat and meat products causes a lack of acceptance of the flavor profile by consumers as oxidative deterioration of meat lipids has occurred.
Table 7 shows the results of the multiway ANOVA MDA determination. The factors of meat cuts, types, and storage significantly affected the lipid oxidation processes in meat samples (p < 0.001).
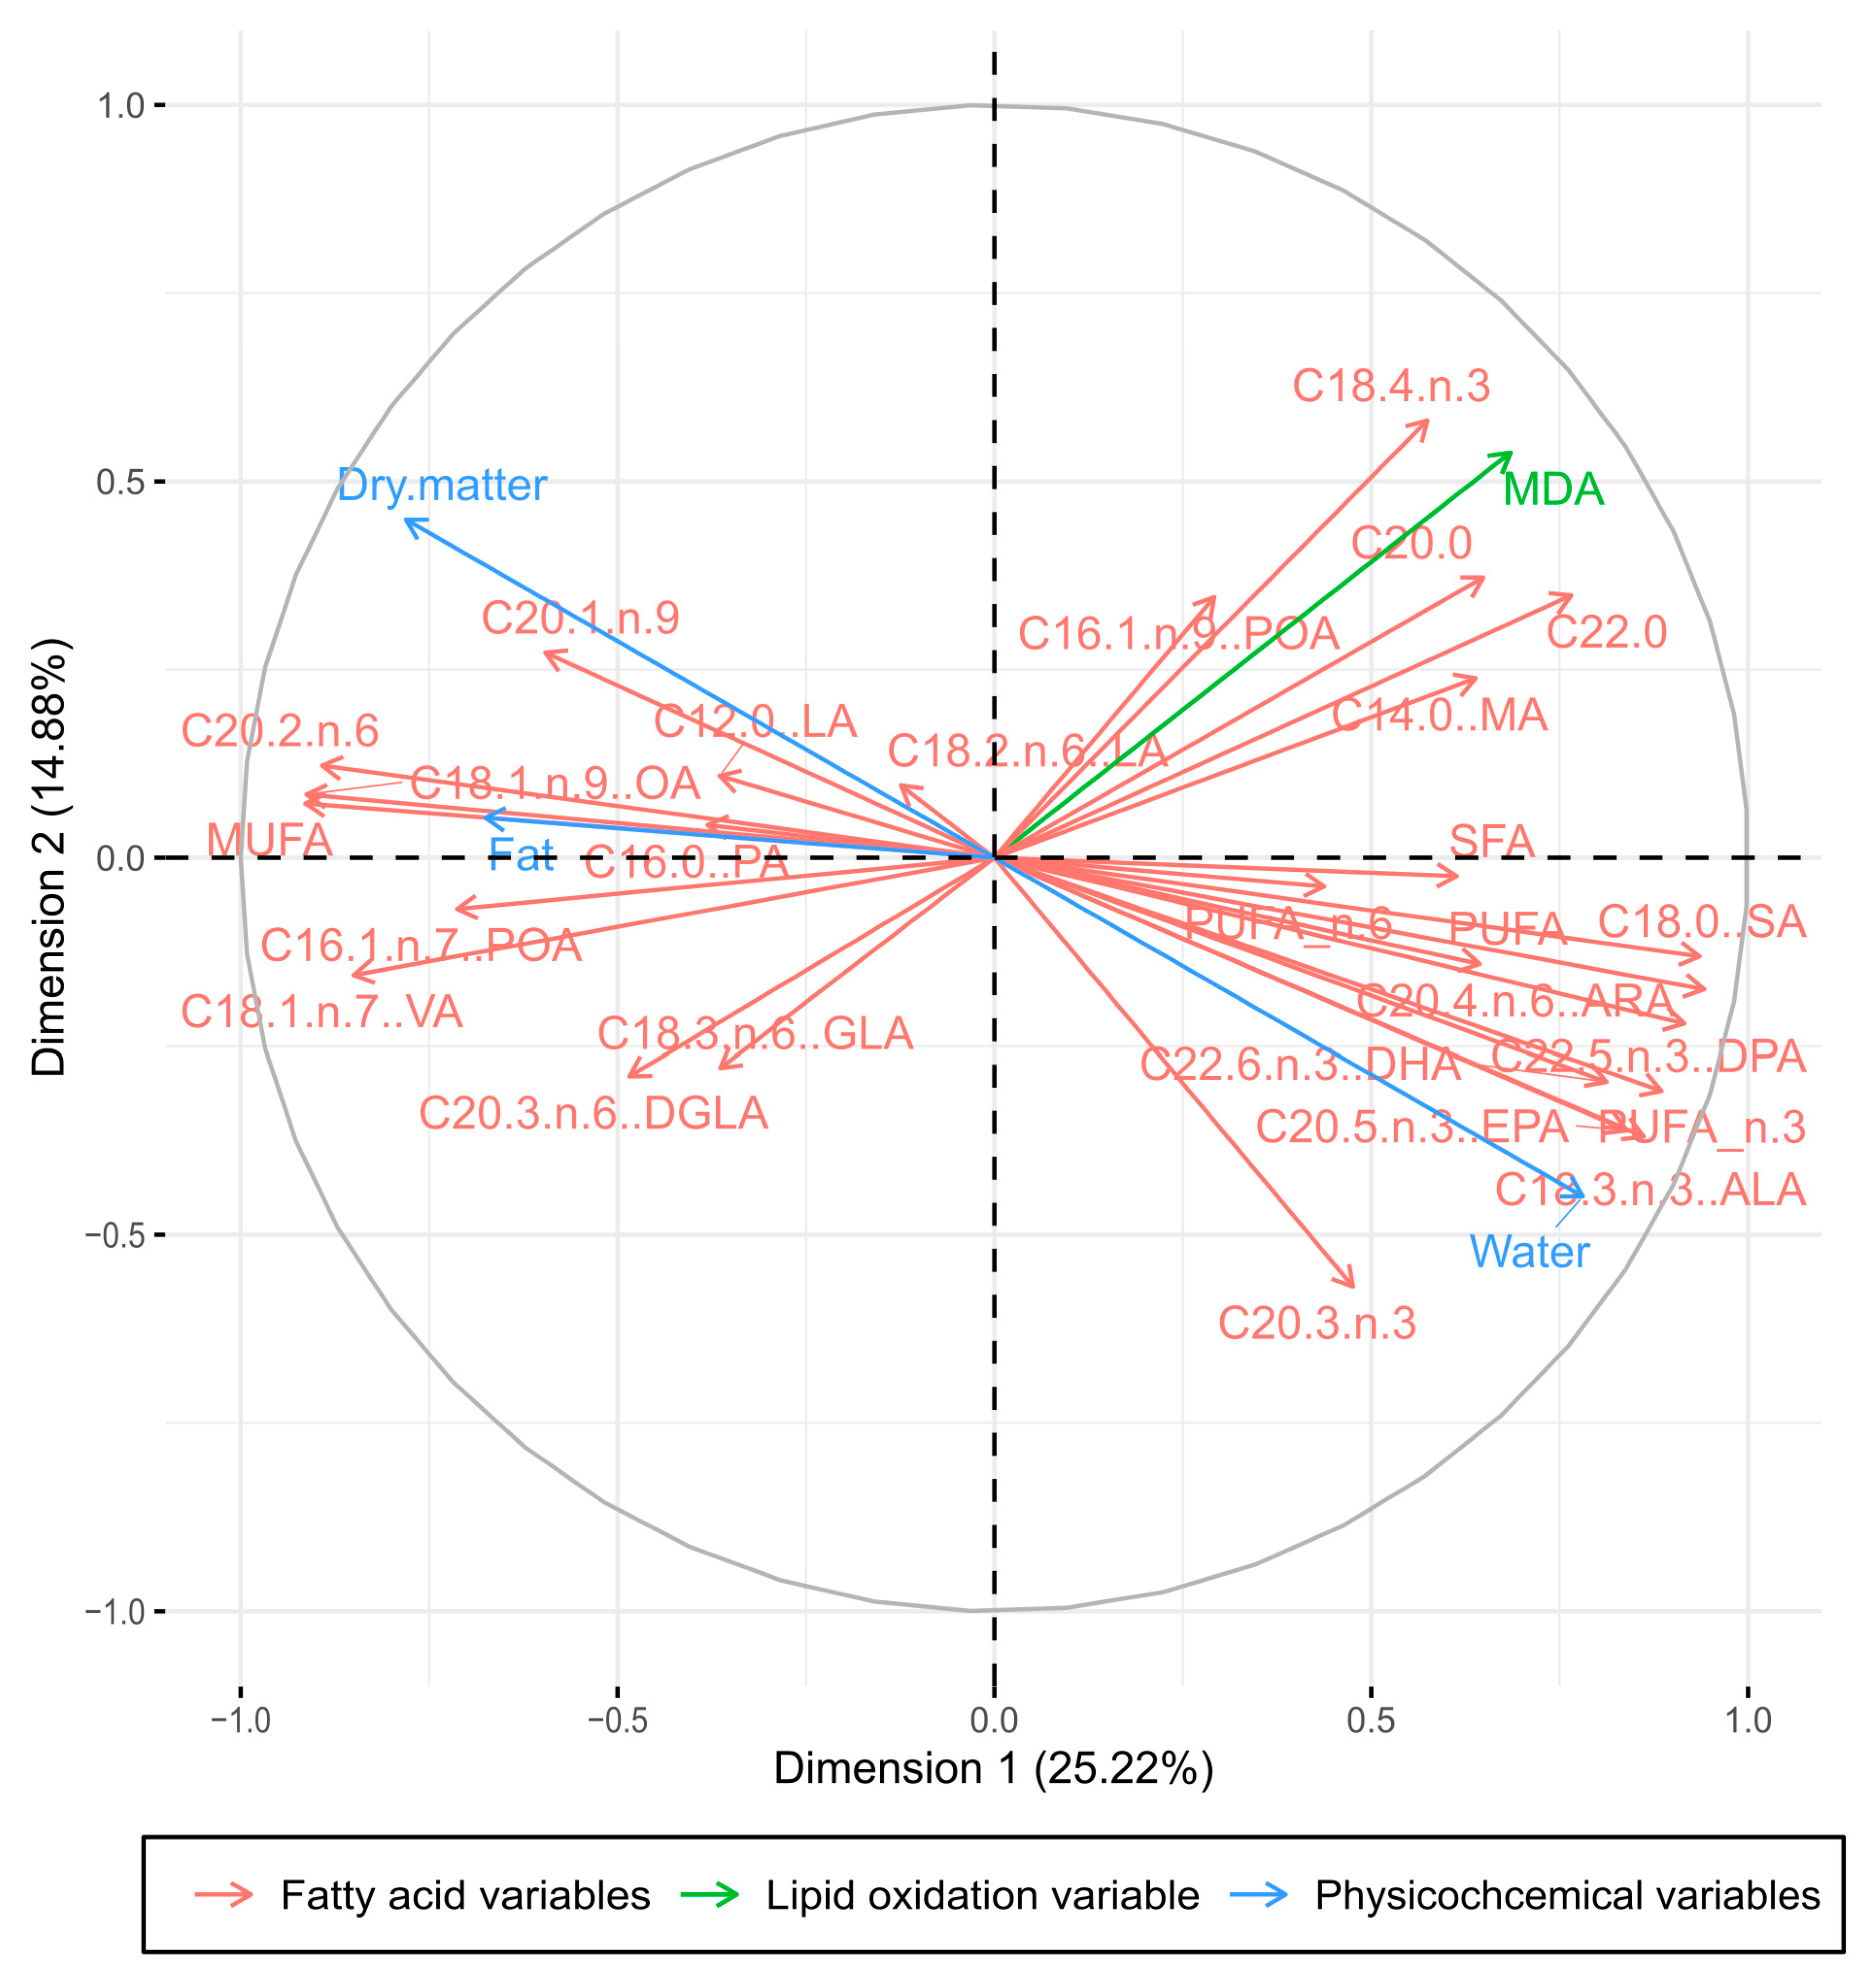
We used MFA statistical analysis to identify the number of final factors that were different from the first ones from the findings we acquired regarding physicochemical variables, lipid oxidation variables, and fatty acid variables identified on the first day of the experiment. The results of the MFA analysis revealed that four extracted components explain more than 67% of the total variation in the data set for distinct meat types (fallow deer, wild boar, and pig) and meat cuts (loin, shoulder, and thigh meat). The first dimension (Dim1) accounts for 25.22 percent, the second (Dim2) 14.88 percent, the third (Dim3) 14.22 percent, and the fourth (Dim4) 13.04 percent.
The results of Dim1 belonged mainly to the fatty acid variables (23.42% r = 0.98) and physicochemical parameters of meat samples (16.42% r = 0.82). The correlated variables in Dim1 included C12:0, lauric acid (r = −0.365), C14:0, myristic acid (r = 0.638), C16:0, palmitic acid (r = −0.380), C18:0, stearic acid (r = 0.936), C20:0 (r = 0.649), C22:0 (r = 0.766), C16:1 n-9, palmitoleic acid (r = 0.292), C16:1 n-7, palmitoleic acid (r = −0.713), C18:1 n-9, oleic acid (r = −0.913), C18:1 n-7, vaccenic acid (r = −0.850), C20:1 n-9 (r = -0.596), C18:2 n-6, linolenic acid (r = −0.124), C18:3 n-6, gamma-linolenic acid (r = −0.364), C18:3 n-3, alfa-linolenic acid (r = 0.862), C18:4 n-3 (r = 0.862), C20:2 n-6 (r = −0.892), C20:3 n-6, dihomo-gamma linolenic acid (r = −0.484), C20:3 n-3 (r =0.476), C20:4 n-6, arachidonic acid (r = 0.942), C20:5 n-3, eicosapentaenic acid (r = 0.839), C22:5 n-3, docosapentaenic acid (r = 0.916), C22:6 n-3, docosahexaenic acid (r = 0.812), Ʃ saturated fatty acids (r = 0.614), Ʃ monounsaturated fatty acids (r = −0.914), Ʃ polyunsaturated fatty acids (r = 0.644), Ʃ n-3 polyunsaturated fatty acids (r = 0.885), Ʃ n-6 polyunsaturated fatty acids (r = 0.438), water content (r = 0.780), dry matter content (r = −0.780), and fat content (r = −0.676).
At a statistically significant level (p < 0.05), each reported variable of Dim1 was correlated. The values of the MDA concentration of the meat samples (12.06%, r = 0.538) were used to represent the lipid oxidation variable which made up the majority of Dim2′s representation. In Dim1 and Dim2, a total variation of 40.10% was explained (Figure 1). Figure 2 shows the extracted factors of the meat samples that were associated in Dim1 and Dim2. With 35.42% (r = 0.90) and 43.56% (r = 0.99), respectively, the parameters of meat type and samples had a significant contribution to Dim3. Similarities of meat type (wild boar and pork) and meat cuts (SM and TM) in the analyzed variables was observed. SM with TM samples were not plotted closely to LM samples, meaning that these samples differed in analyzed variables and characteristics. Similarly, meat samples of fallow deer were plotted at a farther distance from the other analyzed meat types, meaning that the meat of fallow deer differed from the others in regards to the analyzed variables.
Due to the lower proportion of SFA and a three times higher proportion of PUFA in muscle lipids of deer species, they may provide meat that is more favorable for human consumption [2]. The feed, sex, age, fatness of the animal, the hunting season, the hunting system, and aspects in the slaughtering and carcass or meat conservation processes are only a few of the many variables that affect the quality of wild ungulate meat [61].
The availability of game meat is restricted by the hunting season and is far more time-consuming and skill-dependent than the preparation of pork [12]. Deer farms and the natural environment (deer are a game species) are the two sources of venison in Europe [62]. Compared to wild game, farmed meat has several advantages, in particular, the possibility of regular year-round deliveries of fresh products to the commercial network and a guarantee of a certain quality standard for slaughter and processing including requirements for tracing the origin of the animal. Due to the possibility of controlled nutrition and feeding with concentrated feeds, animals bred in this way grow faster and their meat usually contains a higher amount of intramuscular fat and often shows more favorable textural characteristics such as tenderness and juiciness [43,63].
Due to the rising demand of consumers for free-range meat products, FD are enjoying new popularity and the number of deer farms is increasing all over the world. The increasing industrial meat production significantly affects the environment and also animal welfare. Additionally, industrially produced meat from deer bred on farms is advantageous for a constant production and supply of high quality meat [5]. Fallow deer is the most common cervid species farmed in Europe. Eating fallow deer meat can help increase the consumption of n-3 polyunsaturated fatty acids, particularly, EPA, DPA, and DHA fatty acids. The beneficial effects of n-3 PUFA are in the prevention, delay, and intervention of various diseases such as coronary artery diseases, hypertension, inflammatory and autoimmune disorders, neurodegenerative diseases, depression, and many other diseases [64].

4. Conclusions

The results of the presented study show that from the dietary point of view, the meat of fallow deer is the most suitable due to its low fat and high PUFA level (mainly LA (C18:2, n-6) and ALA (C18:3, n-3) but also EPA, DHA, DPA fatty acids). The most valuable and optimal PUFA/SFA, n-6/n-3 and h/H ratios and lipid nutritional quality indices (PI, AI, and TI) for human consumption were observed in samples of fallow deer. From the lipid oxidation point of view, the consumption of fresh meat is more suitable than long-term stored meat; however, vacuum packaging could ensure a lower level of lipid oxidation in stored meat.

Author Contributions

Conceptualization, A.R. and B.S.; methodology, A.R. and S.M.; formal analysis, A.R., M.B., T.K., M.Š. and B.S.; investigation, A.R. and B.S..; resources, J.N. and S.M.; data curation, A.R. and B.S.; writing—original draft preparation, A.R.; writing—review and editing, B.S. and S.M.; visualization, B.S.; supervision, J.N. and S.M.; project administration, S.M.; funding acquisition, S.M. All authors have read and agreed to the published version of the manuscript.

Funding

This research was funded by the Operational Program Integrated Infrastructure within the project: Demand-Driven Research for Sustainable and Innovative Food, Drive4SIFood 313011V336, co-financed by the European Regional Development Fund.

Institutional Review Board Statement

Not applicable.

Informed Consent Statement

Not applicable.

Data Availability Statement

Not applicable.

Acknowledgments

We would like to express our gratitude to Serena Faith Kishore Amrit, a native speaker born in California (USA) and a student at the University of Veterinary Medicine and Pharmacy in Kosice (Slovakia) for proofreading this paper’s English.

Conflicts of Interest

The authors declare no conflict of interest.

References

  1. Amaral, A.B.; Silva, M.V.; Lannes, S.C.S. Lipid oxidation in meat: Mechanisms and protective factors–a review. Food Sci. Technol 2018, 38, 1–15. [Google Scholar] [CrossRef] [Green Version]
  2. Bureš, D.; Bartoň, L.; Kotrba, R.; Hakl, J. Quality attributes and composition of meat from red deer (Cervus elaphus), fallow deer (Dama dama) and Aberdeen Angus and Holstein cattle (Bos taurus). J. Sci. Food Agric. 2018, 95, 2299–2306. [Google Scholar] [CrossRef] [PubMed]
  3. McAfee, A.J.; McSorley, E.M.; Cuskelly, G.J.; Moss, B.W.; Wallace, J.M.W.; Bonham, M.P.; Fearon, A.M. Red meat consumption: An overview of the risks and benefits. Meat Sci. 2010, 84, 1–13. [Google Scholar] [CrossRef] [PubMed]
  4. Ludwiczak, A.; Bykowska-Maciejewska, M.; Składanowska-Baryza, J.; Stanisz, M. Influence of the method of storage on the quality of venison from wild fallow deer (Dama dama). Meat Sci. 2019, 156, 98–104. [Google Scholar] [CrossRef] [PubMed]
  5. Kudrňáčová, E.; Bartoň, L.; Bureš, D.; Hoffman, L.C. Carcass and meat characteristics from farm-raised and wild fallow deer (Dama dama) and red deer (Cervus elaphus): A review. Meat Sci. 2018, 141, 9–27. [Google Scholar] [CrossRef]
  6. Švrčula, V.; Košinová, K.; Okrouhlá, M.; Chodová, D.; Hart, V. The effect of sex on meat quality of fallow deer (Dama dama) from the farm located in the Middle Bohemia. Ital. J. Anim. Sci. 2019, 18, 498–504. [Google Scholar] [CrossRef] [Green Version]
  7. Mexia, I.A.; Quaresma, M.A.G.; Coimbra, M.C.P.; Dos Santos, F.A.; Alves, S.P.A.; Bessa, R.J.B.; Antunes, I.C. The influence of habitat and sex on feral fallow deer meat lipid fraction. J. Sci. Food Agric. 2020, 100, 3220–3227. [Google Scholar] [CrossRef]
  8. Żmijewski, T.; Modzelewska-Kapituła, M.; Pomianowski, J.; Ziomek, A. Farmed-raised fallow deer (Dama dama L.) carcass characteristics and meat nutritional value. J. Food Sci. Technol. 2020, 57, 3211–3220. [Google Scholar] [CrossRef] [Green Version]
  9. Kaltenbrunner, M.; Mayer, W.; Kerkhoff, K.; Epp, R.; Rüggeberg, H.; Hochegger, R.; Cichna-Markl, M. Differentiation between wild boar and domestic pig in food by targeting two gene loci by real-time PCR. Sci. Rep. 2019, 9, 9221. [Google Scholar] [CrossRef] [Green Version]
  10. Sales, J.; Kotrba, R. Meat from wild boar (Sus scrofa L.): A review. Meat Sci. 2013, 94, 187–201. [Google Scholar] [CrossRef]
  11. Daszkiewicz, T.; Lipowski, T.; Kubiak, D. Effect of freezer storage on quality of m. longissimus lumborum from fallow deer (Dama dama L.). S. Afr. J. Anim. Sci. 2017, 47, 834–841. [Google Scholar] [CrossRef] [Green Version]
  12. Ludwiczak, A.; Kulig, D.; Skladanowska-Baryza, J.; Bykowska-Maciejewska, M.; Tarnawski, T.; Stanisz, M. The effect of chilled storage on the quality of meat from the feral wild boar (Sus scrofa). Ital. J. Anim. Sci. 2019, 18, 1294–1301. [Google Scholar] [CrossRef] [Green Version]
  13. Lavieri, N.; Williams, S.K. Effects of packaging systems and fat concentrations on microbiology, sensory and physical properties of ground beef stored at 4 ± 1 °C for 25 days. Meat Sci. 2014, 97, 534–541. [Google Scholar] [CrossRef] [PubMed]
  14. Hur, S.J.; Jin, S.K.; Park, J.H.; Jung, S.W.; Lyu, H.J. Effect of modified atmosphere packaging and vacuum packaging on quality characteristics of low grade beef during cold storage. Asian Austral. J. Anim. 2013, 26, 1781–1789. [Google Scholar] [CrossRef] [Green Version]
  15. McMillin, K.W. Advancements in meat packaging. Meat Sci. 2017, 132, 153–162. [Google Scholar] [CrossRef]
  16. Strydom, P.E.; Hope-Jones, M. Evaluation of three vacuum packaging methods for retail beef loin cuts. Meat Sci. 2014, 98, 689–694. [Google Scholar] [CrossRef] [PubMed]
  17. Peng, Y.; Adhiputra, K.; Padayachee, A.; Channon, H.; Ha, M.; Warner, R.D. High Oxygen Modified Atmosphere Packaging Negatively Influences Consumer Acceptability Traits of Pork. Foods 2019, 8, 567. [Google Scholar] [CrossRef] [Green Version]
  18. Piaskowska, N.; Daszkiewicz, T.; Kubiak, D.; Zapotoczny, P. Quality of Meat (Longissimus dorsi) from Male Fallow Deer (Dama dama) Packaged and Stored under Vacuum and Modified Atmosphere Conditions. Asian-Australas J. Anim. Sci. 2016, 29, 1782–1789. [Google Scholar] [CrossRef] [Green Version]
  19. Chakanya, C.; Arnaud, E.; Muchenje, V.; Hoffman, L.C. Colour and oxidative stability of mince produced from fresh and frozen/thawed fallow deer (Dama dama) meat. Meat Sci. 2017, 126, 63–72. [Google Scholar] [CrossRef]
  20. Tateo, A.; Maggiolino, A.; Domínguez, R.; Lorenzo, J.M.; Dinardo, F.R.; Ceci, E.; Marino, R.; Malva, A.D.; Bragaglio, A.; Palo, P.D. Volatile Organic Compounds, Oxidative and Sensory Patterns of Vacuum Aged Foal Meat. Animals 2020, 10, 1495. [Google Scholar] [CrossRef]
  21. Cifuni, G.F.; Amici, A.; Contò, M.; Viola, P.; Failla, S. Effects of the hunting method on meat quality from fallow deer and wild boar and preliminary studies for predicting lipid oxidation using visible reflectance spectra. Eur. J. Wildl. Res. 2014, 60, 519–526. [Google Scholar] [CrossRef]
  22. Arowolo, F.K.; Yang, X.; Blaser, M.E.; Nicholson, A.M.; Hosokawa, E.; Booth, J.R.; Jobsis, C.T.; Russell, R.L.; Meudt, J.J.; Reichert, J.L.; et al. Presence of lipid oxidation products in swine diet lowers pork quality and stability during storage. Meat Sci. 2020, 160, 107946. [Google Scholar] [CrossRef] [PubMed]
  23. Klupsaite, D.; Buckiuniene, V.; Sidlauskiene, S.; Lele, V.; Sakiene, V.; Zavistanaviciute, P.; Klementaviciute, J.; Viskontaite, E.; Bartkiene, E. Comparison studies of the chemical, physical, technological, and microbiological characteristics of the European roe deer, boar, red deer, and beaver hunted wild game meat. Anim. Sci. J. 2020, 91, e13346. [Google Scholar] [CrossRef] [PubMed]
  24. Pedrazzoli, M.; Dal Bosco, A.; Castellini, C.; Ranucci, D.; Mattioli, S.; Pauselli, M.; Roscini, V. Effect of age and feeding area on meat quality of wild boars. Ital. J. Anim. Sci. 2017, 16, 353–362. [Google Scholar] [CrossRef] [Green Version]
  25. Muela, E.; Sañudo, C.; Campo, M.M.; Medel, I.; Beltrán, J.A. Effect of freezing method and frozen storage duration on instrumental quality of lamb throughout display. Meat Sci. 2010, 84, 662–669. [Google Scholar] [CrossRef] [PubMed]
  26. Horwitz, W.; Latimer, G.W. Official Methods of Analysis of AOAC International; AOAC International: Gaithersburg, MA, USA, 2007. [Google Scholar]
  27. Čertík, M.; Sláviková, L.; Masrnová, S.; Šajbidor, J. Enhancement of Nutritional Value of Cereals with γ-Linolenic Acid by Fungal Solid-State Fermentations. Food Technol. Biotechnol. 2006, 44, 75–82. [Google Scholar]
  28. Gajdoš, P.; Nicaud, J.M.; Rossignol, T.; Čertík, M. Single cell oil production on molasses by Yarrowia lipolytica strains overexpressing DGA2 in multicopy. App. Microbiol. Biotechnol. 2015, 99, 8065–8074. [Google Scholar] [CrossRef] [PubMed]
  29. Slaný, O.; Klempová, T.; Shapaval, V.; Zimmermann, B.; Kohler, A.; Čertík, M. Biotransformation of Animal Fat-By Products into ARA-Enriched Fermented Bioproducts by Solid-State Fermentation of Mortierella alpina. J. Fungi 2020, 6, 236. [Google Scholar] [CrossRef] [PubMed]
  30. Ulbricht, T.L.V.; Southgate, D.A.T. Coronary heart disease: Seven dietary factors. Lancet 1991, 338, 985–992. [Google Scholar] [CrossRef]
  31. Fernandes, C.E.; Vasconcelos, M.A.S.; Ribeiro, M.A.; Sarubbo, L.A.; Andrade, S.A.C.; de Melo Filho, A.B. Nutritional and lipid profiles in marine fish species from Brasil. Food Chem. 2014, 160, 67–71. [Google Scholar] [CrossRef]
  32. Erickson, M.C. Variation of lipid and tocopherol composition in three strains of channel catfish (Ictalurus punctatus). J. Sci. Food Agric. 1992, 59, 529–536. [Google Scholar] [CrossRef]
  33. Cardiovascular Review Group, Great Britain. Department of Health. Nutritional aspects of cardiovascular disease. In Department of Health and Social Security-Reports on Health and Social Subjects; Her Majesty’s Stationery Office: London, UK, 1994; Volume 46, pp. 1–186. [Google Scholar]
  34. Marcinčák, S.; Sokol, J.; Turek, P.; Róžaňská, H.; Dičáková, Z.; Máté, D.; Popelka, P.; Korim, P. Comparative evaluation of analytical techniques to quantify malondialdehyde in broiler meat. Bull. Vet. Inst. Pulawy. 2003, 47, 491–496. [Google Scholar]
  35. R Core Team. R: A Language and Environment for Statistical Computing; R Foundation for Statistical Computing: Vienna, Austria, 2017. [Google Scholar]
  36. Lê, S.; Josse, J.; Husson, F. FactoMineR: H.F. An R Package for Multivariate Analysis. J. Stat. Softw. 2008, 25, 1–18. [Google Scholar] [CrossRef] [Green Version]
  37. Kassambara, A.; Mundt, F. Factoextra: Extract and Visualize the Results of Multivariate Data Analyses; R Package Version 1.0.5; R Foundation for Statistical Computing: Vienna, Austria, 2007. [Google Scholar]
  38. Pagès, J. Multiple Factor Analysis by Example Using R, 1st ed.; CRC Press: Boca Raton, FL, USA, 2014; pp. 1–272. [Google Scholar]
  39. Semjon, B.; Král, M.; Pospiech, M.; Reitznerová, A.; Maľová, J.; Tremlová, B.; Dudriková, E. Application of multiple factor analysis for the descriptive sensory evaluation and instrumental measurements of bryndza cheese as affected by vacuum packaging. Int. J. Food Prop. 2018, 21, 1508–1522. [Google Scholar] [CrossRef] [Green Version]
  40. Merta, D.; Mocala, P.; Pomykacz, M.; Frackowiak, W. Autumn-winter diet and fat reserves of wild boars (Sus scrofa) inhabiting forest and forest-farmland environment in south-western Poland. Folia Zool. 2014, 63, 95–102. [Google Scholar] [CrossRef]
  41. Hoffman, L.C.; Wiklund, E. Game and venison-meat for the modern consumer. Meat Sci. 2006, 74, 197–208. [Google Scholar] [CrossRef] [PubMed]
  42. Babicz, M.; Kropiwiec-Domanska, K.; Szyndler-NeRdza, M.; Grzebalska, A.M.; Łuszczewska- Sierakowska, I.; Wawrzyniak, A.; Hałabis, M. Physiochemical parameters of selected internal organs of fattening pigs and wild boars. Ann. Anim. Sci. 2018, 18, 575–591. [Google Scholar] [CrossRef] [Green Version]
  43. Volpelli, L.A.; Valusso, R.; Morgante, M.; Pittia, P.; Piasentier, E. Meat quality in male fallow deer (Dama dama): Effects of age and supplementary feeding. Meat Sci. 2003, 65, 555–562. [Google Scholar] [CrossRef]
  44. Van Rooijen, M.A.; Mensink, R.P. Palmitic Acid Versus Stearic Acid: Effects of Interesterification and Intakes on Cardiometabolic Risk Markers-A Systematic Review. Nutrients 2020, 12, 615. [Google Scholar] [CrossRef] [Green Version]
  45. Tan, K.; Zhang, H.; Zheng, H. Climate change and n-3 LC-PUFA availability (Review). Prog. Lipid Res. 2022, 86, 101161. [Google Scholar] [CrossRef]
  46. Calder, P.C. Very long-chain n-3 fatty acids and human health: Fact, fiction and the future. Proc. Nutr. Soc. 2018, 77, 52–72. [Google Scholar] [CrossRef] [PubMed] [Green Version]
  47. Bus, I.; Witkamp, R.; Zuilhof, H.; Albada, B.; Balvers, M. The role of n-3 PUFA-derived fatty acid derivatives and their oxygenated metabolites in the modulation of inflammation. Prostaglandins Other Lipid Mediat. 2019, 144, 106351. [Google Scholar] [CrossRef] [PubMed]
  48. Li, D.; Bode, O.; Drummond, H.; Sinclair, A.J. Omega-3 (n-3) fatty acids. In Lipids for Functional Foods and Nutraceuticals; Gunstone, F.D., Ed.; The Oily Press LTD: Buckinghamshire, UK, 2002; pp. 225–262. [Google Scholar]
  49. Wood, J.D.; Richardson, R.I.; Nute, G.R.; Fischer, A.V.; Campo, M.M.; Kasapidou, E.; Sheard, P.R.; Enser, M. Effects of fatty acids on meat quality: A review. Meat Sci. 2003, 66, 21–32. [Google Scholar] [CrossRef]
  50. Wołoszyn, J.; Haraf, G.; Okruszek, A.; Wereńska, M.; Goluch, Z.; Teleszko, M. Fatty acid profiles and health lipid indices in the breast muscles of local Polish goose varieties. Poult Sci. 2020, 99, 1216–1224. [Google Scholar] [CrossRef] [PubMed]
  51. Min, B.; Ahn, U. Mechanism of lipid peroxidation in meat and meat products-a review. Food Sci. Biotechnol. 2005, 14, 152–163. [Google Scholar]
  52. Vaithiyanathan, S.; Naveena, B.M.; Muthukumar, M.; Girish, P.S.; Ramakrishna, C.; Sen, A.R.; Babji, Y. Biochemical and Physicochemical Changes in Spent Hen Breast Meat During Postmortem Aging. Poult Sci. 2008, 87, 180–186. [Google Scholar] [CrossRef] [PubMed]
  53. Huang, L.; Xiong, Y.L.; Kong, B.; Huang, H.; Li, J. Influence of storage temperature and duration on lipid and protein oxidation and flavour changes in frozen pork dumpling filler. Meat Sci. 2013, 95, 295–301. [Google Scholar] [CrossRef]
  54. Cheng, S.; Wang, X.; Yang, H.; Lin, R.; Wang, H.; Tan, M. Characterization of moisture migration of beef during refrigeration storage by low-field NMR and its relationship to beef quality. J. Sci. Food Agric. 2020, 100, 1940–1948. [Google Scholar] [CrossRef]
  55. Maqsood, S.; Ahmed Al Haddad, N.A.; Mudgil, P. Vacuum packaging as an effective strategy to retard off-odour development, microbial spoilage, protein degradation and retain sensory quality of camel meat. LWT-Food Sci. Technol. 2016, 72, 55–62. [Google Scholar] [CrossRef]
  56. Wereńska, M.; Okruszek, A.; Haraf, G.; Wołoszyn, J.; Goluch, Z. Impact of frozen storage on oxidation changes of some components in goose meat. Poult Sci. 2022, 101, 101517. [Google Scholar] [CrossRef]
  57. Domínguez, R.; Pateiro, M.; Gagaoua, M.; Barba, F.J.; Zhang, W.; Lorenzo, J.M. A comprehensive review on lipid oxidation in meat and meat products. Antioxidants 2019, 8, 429. [Google Scholar] [CrossRef] [PubMed] [Green Version]
  58. Campo, M.M.; Nute, G.R.; Hughes, S.I.; Enser, M.; Wood, J.D.; Richardson, R.I. Flavour perception of oxidation in beef. Meat Sci. 2006, 72, 303–311. [Google Scholar] [CrossRef]
  59. O’Neill, L.M.; Galvin, K.; Morrissey, P.A.; Buckley, D.J. Comparison of effects of dietary olive oil, tallow and vitamin E on the quality of broiler meat products. Br. Poult Sci. 1998, 39, 365–371. [Google Scholar] [CrossRef] [PubMed]
  60. Younathan, M.T.; Watts, B. Relationship of meat pigments to lipid oxidation. Food Res. 1959, 24, 728–734. [Google Scholar] [CrossRef]
  61. Ramanzin, M.; Amici, A.; Consoli, C.; Esposito, L.; Lupi, P.; Marsico, G.; Mattiello, S.; Olivieri, O.; Ponzetta, M.P.; Russo, C.; et al. Meat from wild ungulates: Ensuring quality and hygiene of an increasing resource. Ital. J. Anim. Sci. 2010, 9, 318–331. [Google Scholar]
  62. Stanisz, M.; Ludwiczak, A.; Buda, P.; Pietrzak, M.; Bykowska, M.; Kryza, A.; Ślósarz, P. The effect of sex on the dressing percentage, carcass, and organ quality in the fallow deer (Dama dama). Ann. Anim. Sci. 2015, 15, 1055–1067. [Google Scholar] [CrossRef] [Green Version]
  63. Dahlan, I.; Norfarizan Hanoon, N.A. Chemical composition, palatability and physical characteristics of venison from farmed deer. Anim. Sci. J. 2008, 79, 498–503. [Google Scholar] [CrossRef] [Green Version]
  64. Liu, Y.; Ren, X.; Fan, C.; Wu, W.; Zhang, W.; Wang, Y. Health Benefits, Food Applications, and Sustainability of Microalgae-Derived N-3 PUFA. Foods 2022, 11, 1883. [Google Scholar] [CrossRef]
Figure 1. The combined graph of individuals with visualized meat cuts and meat type factors. LM: loin meat; SM: shoulder meat; TM: thigh meat samples.
Applsci 13 04059 g001
Figure 2. The correlation circle of analyzed variables.
Applsci 13 04059 g002
Table 1. The results of chemical measurements of loin, shoulder, and thigh muscles of meat samples.
Physicochemical VariablesMeat SampleFallow Deer Wild BoarPigp-Value
Dry matter, %Loin meat30.31 ± 0.70 b32.57 ± 0.32 a30.92 ± 0.37 b0.004
Fat, % 3.69 ± 0.66 ab4.69 ± 0.45 a3.11 ± 0.03 b0.016
Dry matter, %Shoulder meat27.90 ± 0.90 b30.58 ± 1.25 a32.15 ± 0.93 a0.007
Fat, % 2.66 ± 0.51 b6.87 ± 0.23 a6.13 ± 0.52 a˂0.001
Dry matter, %Thigh meat28.74 ± 0.45 b32.01 ± 0.37 a32.33 ± 0.42 a˂0.001
Fat, % 2.53 ± 0.33 b4.10 ± 0.43 ab5.87 ± 1.75 a0.021
Means without a common superscript letter (a, b) in rows significantly differ (Tukey’s test, p < 0.05).
Table 2. The composition of fatty acids of the loin samples (%/total fatty acid; mean ± SD).
Fatty Acid (%)Fallow DeerWild BoarPigp-Value
C12:00.08 ± 0.06 b0.04 ± 0.03 b0.17 ± 0.02 a0.012
C14:03.01 ± 1.590.75 ± 0.170.77 ± 0.070.038
C16:018.48 ± 3.0516.55 ± 0.8120.96 ± 0.180.067
C18:021.32 ± 0.78 a10.77 ± 0.24 c12.77 ± 0.15 b˂0.001
C20:00.49 ± 0.250.20 ± 0.020.16 ± 0.010.057
C22:00.33 ± 0.090.15 ± 0.020.11 ± 0.050.010
C16:1 n-90.60 ± 0.10.43 ± 0.070.38 ± 0.020.112
C16:1 n-71.25 ± 0.23 b2.16 ± 0.40 a1.81 ± 0.19 ab0.024
C18:1 n-913.68 ± 1.48 b29.75 ± 3.67 a28.95 ± 0.75 a˂0.001
C18:1 n-71.59 ± 0.46 b3.55 ± 0.14 a3.16 ± 0.07 a˂0.001
C20:1 n-90.23 ± 0.01 c1.17 ± 0.12 a0.55 ± 0.01 b˂0.001
C18:2 n-620.15 ± 5.3626.80 ± 2.8522.43 ± 0.650.142
C18:3 n-60.07 ± 0.04 b0.07 ± 0.03 b0.17 ± 0.02 a0.010
C18:3 n-32.07 ± 0.69 a0.55 ± 0.08 b0.78 ± 0.04 b0.007
C18:4 n-30.09 ± 0.02 a0.00 ± 0.00 b0.00 ± 0.00 b˂0.001
C20:2 n-60.10 ± 0.03 c0.49 ± 0.02 a0.42 ± 0.02 b˂0.001
C20:3 n-60.26 ± 0.12 b0.36 ± 0.09 b0.65 ± 0.07 a0.006
C20:3 n-30.10 ± 0.040.09 ± 0.020.12 ± 0.020.471
C20:4 n-611.92 ± 1.10 a4.94 ± 1.76 b4.51 ± 0.49 b0.001
C20:5 n-30.74 ± 0.430.21 ± 0.080.21 ± 0.020.065
C22:5 n-33.13 ± 1.48 a0.86 ± 0.25 b0.78 ± 0.09 b0.027
C22:6 n-30.31 ± 0.190.12 ± 0.040.14 ± 0.020.170
Ʃ Saturated Fatty Acids43.71 ± 5.82 a28.46 ± 1.28 b34.94 ± 0.48 b0.005
Ʃ Monounsaturated Fatty Acids17.36 ± 2.36 b37.05 ± 4.40 a34.84 ± 1.04 a˂0.001
Ʃ Polyunsaturated Fatty Acids38.94 ± 9.4834.49 ± 5.2230.22 ± 1.430.315
Ʃ Polyunsaturated Fatty Acids n-36.44 ± 2.84 a1.84 ± 0.46 b2.04 ± 0.19 b0.026
Ʃ Polyunsaturated Fatty Acids n-632.50 ± 6.6432.66 ± 4.7528.18 ± 1.240.473
Means without a common superscript letter (a–c) in row significantly differ (Tukey’s test, p < 0.05).
Table 3. The results of the fatty acid profile determination of the shoulder meat samples (%/total fatty acid; mean ± SD).
Fatty Acid (%)Fallow DeerWild BoarPigp-Value
C12:00.03 ± 0.04 b0.04 ± 0.03 b0.11 ± 0.01 a0.028
C14:02.04 ± 0.82 a0.81 ± 0.21 b0.92 ± 0.06 ab0.040
C16:016.87 ± 1.6518.34 ± 3.5020.45 ± 0.500.229
C18:022.67 ± 2.04 a11.70 ± 1.59 b11.39 ± 0.27 b0.000
C20:00.32 ± 0.130.21 ± 0.040.12 ± 0.010.056
C22:00.24 ± 0.03 a0.16 ± 0.03 b0.04 ± 0.00 c˂0.001
C16:1 n-90.49 ± 0.130.49 ± 0.090.44 ± 0.020.722
C16:1 n-71.56 ± 0.172.43 ± 0.852.44 ± 0.200.134
C18:1 n-915.97 ± 0.11 b35.93 ± 8.07 a33.90 ± 1.00 a0.004
C18:1 n-72.21 ± 0.38 b3.78 ± 0.93 a3.90 ± 0.11 a0.021
C20:1 n-90.22 ± 0.03 c1.47 ± 0.23 a0.61 ± 0.01 b˂0.001
C18:2 n-617.64 ± 0.88 b30.05 ± 4.74 a18.54 ± 1.44 b0.003
C18:3 n-60.08 ± 0.02 b0.06 ± 0.01 b0.15 ± 0.01 a0.002
C18:3 n-32.81 ± 0.46 a0.64 ± 0.12 b0.72 ± 0.08 b˂0.001
C20:2 n-60.15 ± 0.03 b0.55 ± 0.09 a0.45 ± 0.03 a˂0.001
C20:3 n-60.33 ± 0.07 b0.37 ± 0.07 b0.53 ± 0.03 a0.013
C20:3 n-30.14 ± 0.03 a0.09 ± 0.02 ab0.13 ± 0.01 b0.044
C20:4 n-611.79 ± 1.10 a5.44 ± 1.18 b4.13 ± 0.29 b˂0.001
C20:5 n-31.06 ± 0.24 a0.25 ± 0.06 b0.17 ± 0.01 b˂0.001
C22:5 n-33.37 ± 0.59 a0.98 ± 0.18 b0.72 ± 0.08 b˂0.001
C22:6 n-30.33 ± 0.08 a0.14 ± 0.03 b0.14 ± 0.02 b0.005
Ʃ Saturated Fatty Acids42.17 ± 4.71 a31.27 ± 5.40 b33.04 ± 0.85 b0.038
Ʃ Monounsaturated Fatty Acids20.46 ± 0.81 b44.10 ± 10.17 a41.28 ± 1.35 a0.005
Ʃ Polyunsaturated Fatty Acids37.70 ± 3.50 a38.55 ± 6.50 a25.68 ± 2.00 b0.020
Ʃ Polyunsaturated Fatty Acids n-37.71 ± 1.40 a2.08 ± 0.41 b1.88 ± 0.20 b˂0.001
Ʃ Polyunsaturated Fatty Acids n-629.99 ± 2.10 a36.46 ± 6.09 a23.35 ± 1.80 ab0.020
Means without a common superscript letter (a–c) in row significantly differ (Tukey’s test, p < 0.05).
Table 4. The results of the fatty acid profile determination of thigh meat samples (%/total fatty acid; mean ± SD).
Fatty Acid (%)Fallow DeerWild BoarPigp-Value
C12:00.00 ± 0.00 c0.05 ± 0.00 b0.08 ± 0.01 a˂0.001
C14:00.74 ± 0.300.61 ± 0.110.88 ± 0.140.333
C16:012.72 ± 1.50 b13.84 ± 0.34 b21.05 ± 0.79 a˂0.001
C18:018.36 ± 0.87 a11.17 ± 0.28 b12.49 ± 0.12 b ˂0.001
C20:00.19 ± 0.01 b0.21 ± 0.01 a0.14 ± 0.00 c˂0.001
C22:00.20 ± 0.01 a0.22 ± 0.01 a0.07 ± 0.02 b˂0.001
C16:1 n-90.34 ± 0.02 b0.52 ± 0.05 a0.28 ± 0.01 b˂0.001
C16:1 n-71.06 ± 0.15 c1.60 ± 0.11 b2.87 ± 0.33 a˂0.001
C18:1 n-910.12 ± 0.92 c33.23 ± 1.17 a28.44 ± 2.15 b˂0.001
C18:1 n-72.36 ± 0.13 c3.02 ± 0.07 b4.58 ± 0.08 a˂0.001
C20:1 n-90.18 ± 0.01 b1.92 ± 0.19 a0.50 ± 0.04 c˂0.001
C18:2 n-628.71 ± 1.72 a25.81 ± 0.79 a20.41 ± 2.58 b0.004
C18:3 n-60.08 ± 0.01 b0.06 ± 0.00 c0.14 ± 0.01 a˂0.001
C18:3 n-33.96 ± 0.22 a0.76 ± 0.07 b0.58 ± 0.04 b˂0.001
C20:2 n-60.15 ± 0.02 c0.57 ± 0.03 a0.35 ± 0.03 b˂0.001
C20:3 n-60.38 ± 0.04 b0.27 ± 0.07 b0.74 ± 0.09 a˂0.001
C20:3 n-30.23 ± 0.03 a0.08 ± 0.00 b0.10 ± 0.01 b˂0.001
C20:4 n-614.21 ± 1.18 a4.99 ± 0.98 b4.98 ± 0.61 b˂0.001
C20:5 n-31.52 ± 0.15 a0.17 ± 0.06 b0.25 ± 0.04 b˂0.001
C22:5 n-34.03 ± 0.27 a0.76 ± 0.12 b0.93 ± 0.14 b˂0.001
C22:6 n-30.47 ± 0.02 a0.14 ± 0.02 b0.14 ± 0.04 b˂0.001
Ʃ Saturated Fatty Acids32.20 ± 2.70 a26.10 ± 0.74 b34.71 ± 1.08 a0.002
Ʃ Monounsaturated Fatty Acids14.06 ± 1.24 b40.30 ± 1.59 a36.67 ± 2.60 a˂0.001
Ʃ Polyunsaturated Fatty Acids53.74 ± 3.67 a33.60 ± 2.14 b28.62 ± 3.60 b˂0.001
Ʃ Polyunsaturated Fatty Acids n-310.21 ± 0.70 a1.90 ± 0.27 b2.01 ± 0.27 b˂0.001
Ʃ Polyunsaturated Fatty Acids n-643.53 ± 2.97 a31.70 ± 1.87 b26.26 ± 3.33 b0.001
Means without a common superscript letter (a–c) in row significantly differ (Tukey’s test, p < 0.05).
Table 5. The results of lipid nutritional quality indexes (IQN).
Lipids Nutritional Quality IndexesMeat SamplesFallow DeerWild BoarPigp-Value
Polyunsaturated Fatty Acids/Saturated Fatty Acids ratioLoin0.51 ± 0.08 b0.97 ± 0.06 a0.67 ± 0.02 c˂0.001
n-6/n-35.58 ± 1.59 c18.10 ± 2.04 a13.86 ± 0.70 b˂0.001
Atherogenicity Index0.54 ± 0.06 a0.27 ± 0.02 c0.37 ± 0.00 b˂0.001
Thrombogenicity Index1.00 ± 0.18 a0.70 ± 0.08 b0.92 ± 0.03 ab0.044
Peroxidability Index99.40 ± 24.63 a57.52 ± 12.73 b52.31 ± 3.76 a0.022
Hypocholesterolemic/Hypercholesterolemic ratio2.51 ± 0.02 b3.87 ± 0.30 a2.74 ± 0.07 b˂0.001
Polyunsaturated Fatty Acids/Saturated Fatty Acids ratioShoulder meat0.49 ± 0.03 c0.99 ± 0.02 a0.59 ± 0.03 b˂0.001
n-6/n-33.94 ± 0.45 c17.57 ± 0.54 a12.46 ± 0.42 b˂0.001
Atherogenicity Index0.43 ± 0.06 a0.26 ± 0.00 b0.36 ± 0.01 a˂0.001
Thrombogenicity Index0.86 ± 0.01 a0.67 ± 0.02 b0.86 ± 0.03 a˂0.001
Peroxidability Index101.37 ± 12.10 a64.19 ± 11.91 b46.08 ± 3.64 b0.001
Hypocholesterolemic/Hypercholesterolemic ratio2.95 ± 0.18 b4.05 ± 0.05 a2.94 ± 0.07 b˂0.001
Polyunsaturated Fatty Acids/Saturated Fatty Acids ratioThigh meat1.03 ± 0.03 a1.04 ± 0.01 a0.61 ± 0.06 b˂0.001
n-6/n-34.26 ± 0.00 c16.77 ± 1.41 a13.28 ± 0.15 b˂0.001
Atherogenicity Index0.23 ± 0.02 b0.22 ± 0.00 b0.38 ± 0.02 a˂0.001
Thrombogenicity Index0.53 ± 0.01 b0.61 ± 0.02 b0.92 ± 0.07 a˂0.001
Peroxidability Index132.40 ± 9.81 a56.36 ± 6.28 b52.96 ± 6.86 b˂0.001
Hypocholesterolemic/Hypercholesterolemic ratio4.92 ± 0.32 a4.79 ± 0.09 a2.79 ± 0.15 a˂0.001
Means without a common superscript letter (a–c) in row significantly differ (Tukey’s test, p < 0.05).
Table 6. The results of malondialdehyde determination in meat samples during storage at vacuum conditions (MDA mg/kg, mean ± SD).
Meat SampleStorage (Days)Fallow Deer Wild BoarPigp-Value
Loin meat00.115 ± 0.01 a0.054 ± 0.01 b0.025 ± 0.00 c˂0.001
900.098 ± 0.02 a0.054 ± 0.00 b0.034 ± 0.01 b˂0.001
1800.086 ± 0.01 a0.055 ± 0.01 b0.063 ± 0.00 b0.009
2700.082 ± 0.01 a0.044 ± 0.01 b0.055 ± 0.01 b0.004
3600.084 ± 0.01 a0.063 ± 0.01 ab0.041 ± 0.01 b0.008
Shoulder meat00.060 ± 0.01 a0.038 ± 0.00 b0.034 ± 0.00 b0.003
900.139 ± 0.01 a0.045 ± 0.00 b0.055 ± 0.00 b˂0.001
1800.065 ± 0.020.062 ± 0.000.058 ± 0.010.781
2700.076 ± 0.02 a0.050 ± 0.00 b0.053 ± 0.00 b0.024
3600.048 ± 0.00 b0.075 ± 0.02 a0.044 ± 0.01 b0.021
Thigh meat00.049 ± 0.000.045 ± 0.010.054 ± 0.010.237
900.096 ± 0.02 a0.056 ± 0.00 b0.061 ± 0.01 ab˂0.001
1800.141 ± 0.02 a0.074 ± 0.02 b0.106 ± 0.02 ab0.024
2700.089 ± 0.01 a0.058 ± 0.00 b0.102 ± 0.01 a0.001
3600.068 ± 0.010.061 ± 0.010.054 ± 0.000.136
Means without a common superscript letter (a–c) in row significantly differ (Tukey’s test, p < 0.05).
Table 7. The results of multiway ANOVA analysis.
FactorsMulti-Way ANOVA Table
Sum SqDfF Valuep-Value
Meat cuts0.005222.197<0.001
Meat type0.0282123.511<0.001
Storage0.011424.793<0.001
Meat cuts: Meat type0.006413.191<0.001
Meat cuts: Storage0.013814.480<0.001
Meat type: Storage0.013814.101<0.001
Meat cuts: Meat type: Storage0.013166.677<0.001
Disclaimer/Publisher’s Note: The statements, opinions and data contained in all publications are solely those of the individual author(s) and contributor(s) and not of MDPI and/or the editor(s). MDPI and/or the editor(s) disclaim responsibility for any injury to people or property resulting from any ideas, methods, instructions or products referred to in the content.

