Article

The Shrink–Swell Process of the Granite Residual Soil with Different Weathering Degree in a Gully System in Southern China

1
Changjiang River Scientific Research Institute, Changjiang Water Resource Commission, Wuhan 430010, China
2
State Key Laboratory of Soil Erosion and Dryland Farming on the Loess Plateau, Institute of Soil and Water Conservation, Chinese Academy of Sciences and Ministry of Water Resources, Xinong Rd. 26, Yangling 712100, China
3
State Key Laboratory of Geomechanics and Geotechnical Engineering, Institute of Rock and Soil Mechanics, Chinese Academy of Sciences, Wuhan 430071, China
*
Author to whom correspondence should be addressed.
Appl. Sci. 2022, 12(21), 11200; https://doi.org/10.3390/app122111200
Submission received: 30 August 2022 / Revised: 13 October 2022 / Accepted: 2 November 2022 / Published: 4 November 2022
(This article belongs to the Special Issue Mechanical Properties and Engineering Applications of Special Soils)

Abstract

:
The soil shrink–swell phenomenon produces crack networks and slope instability. However, few studies have involved the continuous shrink–swell process of granite residual soils. The objective of the study is to explore the shrink–swell process of weathered granite soils and its effects on gully development in southern China. The bulk density, soil water content (SWC), shrink–swell ratio (SSR), clay mineral content, and mechanical composition, etc., of soil samples from five soil layers (at depths of 0.3 m, 3.0 m, 7.0 m, 12.0 m, and 16.0 m) along a profile in Yudu County was analyzed. After quantifying the soil properties at different soil depths, we analyzed these data statistically in an effort to identify strong parametric relationships. The results indicated that some properties such as bulk density and shear stress increased with soil depth, while other soil properties, such as plasticity index and liquid limit, were inversely related to depth. Soil cohesion, the angle of internal friction, and shear stress were closely related to the SWC. Every 1% decrease in the SWC resulted in a shear stress reduction of 6.62 kPa. The SSR values exhibited significant variation between the three dry–wet cycles and were closely related to the bulk density values of our kaolin and montmorillonite samples. As an environmental factor, the SWC can trigger changes in internal soil properties such as shear stress and the SSR. Using these data and observations made during our field survey, it can be proposed that continuous shrink–swell variation in deep granite-weathering crust can result in crack formation and gully erosion. It can be inferred that crack development velocity and gully retreat rate may be affected by the soil’s shrink–swell process. Consequently, this information provides insight to understanding the mechanism of gully development in southern China.

1. Introduction

Gully erosion is defined as an erosion process whereby runoff water accumulates and often recurs in narrow channels and, over short periods, moves the soil from this narrow area to considerable depths [1]. Gully erosion closely relates to rainfall amount and rainfall erosivity [2,3] because rainfall affects soil water content (SWC), and results in a change in soil shrinkage and swelling [4]. Continuous shrink–swell (SS) processes generate cracks in soil [5,6,7]. These make gullies develop as soil cracks extend. More importantly, the soil shrink–swell extent determines the velocity of soil cracking and collapse [8,9]. Therefore, it is very necessary to study the soil shrink–swell process.
There are numerous reports expounding the soil shrinkage process and its effects on soil properties. Chertkov [6] modelled the shrinkage curves of soil clay pastes. Peng et al. [10] quantified 2D soil cracks on the soil surface using digital image processing. Krisdani et al. [11] analyzed the relationship between shrinkage rate and SWC. Kalkan [12] reported the effects of silica fumes on swelling pressure and the potential of mixed clayey soil. Chertkov [13] constructed a physical model of the soil swelling curve and shrinkage curve. Stoltz et al. [14] analyzed the swelling and shrinkage of lime-treated expansive clayey soil. Fernandes et al. [15] measured the swelling and shrinkage of clay soil at various depths and explored the effects of SWC and temperature on shrinkage and swelling. Leong and Wijaya [16] developed a universal soil shrinkage curve equation. Zolfaghari et al. [17] reported the relationships of soil shrinkage between intrinsic soil properties and environmental variables for calcareous soils. Houben et al. [18] measured the swelling and shrinkage of rocks using a 1 mm sample cube with an environmental scanning electron microscope (ESEM) in a 3D dilatometer. Fang et al. [19] proved that paddy soil’s bulk density and aggregate stability increased after being dried and decreased upon saturation, while soil shrinkage capacity was the opposite. Mishra et al. [20] reviewed soil shrinkage characteristic curves and estimated the relationship between void ratio and gravimetric moisture content. Tang et al. [7] measured the 3D crack parameters of compacted clayey soil in a different water content condition using X-ray-computed tomography. Zenero et al. [21] found the overall weakness of shrinkage and high soil shrinkage curves along the forest and pasture top sequences in Amazonia. Zúñiga et al. [22] thought the soil shrinkage had a high dependency on soil organic carbon. Generally, most of these studies focused on the shrinkage curve of clayey soil, but few studies were conducted on the shrinkage of granite residual soil and fewer studies focused on the swelling process of soil.
Until 2005, there were 239.1 thousand gullies in 362 counties of seven provinces of China [23]. Greater than 80% of these gullies were distributed in the granite’s residual soil [24]. Liu et al. [3] proved the retreat rate of a small- and medium-sized gully over 7.5 years. Chen et al. [5] found that 27 units were still collapsing or collapsed, consisting of 12 very active ones, while only 3 units were fully stabilized, among 30 restored Benggang units investigated after 2–10 years of restoration in the Fujian province. Effects of water content on soils derived from granite were very significant [25], which resulted in numerous gullies developing. Thus, a series of laboratory investigations were performed to examine the soil property changes of granite residual soil due to the drying cycles. For example, Lin [26] measured the expansion and contraction characteristics of surface soil and found that soil expansion rates decreased with the increase in initial water contents. Zhang et al. [27] measured that the shear stress of surface soil decreased with SWC. These studies focused on surface soil properties and shrinkage characteristics. Duan et al. [28] proved that the red soil layer had a higher water retention capacity and shear strength than the sandy soil layer. Huang et al. [29] examined that the average values of the maximum linear shrinkage in the laterite, transition, and sandy layers were 1.50%, 2.09%, and 1.74%, respectively. Soil shrinkage rate was positively correlated with clay and Fe2O3 content and negatively correlated with sand content. Liu et al. [30] thought the weakening of cementation triggered the breakup of soil aggregates and led to soil disintegration and the occurrence of a gully collapse. However, little attention was paid to the shrink–swell process of the deep granite residual soil layers in the continuous dry–wet processes.
The objective of the study is to analyze the shrink–swell process of weathered granite soils and reveal its factors and impact on gully development. Thus, it is very helpful to understand crack formation, crack propagation, and gully wall failure processes developed in granite residual soil in southern China.

2. Materials and Methods
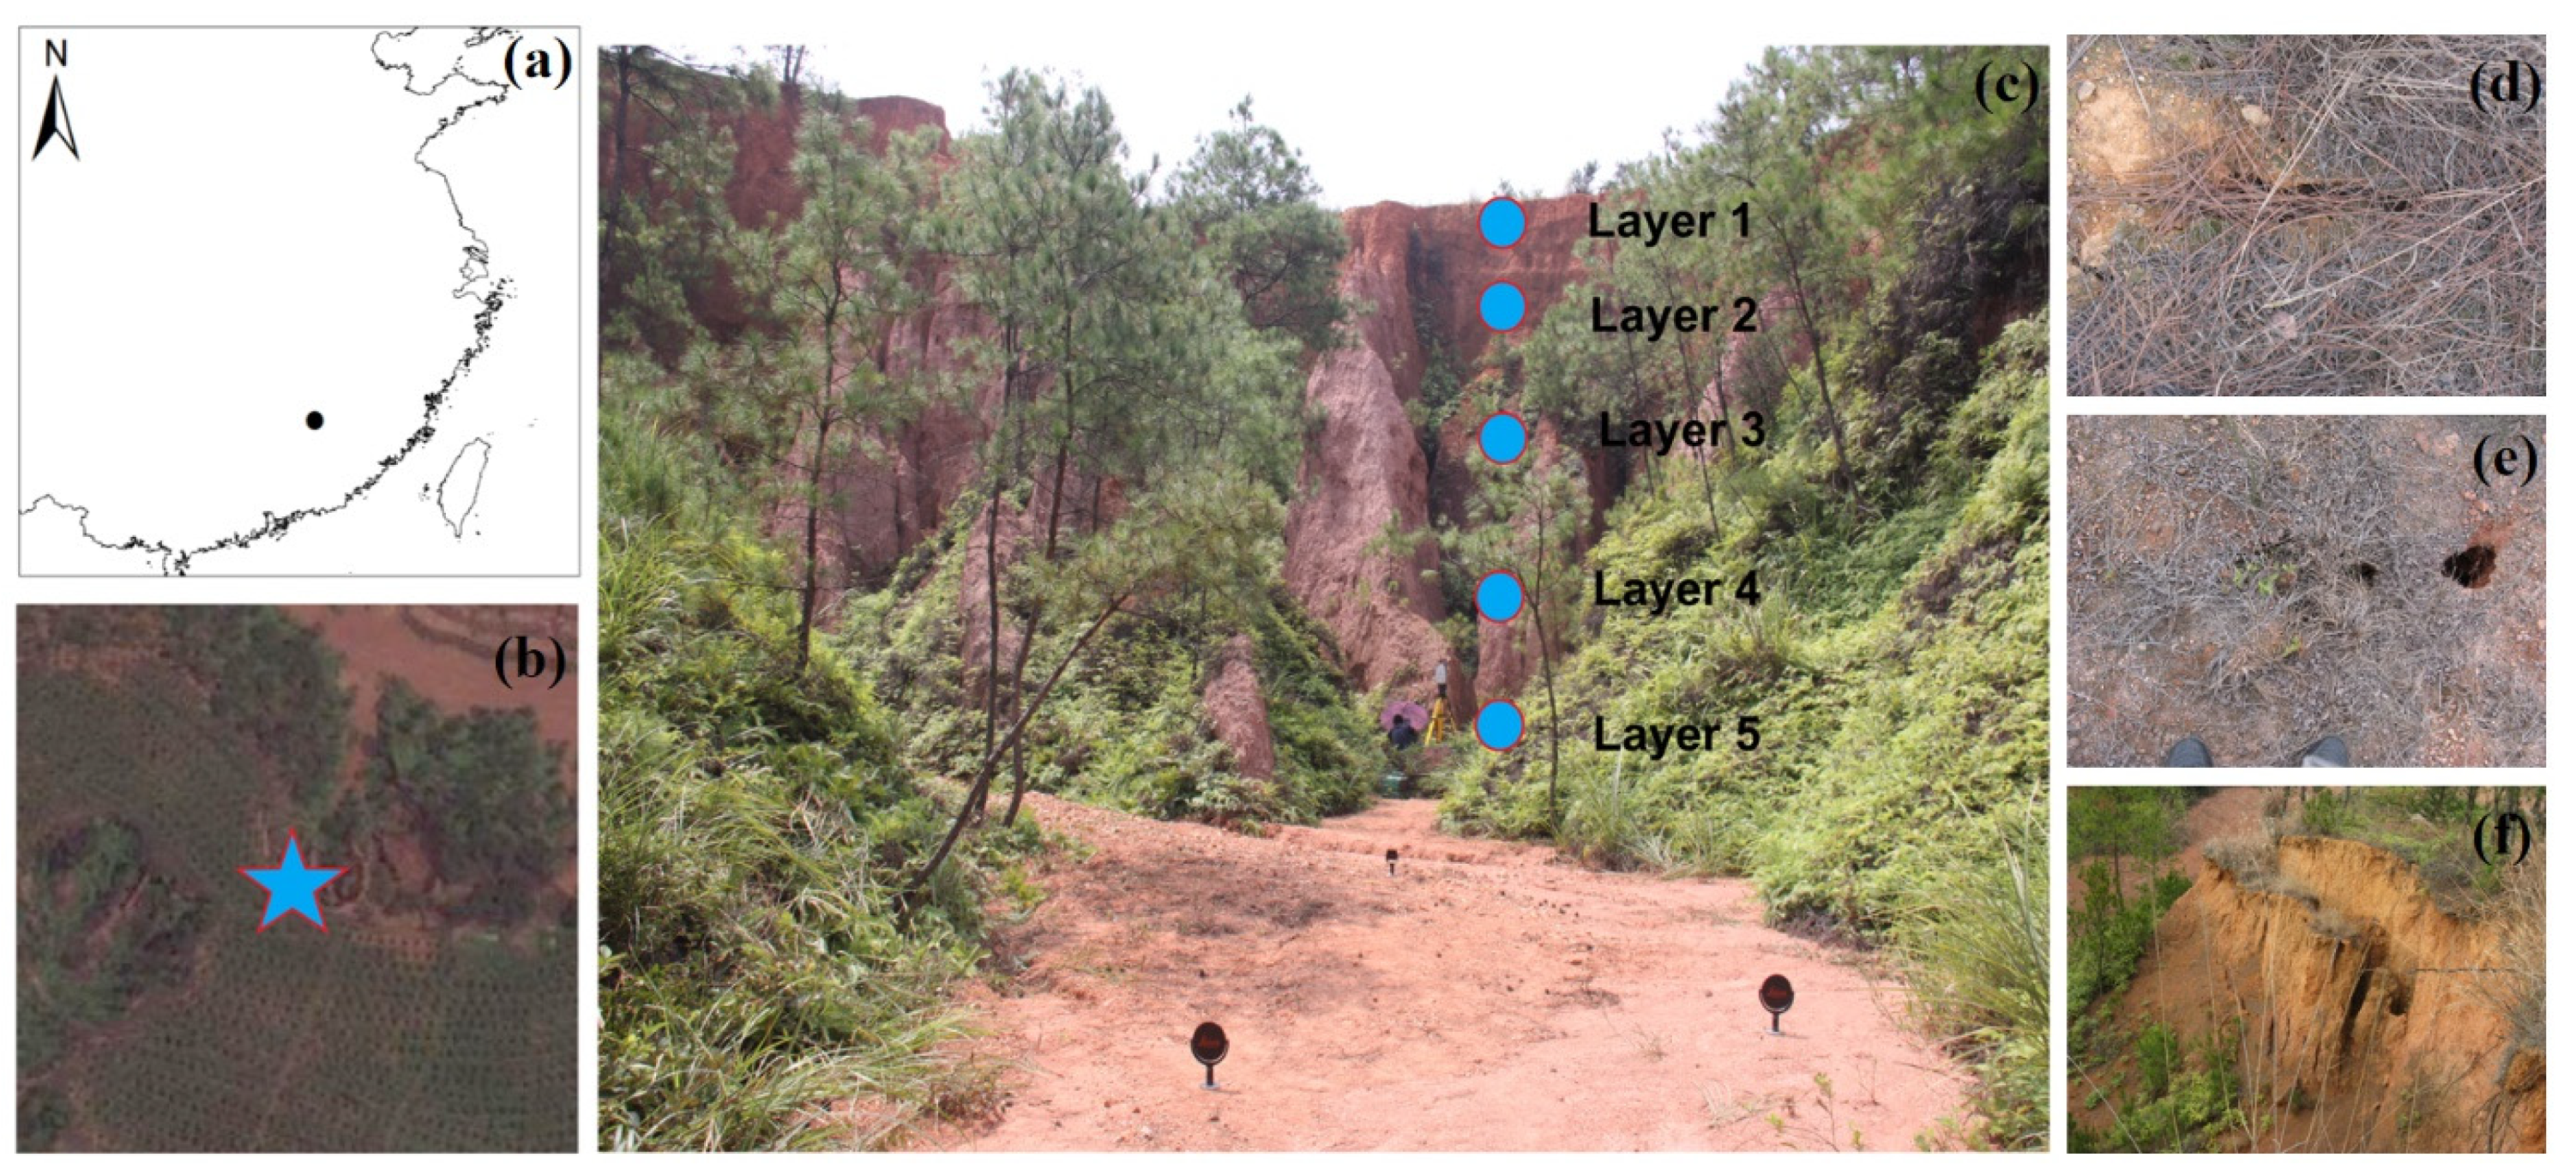
2.1. The Test Site

The studied soil profile is located in Zuoma, a small catchment with about 0.72 km2, Yudu County, Jiangxi province, South China (115.40° N, 25.91° E) (Figure 1a, Liu et al. [3]. This region has a typical warm and humid subtropical climate with an average annual precipitation of 1508 mm and a mean annual temperature of 19.7 °C. The main soil type is Orthic Acrisol, with a soil depth of about 1.0 m, according to the Soil Survey Staff (Chen et al. [31]). The parent material of the soil is a weathered granite regolith located at depths of 20–60 m. The soil has a pH value of 5–6. Each year, there are two distinct rice crop periods: one from April to July and another from July to November. Land use in the catchment is a mixture of field crops (rice), tree crops, and forests.

2.2. Soil Sampling

Five soil layers were ensured along the soil profile based on the characteristics of granite residual soil. The depths at which the samples were collected were 0.3 m, 3.0 m, 7.0 m, 12.0 m, and 16.0 m, respectively (Figure 1b,c). Two types of soil samples collected from each soil layer were then transported to the laboratory, including 9 undisturbed soil samples using cutting rings (5.46 cm in diameter and 5 cm in height), and 1 mixed soil sample weighting ~1 kg.

2.3. Soil Analysis

2.3.1. Experimental Analysis of Undistributed Soil

The undistributed soil samples were used to determine bulk density (BD), shear stress (τ), plasticity index (wLp), SSR, etc.
(1)
Soil bulk density was determined by the cutting ring method [32].
(2)
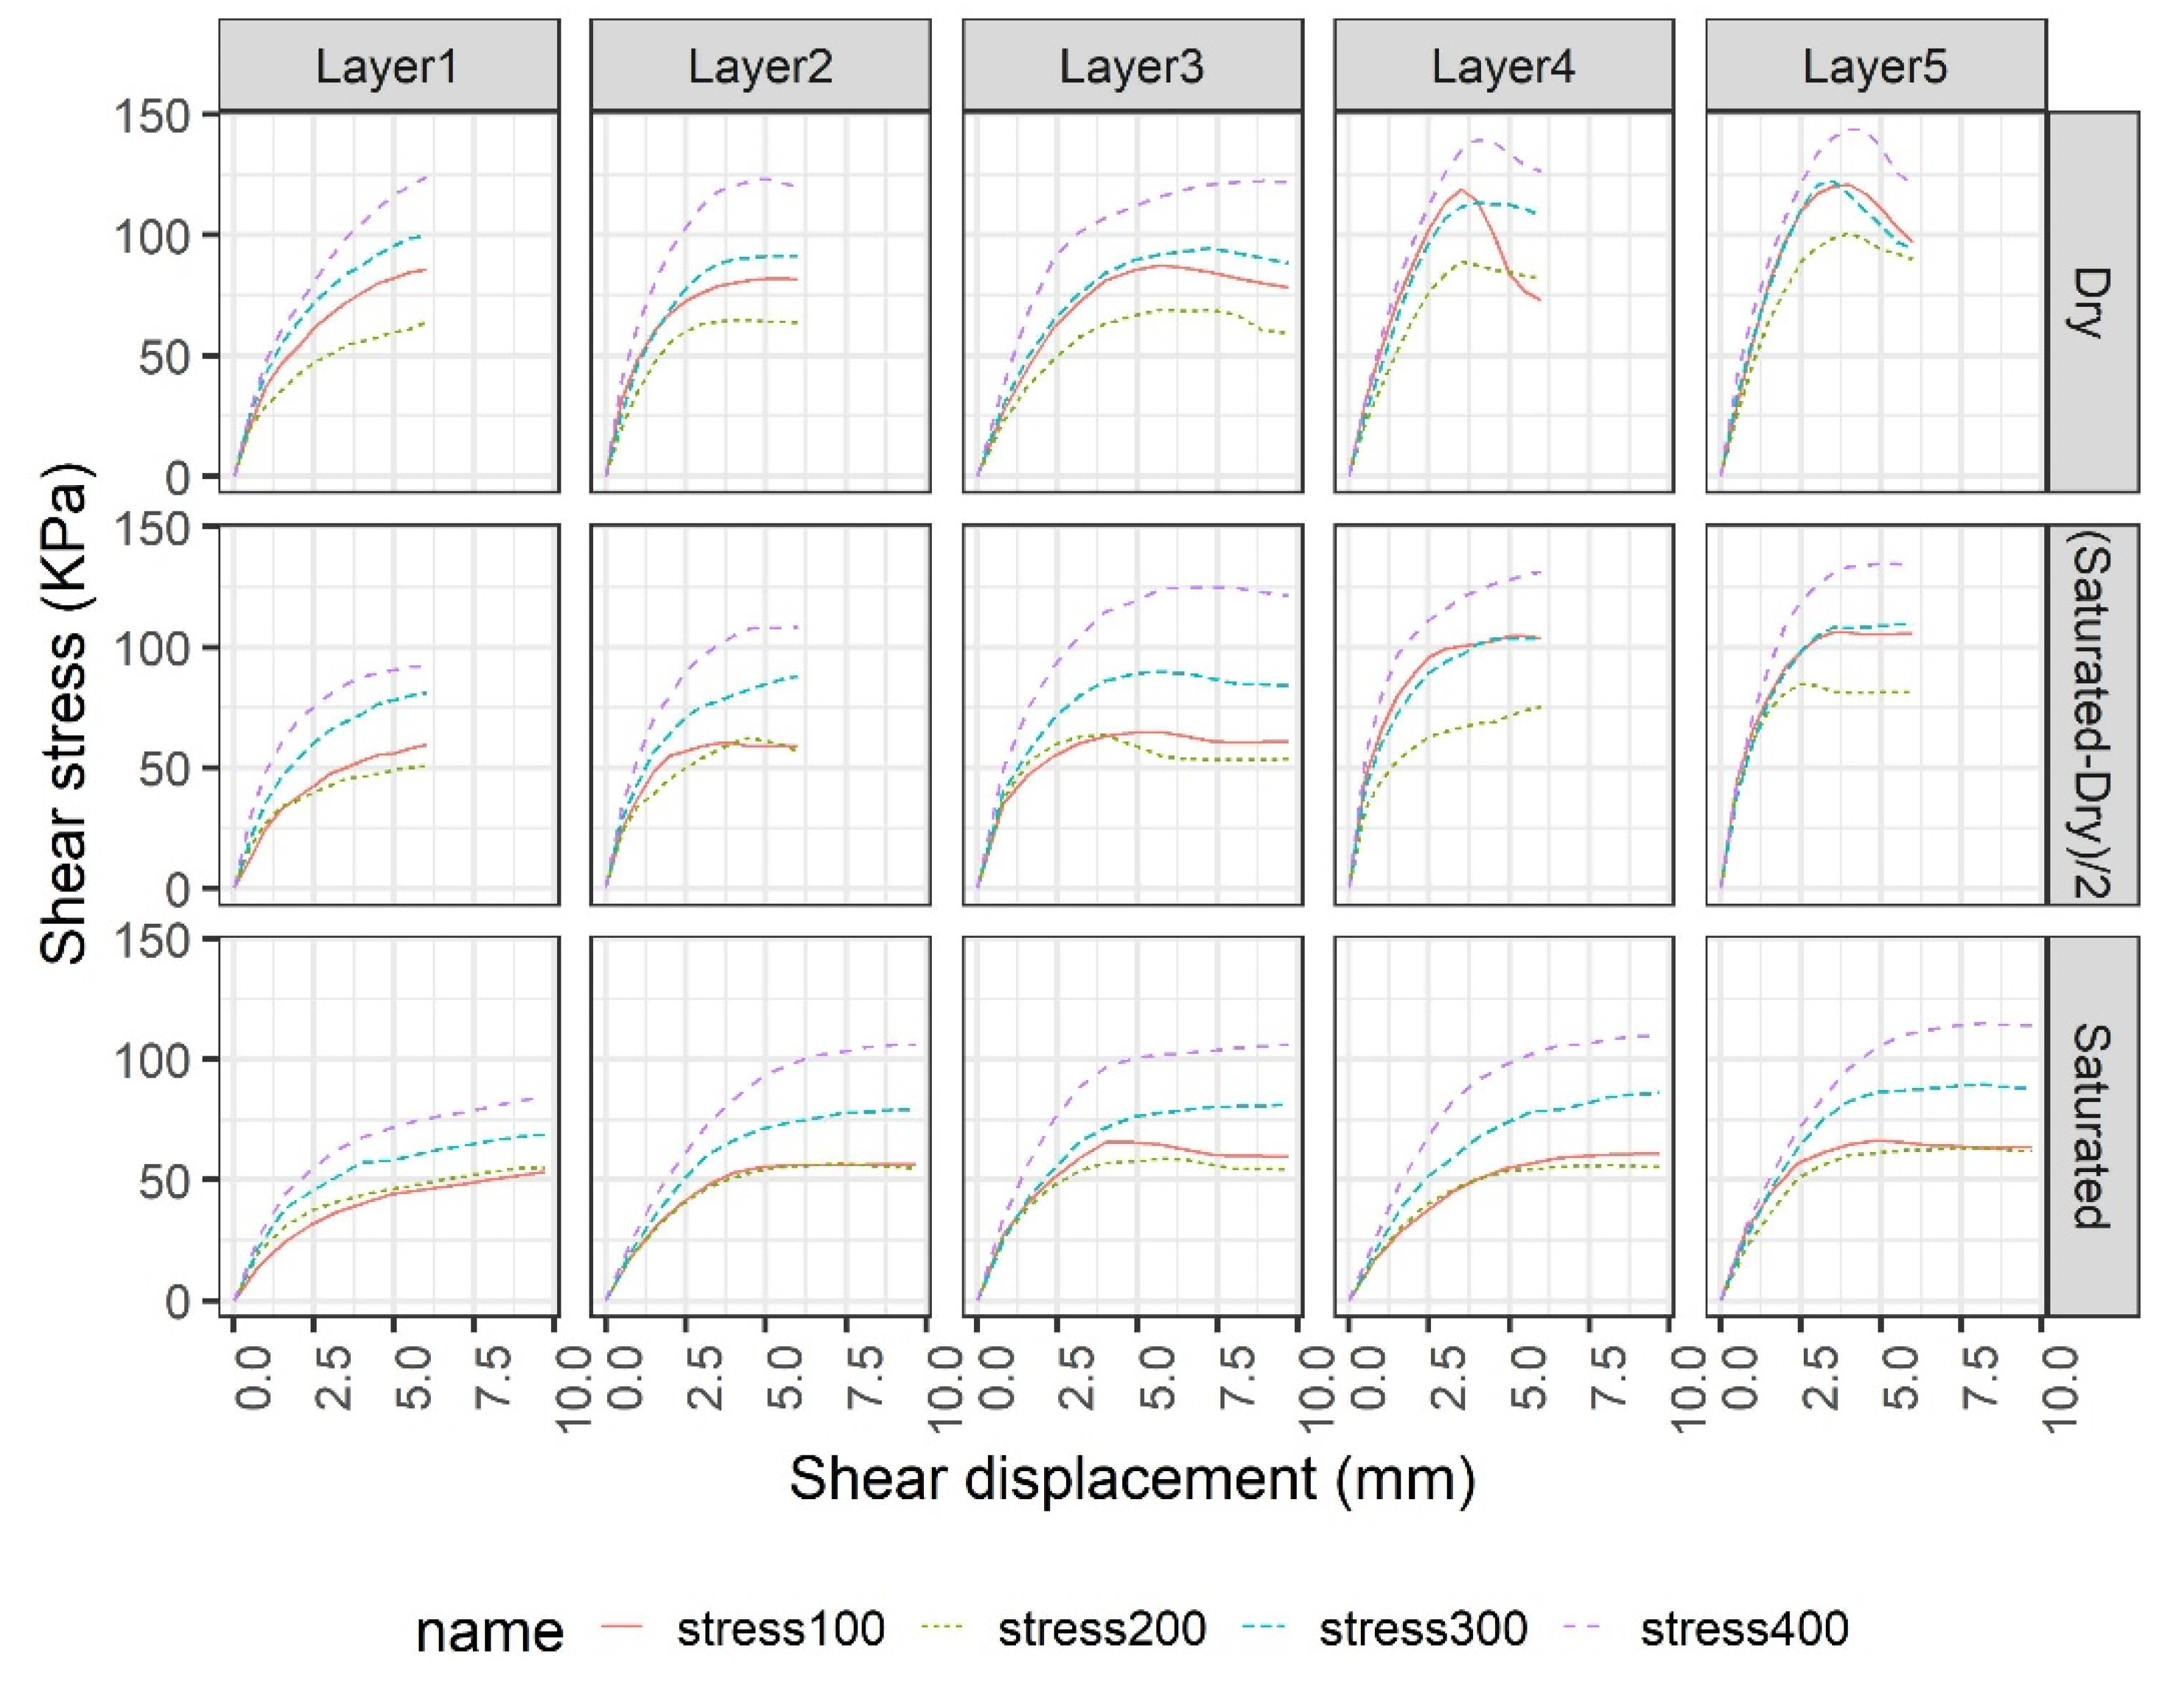
The stress increased frictional force between soil particles and enhanced resistance to shear failure. Under constant stress, the shear stress of soil is linearly related to the normal stress of the section, which can be described by the Mohr–Coulomb formula [33]:
τ = Cq + σ tan ψq
where τ is the shear stress (kPa); Cq is the cohesion (kPa); σ is the normal stress on the failure surface (kPa); ψq is the angle of internal friction (°); and tan ψq represents the friction coefficient; and φ are determined by soil properties, which are defined as soil shear stress parameters.
(3)
The liquid and plastic limits of every soil sample were measured by using a liquid–plastic limit tester. The plasticity index was determined according to the liquid and plastic limits (Equation (2)).
wLp = IPLwp
where wLp is the plasticity index, IPL is the liquid limit (%), wp is the plastic limit (%).
(4)
For every soil sample, soil cylinders in stainless steel sample retainers were submitted to three water absorption and desiccation processes in 20 to 30 °C. The soil was weighted with a table balance every 30 min in the water absorption process and every 3 days in the desiccation process to determine the SWC. At the same time, the height of the soil sample was measured using a caliper. This study hypothesizes that a zero shrink–swell ratio appears when the SWC is minimal. The shrink–swell (SSR) was computed according to Equation (3).
S S R = h i h 0 h 0 × 100 %
where SSR is the shrink–swell ratio (%), hi is the height of soil at i time (0.1 mm), h0 is the height of soil at the start (0.1 mm).

2.3.2. Experimental Analysis of Distributed Soil

The mixed soil samples were air-dried and sieved to remove stone friction (>2 mm diameter), and these mixed soil samples were used to analyze particle composition, mineral components and clay mineral components. The mechanical composition was determined using the sieving and pipette method [34]. Soil oxide compositions (SiO2, Fe2O3) were measured using the lithium carbonate–boric acid melting method [32]. The type and relative contents of primary minerals were determined using an X-ray diffractometer (XRD) [35].

2.4. Statistical Analysis

The figures of soil properties and SSRs were drawn by using originPro 9.0. The differences in all soil properties of different soil layers were compared. Pearson’s correlation analysis was used to determine the correlation coefficients between soil parameters and the shrink–swell ratio. Stepwise regression analysis was employed to analyze the relationship between maximum and average soil shrink–swell ratio and other soil parameters. All tests were performed using the statistical software MATLAB 2010.

3. Results

3.1. Change of Soil Properties with Depth

Table 1 lists the basic properties of granite residual soil at different depths. BD increased with soil depth, which ranged from 1.44 g cm−3 to 1.79 g cm−3. The coarse particle content (0.25–2 mm) increased from 12.9% to 24.3% with depth, while the clay particle content (<0.002 mm) decreased from 27.0% to 11.2%, indicating that the soils at the surface are more weathered than those closer to the parent material. Overall, with increased depth, the quartz content decreased, and the clay content increased overall. Despite this prevailing trend, there is an outlier occurrence of illite in Layer 3. Plasticity indexes wL17 and wL10, the plastic limit (wp), and liquid limits IP17 and IP10 all generally decreased with depth, with the exception of the outlier values observed in Layer 3.
Figure 2a–c shows the changes in the soil cohesion (Cq), angle of internal friction (ψq), and shear stress (τ) for the different soil layers with variable water contents. All three indicators exhibited strong negative correlations with the SWC and significant variations among the different soil layers. For example, every 1% decrease in the water content resulted in a shear stress reduction of 6.62 kPa. These parameters were positively correlated with depth, because the SWC was higher at the surface.

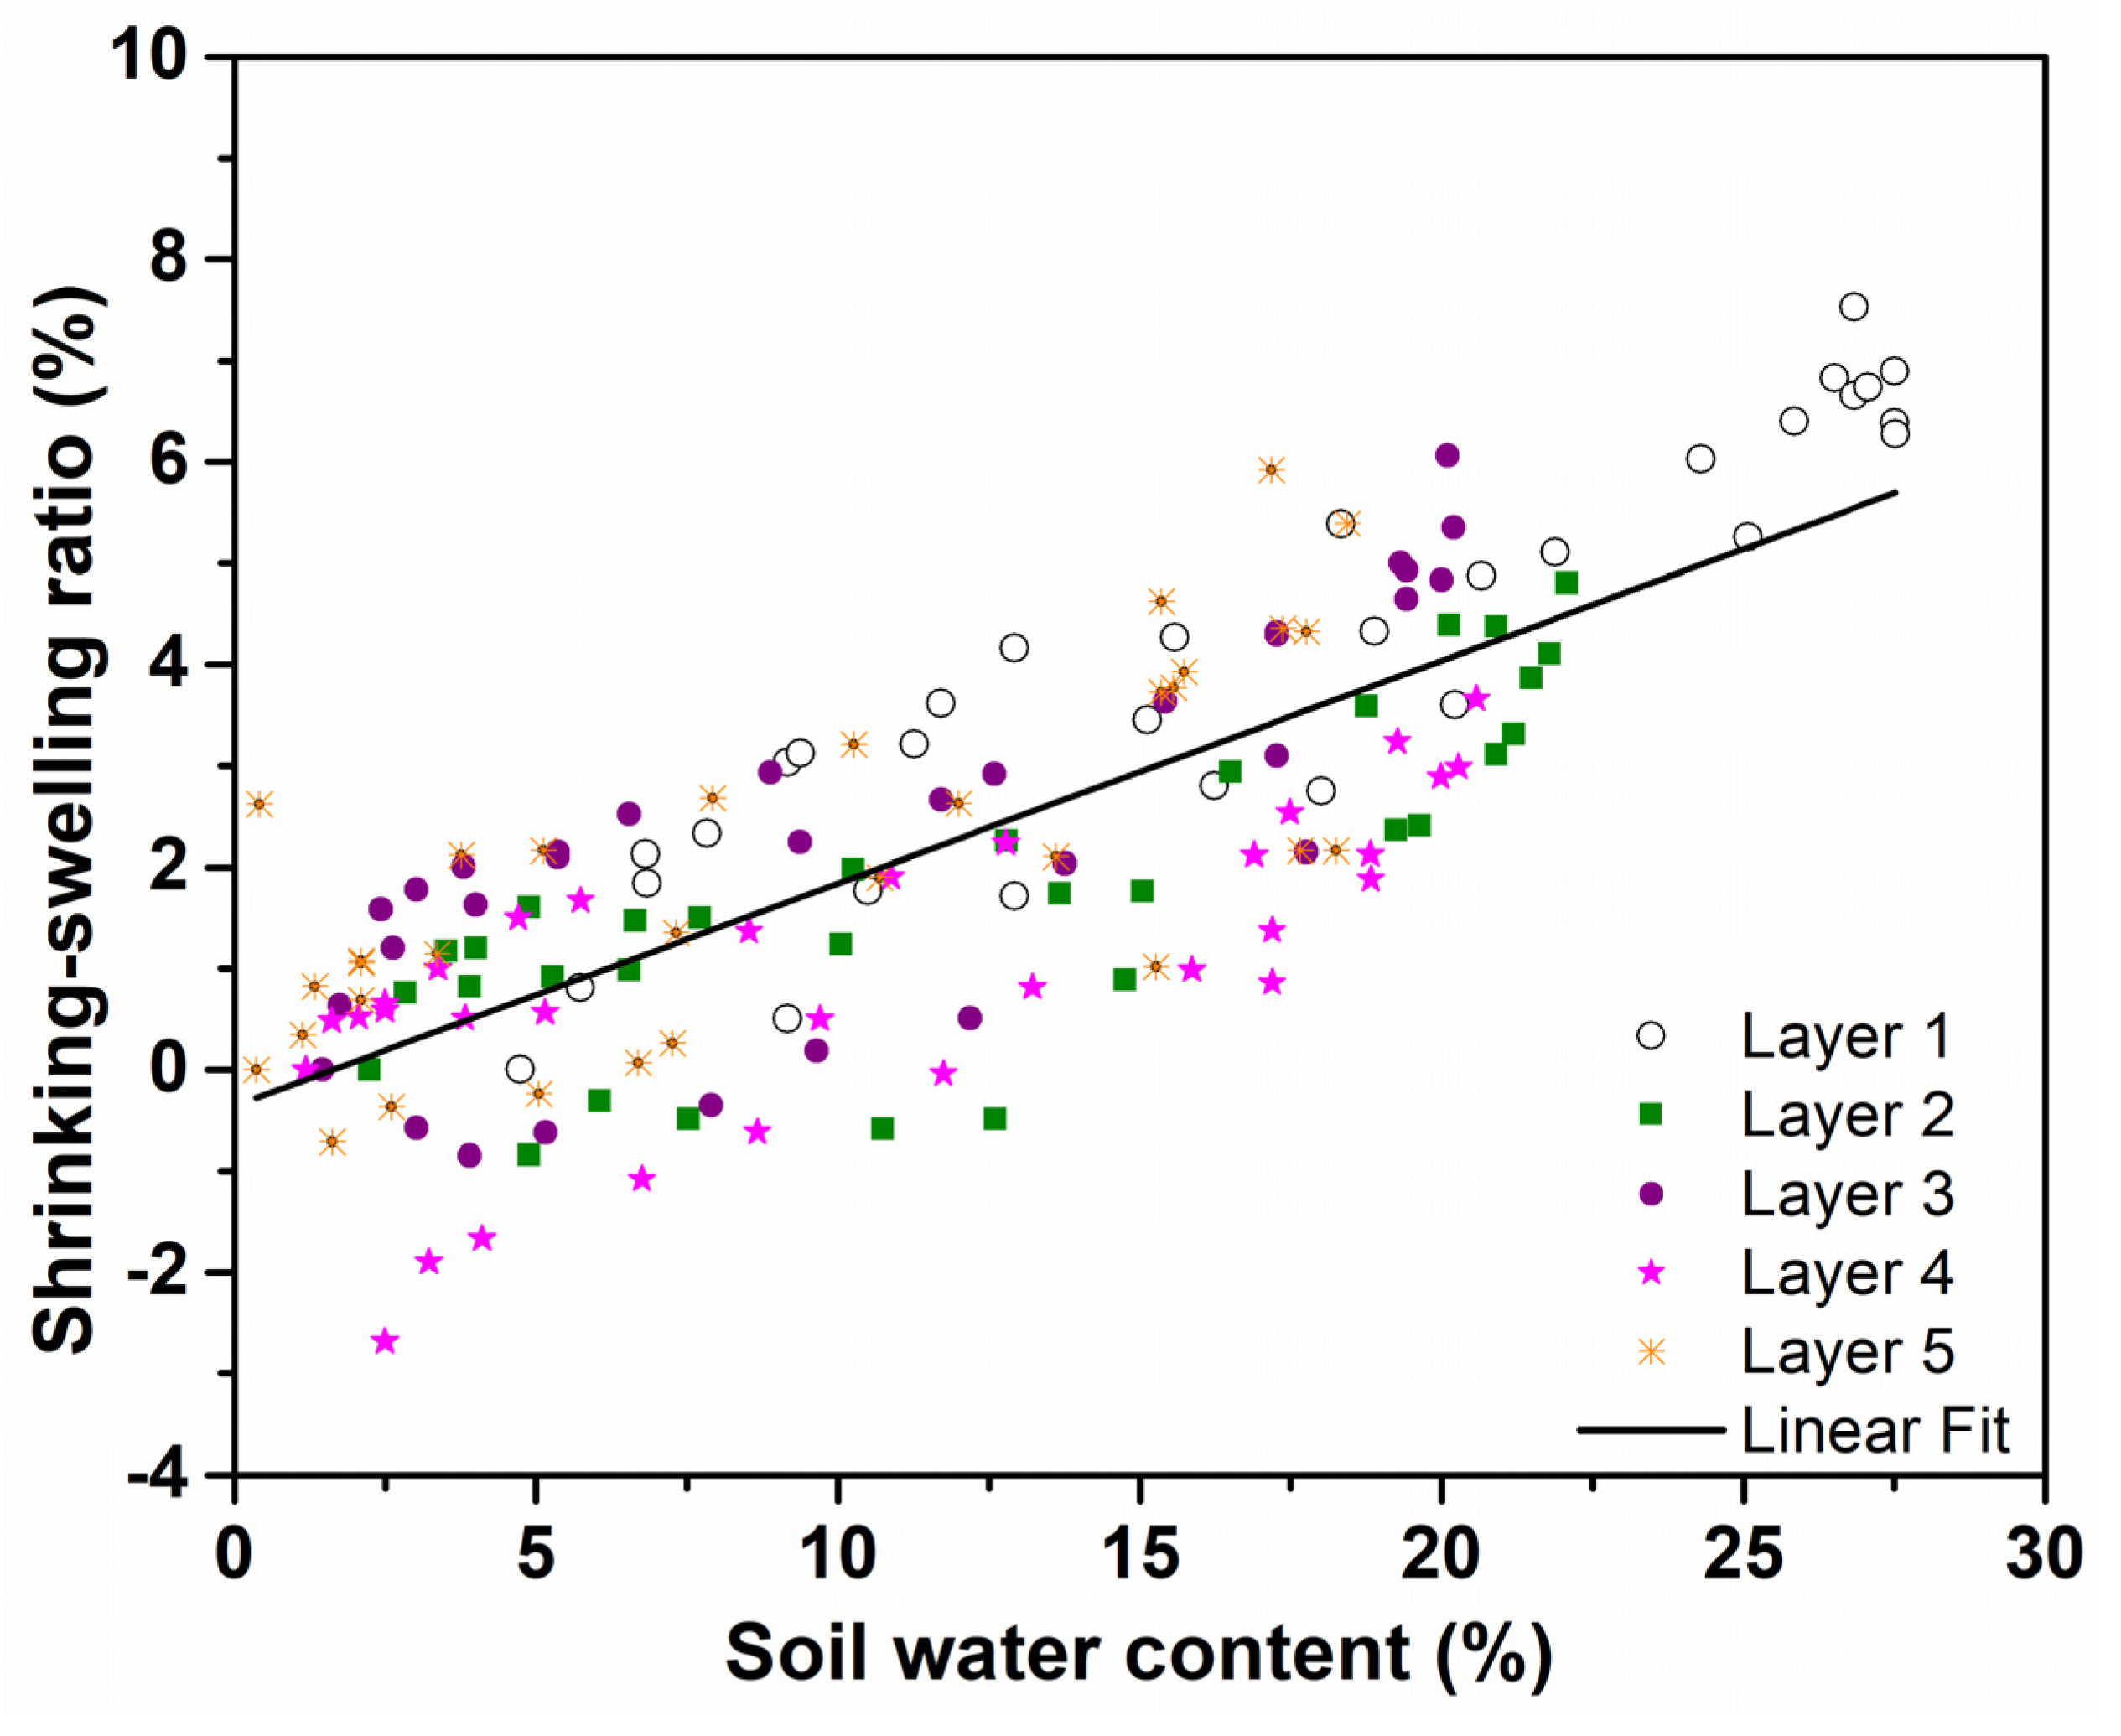
3.2. Variation in the Shrink–Swell Ratio during Three Dry–Wet Cycles

Figure 3 shows the SSR variation in samples from the five soil layers during three dry–wet cycles. The SSR values exhibited period variations during the three dry–wet cycles; the shrinking process was relatively slow, while the swelling process was relatively fast. There were significant differences in maximum SSR values among samples from the five soil layers, while their minimum values were relatively similar. For the maximum SSR values, the layer ranking order was Layer 1 (7.53%) > Layer 3 (6.06%) > Layer 5 (5.92%) > Layer 2 (4.81%) > Layer 4 (3.66%). The magnitude of the maximum and minimum SSR values decayed with each cycle.

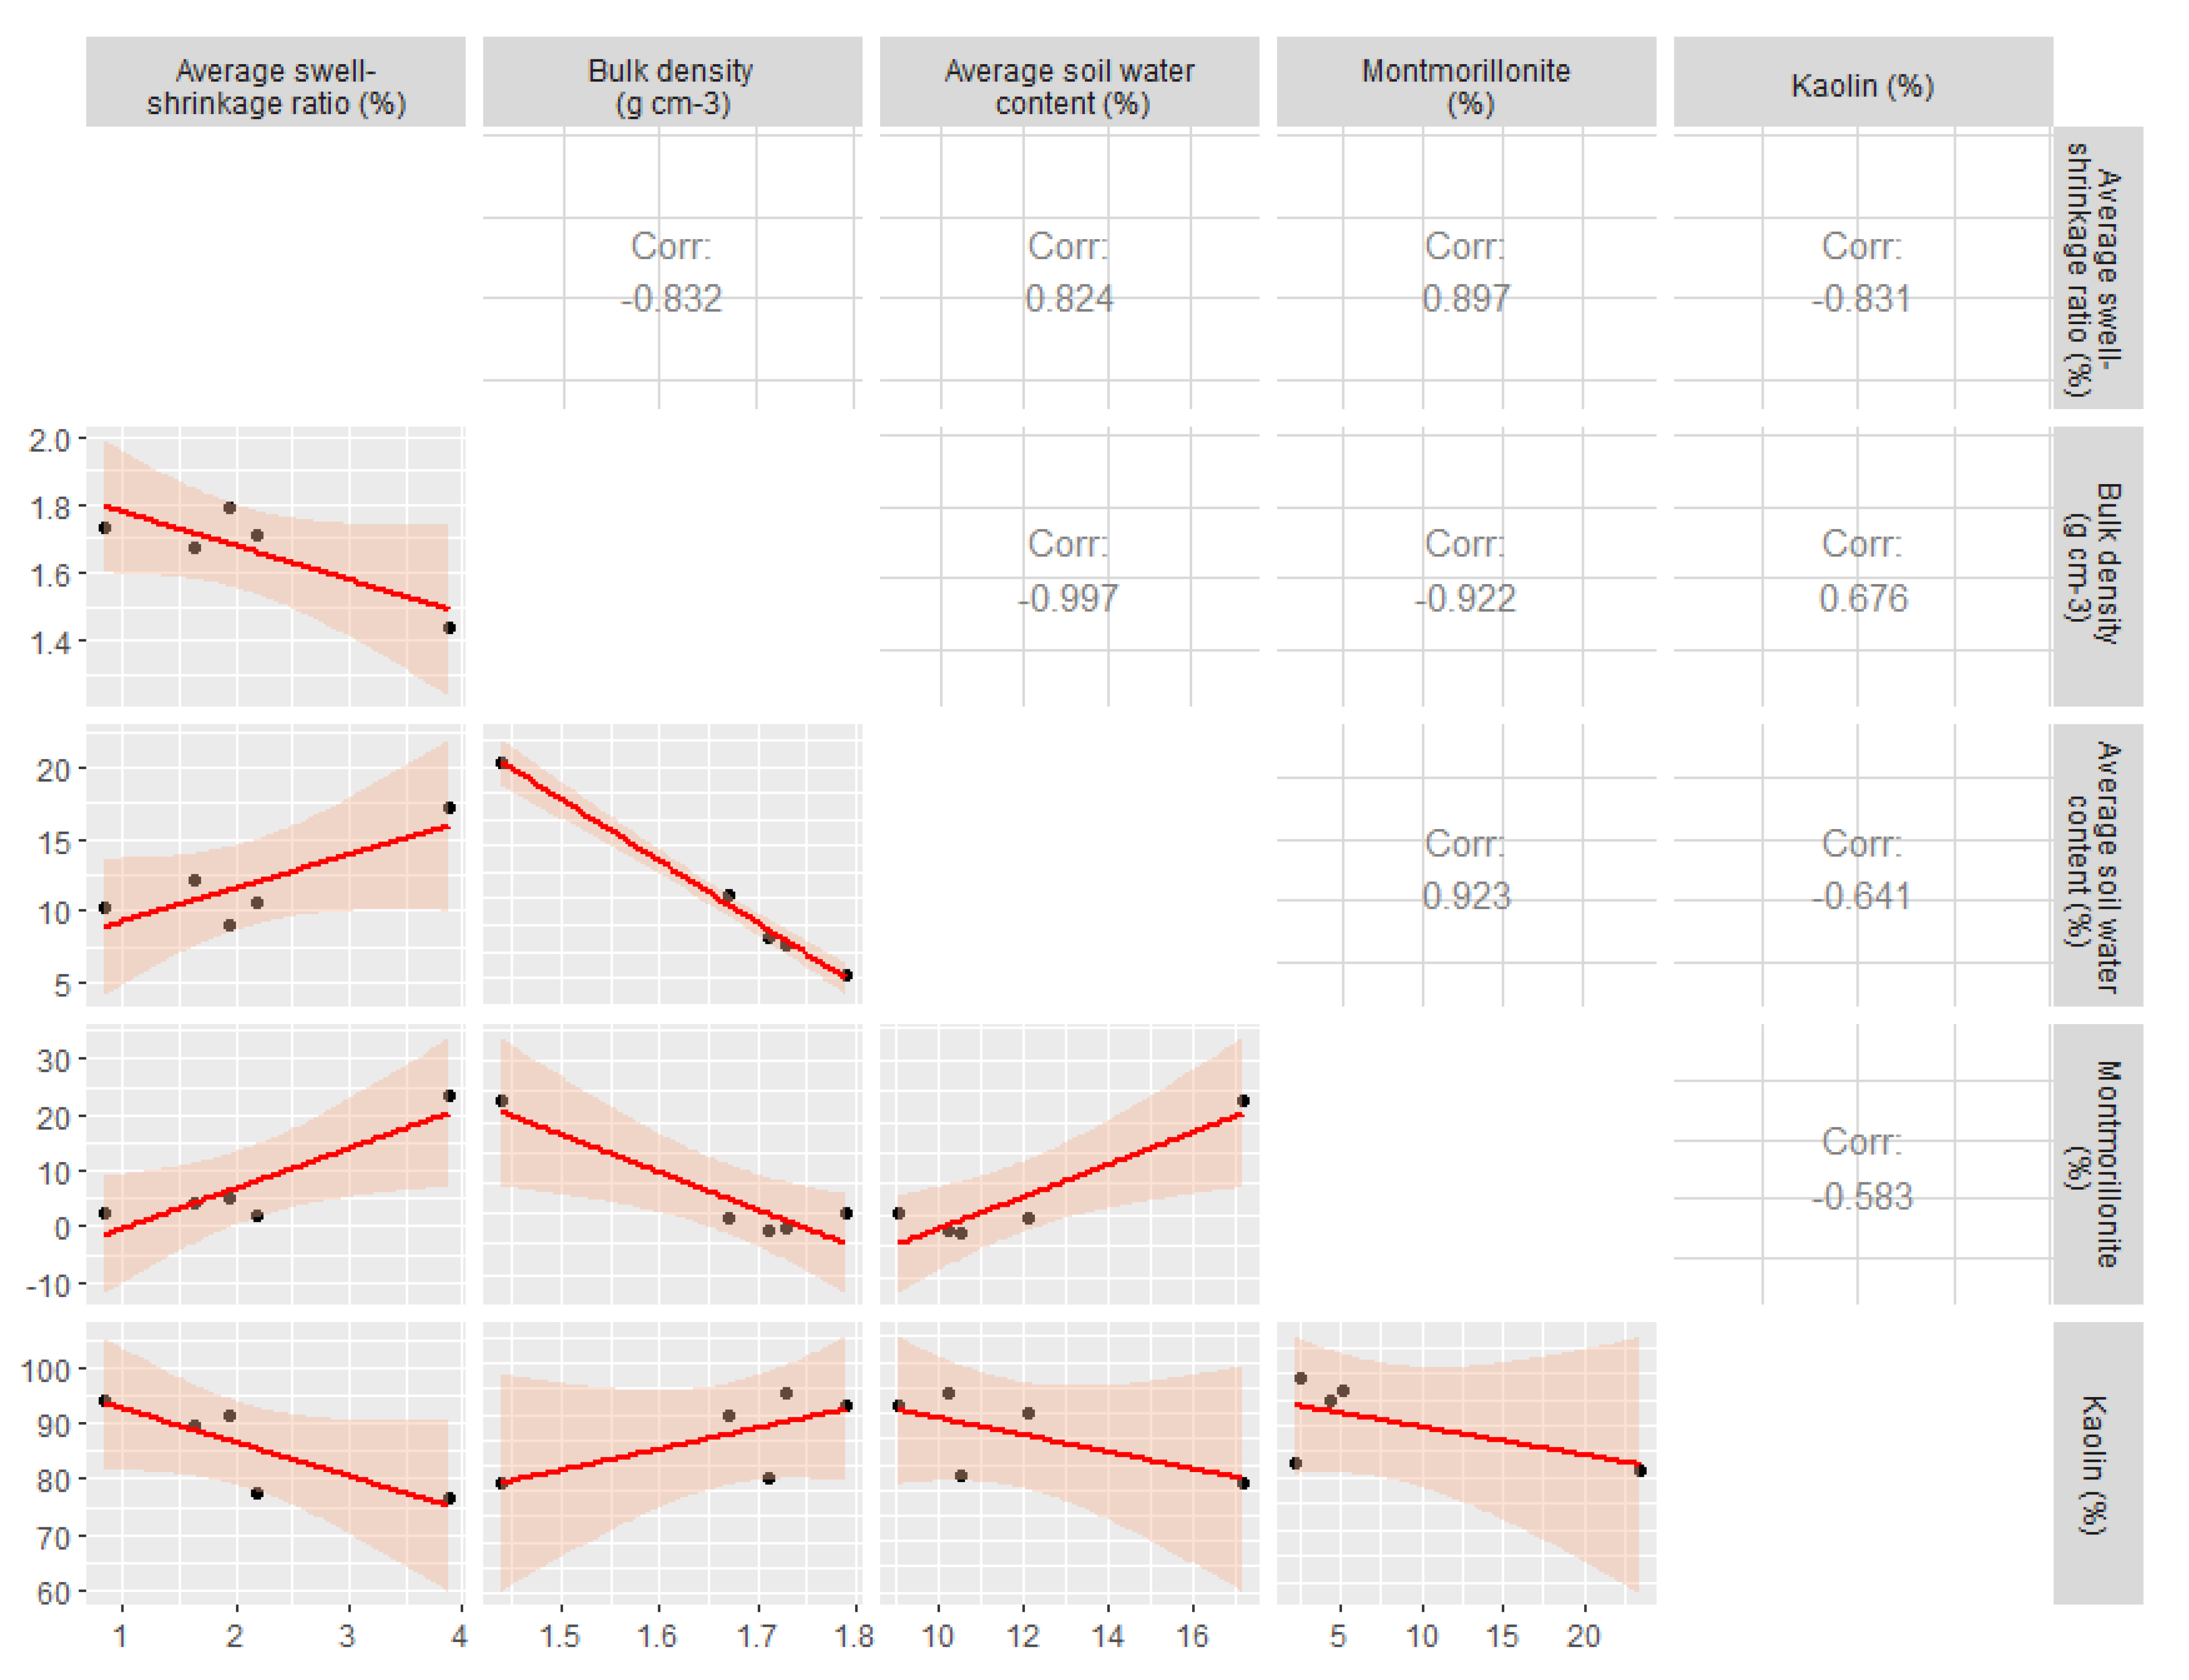
3.3. Correlation between the Shrink–Swell Ratio and Soil Parameters

We computed the maximum and average SSR values, as well as the average values for twelve other soil parameters; the correlation matrix for these parameters is shown in Table 2. Some parameters exhibited significant correlations with others, including the maximum SSR value with kaolin content (p < 0.05), the average SSR value with montmorillonite content (p < 0.01), and the average SSR value with BD, the average SWC, and kaolin content (p < 0.05). Because the average SSR had a strong relationship with the maximum SSR (p < 0.01), it is a good proxy for the maximum SSR value of granite soils in southern China.

3.4. Controlling Factor of the Shrink–Swell Ratio

The parameters that had the strongest correlation with the average SSR value, as well as the strength of the correlation between BD and the average SWC, are shown in Figure 4. The average SSR exhibited a strong positive correlation with the average SWC, because it was inversely related to BD, and BD was positively related to the average SWC. The changing trend between kaolin and montmorillonite was also opposite. Out of all of these parameters, the relationship between the average SSR value and the montmorillonite content had the strongest correlation and the smallest confidence interval; based on these statistical analyses, we assume that the montmorillonite content exerts the strongest influence over the soil SSR value.
While the soil BD, montmorillonite content, and kaolin content values were relatively consistent between the different soil layers, the SWC changed quickly during rainfall events and slowly during the drying process. Figure 5 shows how the SWC affects the SSR values. The SSR values exhibited strong variation between the five soil layers, with the SSR value being much higher in Layer 1 than it was in the other four layers. While the SSR values varied between the five layers, they all followed similar trends with respect to the SWC.

4. Discussion

4.1. Explanation on the Change of Shrink–Swell Ratio of Granite Residual Soil

Our attention is inconsistent with other studies, which pay more attention to the shrinkage process (e.g., Leong and Wijaya [16]; Mishra et al. [20]). Our results cast a new light on a continuous quick-swelling and slow-shrinking processes of granite residual soil. This was also found by Lin [26], in which the swelling of surface soil was stable at about 0.5 h, and its shrinkage at more than 36 h. Another paper found higher swelling and lower shrinkage in granite residual soil. To reduce these errors, the SSR range of five soil layers is displayed in Figure 6. It shows that: (1) the SSR range except for Layer 2 reduces with the increase in soil depth; (2) the SSR difference ranging between 5.6% and 7.5% is less than the expansive soil (Stoltz et al. [14]) or clayey soil (Kalkan [12]).
The relatively low SSR is caused by the low quantity of clay minerals (e.g., illite, montmorillonite). Liang et al. [36] thought that soil moisture easily reached saturation and exceeded the plastic limit of the soil during rainfall, the soil swelled, and the shear thus stress rapidly reduced. When the water content increased to 35%, the soil’s shear stress decreased by 60% [36]. The relationship between shear stress and shear displacement at the different normal stress in Figure 7 shows that once water content was increased, shear stress became smaller and shear displacement became larger. In addition, shear stress increased with depth at the same shear displacement.

4.2. Effects of Shrink–Swell of Granite Residual Soil on Gully Development

When the rainfall intensity is greater than 15–20 mm h−1, it can have a significant impact on weathered granite soils [37]. During rainfall events, the shrink–swell process results in crack development (Figure 1d–f). Cracks develop along the gully wall (Figure 1d) when rain infiltrates the soil, reduces the soil shear stress, and increases the overriding soil weight [27]. With enough rain, cracks can widen into pipes (Figure 1e) or result in slides (Figure 1f). These slides typically move very quickly, but obstacles or other obstructions can reduce the slide velocity (Figure 1f). Once the energy of rain and runoff exceeds the resistance of obstacles, the gully develops further. Liu et al. [3] proved that two gully retreat rates were 0.46 and 1.10 m yr−1, respectively, which resulted from mass movement triggered by gravity and soil saturation. This illustrates that the velocity of crack development and gully evolution can also be affected by soil saturation. As a result, analyzing crack formation and propagation can provide us with valuable information about the gully development process. Consequently, it is very necessary to study the shrink–swell process and crack formation and propagation for understanding the mechanism of gully erosion.

5. Conclusions

This study measured the shrink–swell behavior of granite residual soil deposited between 0.3 m to 16 m subjected to three dry–wet cycles. Some effects of soil properties and environmental factors in southern China were analyzed. The following conclusions were obtained: (1) Soil cohesion, angle of internal friction, and shear stress had a strong linear relationship with water content. (2) SSR was reduced with the increase in soil depth. BD, water content, kaolinite, and montmorillonite had a very close correlation with SSR. (3) The SWC was the main factor affecting shear stress and the SSR of weathered granite soils. As the water content increased, shear stress decreased, and shear displacement increased. The shrink–swell process promotes crack formation, crack propagation, and gully development in weathered granite soils. We recommend that crack formation and propagation, and spatial distribution of cracks in weathered granite soils of southern China be further explored in future studies in order to better understand the process and distribution characteristics of gully erosion in southern China.

Author Contributions

Data curation, J.L.; Writing—original draft, H.L.; Writing—review & editing, X.Z. and X.L. All authors have read and agreed to the published version of the manuscript.

Funding

This research was financially supported by Key R & D projects of Hubei Province (2021BAA186), National Natural Science Foundation of China (Grant No. 413101297).

Institutional Review Board Statement

Not applicable.

Informed Consent Statement

Not applicable.

Data Availability Statement

Not applicable.

Acknowledgments

We thank Georg Hörmann, Liang Liu and Wenting Wang for revising the manuscript.

Conflicts of Interest

The authors declare no conflict of interest.

References

  1. Poesen, J.; Nachtergaele, J.; Verstraeten, G.; Valentin, C. Gully erosion and environmental change: Importance and research needs. Catena 2003, 50, 91–133. [Google Scholar] [CrossRef]
  2. Bouchnak, H.; Felfoul, M.S.; Boussema, M.R.; Snane, M.H. Slope and rainfall effects on the volume of sediment yield by gully erosion in the Souar lithologic formation (Tunisia). Catena 2009, 78, 170–177. [Google Scholar] [CrossRef]
  3. Liu, H.; Qian, F.; Ding, W.; Gómez, J.A. Using 3D scanner to study gully evolution and its hydrological analysis in the deep weathering of southern China. Catena 2019, 183, 104218. [Google Scholar] [CrossRef]
  4. Chen, J.-L.; Zhou, M.; Lin, J.-S.; Jiang, F.-S.; Huang, B.-F.; Xu, T.-T.; Wang, M.-K.; Ge, H.-L.; Huang, Y.-H. Comparison of soil physicochemical properties and mineralogical compositions between noncollapsible soils and collapsed gullies. Geoderma 2018, 317, 56–66. [Google Scholar] [CrossRef]
  5. Chen, P.; Liu, X.; Yu, S.; Xu, J.; Hong, B.; Ma, J.; Ding, J.; Chen, Y.; Chen, Y.; Lu, C. Stability assessment of the restored Benggang units in a weathered granite crust region of South China. Ecol. Eng. 2022, 182, 106709. [Google Scholar] [CrossRef]
  6. Chertkov, V. Modelling the shrinkage curve of soil clay pastes. Geoderma 2003, 112, 71–95. [Google Scholar] [CrossRef]
  7. Tang, C.-S.; Zhu, C.; Leng, T.; Shi, B.; Cheng, Q.; Zeng, H. Three-dimensional characterization of desiccation cracking behavior of compacted clayey soil using X-ray computed tomography. Eng. Geol. 2019, 255, 1–10. [Google Scholar] [CrossRef]
  8. Chen, N.; Zhou, W.; Yang, C.; Hu, G.; Gao, Y.; Han, D. The processes and mechanism of failure and debris flow initiation for gravel soil with different clay content. Geomorphology 2010, 121, 222–230. [Google Scholar] [CrossRef]
  9. Vanmaercke, M.; Poesen, J.; Van Mele, B.; Demuzere, M.; Bruynseels, A.; Golosov, V.; Bezerra, J.F.R.; Bolysov, S.; Dvinskih, A.; Frankl, A.; et al. How fast do gully headcuts retreat? Earth-Sci. Rev. 2016, 154, 336–355. [Google Scholar] [CrossRef]
  10. Peng, X.; Horn, R.; Peth, S.; Smucker, A. Quantification of soil shrinkage in 2D by digital image processing of soil surface. Soil Tillage Res. 2006, 91, 173–180. [Google Scholar] [CrossRef]
  11. Krisdani, H.; Rahardjo, H.; Leong, E. Effects of different drying rates on shrinkage characteristics of a residual soil and soil mixtures. Eng. Geol. 2008, 102, 31–37. [Google Scholar] [CrossRef]
  12. Kalkan, E. Impact of wetting–drying cycles on swelling behavior of clayey soils modified by silica fume. Appl. Clay Sci. 2011, 52, 345–352. [Google Scholar] [CrossRef]
  13. Chertkov, V. Physical modeling of the soil swelling curve vs. the shrinkage curve. Adv. Water Resour. 2012, 44, 66–84. [Google Scholar] [CrossRef] [Green Version]
  14. Stoltz, G.; Cuisinier, O.; Masrouri, F. Multi-scale analysis of the swelling and shrinkage of a lime-treated expansive clayey soil. Appl. Clay Sci. 2012, 61, 44–51. [Google Scholar] [CrossRef]
  15. Fernandes, M.; Denis, A.; Fabre, R.; Lataste, J.-F.; Chrétien, M. In situ study of the shrinkage-swelling of a clay soil over several cycles of drought-rewetting. Eng. Geol. 2015, 192, 63–75. [Google Scholar] [CrossRef]
  16. Leong, E.; Wijaya, M. Universal soil shrinkage curve equation. Geoderma 2015, 237–238, 78–87. [Google Scholar] [CrossRef]
  17. Zolfaghari, Z.; Mosaddeghi, M.; Ayoubi, S. Relationships of soil shrinkage parameters and indices with intrinsic soil properties and environmental variables in calcareous soils. Geoderma 2016, 277, 23–34. [Google Scholar] [CrossRef]
  18. Houben, M.; Barnhoorn, A.; Peach, C.; Drury, M. Potential permeability enhancement in Early Jurassic shales due to their swelling and shrinkage behavior. Int. J. Coal Geol. 2018, 196, 115–125. [Google Scholar] [CrossRef]
  19. Fang, H.; Zhang, Z.; Li, D.; Liu, K.; Zhang, K.; Zhang, W.; Peng, X.; Zhou, H. Temporal dynamics of paddy soil structure as affected by different fertilization strategies investigated with soil shrinkage curve. Soil Tillage Res. 2019, 187, 102–109. [Google Scholar] [CrossRef]
  20. Mishra, P.N.; Scheuermann, A.; Bore, T.; Li, L. Salinity effects on soil shrinkage characteristic curves of fine-grained geomaterials. J. Rock Mech. Geotech. Eng. 2019, 11, 181–191. [Google Scholar] [CrossRef]
  21. Zenero, M.D.O.; Grimaldi, M.; Cooper, M. Variability in soil shrinkage along forest and pasture toposequences in Amazonia. Geoderma 2019, 338, 291–301. [Google Scholar] [CrossRef]
  22. Zúñiga, F.; Horn, R.; Rostek, J.; Peth, S.; Uteau, D.; Dörner, J. Anisotropy of intensity–capacity parameters on Aquands with contrasting swelling–shrinkage cycles. Soil Tillage Res. 2019, 193, 101–113. [Google Scholar] [CrossRef]
  23. Feng, M.H.; Liao, C.Y.; Li, S.X.; Lu, S.L. Investigation on status of hill collapsing and soil erosion in southern China. Yangtze River 2009, 40, 66–68, 75. (In Chinese) [Google Scholar]
  24. Li, S.X.; Gui, H.Z.; Ding, S.W. Features of special layout of hill collapse in South China. J. Huazhong Agric. Univ. 2013, 32, 83–86. (In Chinese) [Google Scholar]
  25. Zhang, X.M.; Ding, S.W.; Cai, C.F.; Liu, J.B. Mechanism of effects of wetting–drying on nonuniform settlement and caved wall collapse in slope disintegration erosion area. Rock Soil Mech. 2013, 32 (Suppl. S2), 299–305. (In Chinese) [Google Scholar]
  26. Lin, J.L. Study on the expansion and contraction characteristics of red soil layer in Benggang of granite area. J. Soil Water Conserv. 2019, 33, 87–92. (In Chinese) [Google Scholar]
  27. Zhang, Y.; Zhong, X.; Lin, J.; Zhao, D.; Jiang, F.; Wang, M.-K.; Ge, H.; Huang, Y. Effects of fractal dimension and water content on the shear strength of red soil in the hilly granitic region of southern China. Geomorphology 2020, 351, 106956. [Google Scholar] [CrossRef]
  28. Duan, X.; Deng, Y.; Tao, Y.; He, Y.; Lin, L.; Chen, J. The soil configuration on granite residuals affects Benggang erosion by altering the soil water regime on the slope. Int. Soil Water Conserv. Res. 2021, 9, 419–432. [Google Scholar] [CrossRef]
  29. Huang, W.-X.; Deng, Y.-S.; Cai, C.-F.; Jiang, D.-H. Effects of soil shrinkage in permanent gullies formation: The case of Benggang erosion in the granite area of southern China. J. Mt. Sci. 2021, 18, 2328–2344. [Google Scholar] [CrossRef]
  30. Liu, X.; Zhang, X.; Kong, L.; Wang, G.; Liu, H. Formation mechanism of collapsing gully in southern China and the relationship with granite residual soil: A geotechnical perspective. Catena 2022, 210, 105890. [Google Scholar] [CrossRef]
  31. Chen, Z.C.; Gong, Z.T.; Zhang, G.L.; Zhao, W.J. Correlation of soil taxa between Chinese soil genetic classification and Chinese soil taxonomy on various scales. Soil 2004, 36, 584–595. [Google Scholar]
  32. Institute of Soil Science, the Chinese Academy of Science (ISSCAS). Soil Chemical and Physical Analysis; Shanghai Science and Technology Press: Shanghai, China, 1981. [Google Scholar]
  33. Lin, H.; Hua, Y.S.; Yong, R.; Lei, D.X.; Xu, W.Z.; Du, S.G. Strength parameters of rock considering area and stress correction during shearing. Geotech Geol Eng 2020, 38, 961–970. [Google Scholar] [CrossRef]
  34. Gee, G.W.; Bauder, J.W. Particle size analysis. In Methods of Soil Analysis, Part 1; Agronomy Monographs 9; Klute, A., Ed.; American Society of Agronomy: Madison, WI, USA, 1986. [Google Scholar]
  35. Li, X.Y. Soil Chemistry and Experimental Guidance; China Agricultural Press: Beijing, China, 1997. [Google Scholar]
  36. Liang, Y.; Ning, D.H.; Pan, X.Z.; Li, D.C.; Zhang, B. The characteristics and control of the collapsing gullies in the red soil area of South China. SWCC 2009, 1, 31–34. (In Chinese) [Google Scholar]
  37. Zhang, J.W.; Yao, J.Y. Studies on Slopeland in the Southern China; Science Press: Beijing, China, 1994. (In Chinese) [Google Scholar]
Figure 1. The location of Zuoma small catchment (a), the sampled gully (b), sampling points (c), and exhibition of crack (d), pipe (e), and slide (f) along the gully wall in Yudu county, Jiangxi province.
Applsci 12 11200 g001
Figure 2. Variations of Cq (a), ψq (b), and shear stress (c) with soil water content at five soil layers. The points in the green circle are not included in the linear fit.
Applsci 12 11200 g002
Figure 3. SSR of five layers during 3 dry–wet cycles.
Applsci 12 11200 g003
Figure 4. The correlation matrix among five good correlation indicators.
Applsci 12 11200 g004
Figure 5. The relationship between shrink–swell ratio and soil water content.
Applsci 12 11200 g005
Figure 6. Range of shrink–swell ratio of the studied weathering profile.
Applsci 12 11200 g006
Figure 7. Shear stress–shear displacement relationship of five soil layers at the different saturated conditions.
Applsci 12 11200 g007
Table 1. Basic properties of soil samples.
Layer No.Depth (m)Bulk Density (g/cm3)Particle Composition (mm, %)Mineral Component (%) (Total 100%)Clay Mineral Component
(Total 100%)
wL17wL10wpIP17IP10
>22–0.250.25–0.002<0.002QuartzPyriteClay MineralKaoliniteIlliteMontmorillonite%
10.31.441.112.959.027.096.20.513.2976.57-23.4334.228.616.617.612.0
23.01.678.015.059.917.194.580.554.8789.845.764.3930.525.615.115.410.5
37.01.713.816.767.611.993.71-6.2977.720.082.2226.222.313.812.48.5
412.01.735.619.859.315.394.27-5.7394.173.292.5429.824.914.515.310.4
516.01.7912.524.352.011.289.42-10.5891.543.285.1825.721.913.612.18.3
Table 2. Correlation coefficient of shrink–swell ratio and the other 12 soil indicators.
ParameterMaximum SSRAverage SSRBDAverage SWC>2 mm<0.002 mmQuartzClay MineralKaoliniteMontmorillonitewL17wL10wpIP17IP10
Maximum SSR1
Average SSR0.96 **1.00
BD−0.64−0.83 *1.00
Average SWC0.630.82 *−1.00 **1.00
>2 mm−0.37−0.540.77−0.731.00
<0.002 mm0.500.72−0.97 **0.97 **−0.671.00
Quartz0.110.35−0.770.76−0.88 *0.761.00
Clay mineral−0.14−0.380.80 *−0.790.85 *−0.79−1.00 **1.00
Kaolinite−0.82 *−0.83 *0.68−0.640.74−0.47−0.470.471.00
Montmorillonite0.760.90 **−0.92 **0.92 **−0.550.91 **0.49−0.52−0.581.00
wL170.250.50−0.88 *0.90 **−0.640.96 **0.82 *−0.85 *−0.280.781.00
wL100.280.53−0.90 **0.91 **−0.640.97 **0.82 *−0.85 *−0.300.791.00 **1.00
wp0.420.66−0.95 **0.96 **−0.650.99 **0.79−0.83 *−0.420.86 *0.98 **0.99 **1.00
IP170.150.42−0.84 *0.85 *−0.620.93 **0.83 *−0.85 *−0.200.720.99 **0.99 **0.95 **1.00
IP100.160.43−0.84 *0.86−0.620.94 **0.83 *−0.85 *−0.210.731.00 **0.99 **0.96 **1.00 **1.00
Note: ** p < 0.05, * p < 0.01.
Publisher’s Note: MDPI stays neutral with regard to jurisdictional claims in published maps and institutional affiliations.

