Article

Quantitative Analysis on the Proportion of Renewable Energy Generation Based on Broadband Feature Extraction

1
State Key Laboratory of Smart Grid Protection and Control, Nari Group Corporation, Nanjing 211106, China
2
School of Instrument Science and Engineering, Southeast University, Nanjing 210096, China
3
School of Electrical Engineering, Southeast University, Nanjing 210096, China
4
Department of Industrial Engineering, University of Padova, 35131 Padova, Italy
*
Author to whom correspondence should be addressed.
Appl. Sci. 2022, 12(21), 11159; https://doi.org/10.3390/app122111159
Submission received: 12 October 2022 / Revised: 30 October 2022 / Accepted: 2 November 2022 / Published: 3 November 2022
(This article belongs to the Special Issue Advancing Grid-Connected Renewable Generation Systems 2021-2022)

Abstract

:
With the massive access of distributed renewable energy sources, many uncertain renewable energy power components have been added to the low-voltage lines in substations in addition to the loads of definite classification. From the perspective of economy and cleanliness, it is necessary to quantitatively analyze the renewable energy share among them and improve the power quality level of users. For the power quality information at low-voltage feeders, this paper proposes a quantitative analysis algorithm based on improved wavelet energy entropy and LSTM neural network. The method is based on wavelet transform, based on sym8 wavelet basis function; it divides the long time sequence into equal-length small time sequences, calculates each feature component obtained from wavelet transform decomposition separately, then borrows the concept of information entropy to find its energy entropy. After obtaining the energy entropy sequence of each feature component, it then borrows the concept of kurtosis to weighted differentiation of each energy entropy sequence to highlight the feature information and finally, uses the LSTM neural network to classify the power quality information of different renewable energy sources to determine to which interval segment they belong. By building a simulation model to simulate the actual data in the field, the percentage of renewable energy can be quantitatively analyzed efficiently and accurately.

1. Introduction

The natural environment and energy tension are the main issues facing the global economic development at this stage. On the basis of the basic requirement of ecological environmental protection as well as the goal of carbon neutrality, the cleanliness of China’s electricity continues to accelerate, and renewable energy, mainly wind power and photovoltaic power, will see accelerated development. Considering the process of economic globalization, some large enterprises focus on the cleanliness of electricity when purchasing electricity and are committed to using electricity with low pollution levels. Therefore, this puts forward higher data mining requirements for power system dispatching [1,2].
In order to improve the macro economy and enhance the development of these industries, it is necessary to be able to grasp the power consumption attributes, power consumption scale, and energy consumption trend more accurately at the dispatching side. Therefore, there is an urgent need to study the macroscopic load identification method at the station side to realize the control of energy-using groups and their proportion by dispatch [3].
To quantitatively analyze the share of renewable energy generation from the load side, the collected data information needs to be analyzed and processed firstly to extract its features from the broadband spectrum. Fourier transform is one of the most basic frequency domain analysis methods, whose function is to reflect the overall information of the signal at a certain time by finding the spectrum of the original signal [4]. However, it cannot reflect the local characteristics of the signal and is not suitable for analyzing the power quality problems with fast changes and short durations, such as transient pulses and transient oscillations due to renewable energy access. In the literature [5], the short-time Fourier transform is used to obtain multiple short-time signals by sliding and adding windows to the signals, after which Fourier transform is performed separately to obtain the time-frequency characteristics of the signals; this improves, to some extent, the drawback that the Fourier transform cannot reflect the local characteristics, but it is not adaptive because the length of the selected time-frequency window is fixed. The wavelet transform is a multi-scale time–frequency transform that can reflect both the full process and local information of the signal, so it is widely used to analyze abrupt signals and unsteady signals [6], but there are problems, such as the difficulty of selecting the basis function. The literature [7] uses Hilbert–Huang transform, combining two algorithms of empirical mode decomposition and Hilbert transform, which has better adaptivity, but has disadvantages, such as modal confusion [8] and endpoint effects. Wavelet energy entropy [9,10] is an analysis algorithm that performs a secondary calculation of the feature vector, and the energy entropy of each component is obtained as a new feature vector with more obvious spectral characteristics by further analysis and calculation of the feature vectors obtained from the wavelet transform.
At present, algorithms involving quantitative analysis are less studied, using mostly machine learning methods. The more-frequently applied methods based on feature selection are population-based genetic algorithms [11], particle swarm optimization [12] and ant colony optimization [13] algorithms, and other population intelligence algorithms, which are all effective for the input data drive algorithms of classifiers. The literature [14] based on improved GA to filter and combine wavelet extracted features and classify them by multiple models effectively improves the training speed and accuracy of the classifier, but the feature screening algorithm is not integrated with the subsequent classifier, and the GA tuning reference is more complicated, and the scene fit is lower. The literature [15] improves the accuracy by merit screening the wavelet-extracted feature vectors through PSO, but the overall algorithm complexity is high. The ACO is computationally intensive, convergence is relatively slow, and it is not applicable to the feature selection problem of PQ perturbation. The traditional BP neural network [16] has stronger adaptivity, but the convergence results are slower and not suitable for dealing with long time series problems.
On the basis of the above considerations, this paper proposes a quantitative analysis algorithm based on improved wavelet energy entropy method and LSTM neural network for the problem of renewable energy power share on low-voltage feeders. The method in this paper firstly pre-processes the sampled voltage and current signals by wavelet transform; secondly, it finds the energy entropy of each signal characteristic component, analyzes the internal variability of the energy entropy sequence separately, introduces the weighting coefficients, and obtains the improved energy entropy sequence after mathematical processing; finally, the improved energy entropy sequence is used as the training sample of LSTM neural network to test the judgment accuracy of the algorithm under different new energy occupation ratio. By building the distribution network model of renewable energy access and obtaining the simulation data, the effectiveness and accuracy of the quantitative analysis of the algorithm in this paper are verified by comparing this method with the traditional method.

2. Principles of Improved Wavelet Energy Entropy and LSTM Neural Network

2.1. Wavelet Transform

Due to the strong random fluctuation of new energy, a high proportion of new energy connected to the grid will lead to a significant increase in power generation fluctuation and a change in the harmonic components of voltage and current in the grid. Therefore, in order to study the external characteristics of current, power, and frequency of new energy sources (such as distributed photovoltaic and wind power after grid connection), extract their typical features, and construct filtering algorithms and frequency analysis algorithms suitable for end-user load current analysis, suitable feature extraction algorithms should be selected.
Wavelet transform—which is a local transformation of time and frequency and can simultaneously analyze the data jointly in the time domain and frequency at multiple scales with multi-scale refinement analysis—is based on various specific functions to expand the data signal into a series of levels. Therefore, the signal can be analyzed effectively at different decomposition levels and with different wavelet basis functions. In this paper, the wavelet transform approach is chosen as a major tool for spectral analysis.
The method of signal processing requires a basis function as a tool for the transform. The basis function used in wavelet transform, on the other hand, is different from the stable and periodic sinusoidal function in Fourier transform, except for a small segment of the signal, thus reflecting the local characteristics.
Suppose ψ t L 2 R , if it satisfies [17].
ψ t d t = 0
Then, ψ t can be used as the base wavelet (or mother wavelet). If the basis wavelet is scaled and translated, a series of wavelet families can be obtained as ψ a , τ t :
ψ a , τ t = | a | 1 / 2 ψ t τ a
where a and τ are the scale parameter and the translation parameter, respectively, and t is the time. The scale parameter determines the degree of scaling of the fundamental wavelet. However, in general practical calculations, the data are stored in discrete form; therefore, the discrete wavelet transform is generally chosen to change the parameters using the dichotomy method.
Take a = 2 j , τ = 2 j k , the discrete wavelet family is given by
ψ j , k t = 2 j / 2 ψ 2 j t k
For a certain signal f t L 2 R the discrete wavelet transform is calculated as follows:
W f 2 j , 2 j k = 2 j / 2 R f t ψ * 2 j t k d t = f t , ψ j , k t = d j k
where dj(k) denotes the wavelet coefficients, and its expression is given by:
d j k = R f t ψ * j , k t d t
Multi-resolution analysis, also known as multi-scale analysis, is able to decompose the signal well in both the low- and high-frequency bands, showing the details and the full picture of the signal. Its reconstruction equation is:
f t = 1 C φ + + 1 a 2 W f a , τ ψ t τ a d a d τ
Using the decomposition and reconstruction of the signal, multi-resolution decomposition can be achieved.
Let Wj denote the high-frequency part of the multi-resolution decomposition and Vj denote the low-frequency part. Then, Wj is Vj in Vj+1, the orthogonal complement in
V j W j = V j + 1 , j Z
Therefore, for an arbitrary signal, the multi-resolution decomposition can be divided into a high-frequency detail part and a low-frequency approximation part, which is implemented as follows:
Suppose that the frequency distribution of a signal f(t) has a frequency distribution in (0, π) above; then, this frequency band is defined as the space V0. After the first level of decomposition, the space is divided into two subspaces: the low-frequency V1 (frequency band (0, π/2)) and the high-frequency W1 (frequency band (π/2, π)). In the second level of decomposition, the object is the low-frequency space of the previous level V1, and it is decomposed into the low-frequency part V2 (frequency band (0, π/4)) and the high-frequency part W2 (frequency band (π/4, π/2)), and so on.
Let the high- and low-frequency components, after decomposition and reconstruction, be D j n and A j n ; the specific equation is as follows:
f n = D 1 n + A 1 n = D 1 n + D 2 n + A 2 n = = j = 1 m D j n + A m n
It is not necessary to let A m n = D m + 1 n , then the above equation is:
f n = j = 1 m + 1 D j n
where D j n denotes the f n components at different frequency bands.

2.2. Wavelet Energy Entropy

The wavelet energy entropy here is actually borrowed from the concept of information entropy. By information entropy, we mean that for some discrete random variable X, its probability distribution is p i = p X = x i , i = 1 , 2 , 3 , , and i = 1 n p i = 1 , then the expression of information entropy is:
H x = n = 1 n p i l n p i
Before deriving the wavelet energy entropy, we ask for the wavelet energy at each frequency band. According to the assumptions in the previous subsection, the signal sequence f n wavelet coefficients on each frequency band are D j n , then the wavelet energy can be expressed by Equation (11).
E j = i = 1 n D j 2 i
Since the probability p used for the information entropy satisfies and is 1, the relative energy is found:
P j = E j i = 1 n E j
Therefore, the wavelet energy entropy of a segment of the sequence is:
ε = j P j ln ( P j )
It should be noted that the wavelet energy entropy represents the feature information contained in a certain segment of the sequence, so when conducting feature extraction on the data, it can be considered to segment it and split it into multi-group sequences of equal length for processing.

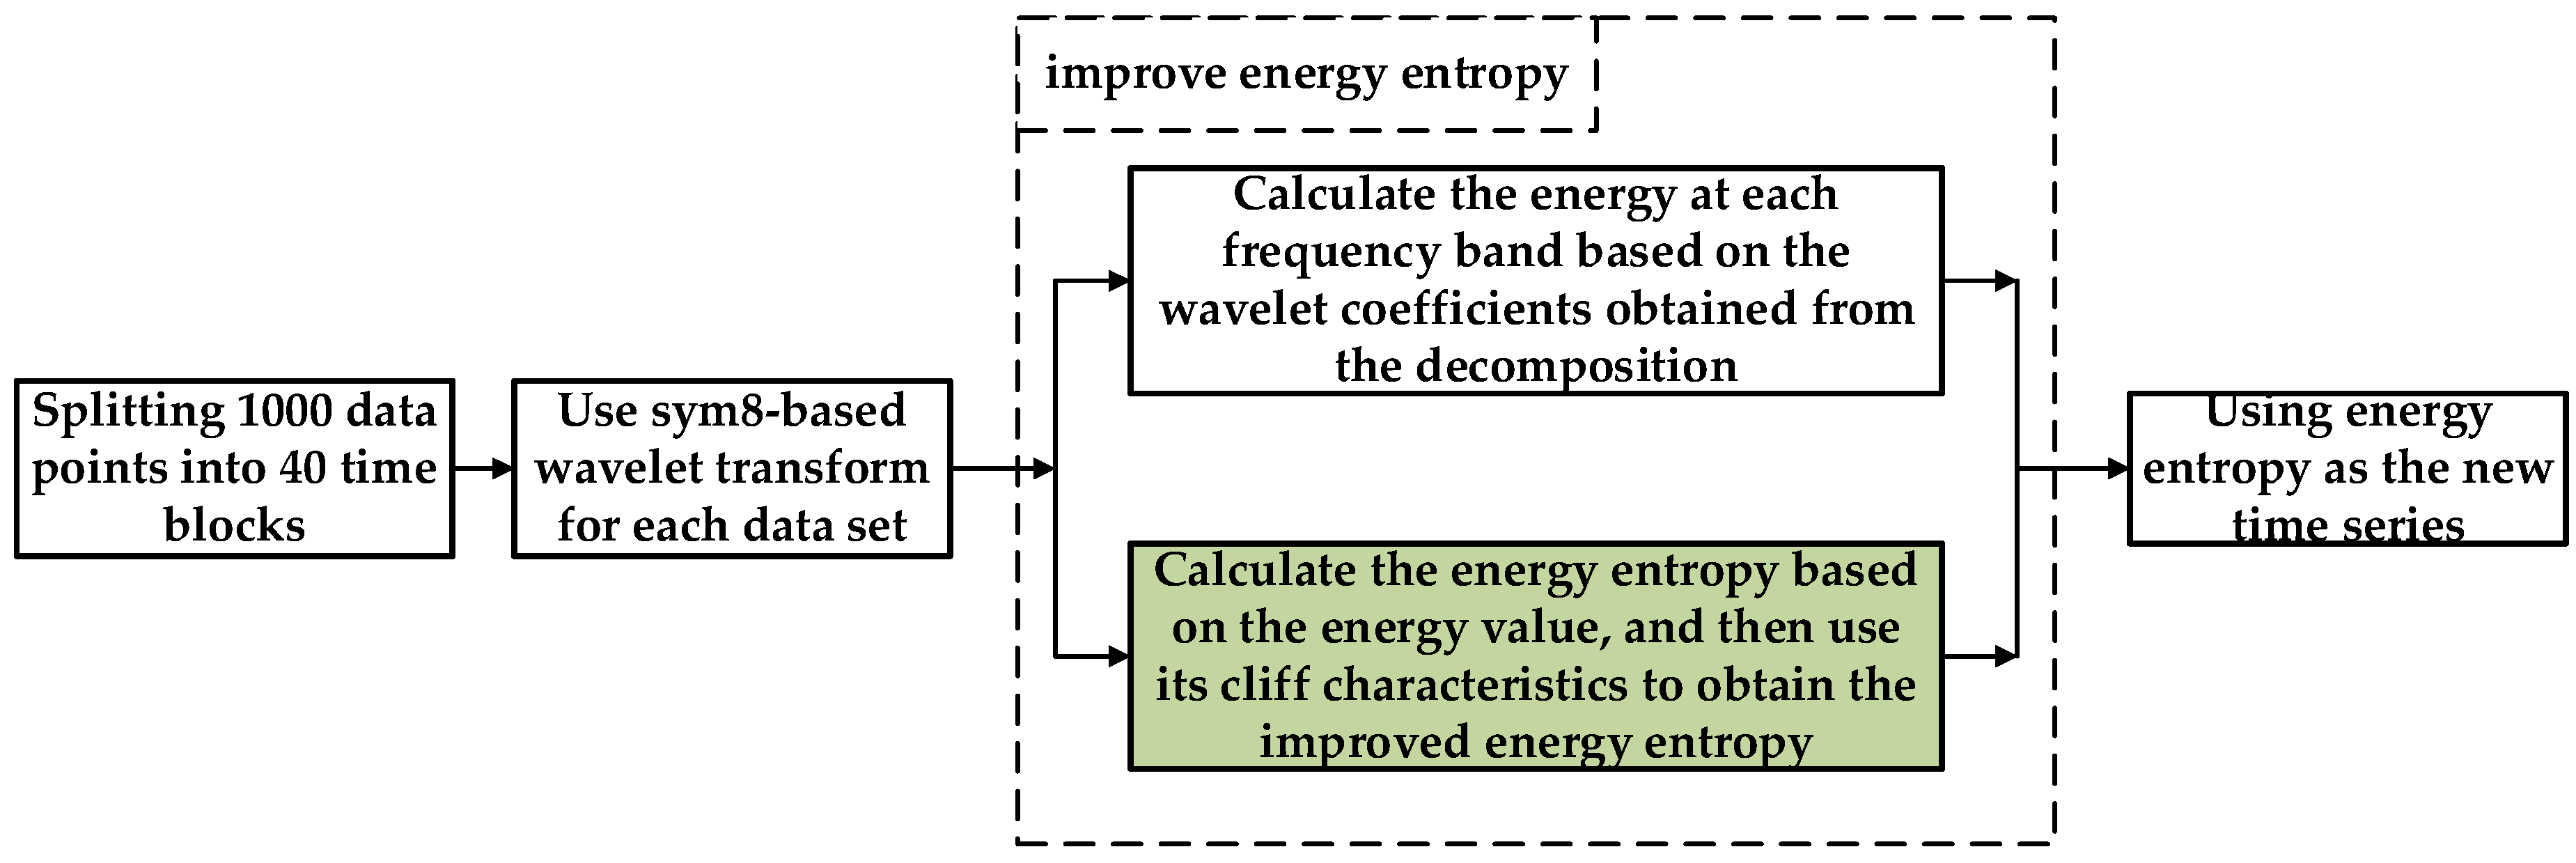
2.3. Improving Wavelet Energy Entropy

Since the new energy source is connected to the grid—although it will lead to changes in the characteristic quantities, such as grid frequency as well as harmonic characteristics—the fluctuation is still within a certain range. Therefore, if the wavelet energy entropy of each time period is directly used as the characteristic parameter, it will lead to little difference in the characteristic quantities under different new energy percentages, and further processing is needed.
A weighted wavelet energy entropy theory is proposed: let there be k subsequences within a certain period of time sequence, and the energy entropy size of each sequence is Entropy(k). Calculate the energy entropy under the entire time period and obtain the resulting entropy mean. Let the weighting factor be A, then the processed energy entropy sequence is:
E n t r o p y n e w k = A × E n t r o p y k E n t r o p y _ mean
where the weighting factor A is calculated by the following formula:
A = B σ 4 / E n t r o p y μ 4
The letter B in the equation is taken to be approximately 103 and represents the scale factor. μ represents the mean value of the energy entropy series, and σ represents the standard deviation of the energy entropy series. The value of the weighting coefficient is taken to be inversely proportional to the kurtosis of the energy entropy series. Since the kurtosis reflects the steepness of the data, and the value of kurtosis is small for energy entropy with inconspicuous feature information, the inverse of kurtosis is used to highlight the internal variability in order to highlight the internal variability. At the same time, it makes the level of internal variability of each type of energy entropy maintain on the same baseline, thus improving the validity of the overall information and the reliability as training samples.

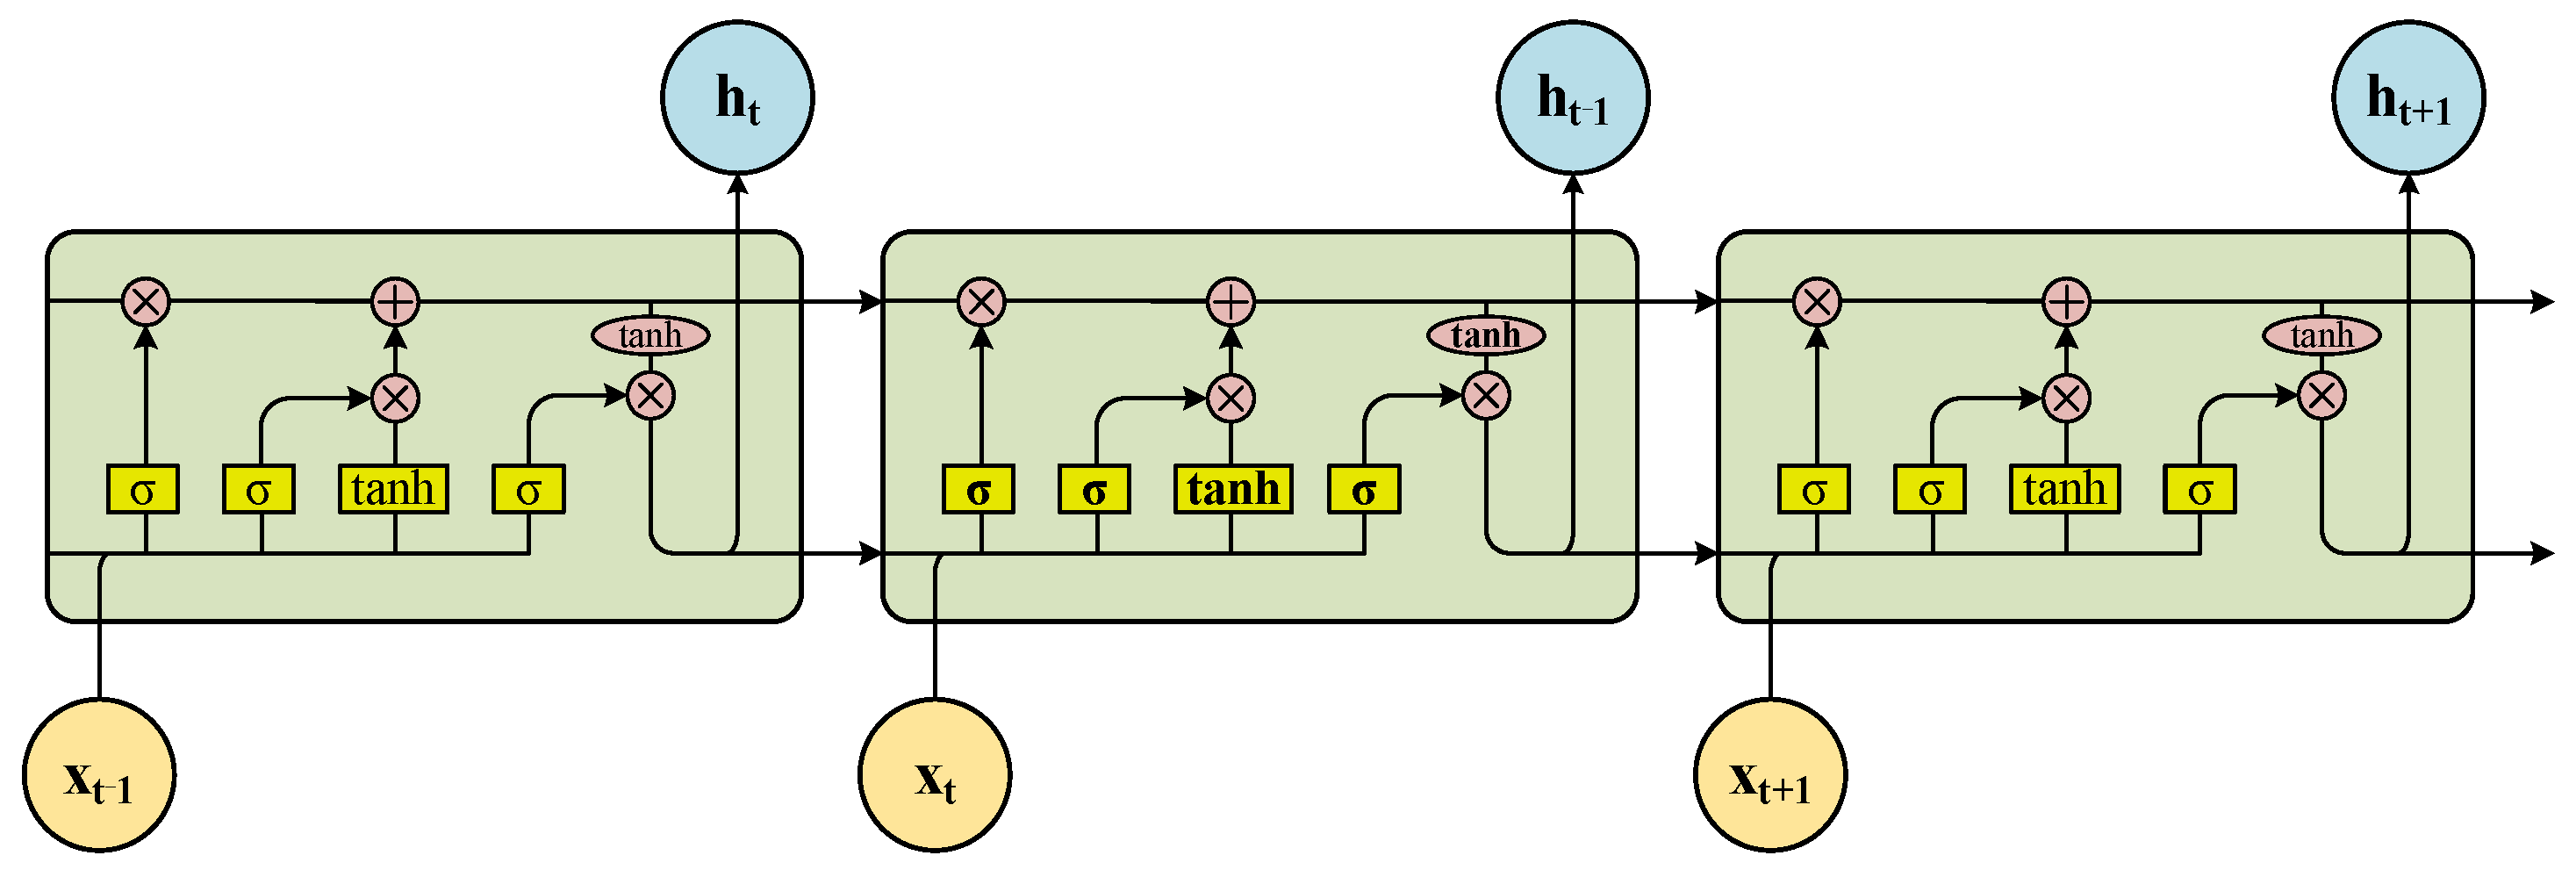
2.4. LSTM Neural Network

LSTM neural network is a special type of recurrent neural network, which is a type of neural network with memory and suitable for processing sequences with time scales [18]. Especially for the problem of time series with long span, it is able to memorize longer historical information. The structure of LSTM neural network is shown in the following Figure 1 [19].
The key to LSTM is the cell state, which is analogous to a transmission band, a straight line located at the top of the structural map. The state of the cell moves along this line with only a small number of linear operations. In this way, cellular information is not overly modified after passing through a cell. The superiority of the LSTM is its ability to selectively modify the state of the cell, and this is achieved by a gate which selectively allows information to pass through. The gate consists of a sigmoid neural network layer and a point multiplication operation.
The operation of a single LSTM unit can be divided into four steps as follows:
(1) Step 1
First, the LSTM must decide to discard some of the information in the cell state, i.e., the “forgetting layer”. The sigmoid function is used to determine the amount of information to be retained by using the output, ht-1, of the previous moment and the input, xt, of the current moment.
(2) Step 2
The amount of information stored in the cell state is determined. First, the sigmoid layer, which is the “input gate layer”, also outputs a value between 0 and 1 to determine the amount of information to be remembered; second, the information passes through the tanh layer to create a candidate vector, Ct’. This vector is then fed as additional information to the cell’s state.
(3) Step 3
Update the value of Ct. First, multiply the forgetting factor, ft, obtained in the first step to obtain the information to be forgotten. Add the candidate vector to get the new cell state, Ct.
(4) Step 4
Require the new cell state to pass through the tanh layer to normalize the value between −1 and 1; pass the two external inputs through the sigmoid layer to determine the amount of cell information output. The product of the two quantities is used as the final output quantity.

3. Simulation and Discussions

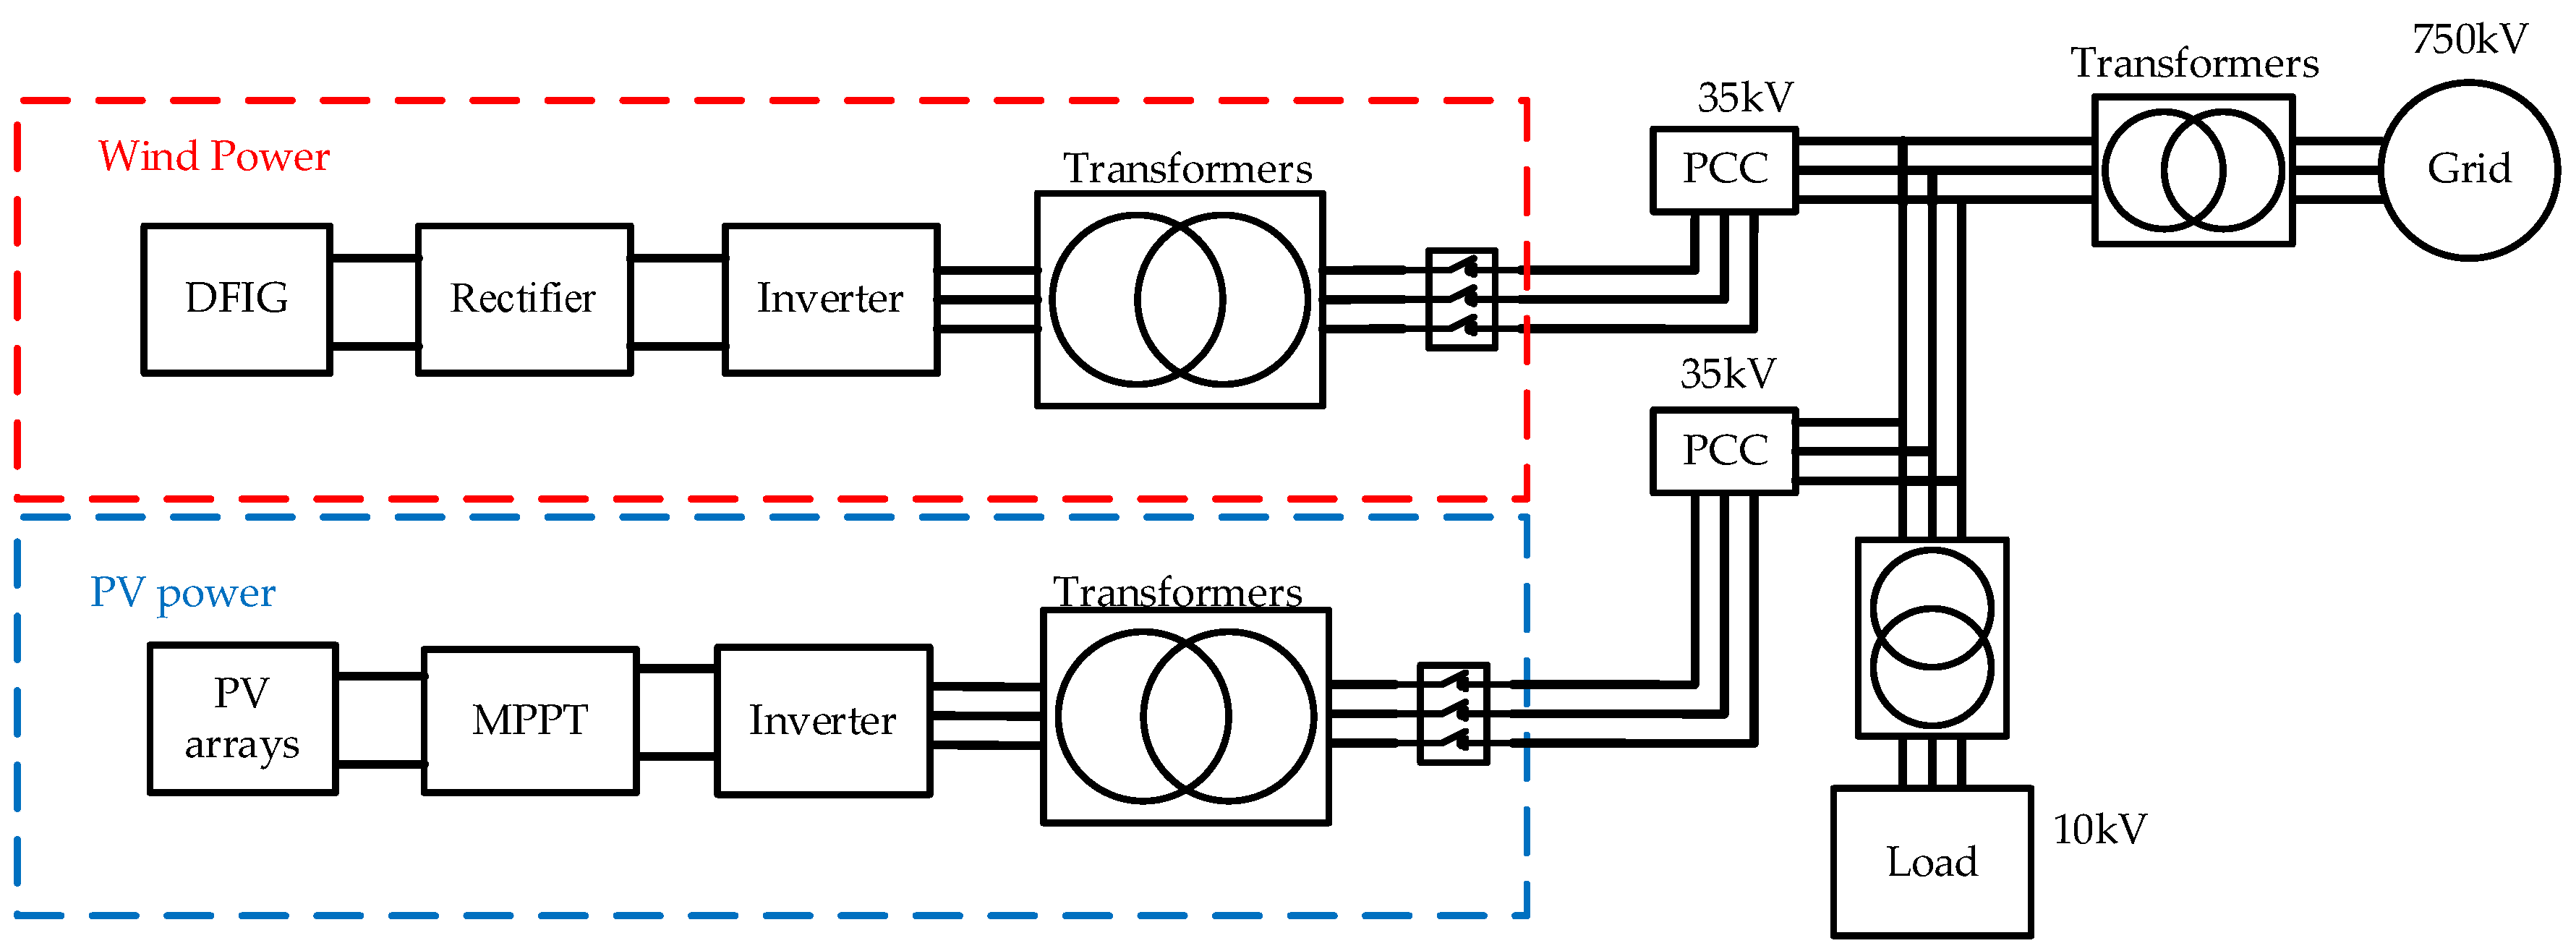
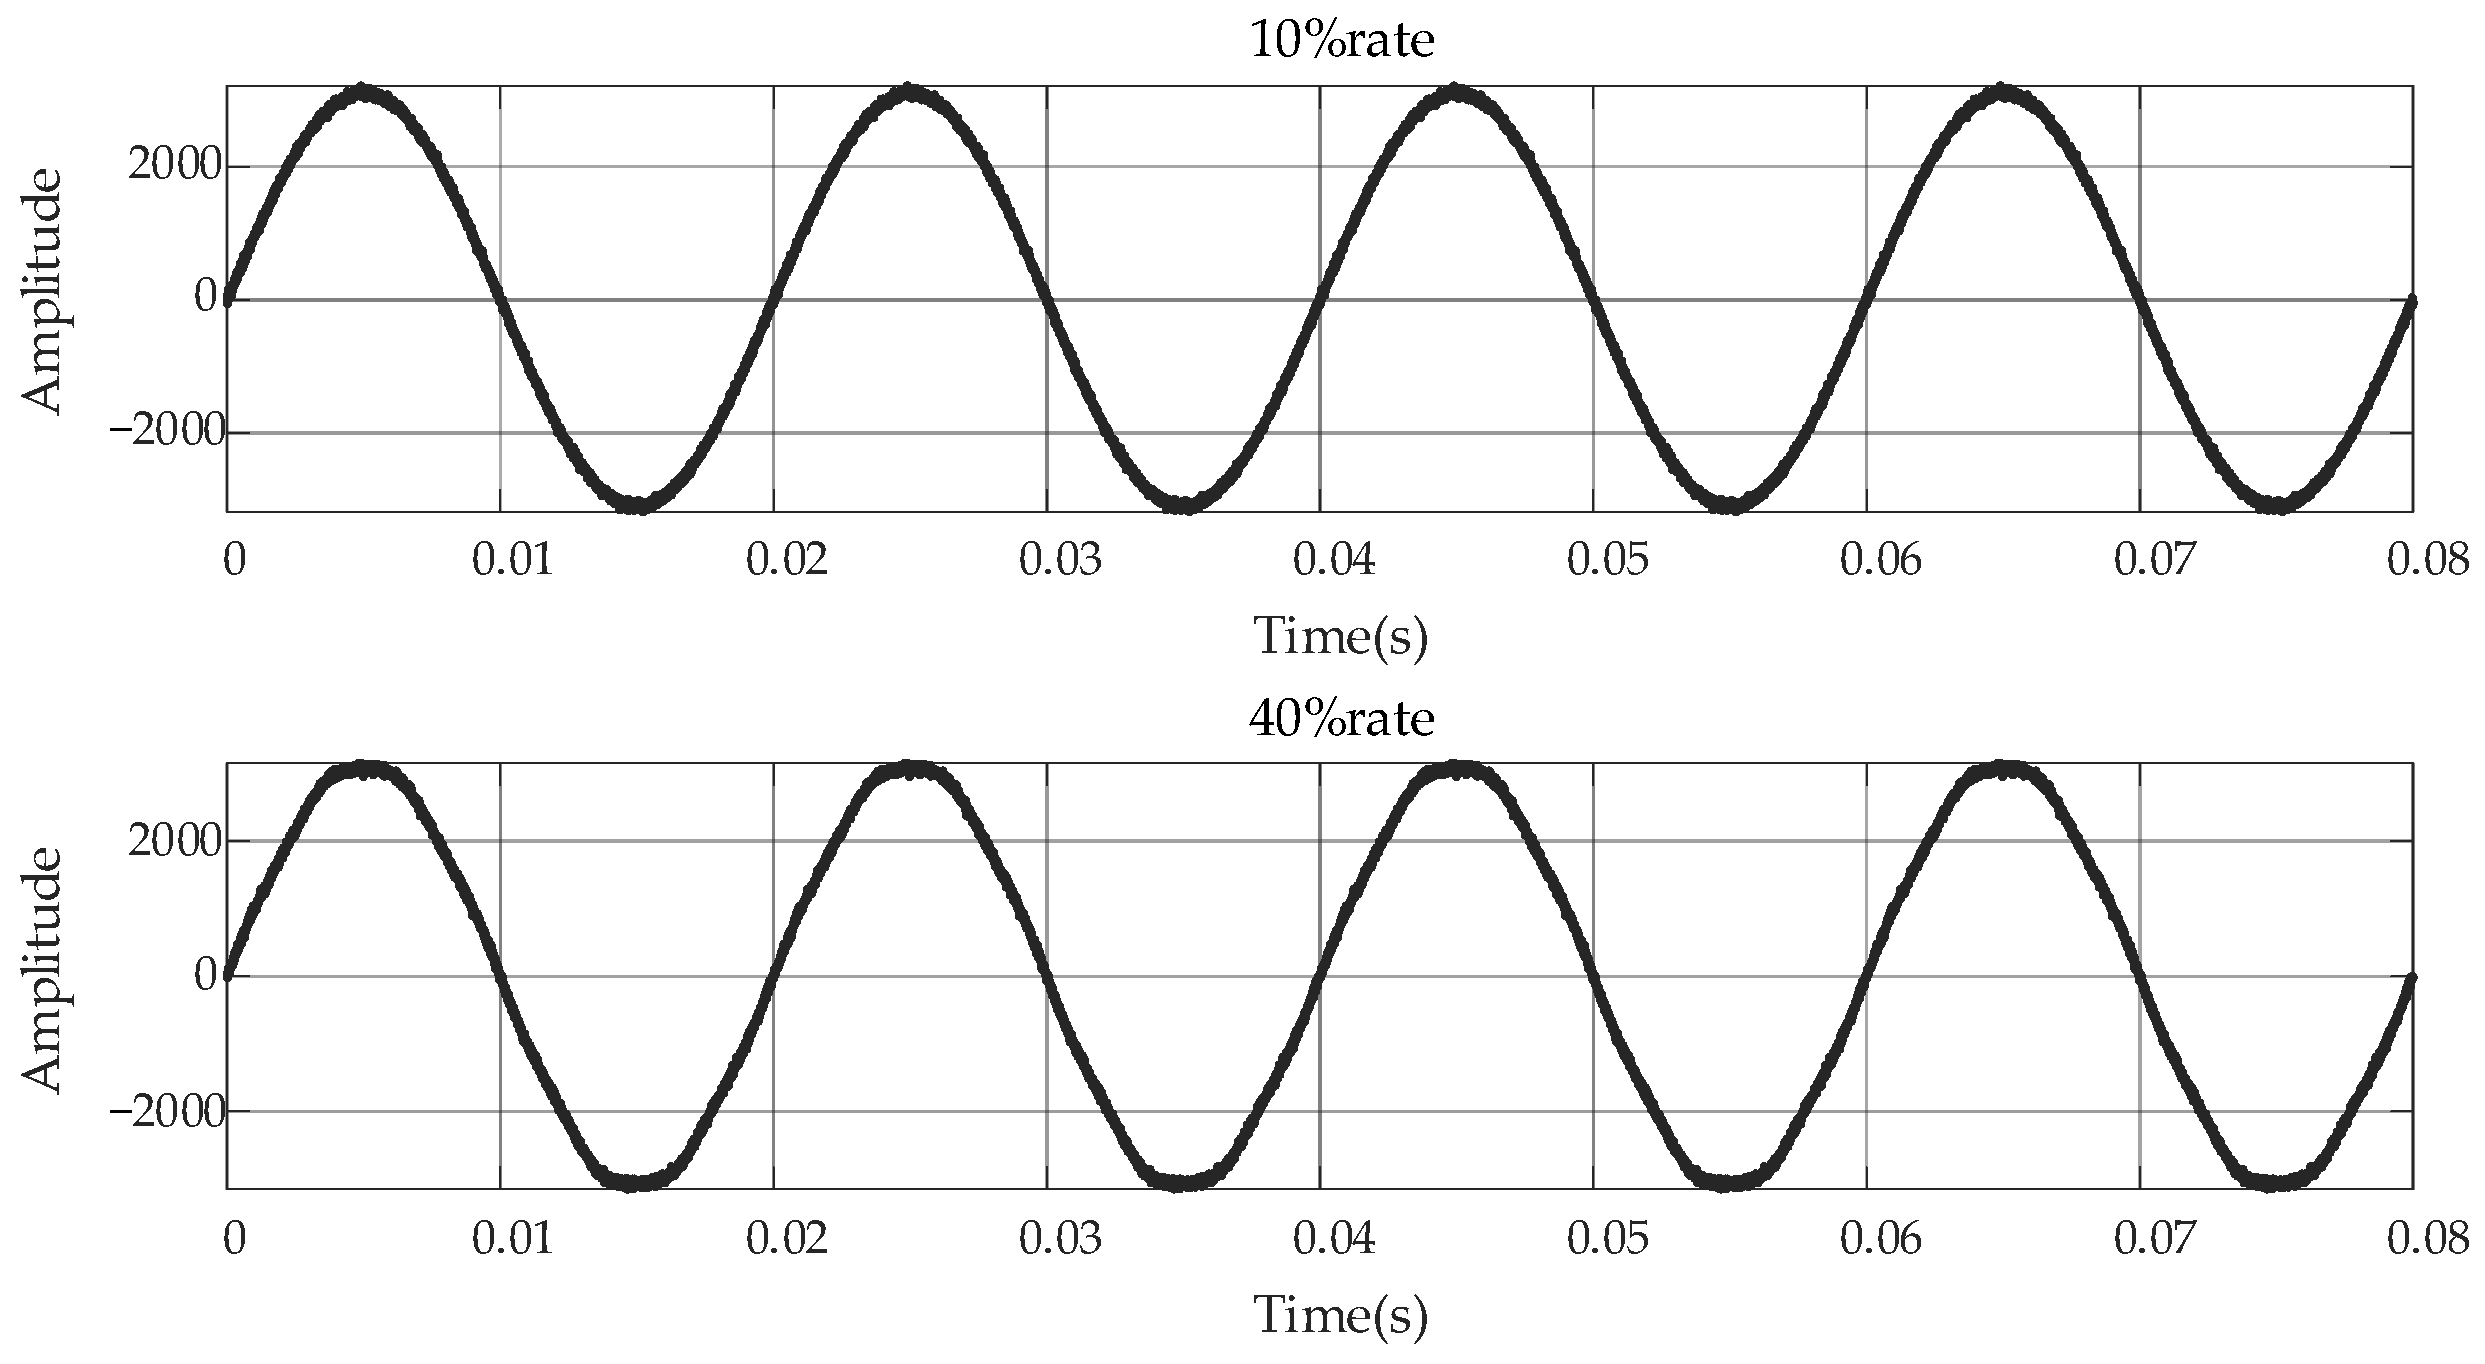
3.1. Grid Model Simulation with Renewable Energy

In order to study the proportion and spectral characteristics of distributed new energy sources on the low-voltage feeder, a simulation model with multiple renewable energy sources connected to the grid is built in Simulink, and the model structure is shown in Figure 2. The voltage level of the main network is 750 kV, and at the 35 kV bus, wind farms and photovoltaic farms are connected. The wind turbine is a double-fed asynchronous wind turbine with a rated output power of 1.5 MW, and the PV cell is SPR-415E-WHT-D with a rated output power of 10 MW. A three-phase RLC load is connected to the 10-kV low-voltage feeder with a load power of 200 MW. The detailed parameters of each part of the simulation are shown in the Table 1.
In this paper, the fixed load power is 200 MW, and the change of the new energy share at the low-voltage feeder is achieved by changing the number of input units of the wind turbine and the number of components of the PV array. On the basis of the consideration of the actual situation, a total of 500 sets of simulations are performed, and the new energy share increases from 0.1% to 50% by 0.1% increments.
Through the power acquisition module, the PV output power (P_PV), the wind turbine output power (P_wind), and the load-side power (P_load) are obtained, and the new energy share ratio is calculated for each simulation as follows:
ratio = P _ PV + P _ wind / P _ load
At the same time, there is more noise in the electrical signal due to the actual measurement in the field, for example, white noise interference, among others. To simulate this situation, adding Gaussian white noise (i.e., superimposing a certain percentage of normally distributed noise signal in the output current) simulates white noise interference.
As an example, the time and frequency domain diagrams of the single-phase current at the low-voltage feeder are shown in the Figure 3 (taking the A-phase current signal for analysis), taking the 10% and 40% sets of data. With the increase of the proportion of new energy, the distortion of current waveform has been improved, to a certain extent. It can be seen from Figure 3 that there are obvious harmonics at the wave crest and wave trough.
However, it can be seen that the degree of signal distortion at the low-voltage feeder does not vary much when the new energy ratio varies, so it is not possible to quantitatively analyze it visually.

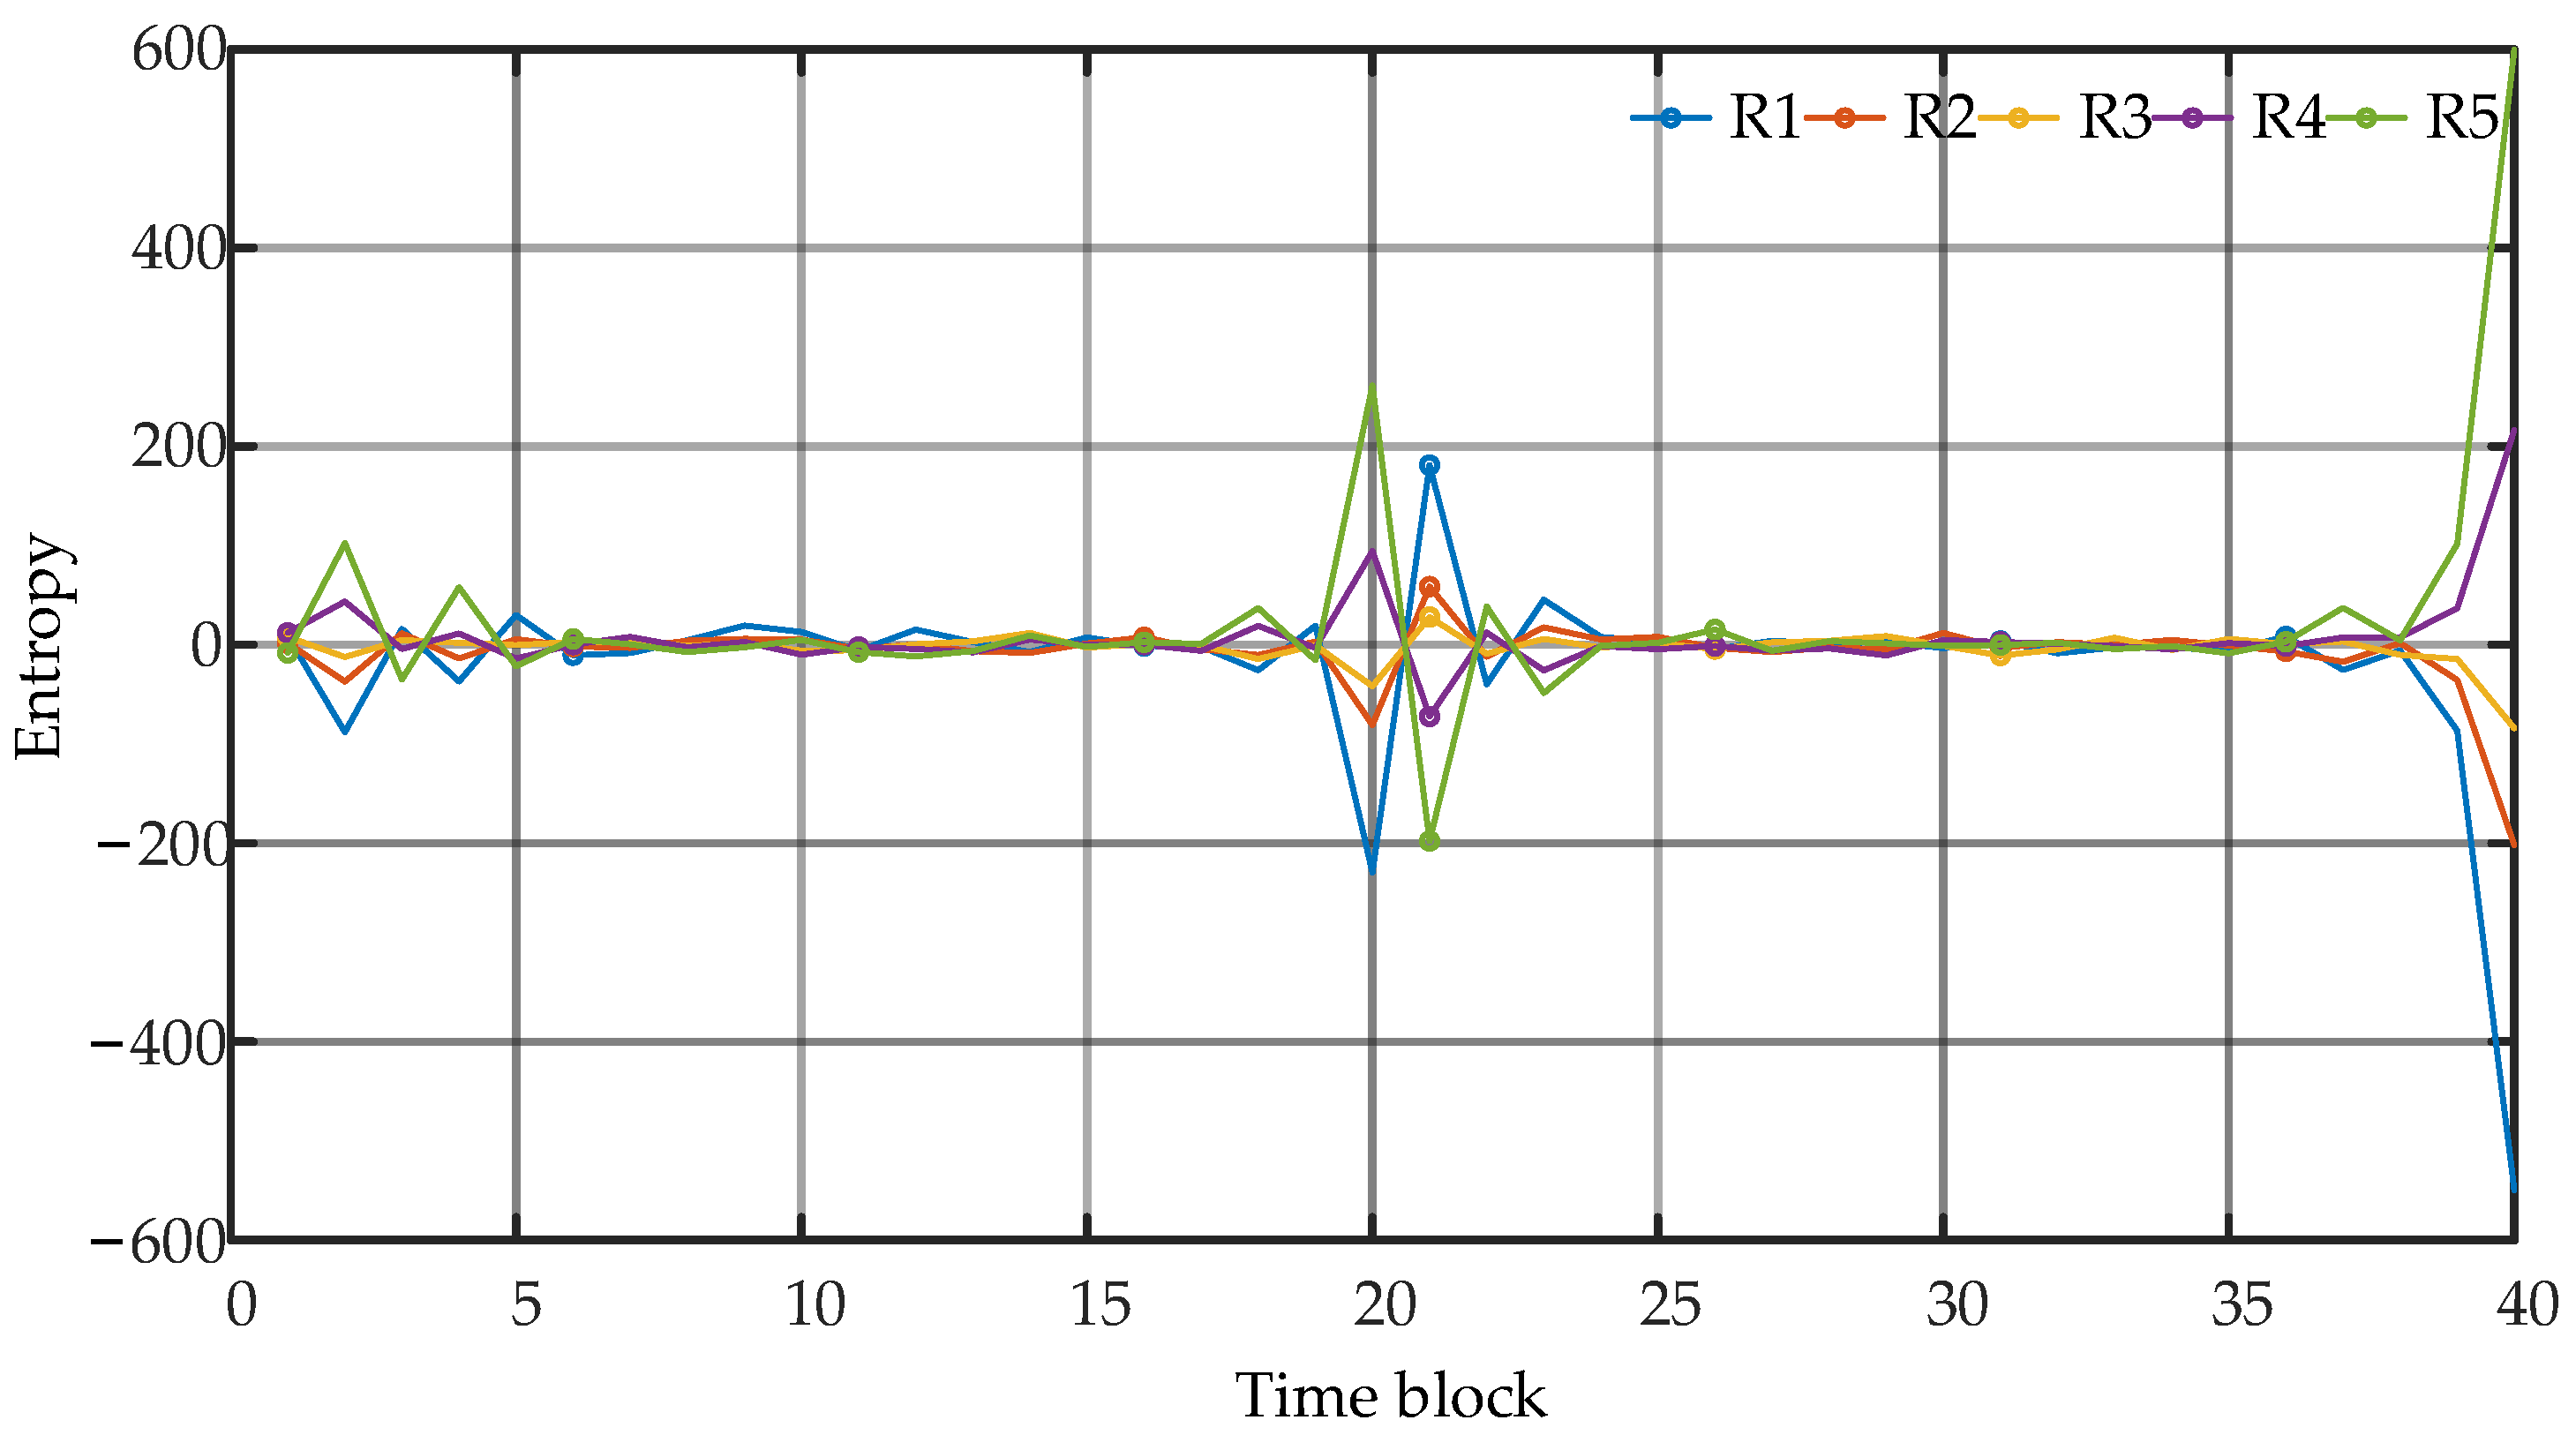
3.2. Specific Process to Improve Wavelet Energy Entropy

Since this simulation is a discrete simulation, the set step size is 5 × 10⁻⁶, thus 4000 data points in one work frequency cycle are taken for analysis. The 4000 points are divided into 40 groups of 50 points each, and the time series composed of them are wavelet-transformed, and the energy entropy is obtained. In this way, a set of current data is turned into a 40-point energy entropy sequence. Since six sets of voltage and current data are obtained from each simulation group, a 6 × 40 feature matrix is composed, representing 40 six-dimensional column feature vectors, as the training object of the neural network. The specific flow is shown in the following Figure 4.
The 500 sets of training data were divided into five categories of levels with new energy percentages of 0–10%, 10–20%, 20–30%, 30–40%, and 40–50%, respectively, and were recorded as R1, R2, R3, R4, and R5. Each set of data from each category was analyzed for its energy entropy data, as shown in the following Figure 5. (R1-R5 is conducted in the same simulation model.)
From the figure, it can be found that the peak of the improved energy entropy is concentrated in the starting phase as well as the midpoint phase, and the other phases are relatively smooth, indicating that the new energy fluctuation amplitude is more obvious in these three phases. Therefore, if we want to improve the operation speed of the algorithm and reduce the storage burden, we can segment the waveform and intercept the key segments for feature extraction, which can effectively improve the subsequent training speed.
At the same time, observing the waveform information at different levels under the same stage, it can be found that in the start–stop stage, the improved energy entropy shows an increasing trend as the share of new energy increases, with the most drastic change in the end stage. In the intermediate stage, the energy entropy shows a small range of sinusoidal characteristics and changes in a similar way as the start–stop stage. Therefore, it indicates that the improved energy entropy taps the information of signal characteristics under various types of levels.

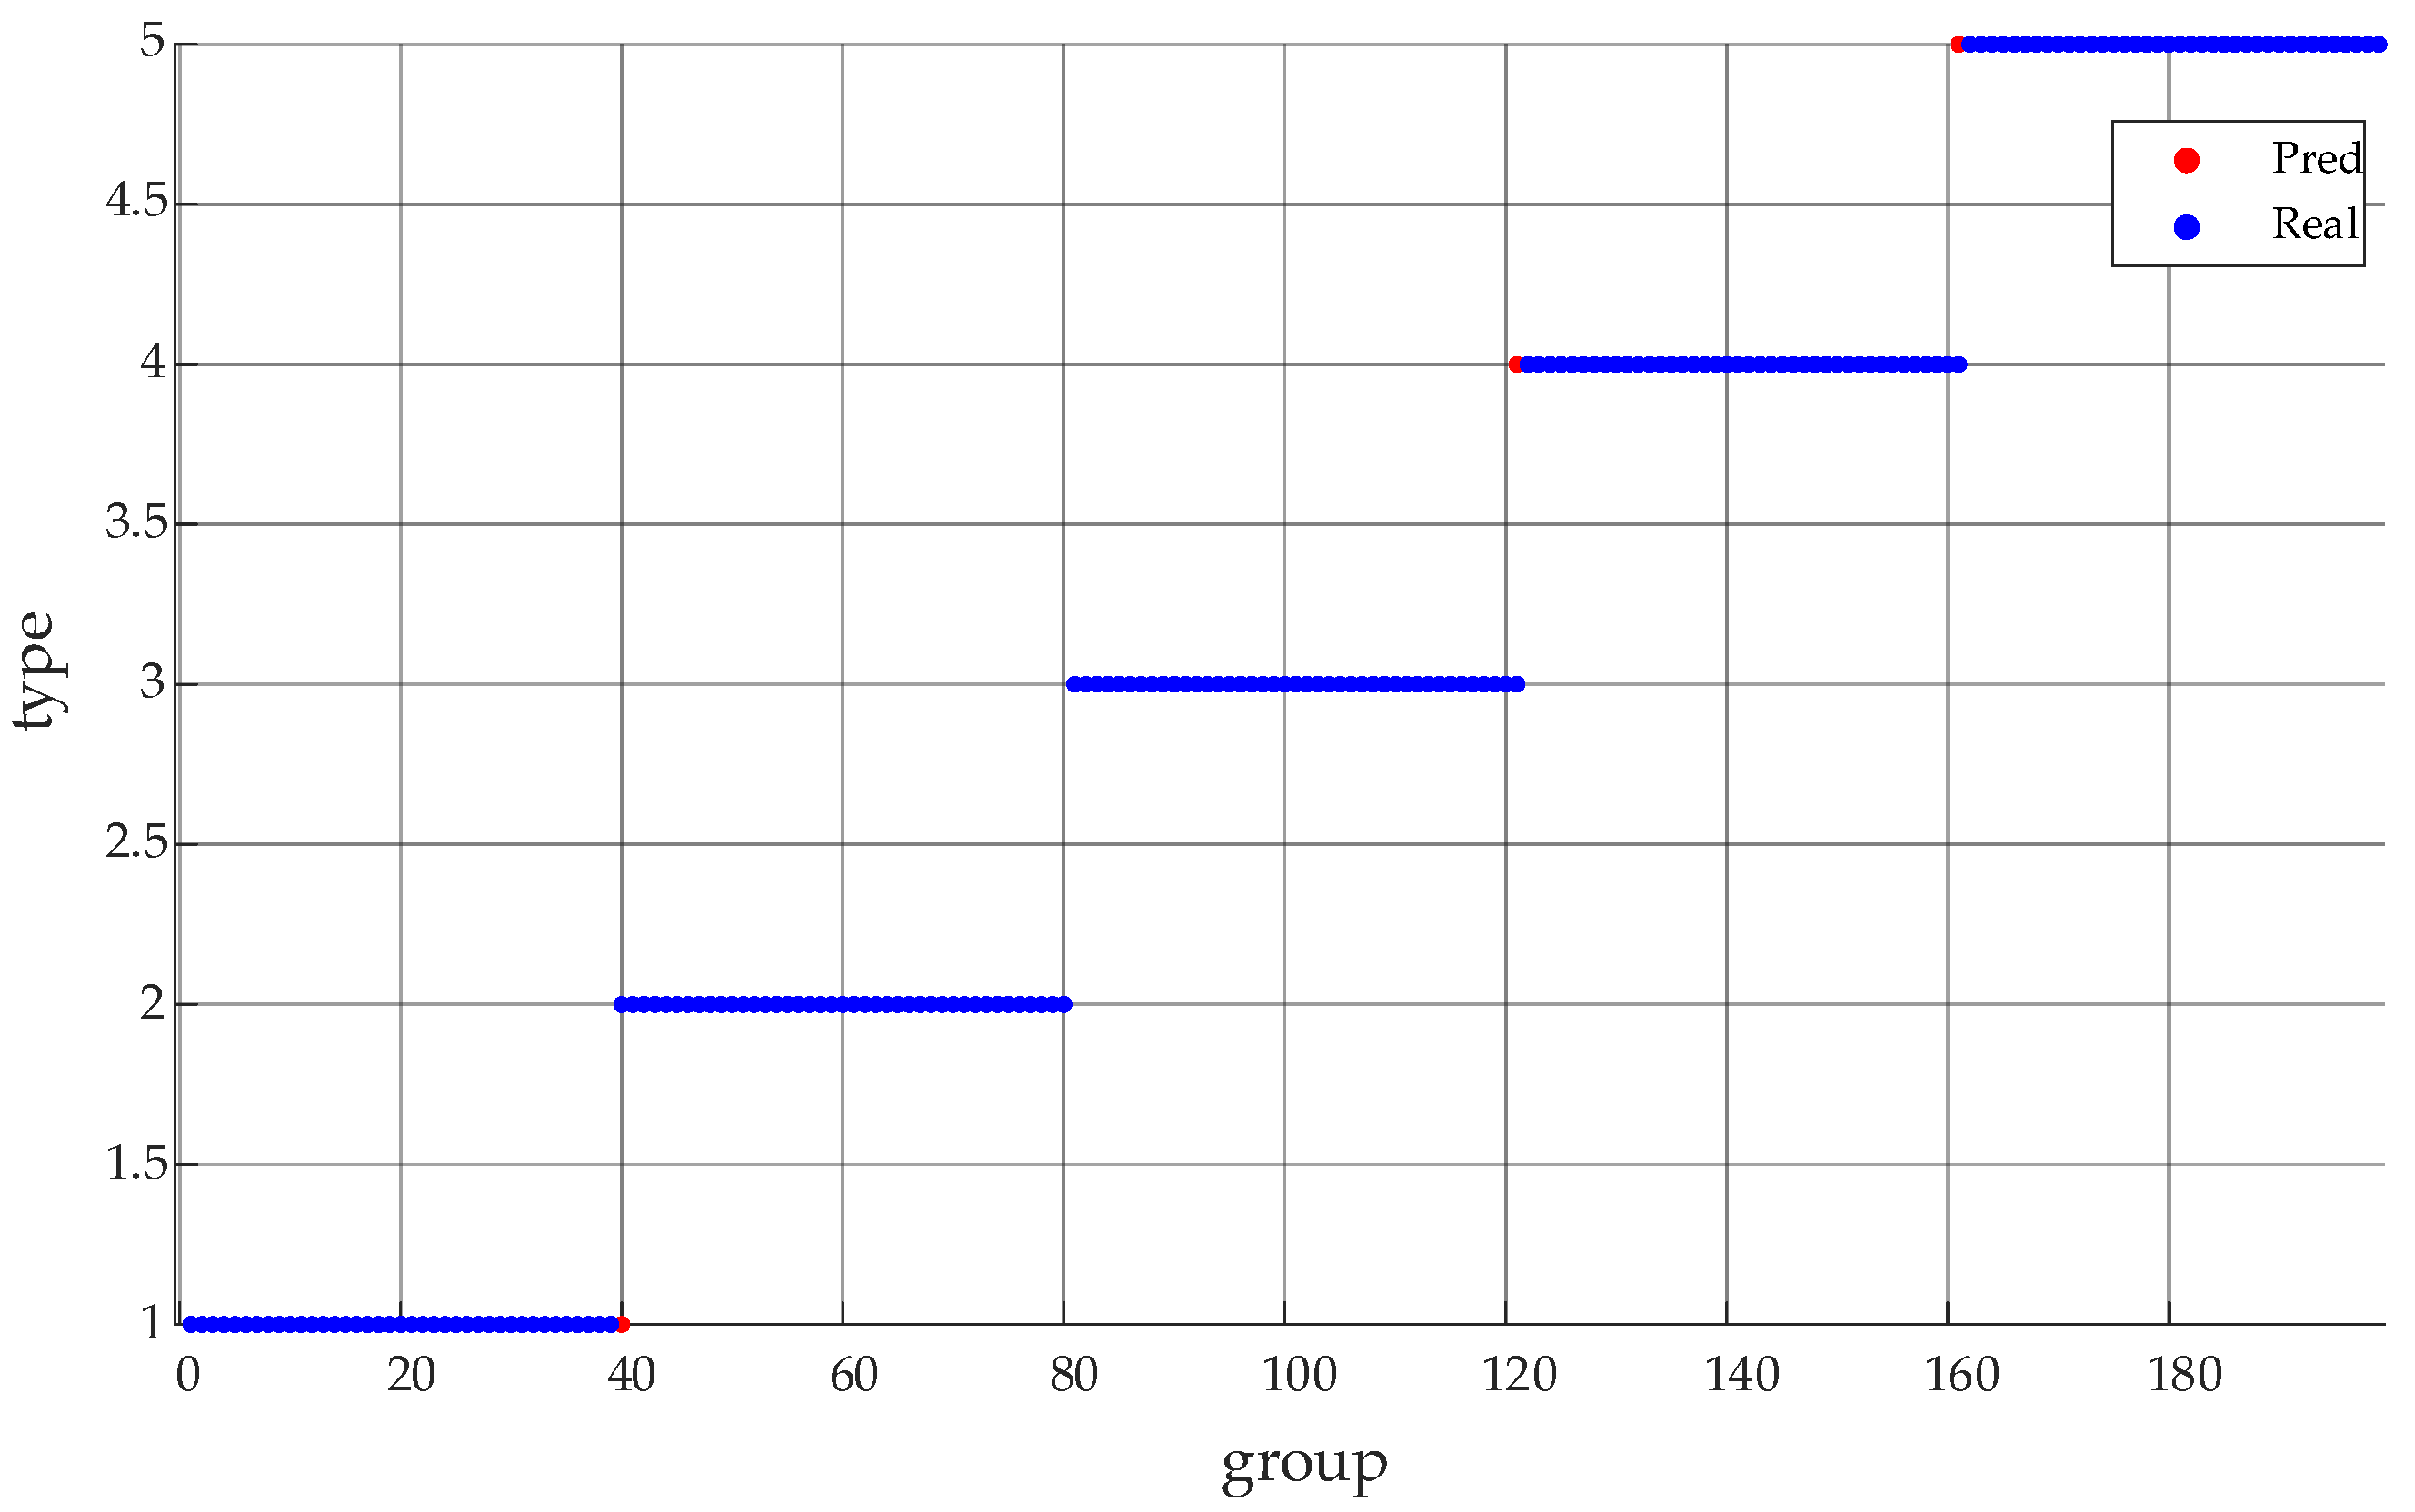
3.3. Classification Algorithm and Result Analysis

In this paper, traditional backpropagation neural network (BPNN) [20] and LSTM neural network are chosen for the classification algorithm, and the performance of each method is compared by changing the input side data. Four sets of control experiments are taken: (1) traditional wavelet energy entropy + BPNN; (2) traditional wavelet energy entropy + LSTM neural network; (3) improved wavelet energy entropy + BPNN; and (4) improved wavelet energy entropy + LSTM neural network.
The generated 500 sets of data are divided into 300 training samples and 200 test samples, with 60 training samples and 40 test samples for each type of data. The implicit layer of BPNN is configured as 200, the maximum number of rounds is 200, and the learning rate is set to 0.001; the implicit layer of LSTM neural network is configured as 100, the maximum number of rounds is set to 100, and the learning rate is set to 0.001. Specific neural network parameters are shown in the Table 2, and the training results of each group are listed in the following Table 3. (Traditional refers to traditional wavelet energy entropy, while improved refers to improved wavelet energy entropy.)
It can be seen from Table 1 that the training effect of improved wavelet energy entropy + LSTM performs the best, which has 1000 cycles and 33 s training time, both of which are the lowest; in addition, its accuracy rate reaches 98.6%, which is the highest among the four methods. At the same time, it is not difficult to find that the training accuracy of the traditional wavelet energy entropy method is much less than that of the improved wavelet energy entropy method. In the case where the selected neural network remains unchanged, the accuracy rate is improved by 3–7% after using the improved wavelet energy entropy. In addition, the use of LSTM neural network also has a significant impact on the total training time. BPNN is not suitable for dealing with long time sequences due to its inherent characteristics, so it is inferior to LSTM neural network in terms of efficiency and accuracy. For a given training data set, the LSTM training time is reduced by 12 s and 9 s for the traditional and improved algorithms, respectively, compared with their corresponding BPNN times, which proves LSTM’s superior performance.
The above analysis shows that compared with BPNN neural network and traditional wavelet energy entropy method, the improved wavelet energy entropy + LSTM neural network algorithm proposed in this paper has great superiority. The algorithm requires low number of layers for the implicit layer configuration, few cycles, and short training time, but the accuracy rate still remains high enough to prove the effectiveness of the improved wavelet energy entropy method.
The test samples were analyzed using this method; the test results are shown in the Figure 6, and the test accuracies for each type of occupancy are shown in the Table 4. From the table, it can be found that the overall accuracy rate is 97.5%, which shows the validity and reliability of the method. However, the variability of the prediction accuracy of each category is large, due, in part, to the small number of test samples. At the same time, it can be found in the figure that the points of error in judgment are all concentrated in the stratification of each type of group. Since this classification is based on the new energy occupancy ratio, the feature information at the intersection of R1 and R2 is continuous, and the generation of misjudgment is within the acceptable range. If the percentage range is subdivided, for example, into 10 categories with 5% intervals, it can be expected that there will be a small decrease in the model training accuracy but an improvement in the practical significance of quantitative analysis.

3.4. Discussions

From the above simulation and training results, it can be seen that the proposed method in this paper has a certain improvement in accuracy and a shorter training time compared with the traditional algorithm, indicating a certain reliability. However, limited by the capacity of the simulation data and the performance of the machine, the span of the percentage band in this paper is large, reaching 10%. As a result, it leads to an uneven distribution of correct predictions in the same class of data sets, and there are some misjudgments at the occupancy threshold. If conditions allow, after acquiring more data, and then using the feature variability of improved energy entropy concentrated in some data segments to reduce the length of feature vectors in the training samples and reduce redundant information, this algorithm should be able to further improve the prediction accuracy and reduce the training time. Meanwhile, considering that the regression model can more accurately describe the proportion of renewable energy, the further study is considered.
Therefore, the following advantages and disadvantages should be pointed out. Regarding the advantages:
(1)
There is no need to specifically analyze the topology and power flow of the power grid, and the required data types are easy to obtain;
(2)
The intelligent algorithm has higher fault tolerance and can adapt to various network structures and operating conditions;
(3)
Compared with the traditional algorithm, the algorithm in this paper can highlight the power quality characteristic level with renewable energy more.
However, this paper also has the following shortcomings:
(1)
The training of neural network requires a large amount of data and has certain requirements for sampling devices and storage capacity;
(2)
At present, the proportion cannot be given very accurately, only the general scope can be specified.
Based on the above analysis and simulation verification, this method has certain practical application value. In the context of global promotion of low carbon emissions, this method can judge the proportion of renewable energy components from the user side, so as to provide a more accurate basis for carbon emissions for power users. Electricity enterprises can use it as a basis to choose cleaner energy.

4. Conclusions

In this paper, we propose a quantitative analysis method based on improved wavelet energy entropy and LSTM neural network for quantitative analysis of renewable energy power share at low-voltage feeders in the context of high proportion of renewable energy access. By building a simulation model to simulate field data and conducting a large number of training tests, we obtain the following main conclusions:
(1)
The feature extraction method based on improved wavelet energy entropy can effectively solve the problem of difficult spectrum analysis caused by complex perturbations in power quality due to the massive access of new energy sources, especially the improved energy entropy algorithm, which improves the traditional energy entropy method not applicable to the problem of low-kurtosis data processing. At the same time, this is the innovation of this paper.
(2)
The quantitative analysis of renewable energy occupancy ratio by a traditional machine learning algorithm has problems such as long training time and low accuracy rate. Therefore, in this paper, we use the data of Conclusion (1) to build an LSTM neural network and simulate it in MATLAB/Simulink; the simulation shows that the LSTM neural network can successfully identify the voltage and current data under different occupancy ratios with low complexity and training time, and the average accuracy rate is improved.
(3)
The next step is to improve the accuracy of quantitative analysis and effectively solve the problem of low success rate of identification at the renewable energy occupation score.

Author Contributions

L.C. and J.S. conceived the idea of this manuscript, performed the simulations, and wrote the manuscript; B.Z., Q.W., and G.B. provided guidance, revised the manuscript, and added their thinking to validate the idea. All authors have contributed equally to the analysis and discussions. All authors have read and agreed to the published version of the manuscript.

Funding

This work was supported in part by the State Key Laboratory of Smart Grid Protection and Control, Nari Group Corporation under project SGNR0000KJJS2200302.

Conflicts of Interest

The authors declare no conflict of interest.

References

  1. Zhuo, Z.; Zhang, N.; Xie, X. Key Technologies and Developing Challenges of Power System with High Proportion of Renewable Energy. Autom. Electr. Power Syst. 2021, 45, 171–191. [Google Scholar]
  2. Wang, Q.; Chen, P.; Deng, F.; Cheng, M.; Buja, G. The State of the Art of the Control Strategies for Single-Phase Electric Springs. Appl. Sci. 2018, 8, 2019. [Google Scholar] [CrossRef] [Green Version]
  3. Kuo, W.-C.; Chen, C.-H.; Hua, S.-H.; Wang, C.-C. Assessment of Different Deep Learning Methods of Power Generation Forecasting for Solar PV System. Appl. Sci. 2022, 12, 7529. [Google Scholar] [CrossRef]
  4. Tong, X.; Ye, Z.; Xu, Y.; Gao, S.; Xie, H.; Du, Q.; Liu, S.; Xu, X.; Luan, K. Image Registration with Fourier-Based Image Correlation: A Comprehensive Review of Developments and Applications. IEEE J. Sel. Top. Appl. Earth Obs. Remote Sens. 2019, 12, 4062–4081. [Google Scholar] [CrossRef]
  5. Chen, Z.; Wang, L.; Yi, Y. Computation of radio interference excitation current of DC Corona based on short-time Fourier transform. High Volt. Eng. 2019, 45, 1866–1872. [Google Scholar]
  6. Jia, R.; Zhao, J.; Wu, H. Application of correlated probabilistic wavelet transform in partial discharge detection. High Volt. Eng. 2017, 43, 2896–2902. [Google Scholar]
  7. Hong, X.; Liu, Y.; Lin, X.; Luo, Z.; He, Z. Nonlinear Ultrasonic Detection Method for Delamination Damage of Lined Anti-Corrosion Pipes Using PZT Transducers. Appl. Sci. 2018, 8, 2240. [Google Scholar] [CrossRef] [Green Version]
  8. Koganezawa, S.; Tsuda, S.; Tani, H.; Lu, R.; Tagawa, N. Frequency Analysis of Disturbance Torque Exerted on a Carriage Arm in Hard Disk Drives Using Hilbert–Huang Transform. IEEE Trans Magn. 2018, 54, 1–6. [Google Scholar] [CrossRef]
  9. Deng, Y.; Lin, S.; Fu, L. New Criterion of Converter Transformer Differential Protection Based on Wavelet Energy Entropy. IEEE Trans Power Deliv. 2019, 34, 980–990. [Google Scholar] [CrossRef]
  10. Li, Y.; Ning, F.; Jiang, X.; Yi, Y. Feature Extraction of Ship Radiation Signals Based on Wavelet Packet Decomposition and Energy Entropy. Math. Probl. Eng. 2022, 2022, 8092706. [Google Scholar] [CrossRef]
  11. Qu, H.; Liu, H.; Li, X.M. Feature combination optimization for multi-disturbance classification of power quality. Electr. Power Autom. Equip. 2017, 37, 146–152. [Google Scholar]
  12. Ahila, R.; Sadasivam, V.; Manimala, K. An integrated PSO for parameter determination and feature selection of ELM and its application in classification of power system disturbances. Appl. Soft Comput. 2015, 32, 23–37. [Google Scholar] [CrossRef]
  13. Biswal, B.; Dash, P.; Mishra, S. A hybrid ant colony optimization technique for power signal pattern classification. Expert Syst. Appl. 2011, 38, 6368–6375. [Google Scholar] [CrossRef]
  14. Wang, Y.; Zhang, K.; Zheng, C.; Chen, H. An Optimal Energy Management Method for the Multi-Energy System with Various Multi-Energy Applications. Appl. Sci. 2018, 8, 2273. [Google Scholar] [CrossRef]
  15. Przednowek, K.; Krzeszowski, T.; Przednowek, K.H.; Lenik, P. A System for Analysing the Basketball Free Throw Trajectory Based on Particle Swarm Optimization. Appl. Sci. 2018, 8, 2090. [Google Scholar] [CrossRef]
  16. Chen, J.; Gao, Z.; Luo, L. Error correction of UHF partial discharge location method based on BP network. High Volt. Eng. 2018, 44, 2040–2047. [Google Scholar]
  17. Ingrid, D. Ten Lectures on Wavelets; Society for Industrial and Applied Mathematics (SIAM): Philadelphia, PA, USA, 1992; pp. 14–22. [Google Scholar]
  18. Ali, A.; Devinder, K. Immunocomputing-Based Approach for Optimizing the Topologies of LSTM Networks. IEEE Access 2021, 9, 78993–79004. [Google Scholar]
  19. Sepp, H.; Jürgen, S. Long Short-Term Memory. Neural Comput. 1997, 9, 1735–1780. [Google Scholar]
  20. Paul, J.W. The Roots of Backpropagation: From Ordered Derivatives to Neural Networks and Political Forecasting; John Wiley & Sons: Hoboken, NJ, USA, 1994; pp. 86–132. [Google Scholar]
Figure 1. LSTM neural network structure diagram.
Applsci 12 11159 g001
Figure 2. Simulation model.
Applsci 12 11159 g002
Figure 3. Current signal of low-voltage feeder under different proportions.
Applsci 12 11159 g003
Figure 4. Flow chart of wavelet energy entropy method.
Applsci 12 11159 g004
Figure 5. Improved energy entropy of different categories.
Applsci 12 11159 g005
Figure 6. Comparison between predicted results and accurate values.
Applsci 12 11159 g006
Table 1. Parameters of the simulation.
ParameterValueParameterValue (pu)
Main grid voltage750 kVResistance of Transformer 1 (main grid)0.08
DFIG output voltage575 VInductance of Transformer 1 (main grid)0.08/30
PV output voltage10 kVResistance of Transformer 1 (new energy)0.025
Load power200 MWInductance of Transformer 1 (new energy)0.025/30
Table 2. Specific neural network parameters.
LSTMSettingBPNNSetting
Num Classes5Num Classes5
Max Epochs100Max Epochs200
Mini Batch Size50Mini Batch Size50
Initial Learn Rate0.005Initial Learn Rate0.001
Execution EnvironmentAutoExecution EnvironmentAuto
ShuffleEvery EpochShuffleEvery Epoch
Table 3. Comparison of training effects of different algorithms.
AlgorithmHidden UnitsEpochsTime (s)Accuracy
Traditional + BPNN20024005089.7%
Traditional + LSTM10016003891.3%
Improved + BPNN20017004292.5%
Improved + LSTM10010003398.6%
Table 4. Test accuracies for each type of occupancy.
CategoryR1R2R3R4R5
Accuracy100%92.5%97.5%100%97.5
Total Accuracy97.5%
Publisher’s Note: MDPI stays neutral with regard to jurisdictional claims in published maps and institutional affiliations.

