Article

Construction and Application of Detection Model for Leucine and Tyrosine Content in Golden Tartary Buckwheat Based on Near Infrared Spectroscopy

1
Research Center of Buckwheat Industry Technology, Guizhou Normal University, Guiyang 550001, China
2
Department of Biological Sciences, Pwani University, Kilifi 195-80108, Kenya
*
Author to whom correspondence should be addressed.
These authors contributed equally to this work.
Appl. Sci. 2022, 12(21), 11051; https://doi.org/10.3390/app122111051
Submission received: 10 October 2022 / Revised: 27 October 2022 / Accepted: 28 October 2022 / Published: 31 October 2022
(This article belongs to the Special Issue Spectral Detection: Technologies and Applications)

Abstract

:

Featured Application

Breeding and processing of Golden Tartary buckwheat.

Abstract

To meet the demand of the breeding and processing industry of Golden Tartary buckwheat, quantitative identification models were established to test the content of leucine (Leu) and tyrosine (Tyr) in Golden Tartary buckwheat leaves by near-infrared reflectance spectroscopy (NIRS) with quantitative partial least squares (PLS). Leu’s modeling results were as follows: first derivative (11) pretreatment, the wavenumber range of 4000–9000 cm−1 was appropriate for modeling (calibration sets: validation set = 6:1), the mean coefficient of determination (R2), standard error of calibration (SEC), and relative standard deviation (RSD) for the calibration set were 0.9229, 0.45, and 3.45%, respectively; for the validation set, the mean R2, SEC, and RSD were 0.9502, 0.47, and 3.65%, respectively. Tyr modeling results were as follows: first derivative (11) pretreatment, the wavenumber range of 4000–10,000 cm−1 was suitable for modeling (calibration sets: validation set = 4:1), the R2, SEC, and RSD for the calibration set was 0.9016, 0.15, and 5.72%, respectively; for the validation set, the mean R2, SEC, and RSD were 0.9012, 0.15, and 5.53%, respectively. It was proved that the Leu and Tyr content of Golden Tartary buckwheat could be quantified using the model structured by near infrared spectroscopy combined with the partial least squares method.

1. Introduction

Fagopyrum Miller is a dicotyledonous plant of the Polygonaceae family and F. cymosum complex is a common name for the perennial wild large-grained buckwheat of the genus Buckwheat. It is so named because of the extensive underground stem that turns golden yellow each growing season. It contains a variety of nutritional and health components and has high medicinal value [1,2,3]. Golden Tartary buckwheat (F. tatari-cymosum Chen) is a new buckwheat cultivar derived from crossing Fagopyrum dibotrys and Tartary buckwheat. Compared to cultivated Tartary buckwheat, its plants have resilient vegetation and regenerate rapidly. In spring, the plant grows vegetatively and accumulates nutrients in it large leaves [4]. These accumulated nutrients in the buckwheat can also be used for developing drugs utilized by humans for health benefits [4,5,6,7,8,9]. The active human beneficial components of buckwheat have been utilized in treating diseases such as human phlegm [5] and acute lung injury [6], as well as being used as a feed additive to prevent infections [7]. Golden buckwheat tablets combined with sulfasalazine (SASP) in the treatment of ulcerative colitis (UC) show significantly better results than SASP alone [8]. Our previous study also found high protein and GABA (γ-aminobutyric acid) content in the leaves of Tartary buckwheat [9]. Therefore, our research group aims at identifying the lines whose leaves and grains can be harvested and utilized in the progeny of hybrid combinations, and the rapid determination of nutrients in the progeny material is an essential component of this work.
Protein is the second most important nutrient after starch in many kinds of cereals. The nutritional quality of cereals and the quality of food processing are mainly determined by the content of protein and amino acids, and the content of digestible protein components and essential amino acids is particularly important for the nutritional improvement of crops [10,11,12]. Buckwheat seed proteins are relatively high quality where the main component of amino acids of storage proteins are relatively balanced, consisting of 19 kinds, with eight kinds being part of the essential amino acids for humans. The ratio is reasonable and basically reaches the standard value for dietary proteins recommended by the Food and Agriculture Organization of the United Nations [13]. Both leucine and tyrosine have unique nutritional value. Leucine, the only ketogenic amino acid among branched-chain amino acids, is one of the essential amino acids for aquatic animals, playing an important role in aquatic animal nutrition and physiology. Tyrosine is an aromatic amino acid, which is produced by living organisms in addition to a variety of other metabolites, many of which have significant physiological and pharmacological effects. Additionally, the types and concentrations of tyrosine products in fermented foods play an important role in the physiological effects and safety of foods. The determination of amino acids is mainly carried out by GB/T8314-2002, high performance liquid chromatography, liquid chromatography-mass spectrometry and amino acid analyzer. These methods have the disadvantage of complicated pretreatment, and of being time-consuming and expensive, and thus it is of great practical significance to explore a simple, rapid, and inexpensive method for the determination of amino acids. As a kind of physical testing technology, near infrared reflectance spectroscopy (NIR) has the advantages of simple pretreatment, fast determination speed and simultaneous determination of multiple indicators. Previous studies have shown that 20 amino acids have very pronounced NIR absorption in the range of 1000–2502 nm with significant differences [13]. At present, there are research reports on the determination of amino acid content of tea [14,15], medicinal material [16], rice [17,18], peanuts [19], meat [20], and so on by near-infrared spectroscopy, and most of these have obtained satisfactory results.
At present, the application of NIR technology in buckwheat breeding research is still relatively elusive. Some scientists have used infrared technology to determine moisture, ash, fat, amino acids, and other contents of buckwheat. The ash, protein, and starch models obtained are satisfactory, but some models’ shortcomings include low identification rates [21]. Our research group has used near-infrared technology in combination with an artificial neural network to build predictive models for the determination of amino acids in buckwheat. Most models have a discrimination rate of more than 90% for unknown samples, but there are still some amino acid models that cannot be used because of too large relative errors [22]. In this work, Fourier transform near-infrared reflectance spectroscopy combined with partial least squares regression was used to analyze the spectral data to build a more accurate analytical near-infrared model for leucine and tyrosine and provide a reference for the rapid and inexpensive determination of leucine and tyrosine content in Tartary buckwheat leaves.

2. Materials and Methods

2.1. Materials

The leaves of 230 Golden Tartary buckwheat cultivars harvested in spring 2020 were used as experimental material. Sample collection and pretreatment were performed according to the method described by Zhu et al. [22].

2.2. Test Method

2.2.1. Spectral Collection of Tartary Buckwheat Leaves

The MPA Fourier transform near-infrared spectrometer from the German company Brucker Spectral Instrument (Brucker, Germany) was used to record the spectrum. The scan resolution was 4 cm−1, the scan range was 4000–12,000 cm−1, and the scan times were 64. Scanning was undertaken with diffuse reflection, and the average spectrum was taken as the final spectrum of the sample after two scans. After scanning the spectrum, the samples were vacuum packed, and stored in the refrigerator at 4 °C for later determination of leucine and tyrosine.

2.2.2. Determination of Leucine and Tyrosine in Tartary Buckwheat Leaves

The content of leucine and tyrosine was determined according to the method described by Cheng et al. [23]. An amount of 0.1 g of leaf powder was weighed and placed in the hydrolysis tube, and 15 mL of 6 mol/L hydrochloric acid was added. Oxygen was removed from the tube by nitrogen bubbling three times after which the tube was sealed. The hydrolysis tube was incubated for 24 h at 110 °C. After cooling, the hydrolysate was carefully transferred to a 50 mL volumetric flask and mixed with deionized water at a constant volume. Then 1ml of the filtrate was aspirated and slowly dried, and then dissolved in 1 mL of pH = 2.2 sodium citrate buffer. The extracted samples were put into a Hitachi L-8900 amino acid analyzer (Japan) for quantitative analysis.

2.3. Data Analysis and Processing

The quantitative model for leucine and tyrosine in Tartary buckwheat leaves was constructed using the software CAUNIRS (China) (near-infrared spectroscopy) software developed by China Agricultural University [24]. The number of principal components, coefficient of determination (R2), corrected standard deviation (SEC) and mean relative error (RSD) of the different models were compared by internal cross-validation to filter out the best model.

3. Results

3.1. Leucine and Tyrosine Contents in Tartary Buckwheat Leaves

The average value of leucine in the samples measured by the chemical method was 14.185 mg/g, and the content ranged from 8.345 to 29.673 mg/g. The average value of tyrosine was 3.829 mg/g, and the content ranged from 1.754 to 5.796 mg/g. The samples essentially cover the range of variation of leucine and tyrosine, and the distribution within the range is relatively uniform and representative. After removing abnormal samples, 226 samples were finally used for model construction (Table 1).

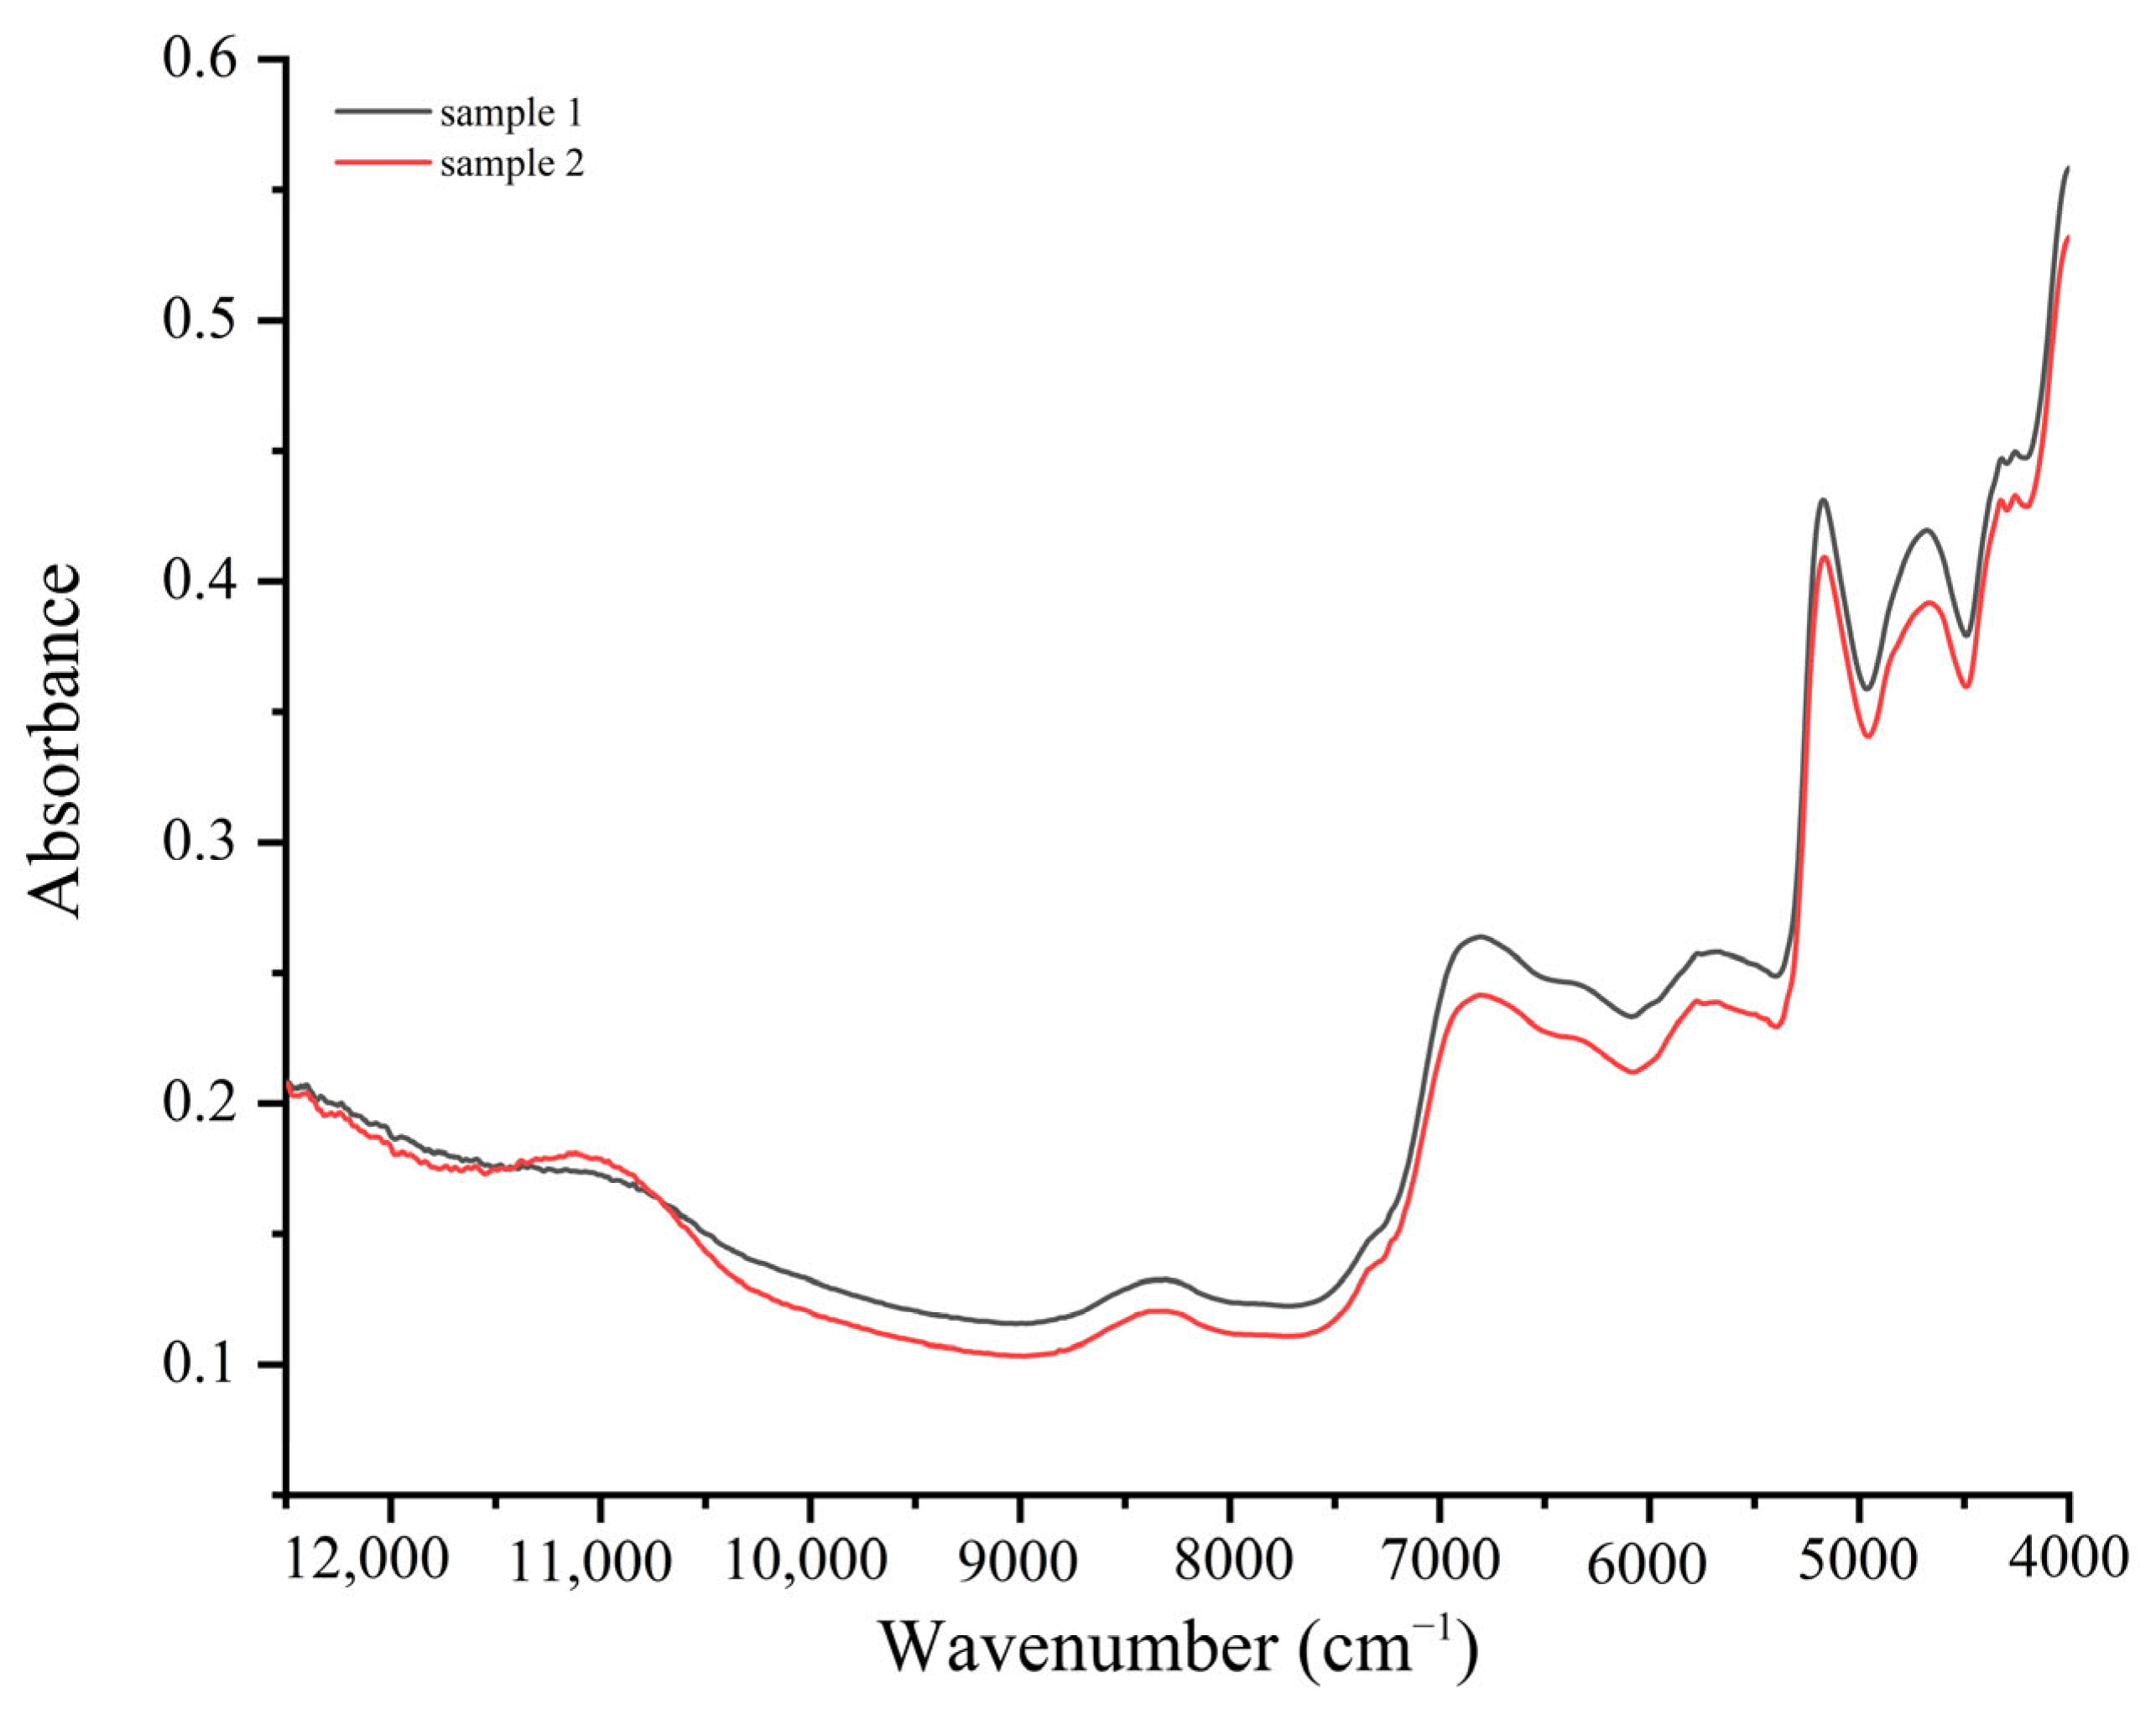
3.2. Near Infrared Spectrum of Tartary Buckwheat Leaves

The near-infrared absorption spectra of the two samples with significant differences in leucine and tyrosine content are shown in Figure 1, which also illustrates the abundance of absorption peaks in the Tartary buckwheat leaves’ near-infrared spectrum. Leucine and tyrosine share hydrogen-containing groups such as C–H and N–H and exhibit high near-infrared absorption peaks. While the spectral shapes of many samples are comparable, the intensity of the absorption peaks varies.

3.3. Establishment of the Model

3.3.1. Influence of Spectral Region on the Model

Following previous studies, eight spectral ranges such as 4000–5000 cm−1, 4000–6000 cm−1, 4000–7000 cm−1, 4000–8000 cm−1, 4000–9000 cm−1, 4000–10,000 cm−1, 5000–9000 cm−1 and 5000–8000 cm−1 were selected to construct the NIR determination model of leucine. The total number of modeling samples was 226. In each modeling, 181 samples were randomly selected as the calibration set and the other 45 samples were the validation set.
In the construction of the determination model for leucine, the modeling effect of all spectral regions was good, and the determination coefficient between the calibration set and the validation set was above 0.91. Among these, the best modeling effect was obtained when the spectrum of 4000–9000 cm−1 was selected, and the coefficient of determination of both the calibration set and the validation set was more than 0.93. The average coefficients of determination of the calibration set and the validation set of the eight spectral regions were 0.9313 and 0.9225, respectively, indicating that the model was relatively stable (Table 2).
In building the tyrosine determination model, eight spectral regions were selected, as shown in Table 3, covering the range 4000–10,000 cm−1. During modeling, it was found that the model created when the spectrum of 4000–10,000 cm−1 was selected was better. The coefficients of determination of the calibration set and the validation set were 0.9076 and 0.9042, respectively, and the mean relative error was less than 10%. The disadvantage was that the number of principal components was high. The spectral range with a low coefficient of determination was 4000–7000 cm−1, but the coefficient of determination here was also above 0.85. The average coefficient of determination of the calibration set and the validation set for the eight spectral ranges were 0.8874 and 0.8761, respectively, which achieved the goal of fast detection (Table 3).

3.3.2. Influence of Modeling Samples on the Model

To further investigate the feasibility and stability of near-infrared spectroscopy combined with the partial least squares method for detecting leucine and tyrosine content in Tartary buckwheat leaves, the optimal spectral ranges of the two amino acids were selected for modeling, and different proportions of calibration and validation test samples were randomly selected for model construction and verification.
The results showed that the coefficient of determination of the model was above 0.92 for different samples. The average determination coefficient of leucine in the calibration and validation set was 0.9510 and 0.9392, respectively, when different samples were used for modeling. This shows that the model for determination of leucine content in Tartary buckwheat leaves constructed using NIR spectral information in the spectral range of 4000–9000 cm−1 was stable and reliable (Table 4).
It was found that when modeling different samples, the average determination coefficient of tyrosine calibration set was 0.8959, and that of validation set was 0.8781, which indicated that the determination model of buckwheat leaf tyrosine content established by using near infrared spectral information in the spectral range of 4000–10,000 cm1 was stable and reliable. When the ratio of calibration set to validation set was 4:1, the constructed model has a better effect (Table 5).

3.3.3. Optimization of the Model

To further optimize the model, different mathematical methods were used to preprocess the spectrum in this experiment. The results show that after preprocessing the spectrum, the average determination coefficient of leucine in the calibration set and validation set was 0.9574 and 0.9507, respectively. The results also proved that the model for determining the leucine content of Tartary buckwheat leaves was stable and reliable based on the spectral information in the near infrared in the spectral range of 4000–9000 cm1. The preprocessing of spectral modeling by centralization, range normalization, vector correction, scattering correction, and first derivative can not only improve the coefficient of determination of the model, but also significantly reduce the number of principal components. For example, the number of principal components in the calibration set and validation set decreased from 21 to 13 when the spectra were preprocessed with the first derivative (11 smoothing points), and the coefficient of determination was also significantly higher than the non-spectral treatment (Table 6).
It was observed that the tyrosine model created by preprocessing spectra with various methods did not have a significant change in the coefficient of determination between the calibration set and the validation set, but after preprocessing spectra with the first derivative, centralization, vector correction, and other methods, the principal component of the model was significantly decreased. For example, after preprocessing the spectrum with the first derivative (smoothing the number of points 11), the number of principal components of the model decreased from 18 to 11, compared to the model without preprocessing the spectrum, and the coefficient of determination of the calibration set and the validation set did not change significantly from the first. The average coefficient of determination of the tyrosine calibration set and validation set obtained after spectrum preprocessing were 0.9090 and 0.8993, respectively, proving that the model for determination of tyrosine content of Tartary buckwheat leaves established using the NIR spectral information in the spectral range of 4000–10,000 cm−1 was stable and reliable (Table 7).

4. Discussion

Sample size and representativeness have great influence on the model effect. The NIR prediction model for sucrose content in peanut kernels built by Telly et al. [25], using 72 peanut resources with edible oil, showed that the coefficient of determination of the optimal model was only 0.822, while Bian et al. [26] expanded the number of modeling samples to 119 and the coefficient of determination of the optimal peanut sucrose prediction model increased to 0.898. Wang et al. [27] used 40 samples to build the near-infrared model for buckwheat grain protein and total flavonoids, but the prediction value of the built model for protein and flavonoids was not ideal, which might be related to the small sample size. Guo et al. [28] used 217 buckwheat samples to build a prediction model for grain protein and found that the coefficient of determination of the prediction model was 0.9481 and the root mean square of the cross-validation was 0.68. A total of 230 samples were used in this work, and the coefficient of determination of the established models was mostly above 0.90. The next experiment is planned to expand the number of samples and try to include representative samples to further improve the representativeness of the samples.
It was found that the multivariate calibration method has a great influence on the modeling effect. Due to the different substances, the best multivariate calibration methods are also different. Zou et al. [29] used the Mahalanobis distance discrimination method, the C support vector machine, and the V support vector machine, to build models for discriminating starch types, and it was found that the support vector machine classification model was effective. Kovalenko et al. [30] used partial least squares (PLS), artificial neural network (ANN), and support vector machine (SVM) to predict amino acids in soybean seeds except for cystine and tryptophan. GUO et al. [31] developed the continuous projection algorithm (SPA), genetic algorithm (GA) and simulated cooling algorithm (SA) using near infrared spectroscopy combined with partial least square number with collaborative interval to build the free amino acid model of matcha with excellent predictive power. Platov et al. [32] used the method of UV-visible near-infrared spectroscopy in combination with multivariate analysis to analyze the classification and identification of buckwheat and oats, and also obtained good results. Ren et al. performed Savitzky–Golay filtering (SG) and standard normal variable transformation (SNV) to preprocess the collected original spectrum, and then compared the multivariate selection algorithm (IgA-PSO) with the univariate selection algorithm (IGA and PSO) to find the optimal feature wavelength. Finally, in combination with the effective features of the above variable screening path, the decision tree based on various kernel functions (DT), partial least squares discriminant analysis (PLS-DA), and support vector machine (SVM) were used to build a black tea quality discrimination model with excellent predictive power [33]. The experimental results showed that the generalization ability and prediction accuracy of the improved random forest algorithm was significantly better than those of the random forest and Ada boost algorithms. The improved random forest model was constructed by using the upward spectral information from a single maize embryo. The correlation coefficient R of the training set was 0.969, the mean square error of the training set was 0.094%, the R of the test set was 0.881, and the mean square error of the test set was 0.404% [34]. In this study, the PLS method was used to build the model, and the coefficient of determination of the model for leucine and tyrosine content met the requirements of the application. In a later stage, other multivariate calibration methods can be tried to further improve the coefficient of determination of the model and reduce the number of principal components of the model. In addition, our research center has been engaged in breeding buckwheat with high content protein and high flavonoid content. The development of rapid non-destructive testing methods for the nutrient content of buckwheat grains can also greatly improve the efficiency of breeding, which is also one of our future research directions.

5. Conclusions

In this study, the contents of leucine and tyrosine in ground Tartary buckwheat leaves were determined by a chemical method, and the prediction model was constructed by near-infrared spectroscopy combined with the quantitative least squares method. According to the determination coefficients of the calibration set and the validation set, the leucine and tyrosine contents in the leaves of Tartary buckwheat had a good modeling effect. The optimal spectral range for the model to predict the leucine content was 4000–9000 cm−1, the first derived (11) preprocessed spectrum, the ratio of the calibration set to validation set was 6:1, and the coefficients of determination of calibration set and validation set were 0.9529 and 0.9502, respectively. The spectral range of the best predictive model for tyrosine content was 4000–10,000 cm−1, and the spectrum of the first derivative (11) was preprocessed. When the ratio of calibration set to validation set was 4:1, the coefficients of determination of calibration set and validation set were 0.9016 and 0.9012, respectively.
The prediction model constructed using near-infrared spectroscopy combined with the least squares method can effectively predict the content of leucine and tyrosine in the leaves of Tartary buckwheat, which is of certain practical value for breeding work. To further optimize the prediction model to improve the scope of the model and the prediction effect, this study will further increase the number of representative buckwheat samples. In the next step, the experiment will also include different seasons, and different biomes, including Fagopyrum dibotrys, Golden Tartary buckwheat, buckwheat and Tartary buckwheat leaf samples, to further perfect the near-infrared prediction model.

Author Contributions

Investigation, data curation, methodology, writing—original draft, funding acquisition: L.Z.; writing—review and editing: R.N.D.; investigation: Y.L.; investigation: Q.D.; resources, writing—review and editing: T.S.; writing—review and editing: J.D.; resources, funding acquisition, project administration, writing—review and editing, supervision: Q.C. All authors have read and agreed to the published version of the manuscript.

Funding

This research was funded by the earmarked fund for China Agricultural Research system (Grant Nos.: CARS-07-A5), the National Natural Science Foundation of China (grant number 31760430), the Science and Technology Foundation of Guizhou Province (grant number QianKeHeJiChu [2020]1Y095).

Institutional Review Board Statement

Not applicable.

Informed Consent Statement

Not applicable.

Data Availability Statement

The data presented in this study are available upon request from the corresponding author.

Conflicts of Interest

The authors declare no conflict of interest.

References

  1. Chen, Q.F. Plant Sciences on Genus Fagopyrum, 1st ed.; Science Press: Beijing, China, 2012; pp. 1–11, 220–226. [Google Scholar]
  2. Wang, L.Y.; Rong, Y.P.; Huang, J.; Chen, Q.F. Analysis and evaluation of the flavonoid content of rhizomes of 211 different Golden buckwheat accessions (Fagopyrum cymosum complex). J. Guizhou Norm. Univ. Nat. Sci. 2019, 37, 25–30, 48. [Google Scholar]
  3. Tong, X.D.; Mao, Y.X. Bacteriostatic Test in Vitro of Fagopyrum Dibotrys Capsules. Clin. J. Trad. Chin. Med. 2022, 34, 310–313. [Google Scholar]
  4. Chen, Q.F.; Huang, X.Y.; Li, H.Y.; Yang, L.J.; Cui, Y.S. Recent progress in perennial buckwheat development. Sustainability 2018, 10, 536. [Google Scholar] [CrossRef] [Green Version]
  5. Luo, Q.L.; Zhou, M.L.; Chen, S.S.; Ruan, J.J. Research Progress of Active Components and Medicinal Value of Fagopyrum cymosum. J. Mtn. Agric. Biol. 2020, 39, 1–13. [Google Scholar]
  6. Geng, Q.; Liu, B.; Zhao, P.C.; Xiong, Y.B.; Li, L.; Yi, J.F.; Lv, C. Molecular mechanism of Fagopyri Dibotryis Rhizoma in treatment of acute lung injury based on network pharmacology and in vitro experiments. Chn. J. Chin. Mar. Med. 2021, 46, 4816–4823. [Google Scholar]
  7. Hou, Z.P.; Zheng, X.; Chen, Q.; Wu, R.Q. Nutritional value, bioactivity of extract and application in animal production of Fagopyrum dibotrys. Chin. J. Anim. Nutr. 2021, 33, 3019–3027. [Google Scholar]
  8. Liu, L.N.; Yan, J.; Kang, A. Influence of jinqiaomai pill combined with SASP on treating UC with dampness-heat in large intestine and its effect on TLR4/NLRP3 signal pathway. J. Nanjing Univ. Tradit. Chin. Med. 2021, 37, 16–20. [Google Scholar]
  9. Zhu, L.W.; Zhou, Y.; Cai, F.; Deng, J.; Huang, J.; Zhang, X.N.; Zhang, J.G.; Chen, Q.F. Quantitative analysis of perennial buckwheat leaves protein and GABA using near infrared spectroscopy. Spectrosc. Spect. Anal. 2020, 40, 2421–2426. [Google Scholar]
  10. Luo, G.B.; Shen, L.S.; Song, Y.H.; Yu, K.; Ji, J.J.; Zhang, C.; Yang, W.L.; Li, X.; Sun, J.Z.; Zhan, K.H.; et al. The MYB family transcription factor TuODORANT1 from Triticum urartu and the homolog TaODORANT1 from Triticum aestivum inhibit seed storage protein synthesis in wheat. Plant Biotechnol. J. 2021, 19, 1863–1877. [Google Scholar] [CrossRef]
  11. Maseta, E.; Mosha, T.C.; Nyaruhucha, C.; Laswai, H. Nutritional quality of quality protein maize-based supplementary foods. Nutr. Food Sci. 2017, 47, 42–52. [Google Scholar] [CrossRef]
  12. Qin, P.Y.; Wang, Q.; Shan, F.; Hou, Z.H.; Ren, G.X. Nutritional composition and flavonoids content of flour from different buckwheat cultivars. Int. J. Food Sci. Tech. 2010, 45, 951–958. [Google Scholar] [CrossRef]
  13. Tao, L.L.; Huang, W.; Yang, X.J.; Cao, Z.Y.; Deng, J.M.; Wang, S.S.; Mei, F.Y.; Zhang, M.W.; Zhang, X. Correlations between near infrared spectra and molecular structures of 20 standard amino acids. Spectrosc. Spect. Anal. 2016, 36, 2766–2773. [Google Scholar]
  14. Dong, E.H.; Tan, H.; Yang, H.B.; Zhao, H.B.; Ma, K.; Yuan, X. Rapid determination of free amino acids in tea by NIR spectroscopy. J. Henan Agri. Sci. 2012, 41, 44–48. [Google Scholar]
  15. Chu, J.; Dong, R.R.; Wang, X.; Li, J.; Zhang, X.F.; Lu, F.J.; Xu, N. Analysis of chemical quality difference between tea leaves and tea beverage using near infrared spectroscopy combined with chemometrics. J. Liaoning Univ. Tradit. Chin. Med. 2021, 23, 39–45. [Google Scholar]
  16. Wei, X.; Xu, N.; Wu, D.; He, Y. Determination of branched-amino acid content in fermented cordyces sinensis mycelium by using FT-NIR spectroscopy technique. Food Bioprocess Tech. 2014, 7, 184–190. [Google Scholar] [CrossRef]
  17. Zhang, Q.; Liu, N.; Wang, S.S.; Pan, L. Nondestructive determination of GABA in germinated brown rice with near infrared spectroscopy based on wavelet transform denoising. Int. J. Agric. Biol. Eng. 2021, 14, 182–187. [Google Scholar] [CrossRef]
  18. Zhang, B. NIR Spectroscopy Model Construction and Application for Amino Acid Composition in Rice Grain. Ph.D. Thesis, Zhejiang University, Hangzhou, China, 2010. [Google Scholar]
  19. Deng, Q.Q.; Lu, Q.; Liu, H.; Hong, Y.B.; Li, H.F.; Liang, X.Q.; Wang, R.F.; Li, S.X.; Chen, X.P. Evaluation of high and low oleic acid peanuts based on widely targeted lipidomics and near infrared spectroscopy. Guangdong Agric. Sci. 2021, 48, 54–63. [Google Scholar]
  20. Huang, W.; Tao, L.L.; Zhang, X.; Yang, X.J.; Hao, X.W. Prediction of amino acids in freeze dried pork by near infrared reflectance spectroscopy. Indian J. Anim. Sci. 2018, 88, 1078–1084. [Google Scholar]
  21. Zhang, J.; Guo, J.; Zhang, M.L.; Zhang, X.; E, J.J. Establishment of rapid detection model of buckwheat nutritional components based on near infrared spectroscopy. J. Chin. Cereals Oils Assoc. 2020, 6, 151–158. [Google Scholar]
  22. Zhu, L.W.; Yan, J.X.; Huang, J.; Shi, T.X.; Cai, F.; Li, H.Y.; Chen, Q.F.; Chen, Q.J. Rapid determination of amino acids in golden tartary buckwheat based on near infrared spectroscopy and artificial neural network. Spectrosc. Spect. Anal. 2022, 42, 49–55. [Google Scholar]
  23. Cheng, Y.J.; Chen, X.W.; Zhang, S.S.; Lou, J.; Zhang, T.; Wang, Z.Z.; Mao, Y.C.; Sha, R.Y.; Mao, J.W. Analysis of amino acids and in vitro antioxidant activity of Cudrania tricuspidata Jiaosu. Sci. Technol. Food Ind. 2018, 39, 1–7, 12. [Google Scholar]
  24. Li, J.H.; Chen, B.; Ma, X.; Zhao, L.L.; Lao, C.L.; Zhang, W.J.; Duan, J.; Tao, S.; Zhang, L.D.; Yan, Y.L. Development of specific near infrared analysis software. Mod. Sci. Instrum. 2008, 4, 35–38. [Google Scholar]
  25. Qin, L.; Liu, H.; Du, P.; Dong, W.Z.; Huang, B.Y.; Han, S.Y.; Zhang, Z.X.; Qi, F.Y.; Zhang, X. Determination of sucrose content in peanut seed kernel based on near infrared spectroscopy. Chin. J. Oil Crop Sci. 2016, 38, 666–671. [Google Scholar]
  26. Bian, N.F.; Tong, F.; Gong, J.L.; Sun, D.L.; Shen, Y.; Wang, X.; Xing, X.H.; Wang, X.J. Establishment of near infrared spectroscopy model for predicting sucrose content of peanut seed and application in mutants selection. J. Nucl. Agric. Sci. 2022, 36, 251–258. [Google Scholar]
  27. Wang, F.H.; Zhu, H.L.; Yang, J.; Xi, Z.R. Research on determination method of starch, protein and total flavonoids content in buckwheat by Near-infrared spectroscopy. Sci. Technol. Food Ind. 2014, 35, 281–284. [Google Scholar] [CrossRef]
  28. Guo, H.M.; Yang, X.S.; Liu, S.C.; Li, J.C.; Ren, G.X. Rapid determination of protein and starch in buckwheat by near-infrared reflectance spectroscopy. J. Plant Genet. Resour. 2017, 18, 467–471. [Google Scholar]
  29. Zou, T.T.; Dou, Y.; Wang, Y.; Liu, Y.; Duan, Z.Y.; Zhang, Q.C. Non-destructive determination of starch category by using C-SVM and ν-SVM on NIR spectroscopy. Sci. Technol. Food Ind. 2013, 34, 317–319. [Google Scholar]
  30. Kovalenko, I.V.; Rippke, G.R.; Hurburgh, C.R. Determination of amino acid composition of soybeans (Glycine max) by near-infrared spectroscopy. J. Agric. Food Chem. 2006, 54, 3485–3491. [Google Scholar] [CrossRef] [Green Version]
  31. Guo, Z.M.; Barimah, A.O.; Yin, L.M.; Chen, Q.S.; Shi, J.Y.; EI-Seedi, H.R.; Zou, X.B. Intelligent evaluation of taste constituents and polyphenols-to-amino acids ratio in matcha tea power using near infrared spectroscopy. Food Chem. 2021, 353, 29372. [Google Scholar] [CrossRef]
  32. Platov, Y.T.; Metlenkin, D.A.; Platova, R.A.; Rassulov, A.I.; Vereshchagin, A.I.; Marin, V.A. Buckwheat identification by combined uv-vis-nir spectroscopy and multivariate analysis. J. Appl. Spectrosc. 2021, 88, 723–730. [Google Scholar] [CrossRef]
  33. Ren, G.X.; Ning, J.M.; Zhang, Z.Z. Multi-variable selection strategy based on near-infrared spectra for the rapid description of dianhong black tea quality. Spectrochim. Acta A 2020, 245, 118918. [Google Scholar] [CrossRef] [PubMed]
  34. Wu, J.Z.; Zhang, L.; Li, J.B.; Liu, C.L.; Sun, X.R.; Yu, L. Detection Model of Moisture Content of Single Maize Seed Based on Hyperspectral Image and Ensemble Learning. Trans. Chin. Soc. Agric. Mach. 2022, 5, 302–308. [Google Scholar]
Figure 1. Golden Tartary buckwheat leaves’ original near-infrared spectrum. Sample 1 and sample 2 represents: two varieties of Golden Tartary buckwheat with different leucine and tyrosine contents in leaves.
Applsci 12 11051 g001
Table 1. Contents of Leu and Tyr in Golden Tartary buckwheat leaves.
Amino AcidsLeu (mg/g)Tyr (mg/g)
Minimum8.3451.754
Maximum29.6735.796
Average14.1853.829
Table 2. Influence of spectral range on NIR prediction results (Leu).
Spectral
Regions/cm1
Principal
Component
Calibration SetValidation Set
R2SECRSD/%R2SECRSD/%
4000–5000120.92110.624.740.91300.443.41
4000–6000130.92980.584.470.91290.443.42
4000–7000150.94400.523.990.91900.423.29
4000–8000160.94230.534.050.92820.403.10
4000–9000130.93200.584.400.93700.372.91
4000–10,000130.93180.584.410.93710.372.90
5000–9000110.92100.624.740.92050.423.26
5000–8000140.92850.594.510.91240.443.43
Average130.93130.584.410.92250.413.22
Table 3. Influence of spectral range on NIR prediction results (Tyr).
Spectral
Regions/cm−1
Principal
Component
Calibration SetValidation Set
R2SECRSD/%R2SECRSD/%
4000–5000170.87300.186.320.86900.176.59
4000–6000160.87300.176.490.86170.176.54
4000–7000150.85890.186.820.86870.176.37
4000–8000170.87490.176.450.87270.176.28
4000–9000180.89360.165.950.87740.166.16
4000–10,000180.90760.155.540.90420.155.44
5000–9000160.88870.166.080.86230.176.53
5000–8000190.92980.134.830.89290.155.75
Average170.88740.166.060.87610.166.21
Table 4. NIR prediction results of the model for different samples (Leu).
Calibration Set:
Validation Set
Principal
Component
Calibration SetValidation Set
R2SECRSD/%R2SECRSD/%
1:1160.94290.503.820.92390.574.41
2:1200.96280.372.870.96550.433.32
3:1180.94740.493.800.94350.443.37
4:1160.94230.534.050.92820.403.10
5:1200.96120.413.160.92840.554.22
6:1210.94930.473.580.94560.493.81
Average190.95100.463.550.93920.483.71
Table 5. NIR prediction results of the model for different samples (Tyr).
Calibration Set:
Validation Set
Principal
Component
Calibration SetValidation Set
R2SECRSD%R2SECRSD%
1:1150.86600.186.630.84960.197.03
2:1200.93260.124.410.88670.186.79
3:1190.91640.145.410.88790.155.44
4:1180.90760.155.540.90420.155.44
5:1170.87490.176.450.87270.176.28
6:1160.87770.176.330.86720.176.58
Average180.89590.165.800.87810.176.26
Table 6. The influence of different pretreatment and smoothing methods on NIRS prediction results (Leu).
Preprocessing MethodsPrincipal
Component
Calibration SetValidation Set
R2/%SECRSD%R2/%SECRSD%
No-preprocessing210.94930.473.580.94560.493.81
Centralization190.95870.423.230.95170.463.59
Range normalization190.95600.443.340.94270.503.91
Vector correction170.95230.453.470.95220.463.57
Scatter correction190.96210.403.100.95670.433.40
First derivative (11)130.95290.453.450.95020.473.65
First derivative (13)130.95270.453.460.92450.574.49
First derivative (15)140.95010.463.550.94750.483.74
First derivative (17)150.95190.463.480.94720.483.76
Second derivative (11)200.96720.382.880.95370.453.52
Second derivative (13)200.96390.393.020.96310.403.14
Second derivative (15)200.96180.413.110.96130.413.22
Second derivative (17)210.96700.382.890.96310.403.14
Average180.95740.433.270.95070.463.61
Table 7. The influence of different pretreatment and smoothing methods on NIRS prediction results (Tyr).
Preprocessing
Methods
Principal
Component
Calibration SetValidation Set
R2SECRSD%R2SECRSD%
No-preprocessing180.90760.155.540.90420.155.44
Centralization170.90090.155.740.88610.165.94
Range normalization190.92480.135.000.90600.145.39
Vector correction170.91400.145.340.90590.145.40
Scatter correction180.91570.145.290.89460.155.71
First derivative (11)110.90160.155.720.90120.155.53
First derivative (13)110.89910.155.790.88080.166.07
First derivative (15)140.91990.145.160.90740.145.35
First derivative (17)150.91820.145.210.90710.145.36
Second derivative (11)160.88550.166.170.88060.166.08
Second derivative (13)180.91350.145.360.90820.145.33
Second derivative (15)170.89640.165.870.89550.155.69
Second derivative (17)190.92040.145.140.91380.145.16
Average160.90900.155.490.89930.155.57
Publisher’s Note: MDPI stays neutral with regard to jurisdictional claims in published maps and institutional affiliations.

