1. Introduction
The power system possesses very rich optical fiber resources. Optical fiber ground wire (OPGW) and optical fiber composite phase conductors (OPPC) have been widely used in power systems for information communication and system control. The optical fiber in the OPGW and OPPC carries important power services, such as relay protection information, system operation data, and power dispatching instructions, etc., so the state sensing and health maintenance of power transmission lines become extremely important. Some natural disasters, such as ice covering, mountain fires, and lightning strikes often endanger the safety of the overhead power transmission lines, and corresponding sensors have been applied to them for early fault diagnosis and maintenance. The fiber Bragg gratings (FBGs) have been used in overhead power transmission lines for ice monitoring [
1], and the all-fiber interferometer based on hybrid fiber Bragg grating cavity [
2] and the compact Fabry–Perot interferometer (FPI) [
3] can also be integrated into the optical fiber in OPGW/OPPC for multi-parameter monitoring, such as temperature, strain, vibration, and so on. Moreover, internet of things (IoT) based sensing networks are widely adopted for the state monitoring of power transmission lines [
4]. By contrast, distributed optical fiber sensors have excellent application potential in the power industry, as they are passive, have anti-electromagnetic interference, and are resistant to corrosion, etc. The optical fiber in the OPGWs and OPPCs can be used as a sensor, and the sensing nodes along the optical fiber are infinite in theory by distributed sensing technology. Typically, the optical time domain reflectometer (OTDR) is adopted to monitor the breakpoints or corrosion due to hydrogen absorption in OPGW [
5,
6,
7]. In recent years, other light-scattering measurement-based distributed optical fiber sensors have also been adopted widely, for temperature, strain, vibration, and galloping monitoring [
8,
9,
10,
11,
12].
When light propagates in optical fiber, it will generate Rayleigh scattering light, spontaneous Brillouin scattering light, and Raman scattering light. The frequency of the Rayleigh scattering light is the same as the original light, and the frequencies of Brillouin and Raman scattering lights shift about ±11 GHz and ±13.2 THz, respectively. Based on the optical time domain reflecting technology, Raman scattering light was first used for distributed temperature monitoring, as the position where the probe pulse transmits and light scattering happens can be accurately located. The Raman Stokes light and anti-Stokes light are only sensitive to the temperature parameter [
13], so the Raman OTDR becomes an ideal distributed temperature sensor and is widely used now. However, as the spontaneous Raman scattering light is quite weak, the measurement range is generally lower than 10 km with a spatial resolution of about 1 m. Additionally, Raman OTDR with a much high dynamic range has been reported [
11], but it is not enough compared with the Brillouin or Rayleigh scattering-based distributed temperature sensors [
14,
15,
16]. Generally, the measuring distance of the Brillouin OTDR is several tens of kilometers. It is based on the linear relationship between the center frequency shift of the Brillouin spectrum and the temperature/strain. As the dynamic range of the Brillouin OTDR is limited by the scattered signal power and the sensitivity of signal receiving and processing units [
14], it is quite difficult to enhance the measuring distance to 100 km with high spatial resolution, for example, 1 m. The Rayleigh scattering in optical fiber has a much higher power level than that of the Brillouin and Raman scattering, so the measuring distance can be easily improved to more than 100 km [
17]. By the characteristics of the coherent Rayleigh noise (CRN) [
10], the Rayleigh scattering signals from different sweeping frequencies at each position along the sensing fiber can be used to measure the temperature/strain, as the frequency shift of the CRN trace also linearly changes with the temperature/strain sensed [
18,
19,
20].
For ultra-long-distance OPGW/OPPC temperature/strain measurement, measurement efficiency should be considered. The measurement time should be as short as possible when the measurement accuracy is guaranteed. However, the measurement time is generally decided by the distance, which includes the data acquisition time and processing time [
18]. So, in this paper, based on the temperature/stain measurement method by Rayleigh scattering in optical fiber, data with different array lengths are adopted in the temperature/strain demodulation algorithm to analyze the measurement efficiency, and by the optimization of the signal sampling arrangement and corresponding signal processing algorithm, the efficiency for the OPGW/OPPC distributed temperature/strain measurement can be greatly improved.
2. Experiment and Theory
The Rayleigh scattering-based distributed optical fiber temperature/strain sensing system is usually called coherent OTDR (COTDR) [
18,
21].
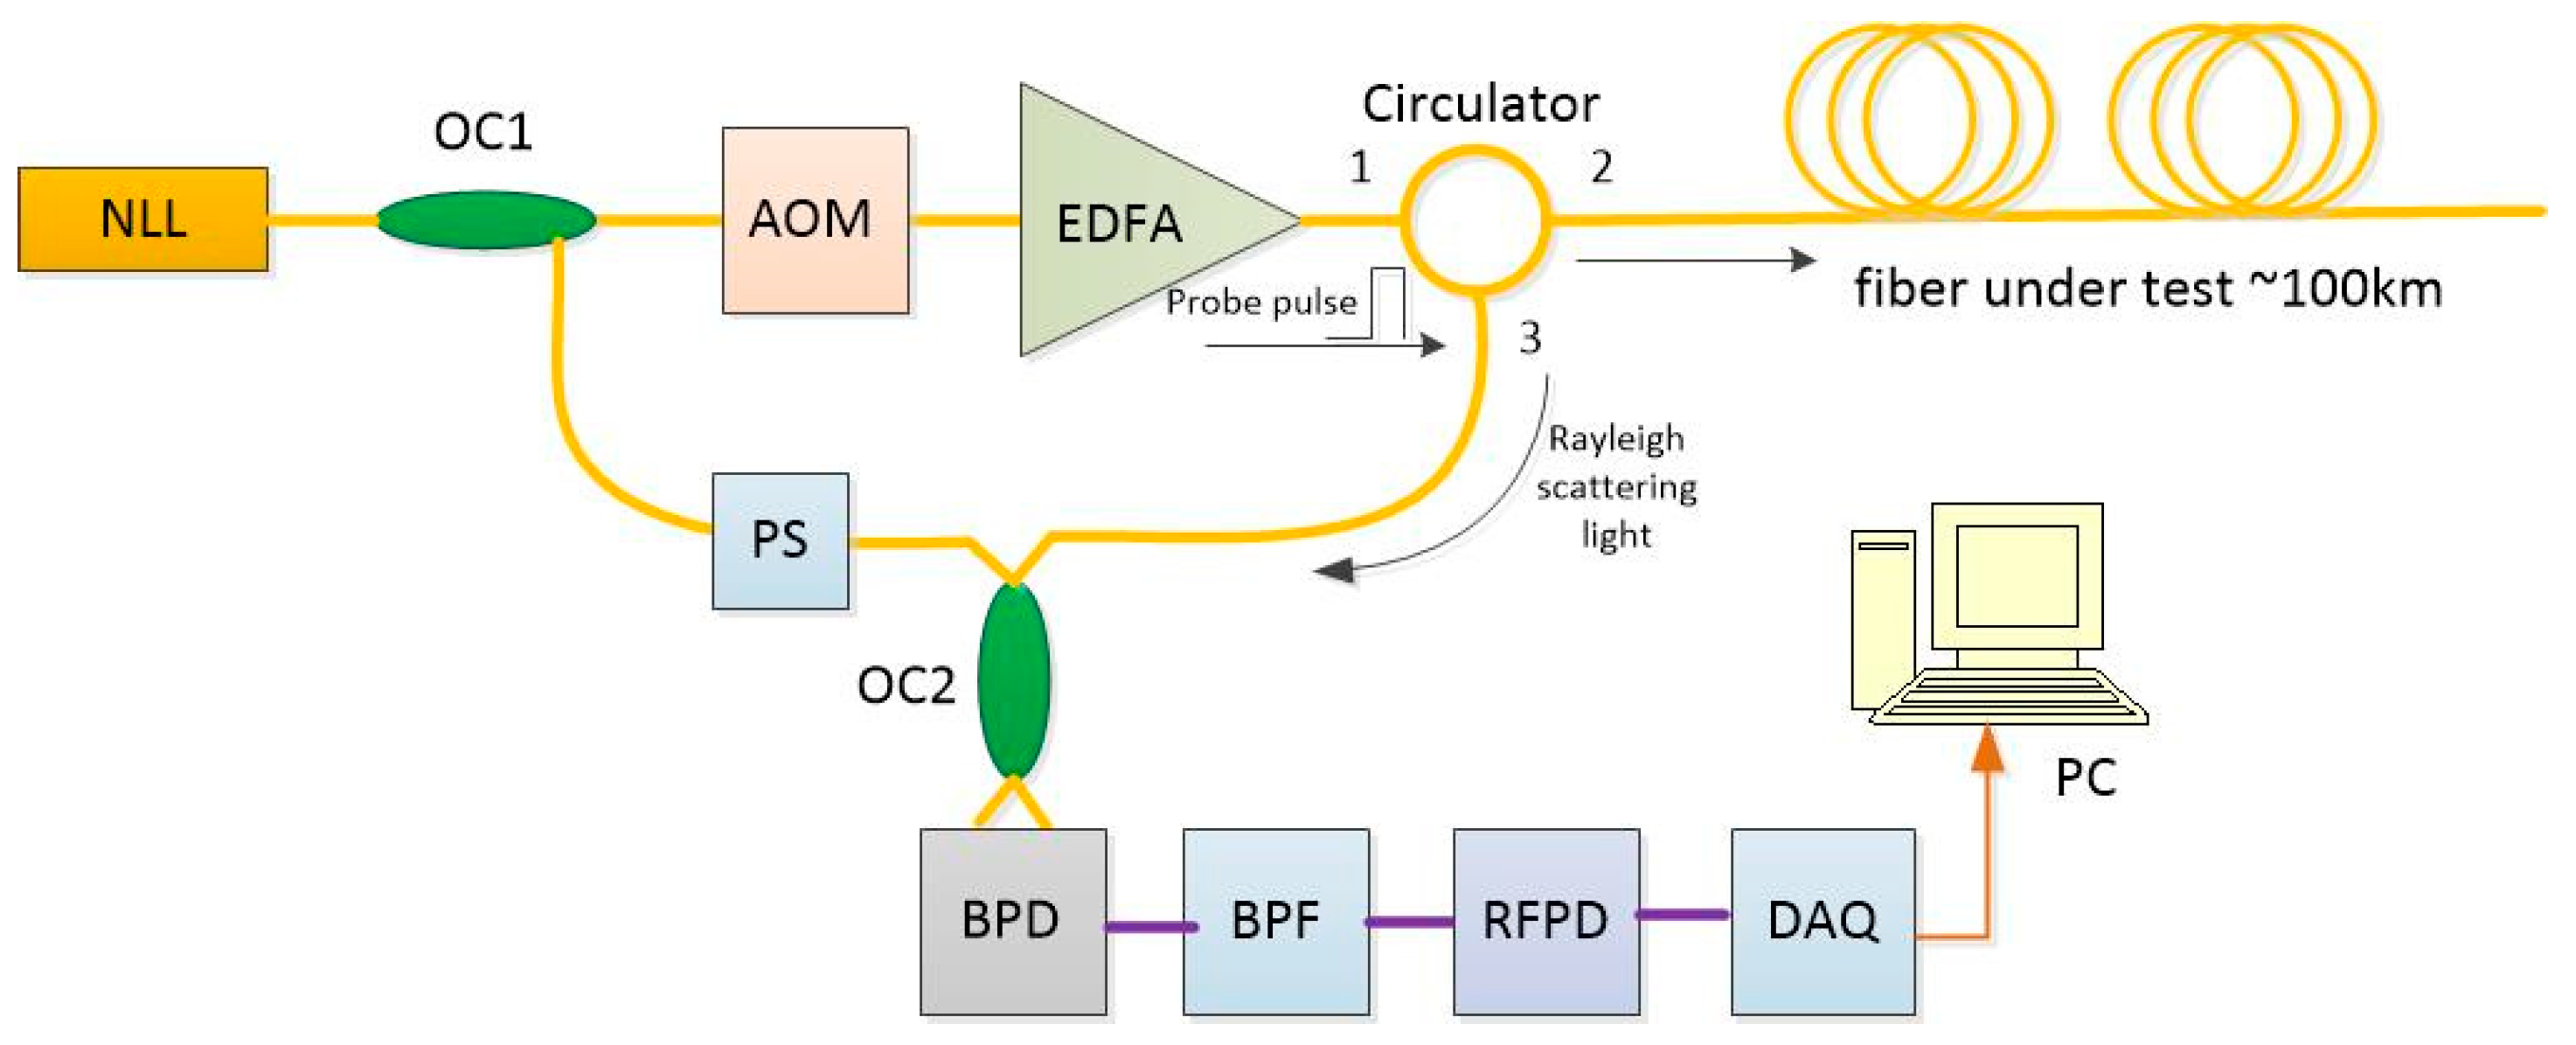
Figure 1 shows a typical COTDR structure. A narrow linewidth laser (NLL) outputs continuous laser light, and the laser light is split by an optical coupler 1 (OC1) with a ratio of 90/10. The output light with lower power comes into the acousto-optic modulator (AOM) and then the AOM generates an optical probe pulse, and through the Erbium-doped fiber amplifier (EDFA), the peak power of the probe pulse is improved to about 30 dBm. The probe pulse is then launched into the 1st port of the optical fiber circulator, and then it outputs from the 2nd port that links the fiber under testing, and the Rayleigh scattering light of the probe pulse propagating in the fiber under test comes back, and through the 3rd port, it is input into the optical coupler 2 (OC2). The OC2 is an X-type 3 dB coupler, in which the laser light with higher power from the OC1 mixes with the Rayleigh scattering light and then coherent intermediate frequency signals are generated by heterodyne. The coherent intermediate frequency signal is then converted into a radio frequency (RF) signal by the balanced photodetector (BPD).
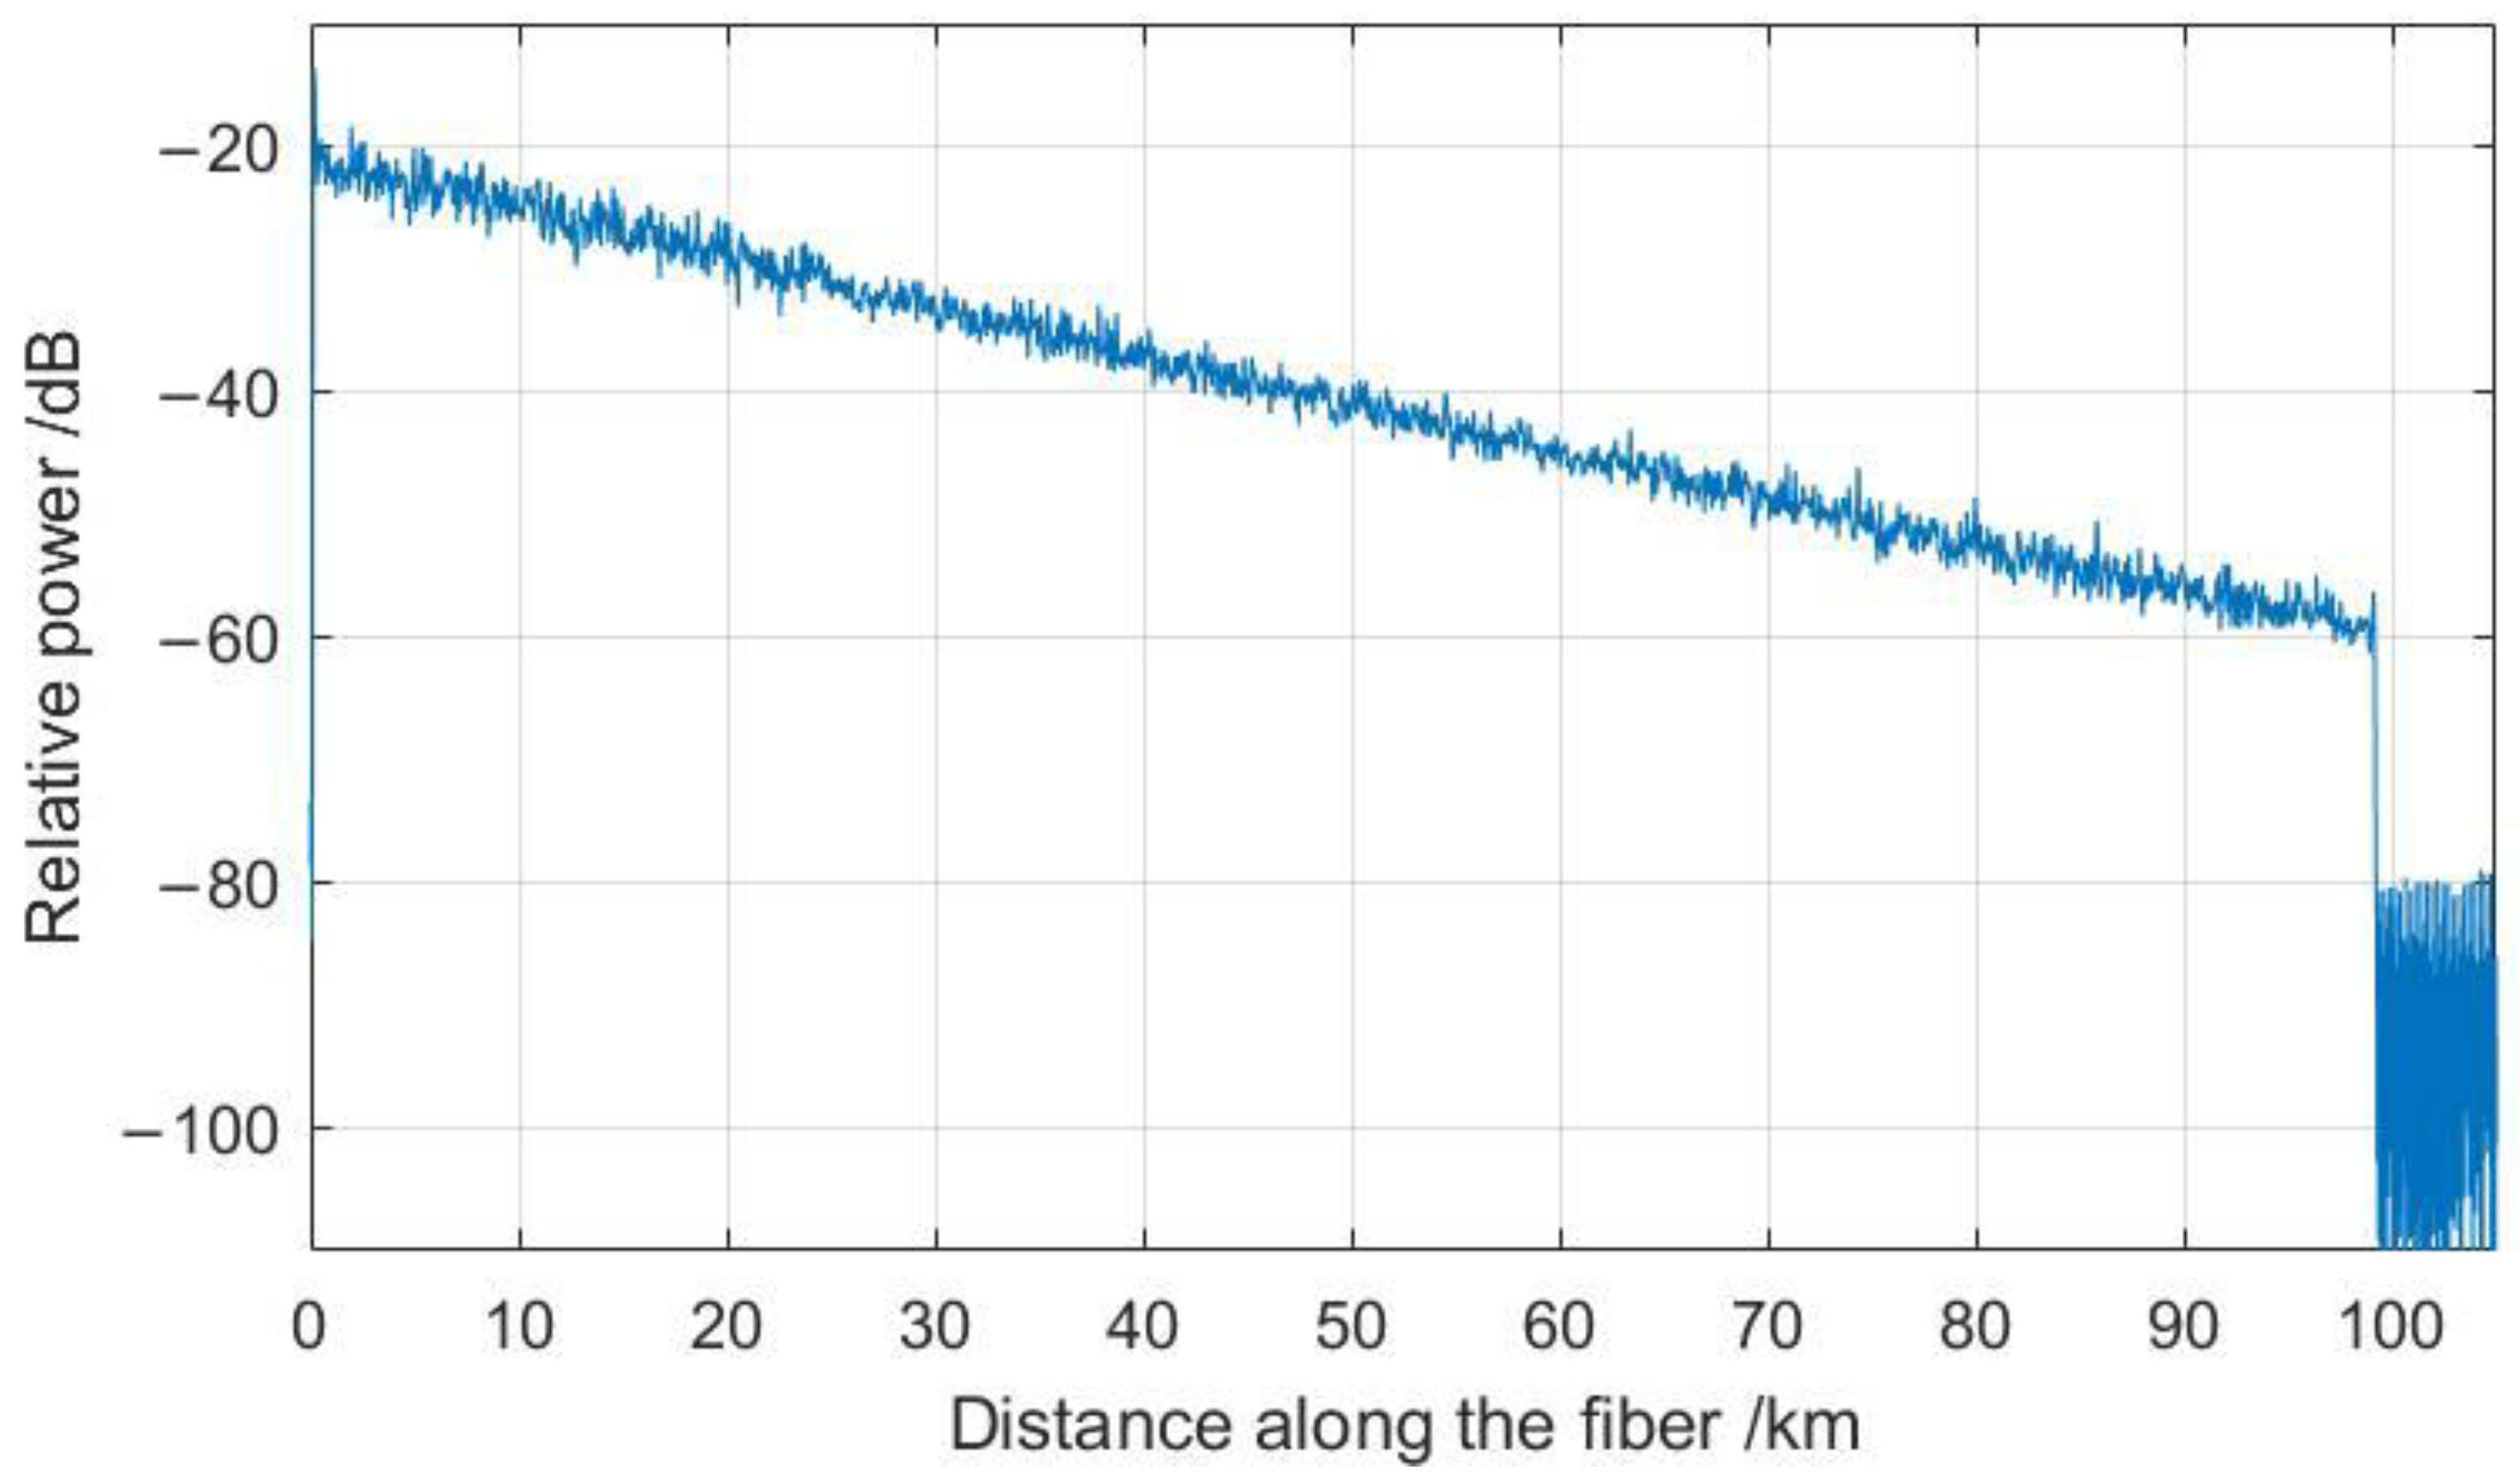
In the experiment, a polarization scrambler (PS) is adopted to randomize the optical polarization state of the input light to reduce the polarization noise in the OTDR trace. As the AOM shifts the frequency of its input light by 200 MHz, the center frequency of the RF signal is at 200 MHz. Then, a band pass filter (BPF) with a center frequency of 200 MHz and bandwidth of 10 MHz purifies the RF signal, and then the power of the RF signal is then converted into a voltage signal by the radio frequency power detector (RFPD). A data acquisition card (DAQ) collects the voltage signal and sends the data to the personal computer (PC). Finally, the OTDR trace is presented on the screen of the PC, as shown in
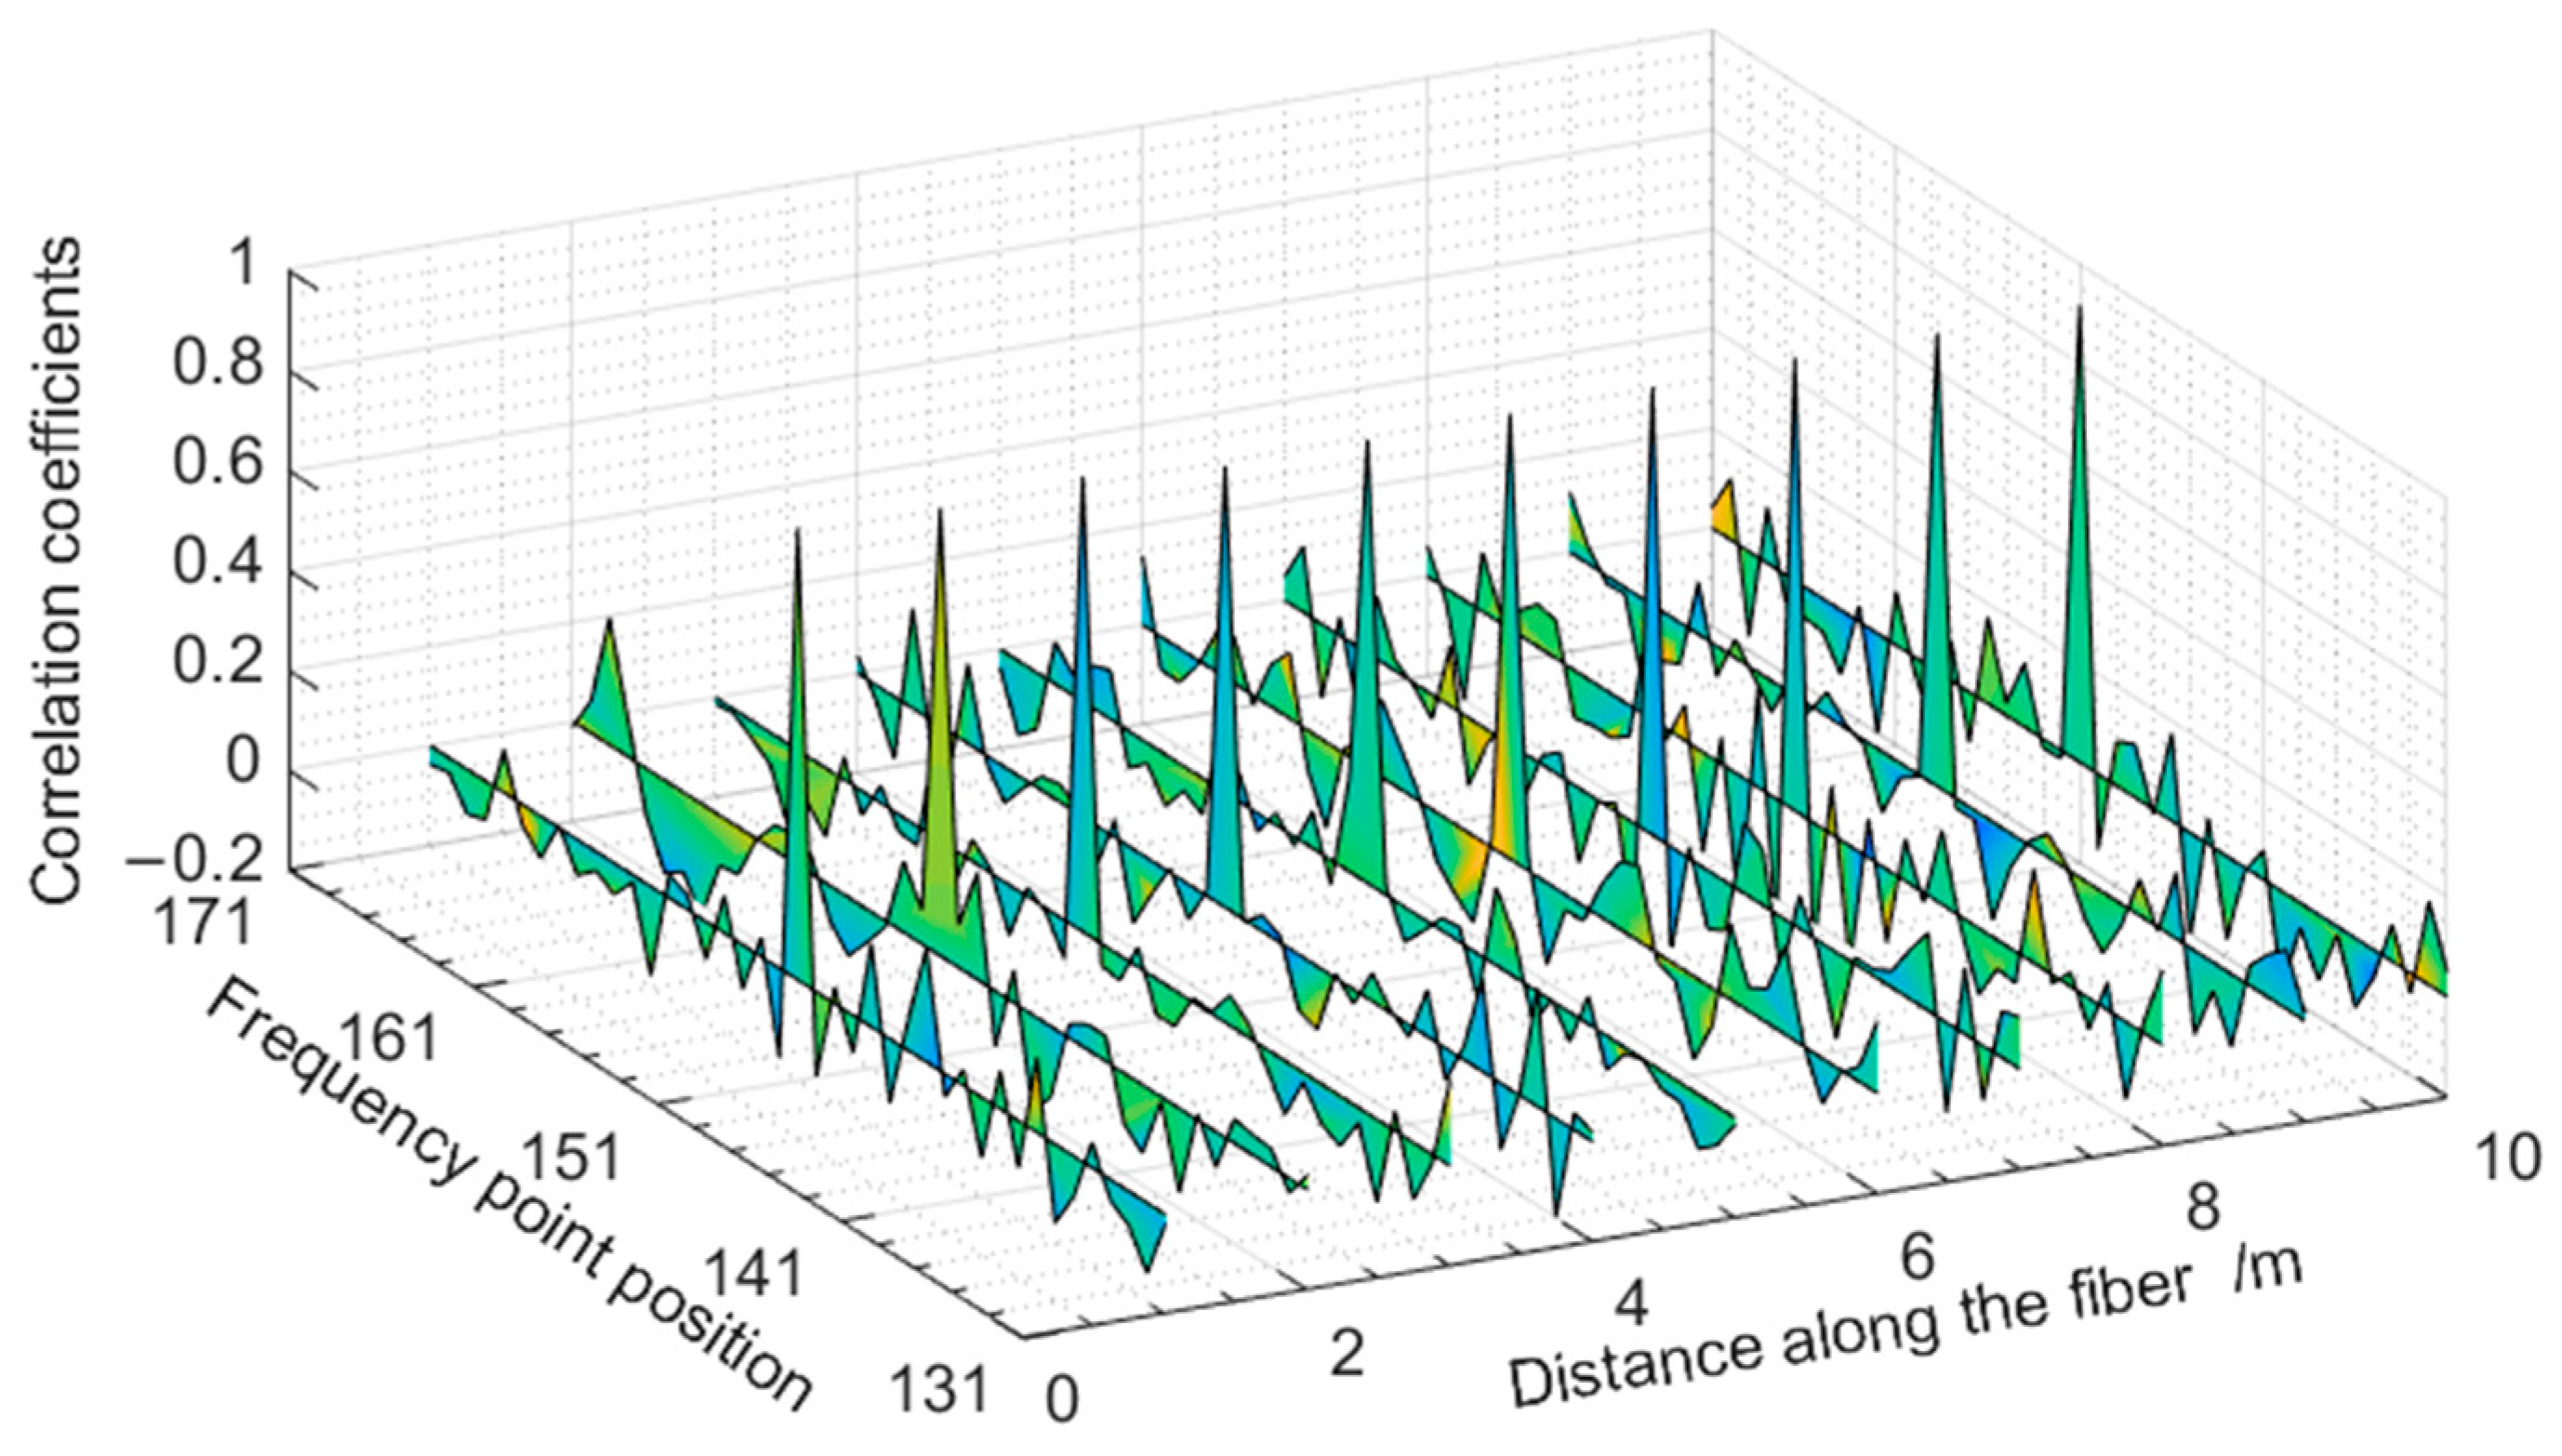
Figure 2. By linearly changing the driving current or laser diode temperature, the laser frequency output from the NLL will be linearly changed. Therefore, the three-dimensional (3D) Rayleigh scattering spectra about the fiber length, Rayleigh scattering power, and frequencies are obtained.
To demodulate the temperature/strain, data about the 3D Rayleigh spectrum from two measurements are needed. Then, for each position along the sensing fiber, two 2D arrays containing the frequency and power data of Rayleigh scattering light are extracted, respectively, from the data about the two 3D Rayleigh spectra. By the cross-correlation algorithm in Formula (1), the Rayleigh frequency shift can be determined [
18].
In Formula (1),
u and
v represent two independent measurements;
is the cross-correlation coefficient at position
L with a Rayleigh frequency shift of
;
and
are the 2D arrays by the
uth measurement and the
vth measurement, respectively; and
and
are the average values of the 2D arrays
and
with array length
m that is also the number of frequency sweeping points. At last, the temperature or strain can be obtained by the conversion relationships in Formulas (2) and (3) between the Rayleigh frequency shift and temperature change Δ
T or strain change Δ
ε.
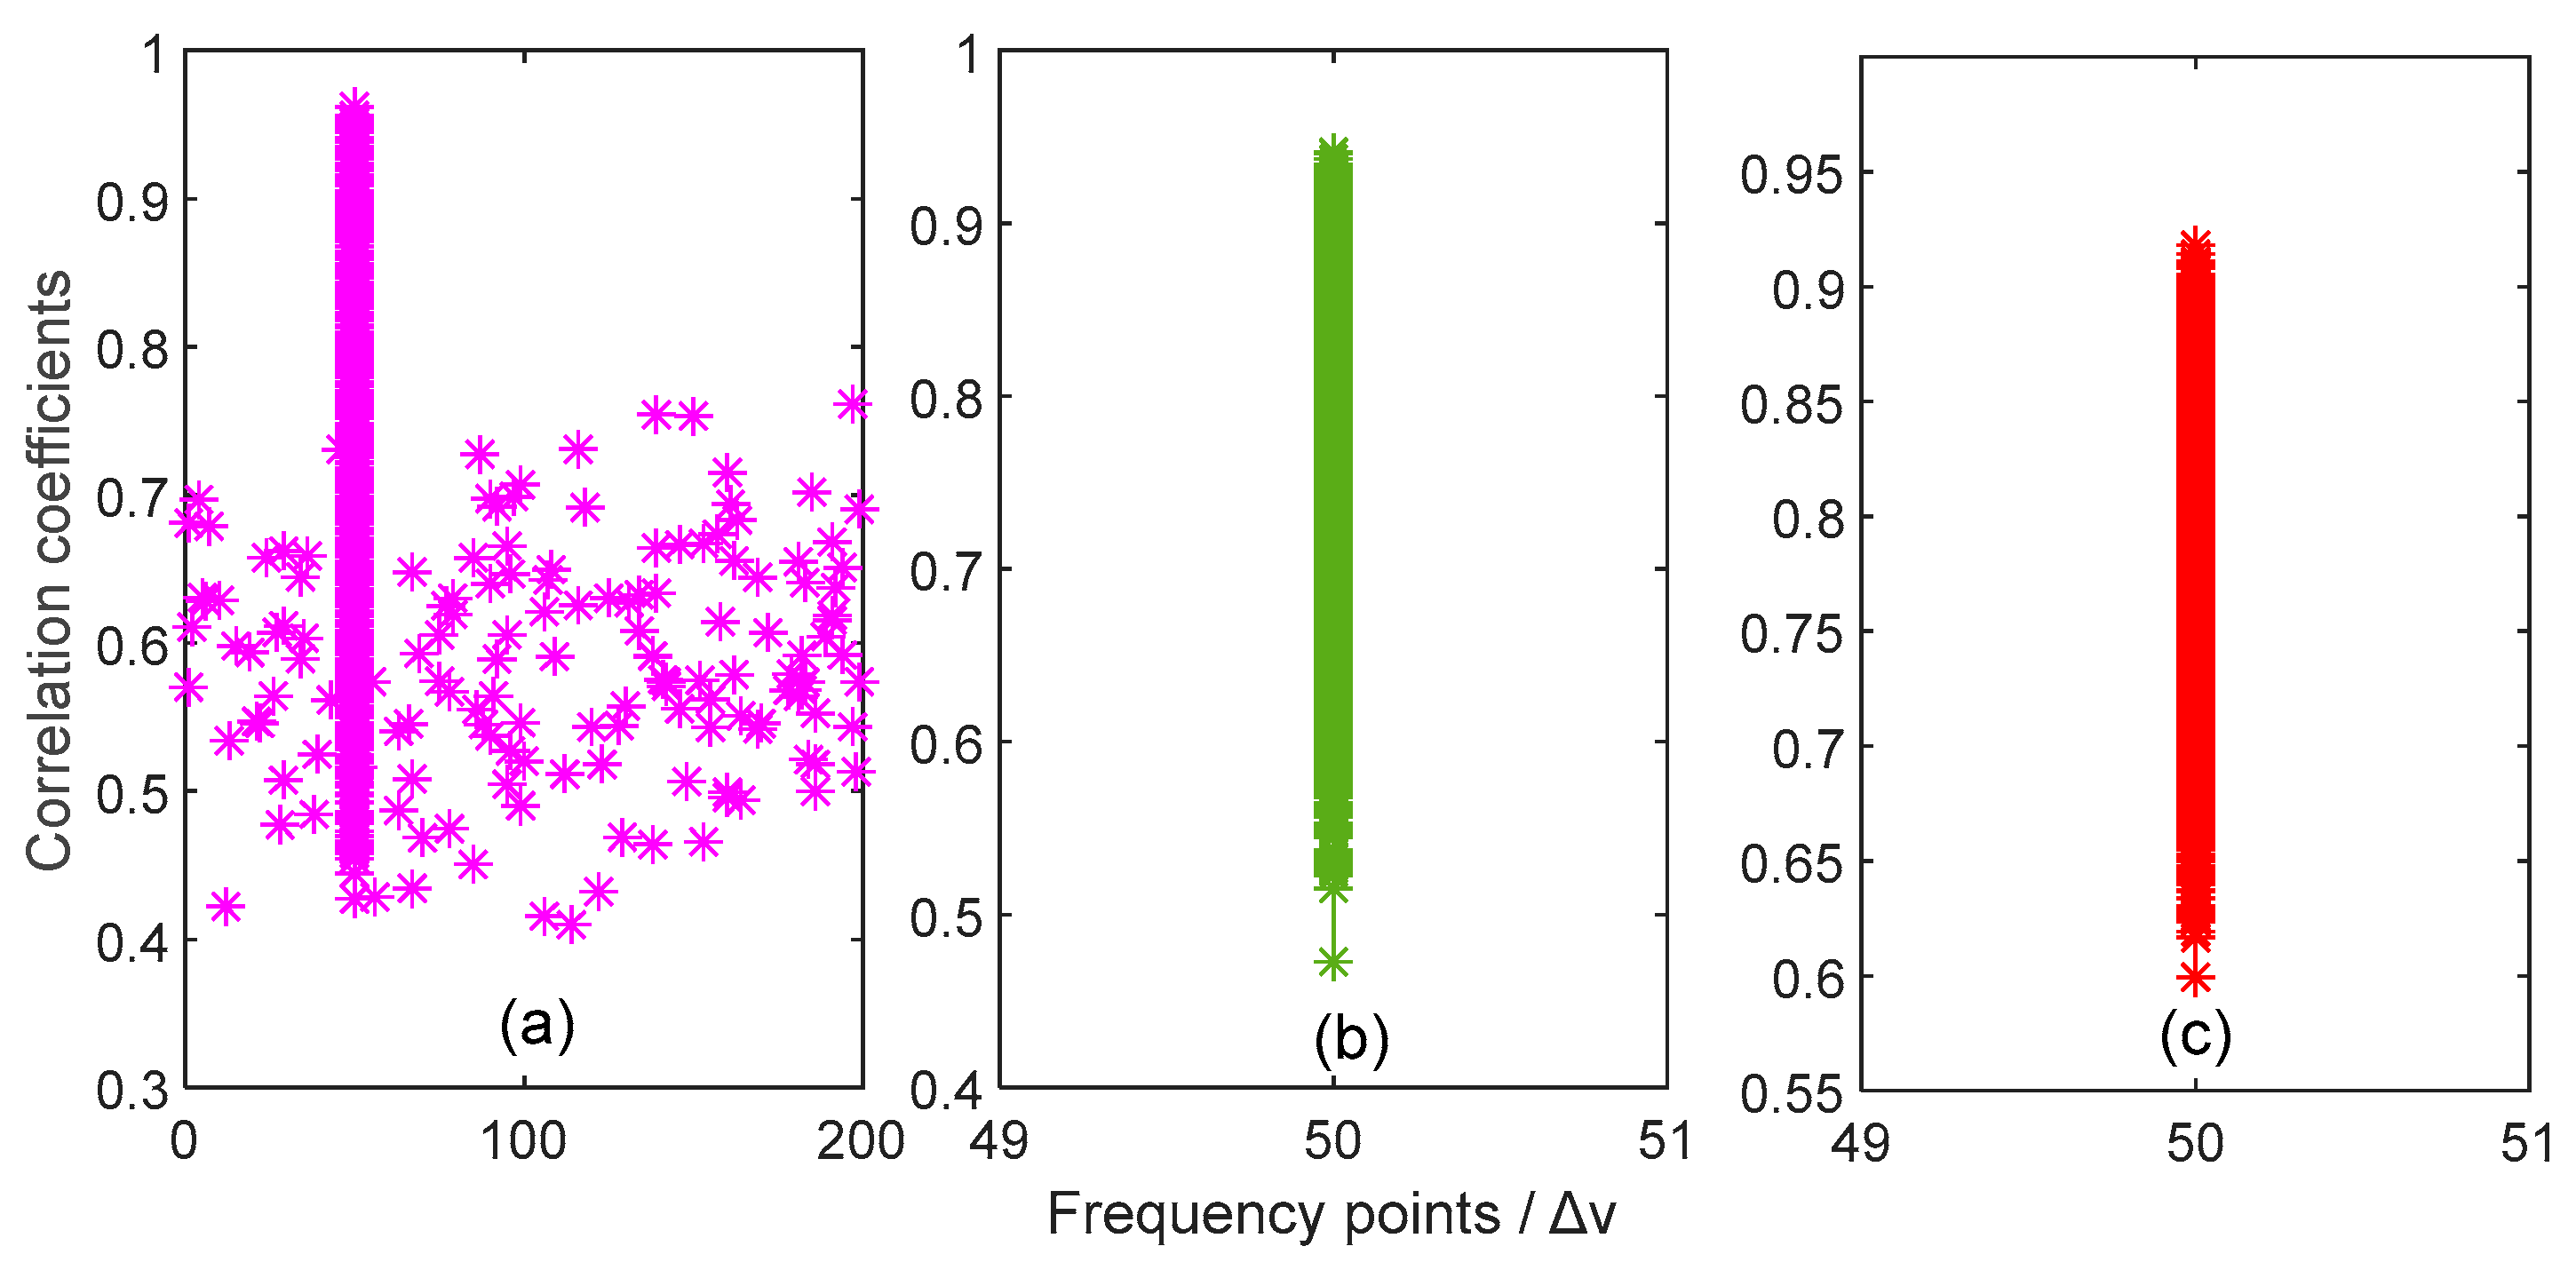
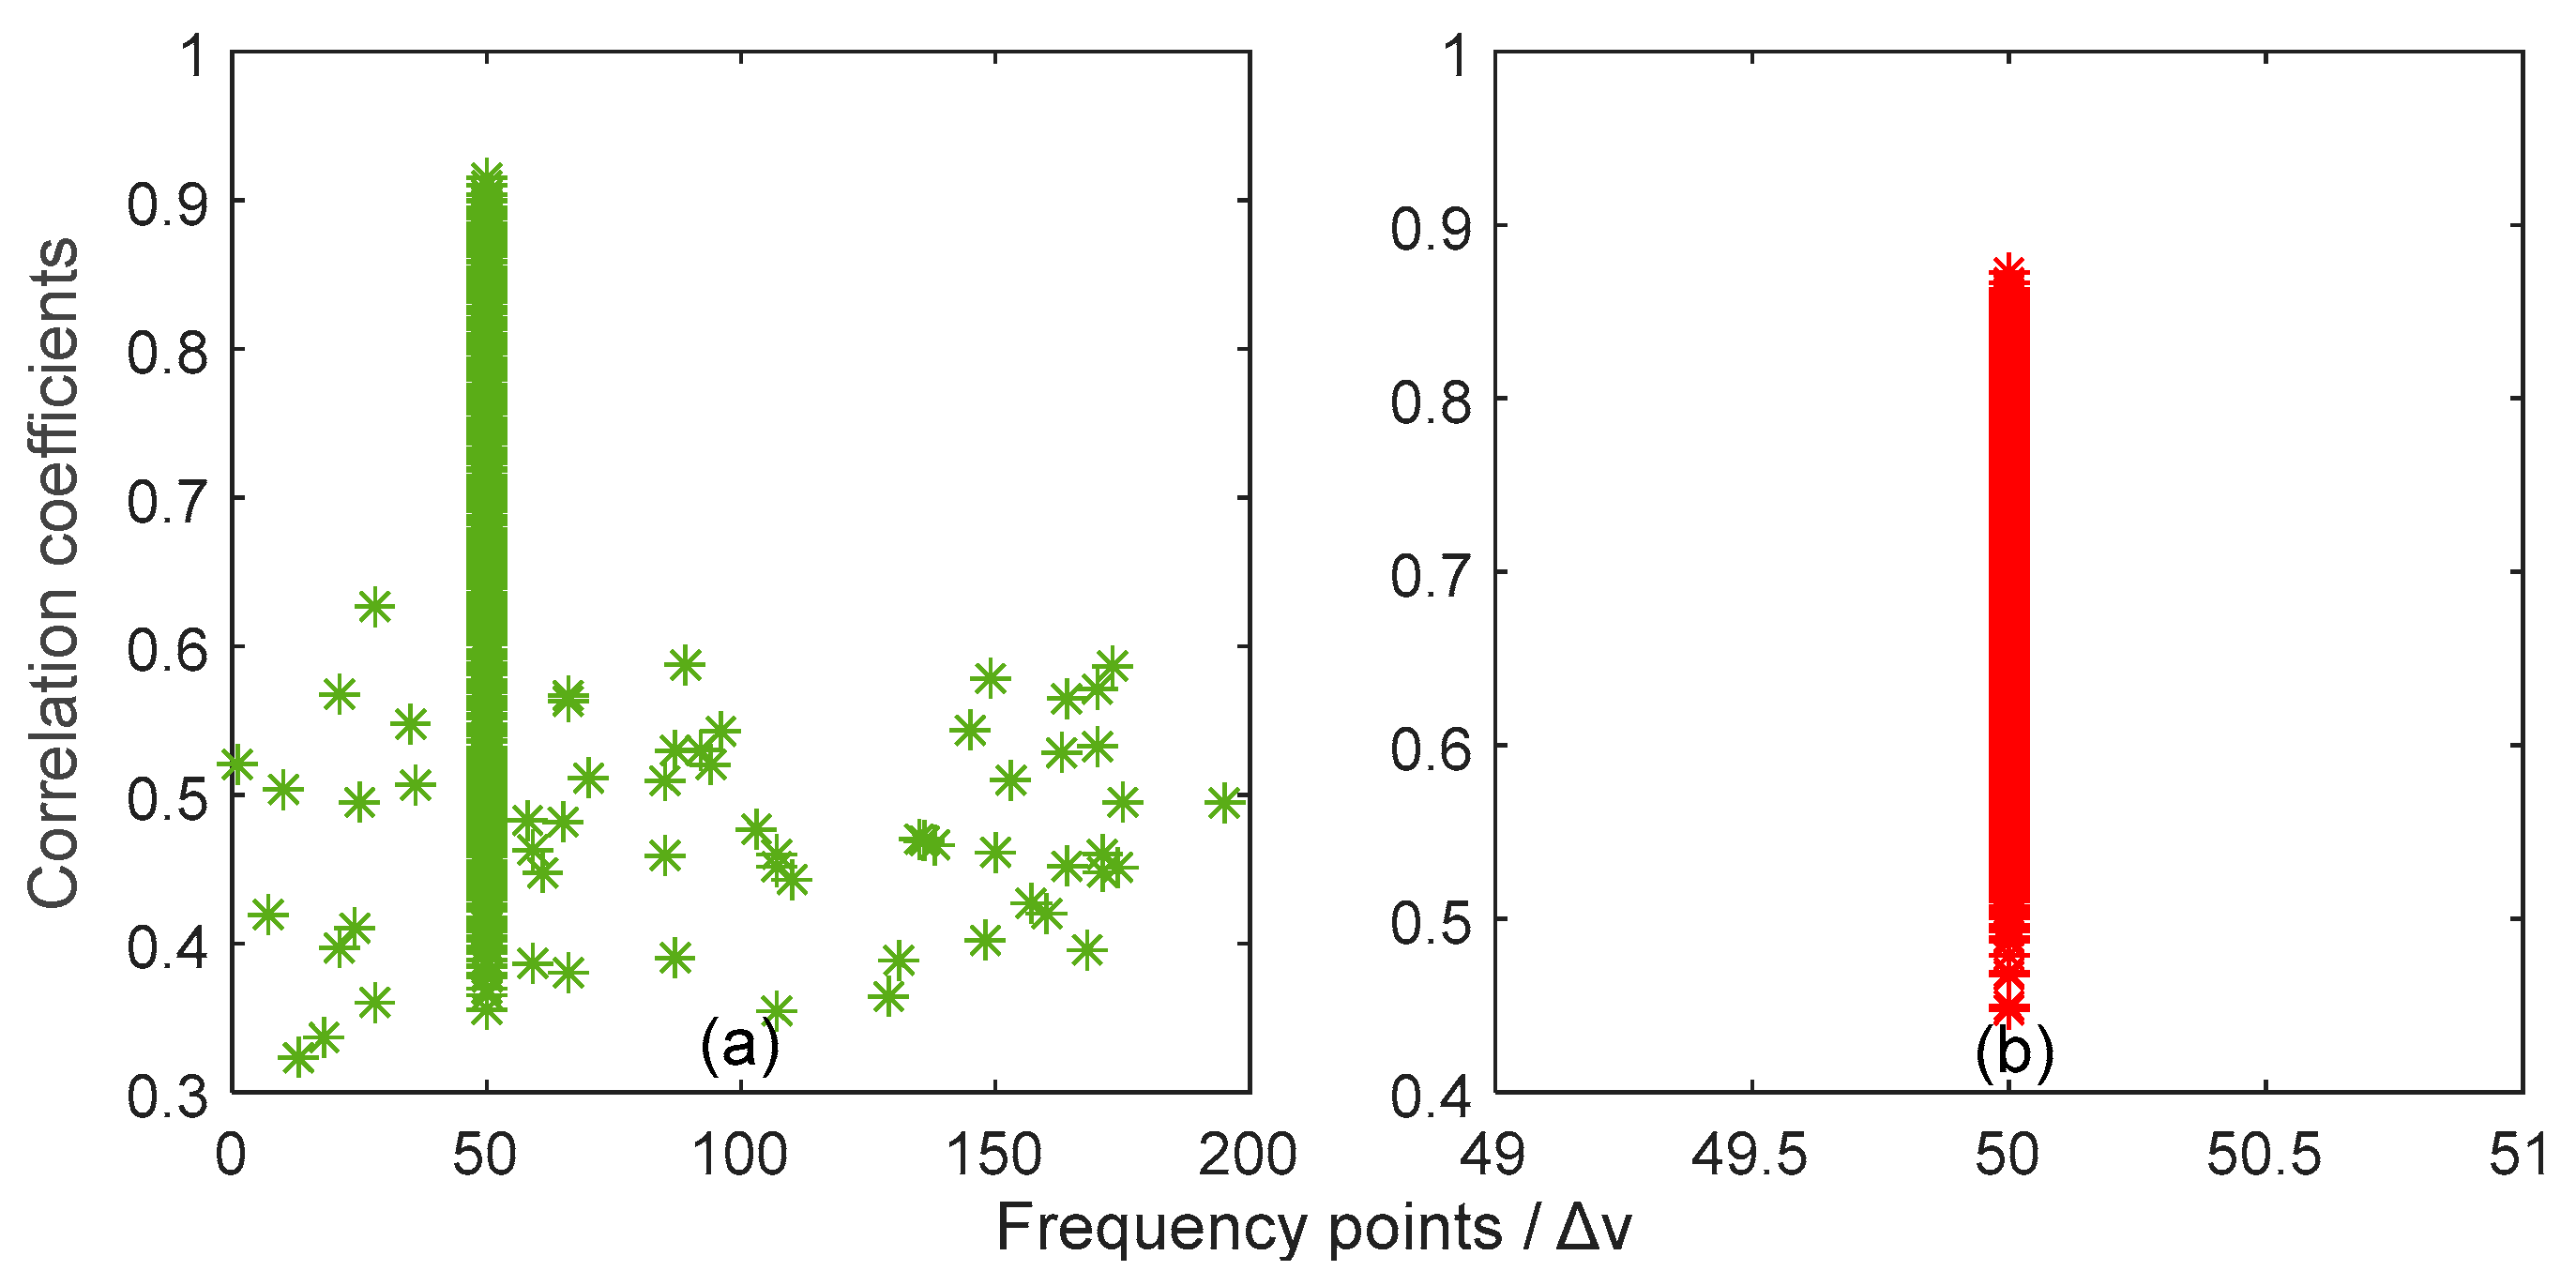
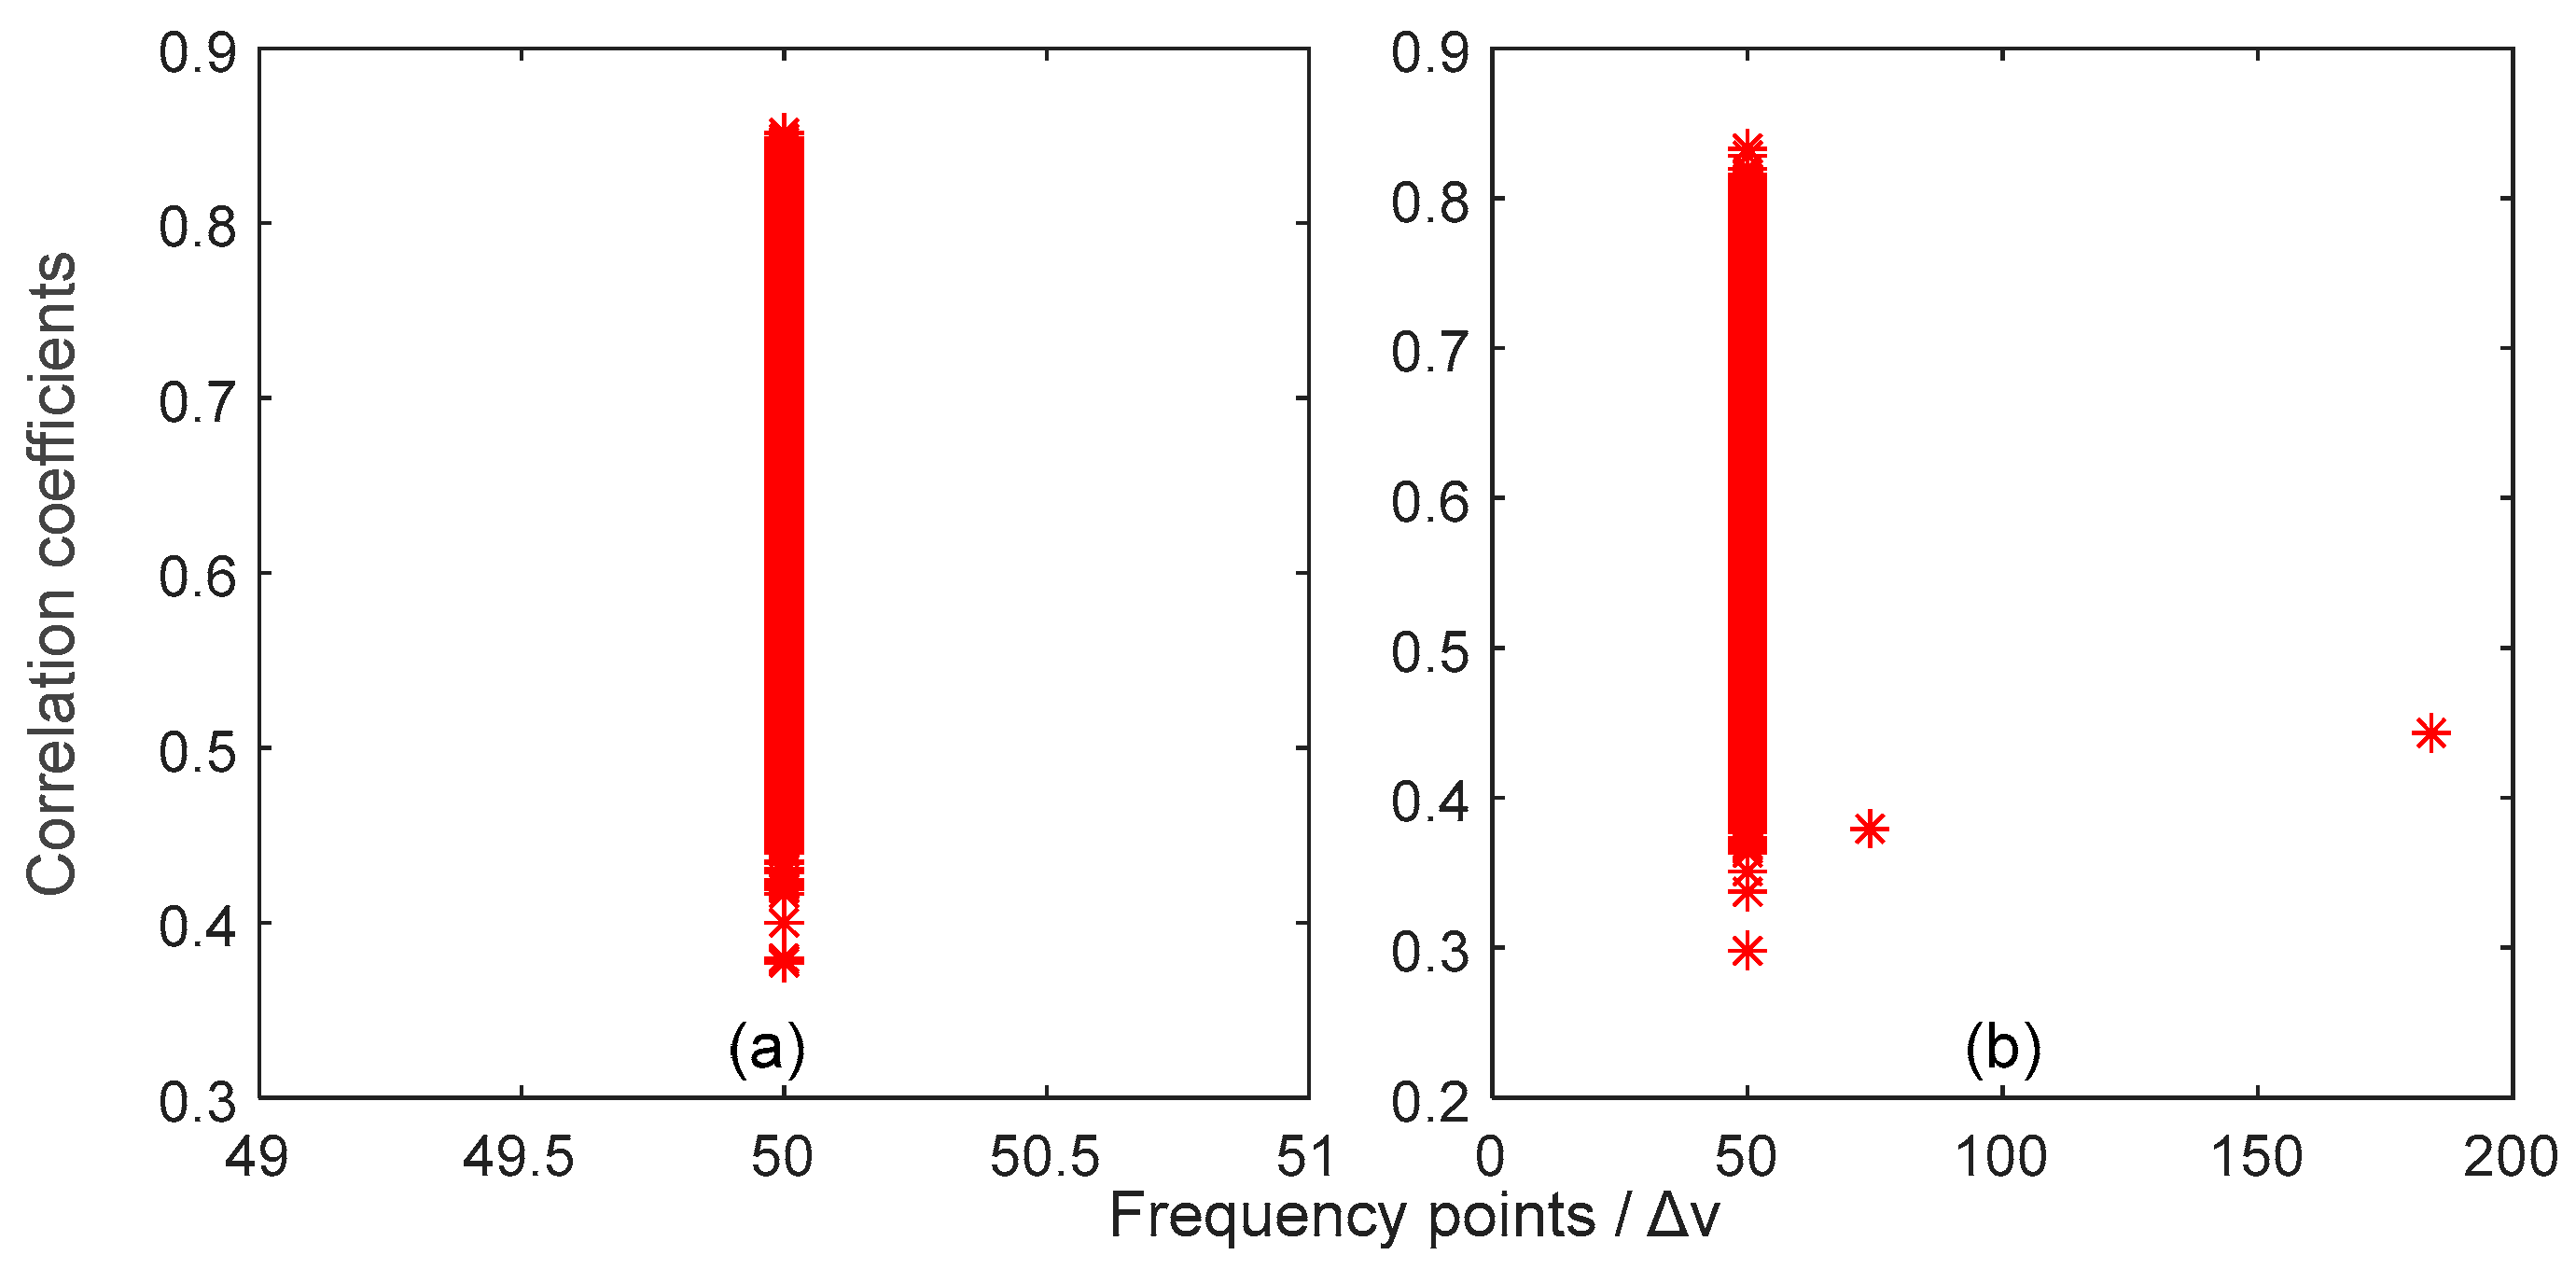
4. Discussion
It can be concluded from
Figure 7,
Figure 8,
Figure 9,
Figure 10 and
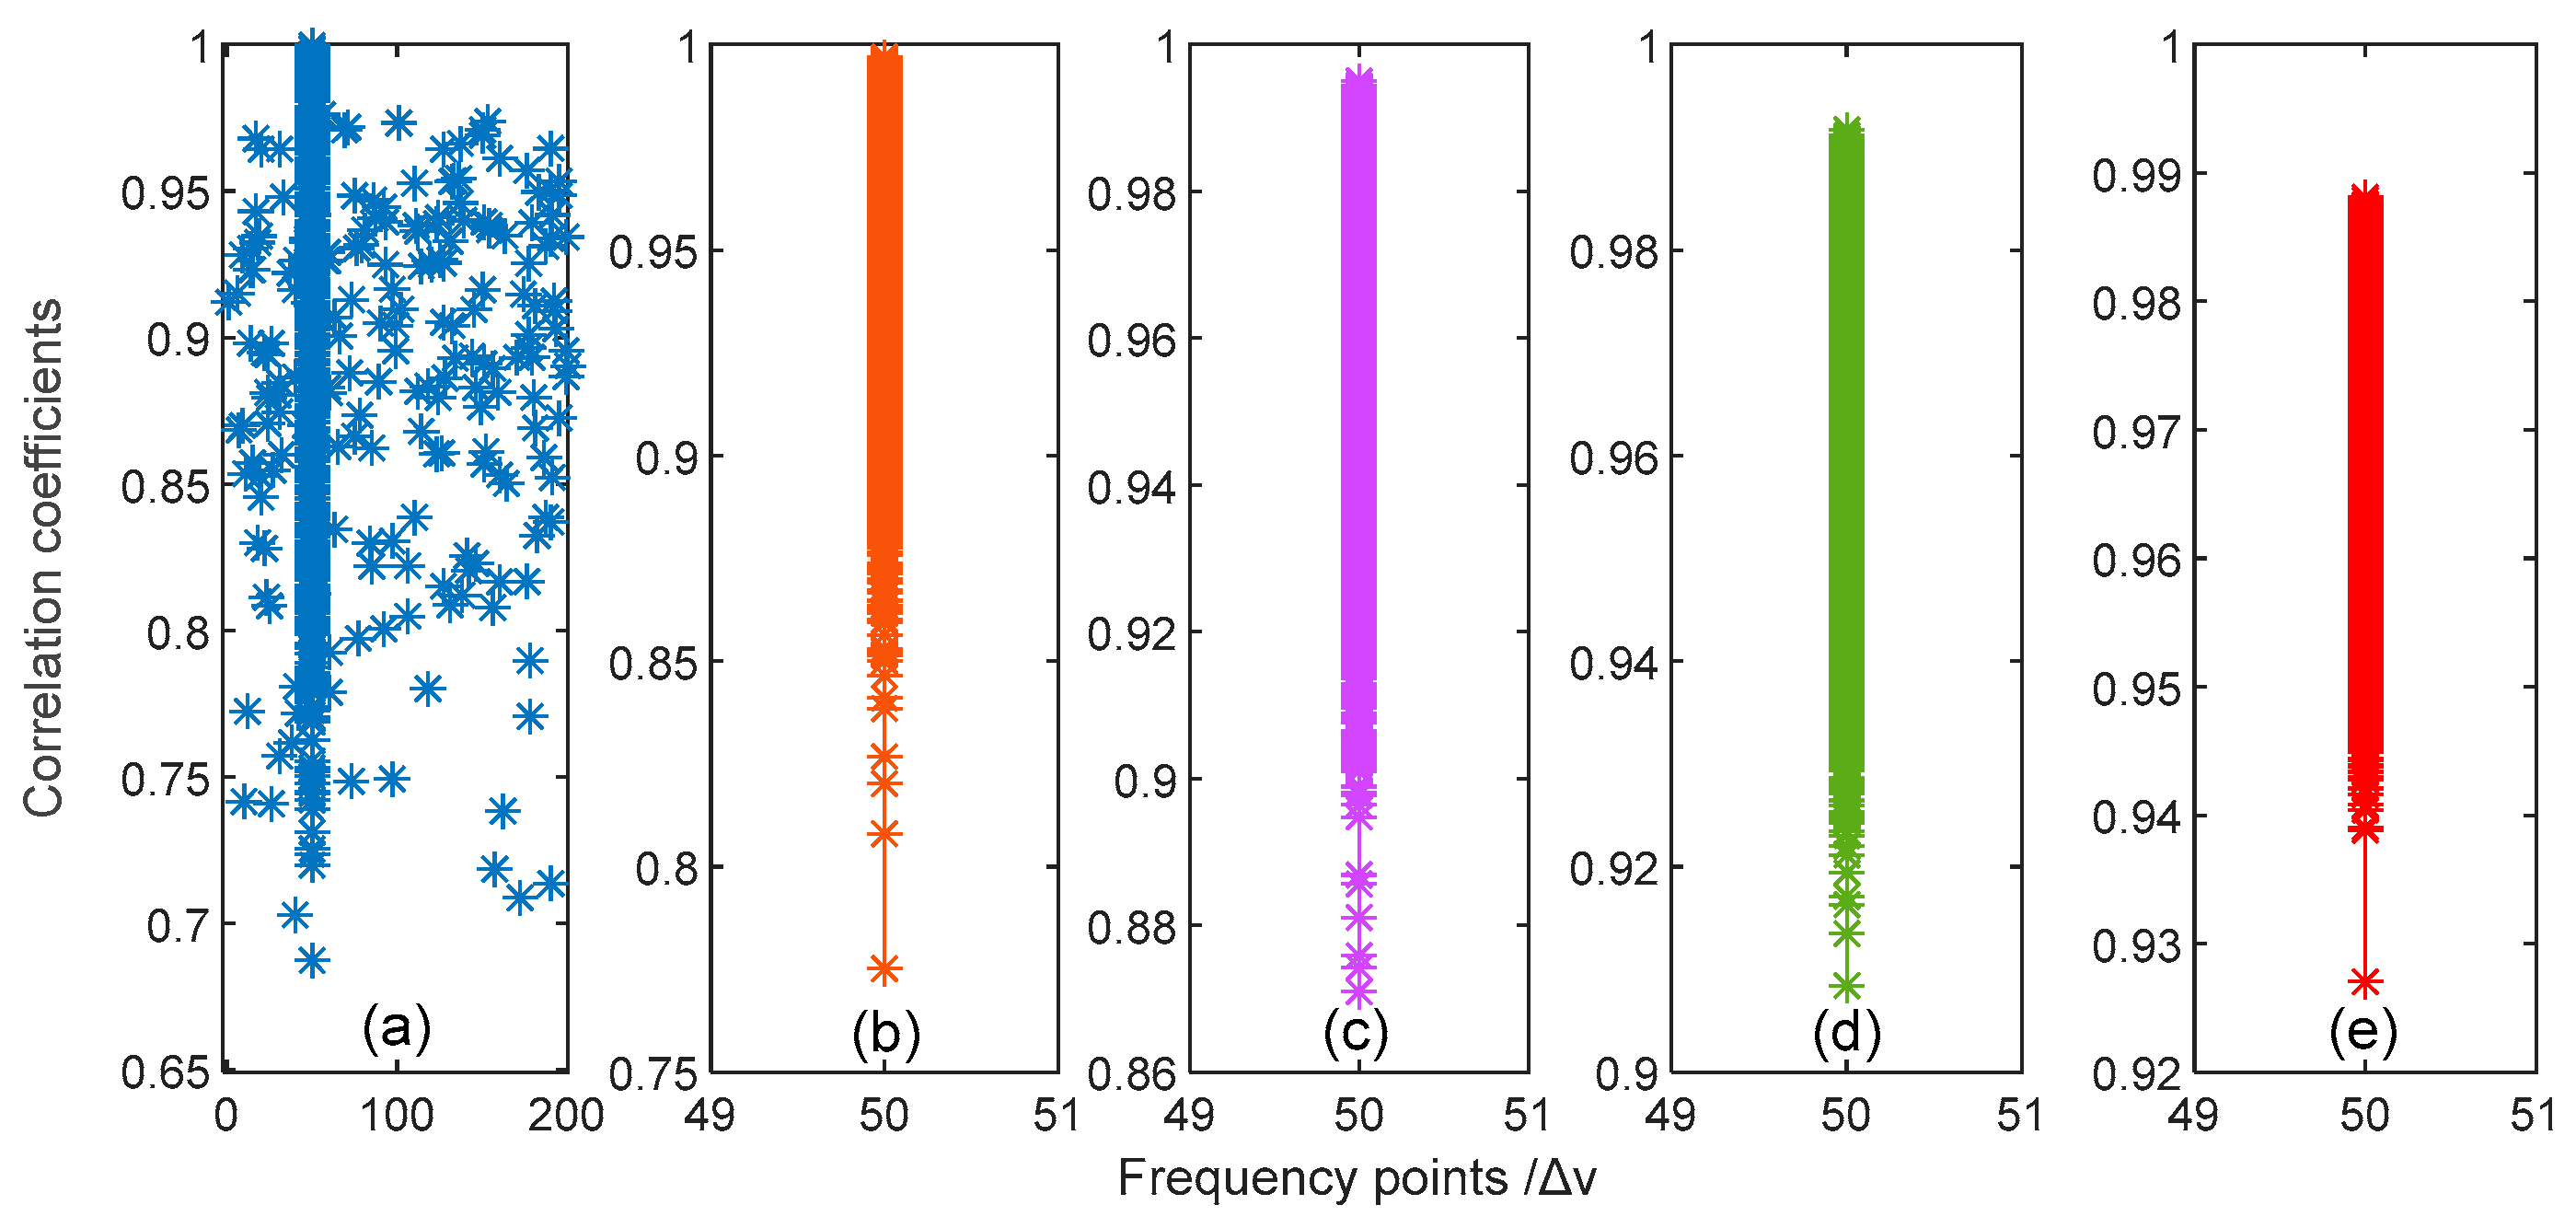
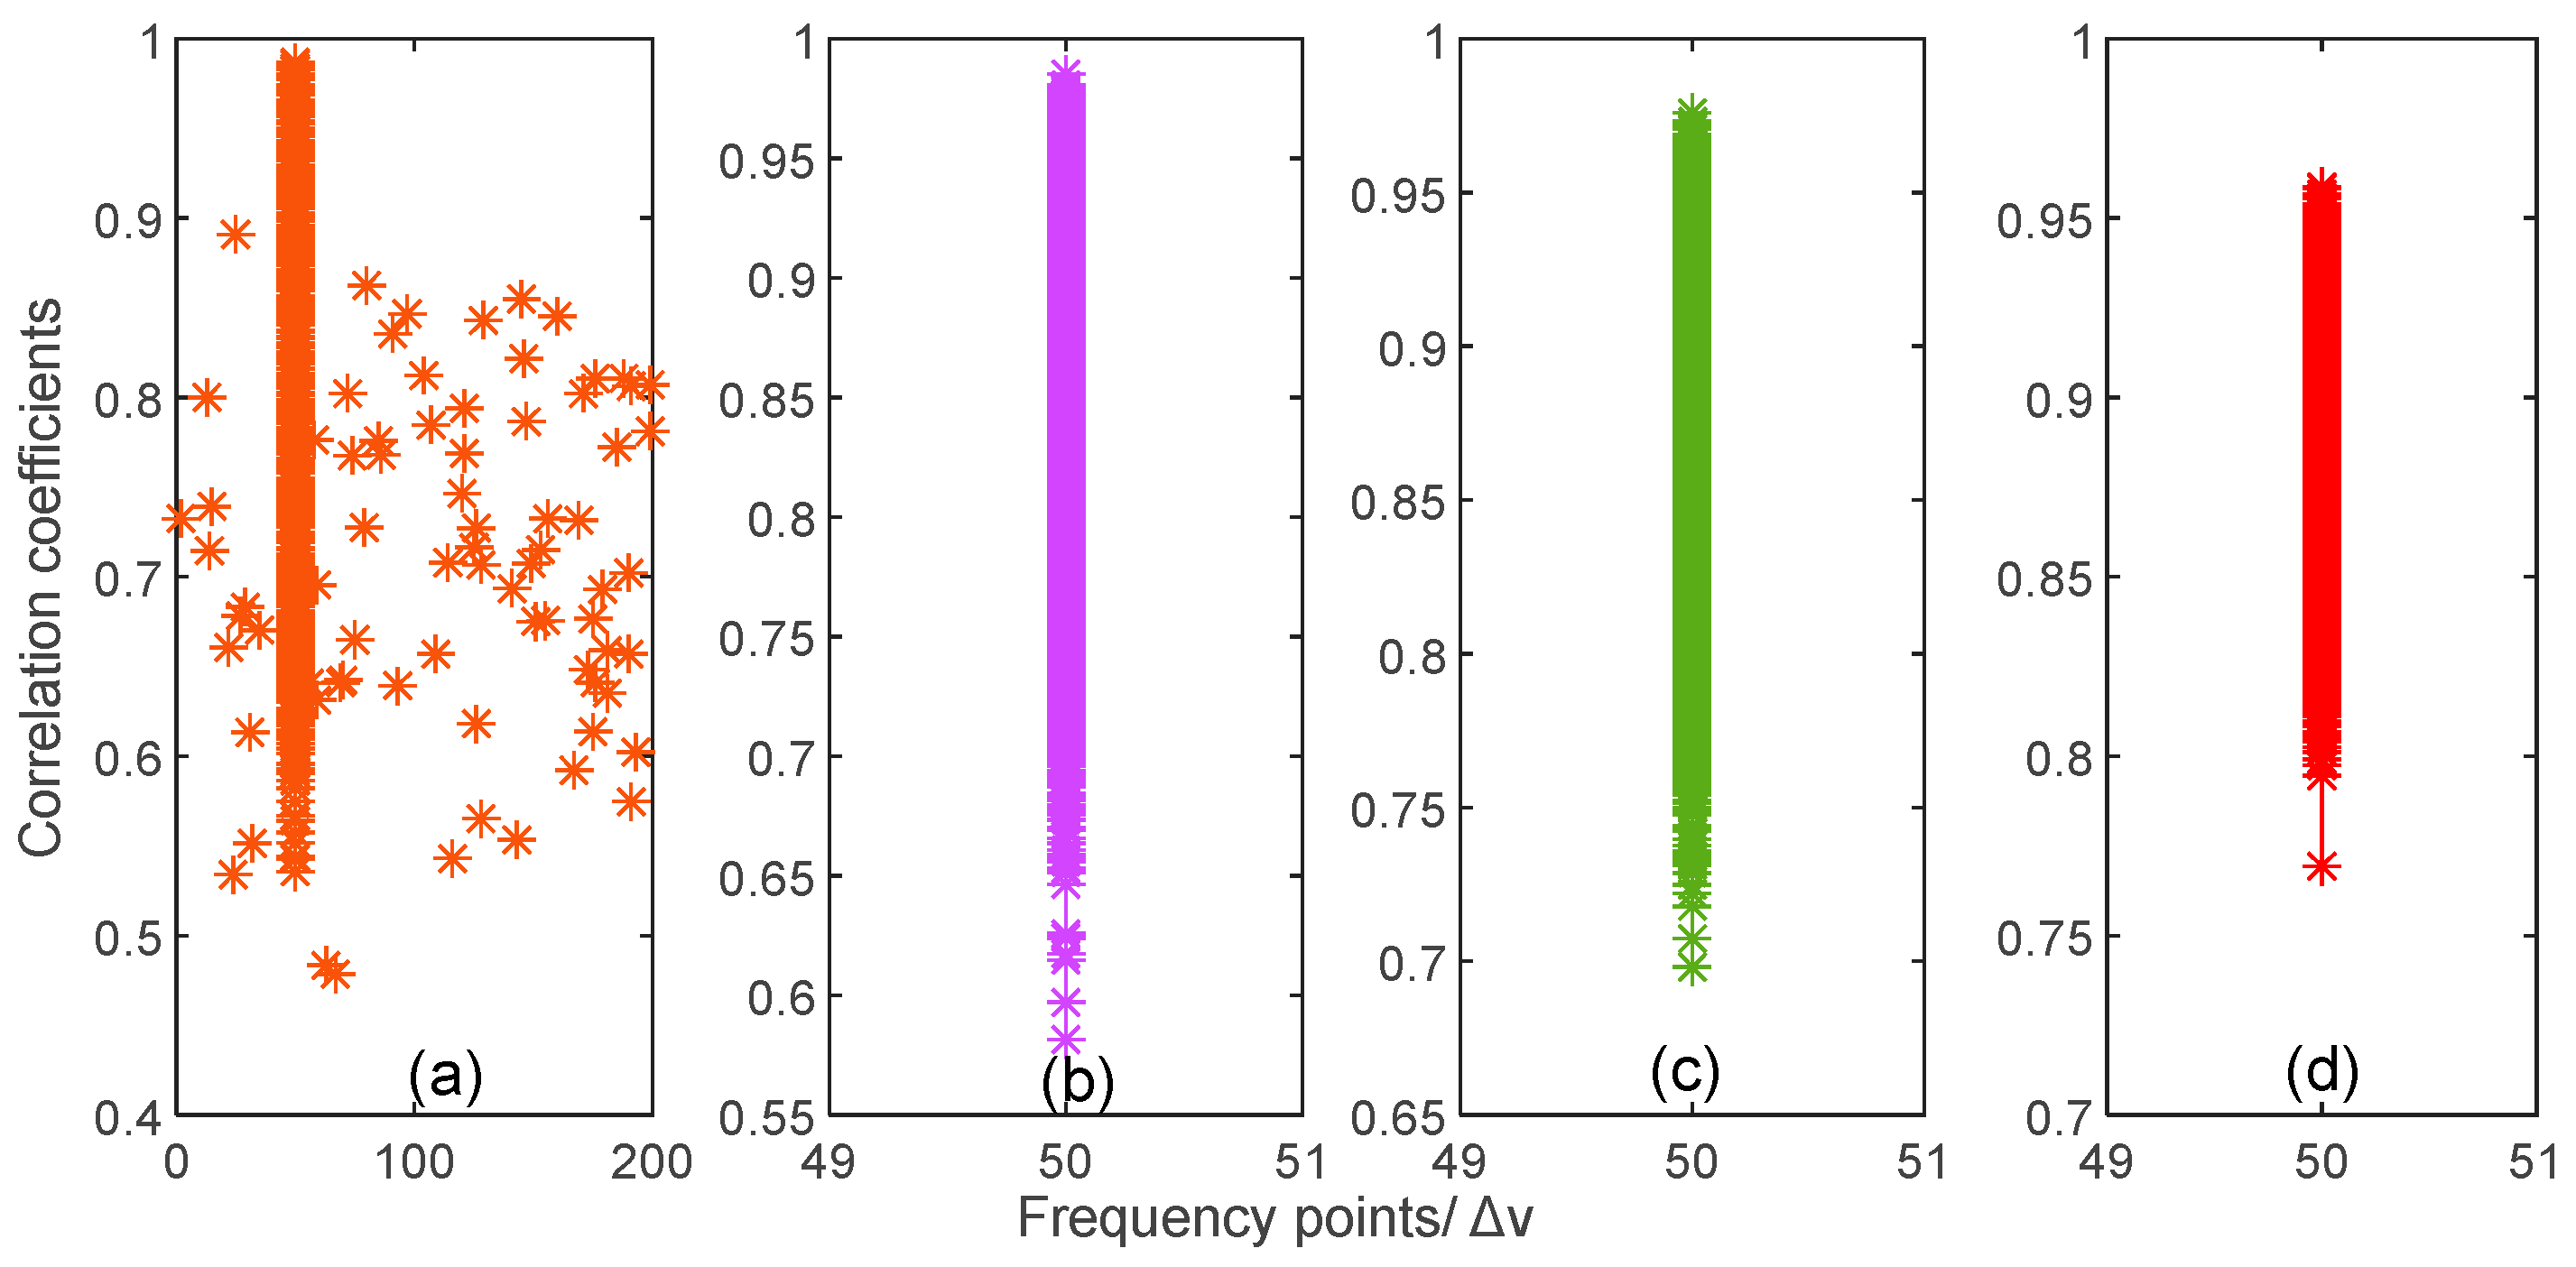
Figure 11 that the array length from cross-correlation coefficient computing has a great influence on the temperature/strain measurement accuracy. If the CRN remains stable, the minimum length of 11 frequency points can be adopted. In fact, the CRN is not stable, especially when the OTDR trace average number is small, for example, 1000 times or less. In other words, if an array with a short length is used for the temperature/strain demodulation, the OTDR trace average number must be large, e.g., 10,000 times. Therefore, system measurement efficiency becomes an important issue. For a sensing fiber with a length of 100 km, the time to obtain one OTDR trace in a single probe pulse period is 1 ms, so, for an average number of 10,000 times, it takes 10 s to obtain one averaged OTDR trace. To sweep 11 frequency points to obtain the array of 3D Rayleigh scattering spectra, the total time needed is 110 s. However, the anti-noise effect of the array with 11 frequency points is quite low, and it may be difficult to ensure measurement accuracy. Then, if the array with 101 frequency points is adopted and the OTDR trace average number is 1000 times, the time needed to get the 3D Rayleigh scattering spectra is 101 s. Although the OTDR fluctuation becomes drastic with a low average number, a longer array length can overcome the randomness of the CRN, as shown in
Figure 11. However, the measurement dynamic range with an average number of 1000 times is 5 dB lower than that with an average number of 10,000 times [
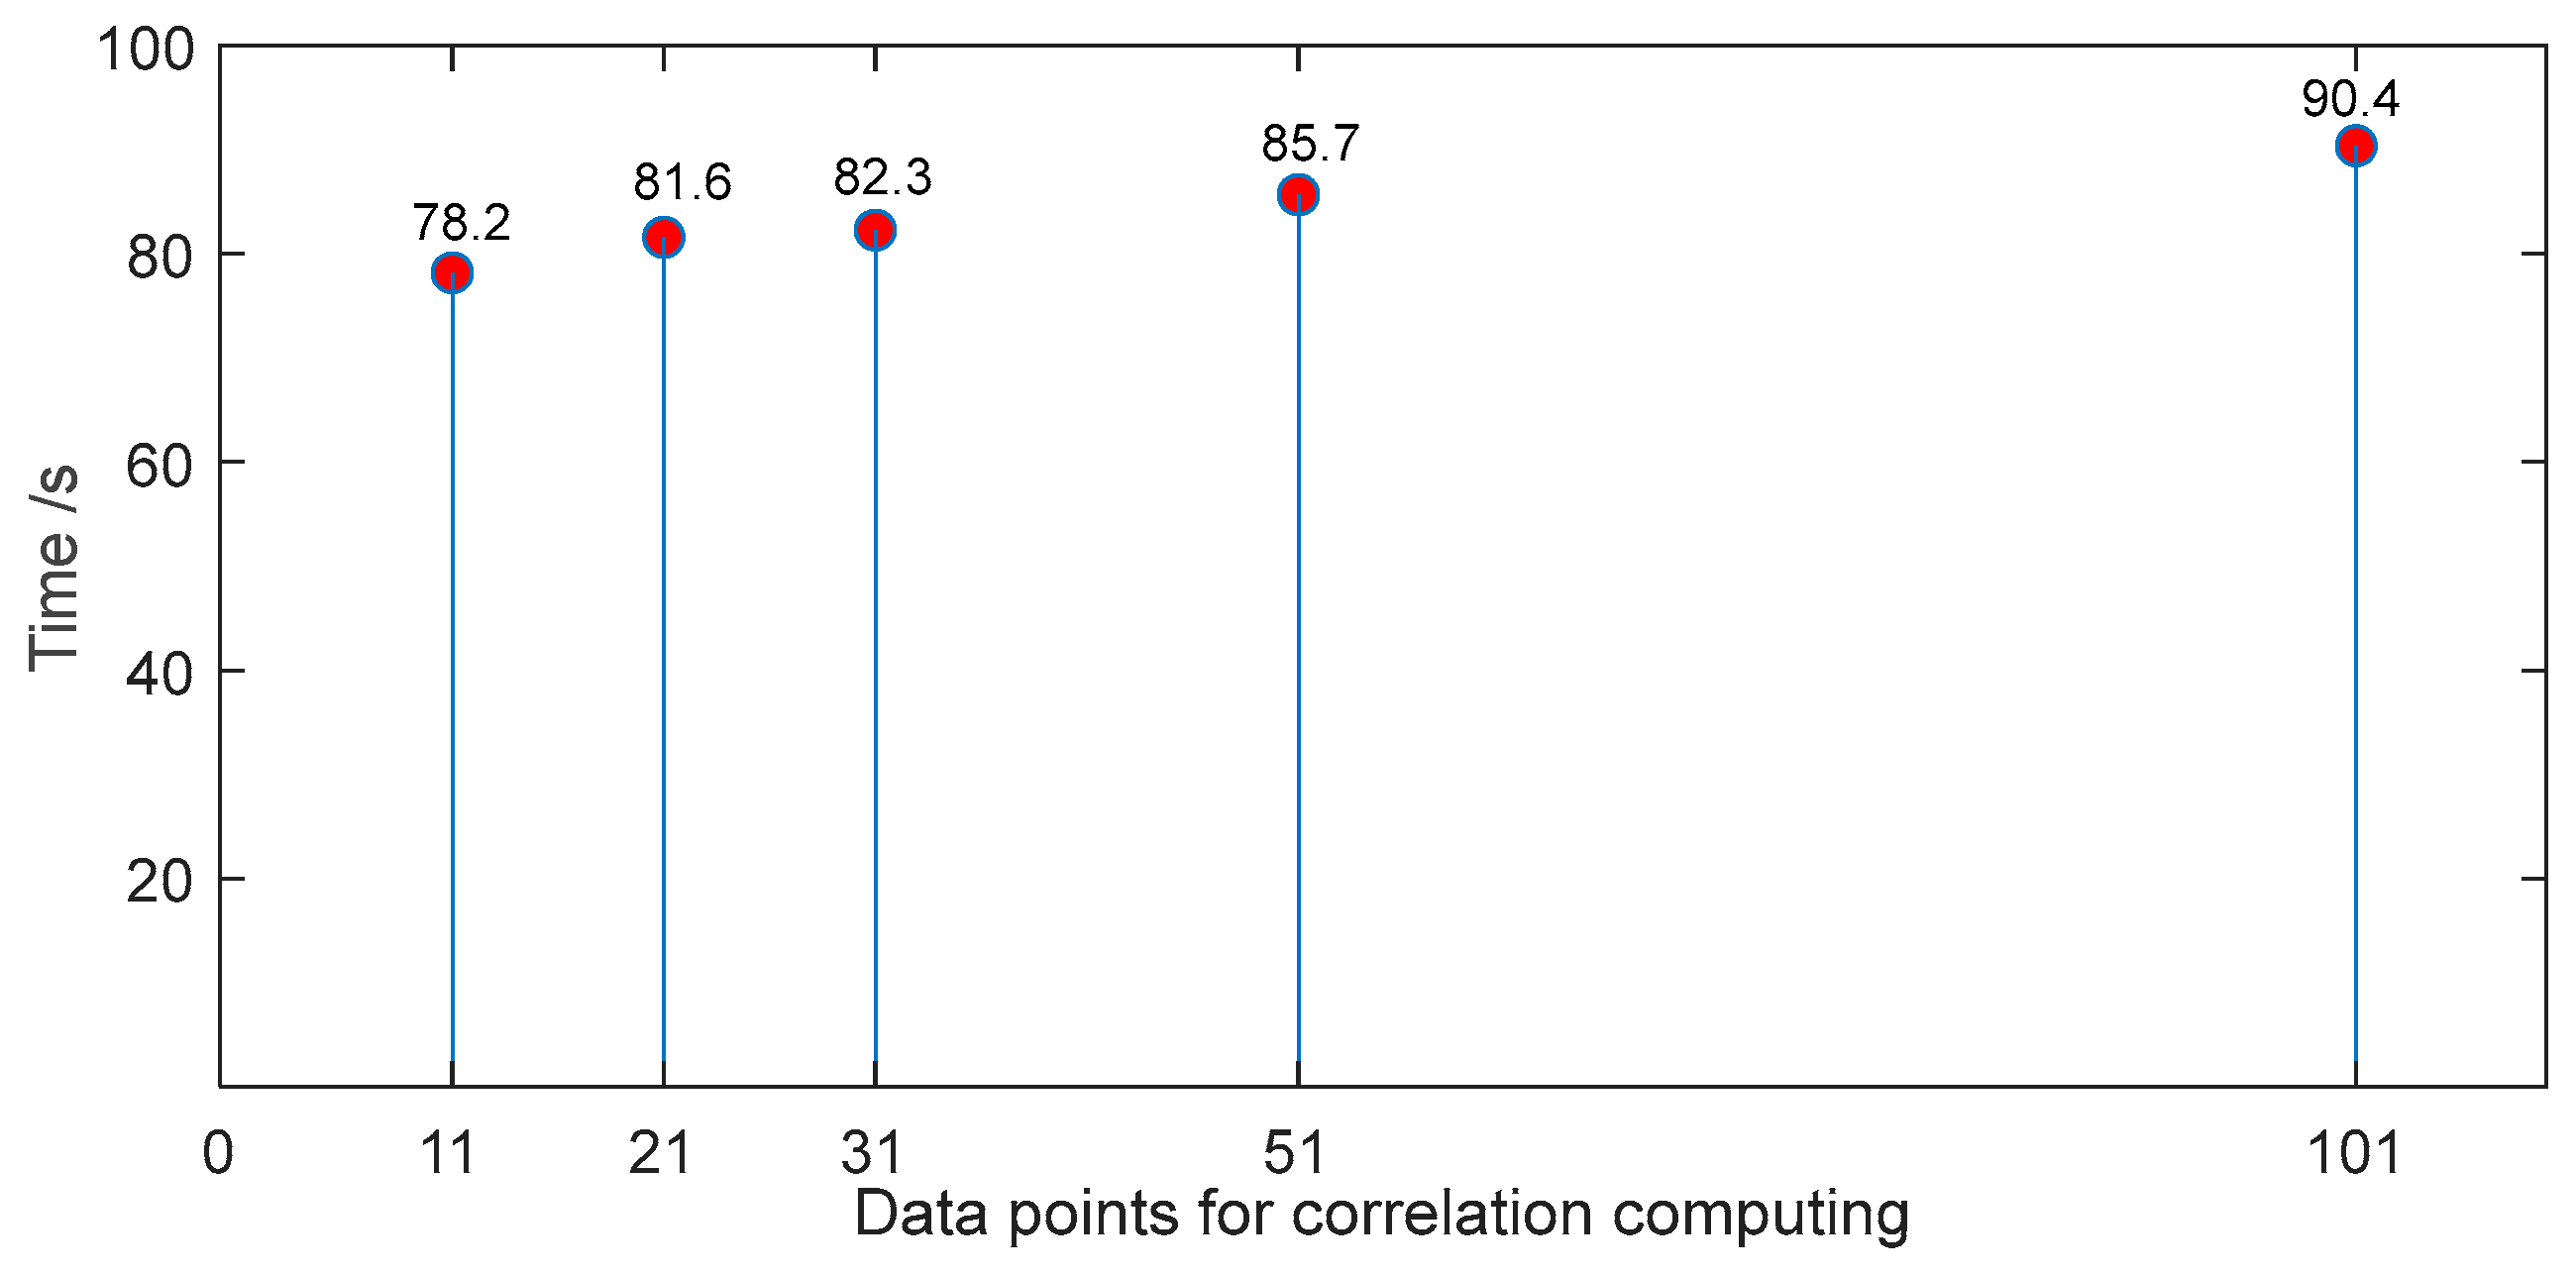
10]. As the system measurement time consists of signal acquisition time and processing time, the signal processing time should be considered.
Figure 12 shows the signal processing time with different array lengths (frequency sweeping points). The time for signal processing to obtain the temperature/strain demodulation is from 78.2 s to 90.4 s. Generally, the shorter the array length, the less time is needed, but the differences are not very big and can even be omitted in practical engineering. Therefore, the key is to balance the signal acquisition time and measurement accuracy.
Table 1 shows the comparison of the system measurement time with different array lengths (frequency sweeping points). As the anti-noise performance of the system depends on array length, the trace average number has to be increased to reduce the fading noise for a short array length to accurately demodulate the temperature/strain values. Therefore, the trace average number is selected as 1000 times for the array with a length of 101 since it has excellent anti-noise performance, and for the arrays with shorter lengths, the trace average number is selected as 10,000 times. Although the array with a length of 51 also has good performance, we think that it cannot absolutely guarantee measurement accuracy, because a small trace average number will inevitably lead to large fluctuations in the OTDR trace. So,
Table 1 indicates that the trace average number is the key factor that decides the measurement time for ultra-long-distance fiber temperature/strain monitoring. The total time consumption for an array with a length of 11 is a little less than that with a length of 101, but by the anti-noise performance contrast in
Figure 7 and
Figure 11, it can be inferred that the array with 101 frequency sweeping points and a trace average number of 1000 times is the best-suited to achieve excellent measurement efficiency for ultra-long OPGW/OPPC temperature/strain monitoring.
5. Conclusions
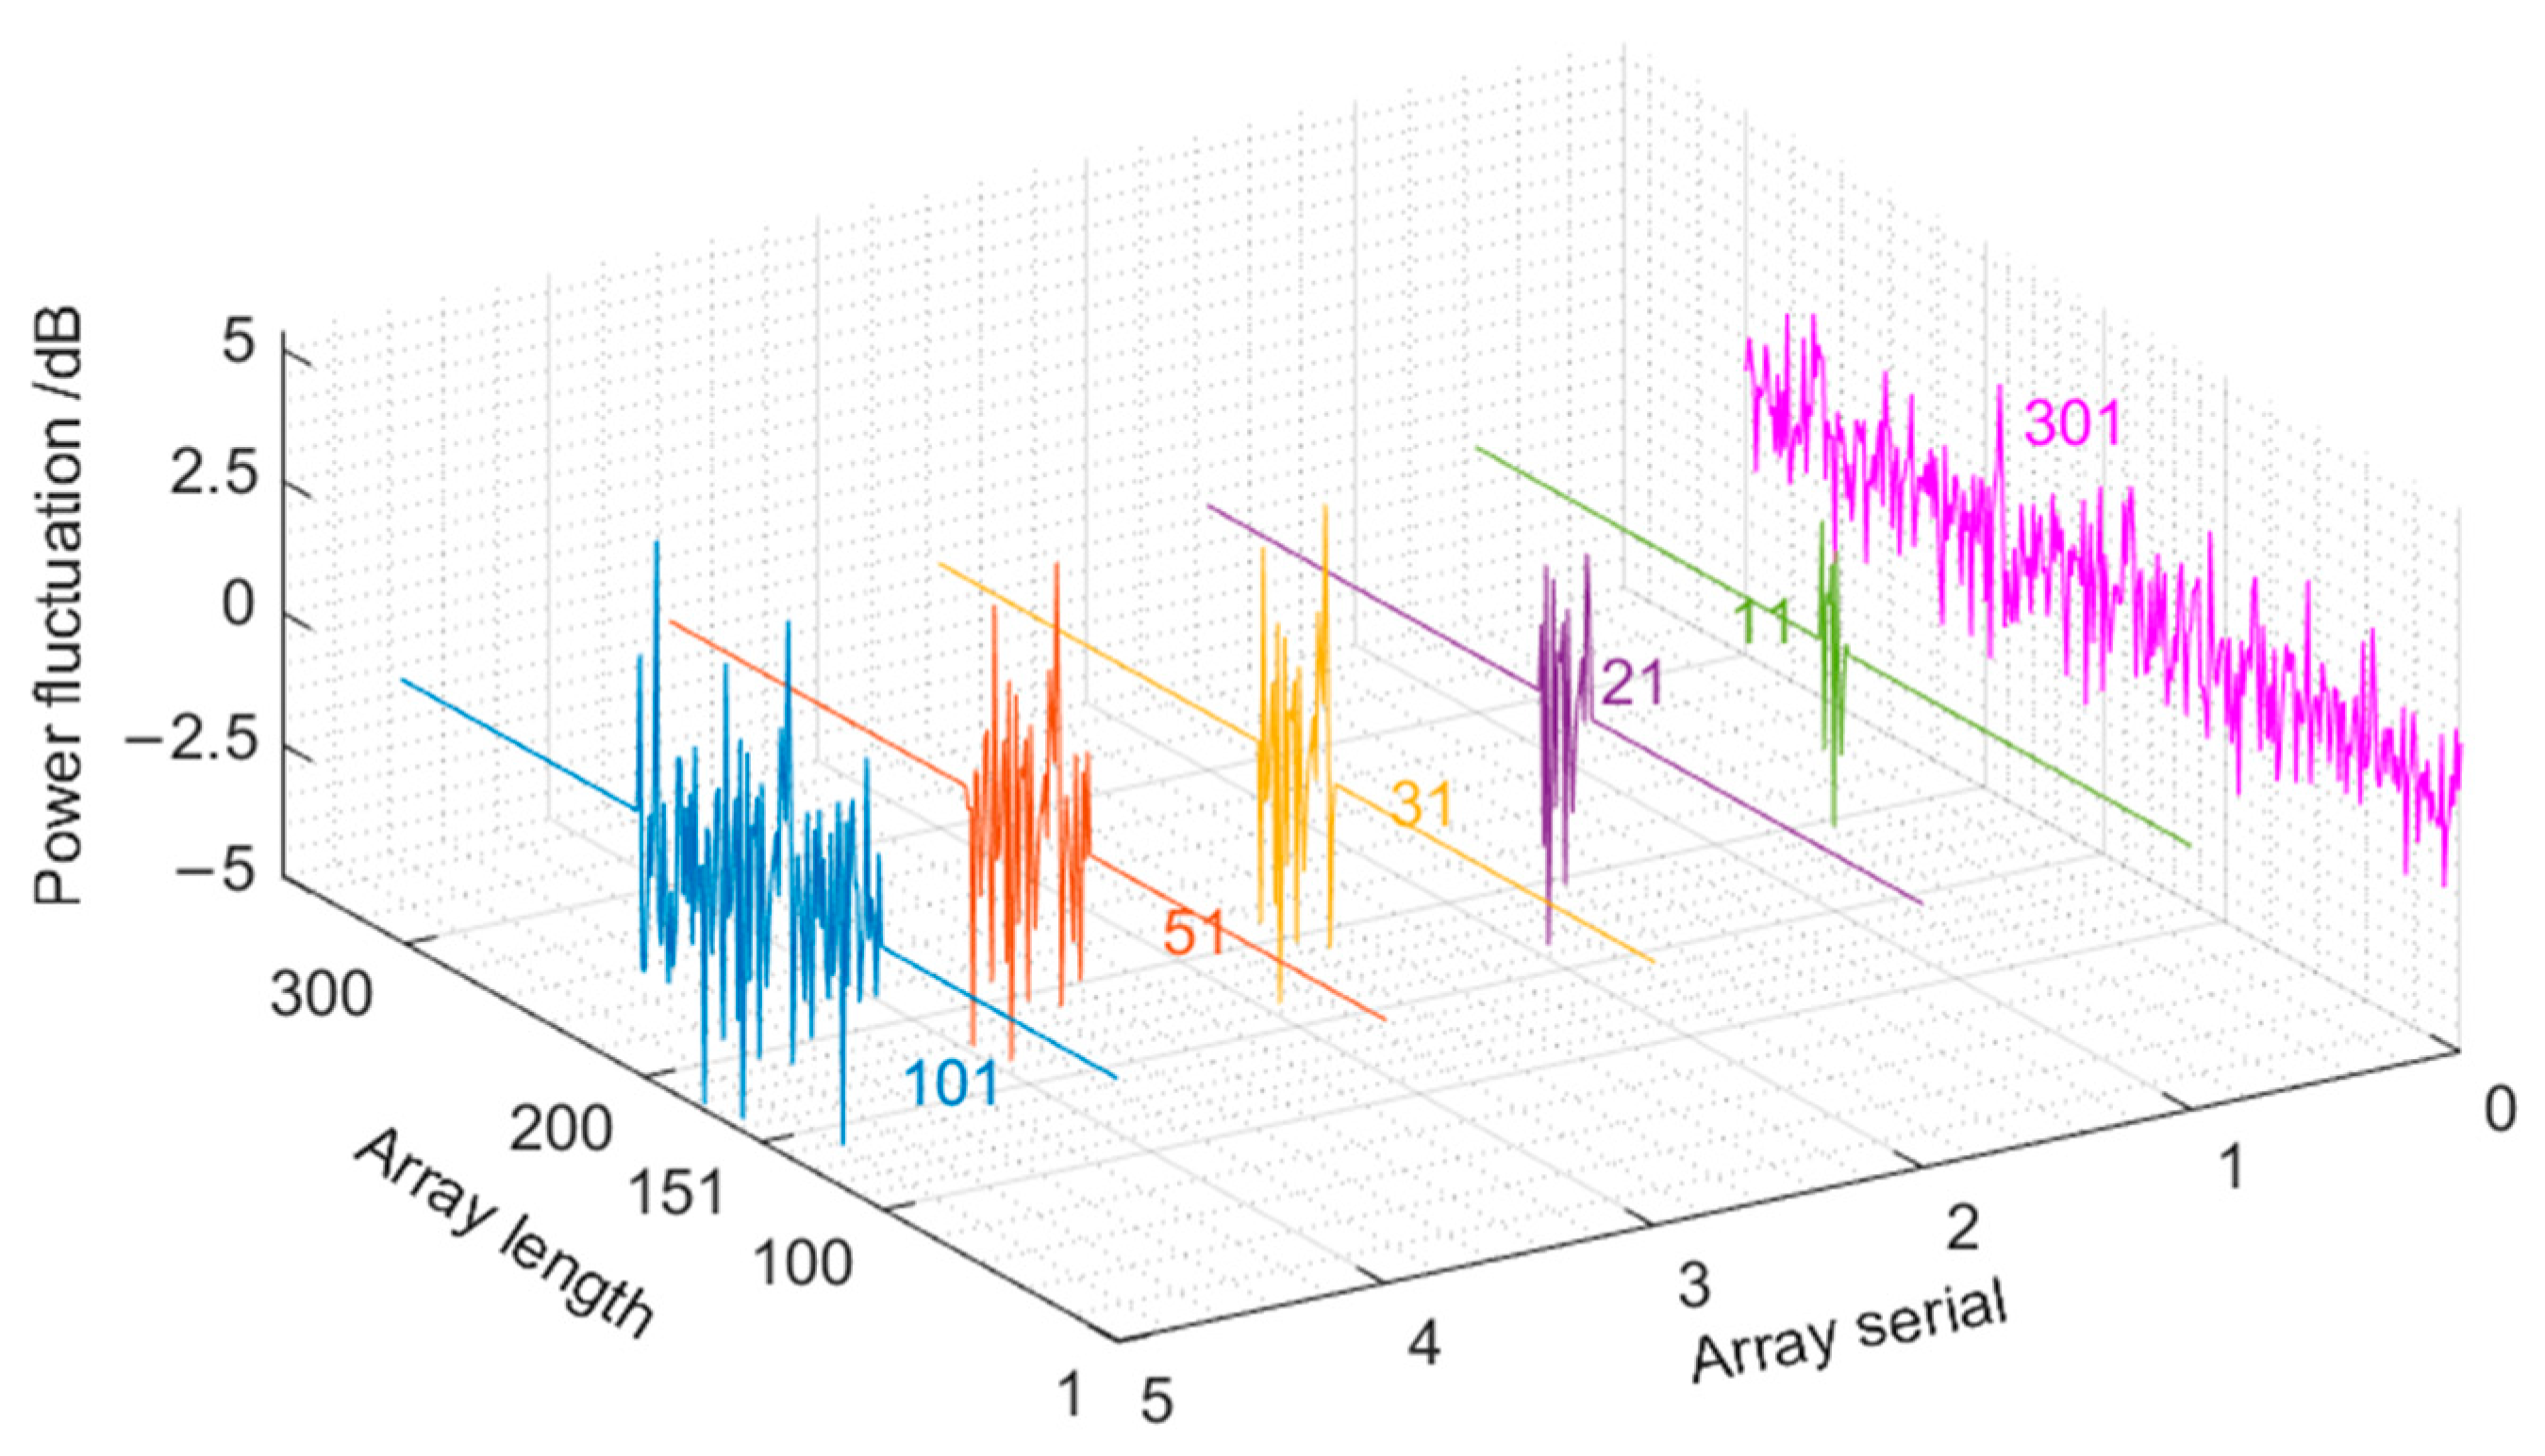
For power transmission line state monitoring, many types of sensors have been developed and used. IoT-based sensor networks need to deploy corresponding sensors, which are bound to consume a lot of manpower. In addition, supplying the power for the sensors and networks is also a hard and challenging issue, especially when a large number of sensors are distributed in a wide area. The all-optical fiber point type sensors, such as FBG and FPI, can be used to monitor the ice circumstances and temperature information, but they can only cover dozens of sensing nodes, so the dead zone is quite obvious. Therefore, the distributed optical fiber sensors that adopt the optical fiber in OPGW/OPPC as the sensing media have great application potential. The OPGW and OPPC are widely used in optical fiber composite power transmission lines, so they provide a natural media to monitor the health state of the power transmission lines by distributed optical fiber sensors, in which massive sensing nodes are considered to be continuously distributed along the sensing fiber. For distributed temperate/strain measurement with a high dynamic range, COTDR is a preferential instrument. So, for ultra-long-distance OPGW/OPPC monitoring, the measurement efficiency within acceptable accuracy has to be studied. Then, a COTDR system is constructed, and the OTDR trace is obtained. By statistical analysis, the CRN in the OTDR trace is similar to the standard normal distribution, so the Gaussian noise is adopted to simulate Rayleigh scattering spectra by frequency sweeping at each position along the sensing fiber. In consideration of the system measurement range, an array with 301 frequency points at each fiber position is built as the standard reference of Rayleigh spectra. Then, the arrays with 11, 21, 31, 51, and 101 frequency points with extra Gaussian noise are formed. By maximal cross-correlation coefficient algorithm, the Rayleigh frequency shift is computed and compared, and it is found that a longer array length has a better anti-noise effect. By the analysis of the signal acquisition time, which is decided by OTDR trace average number and signal processing time, the results indicate that the signal acquisition time is the key factor that influences the system measurement efficiency. To balance the system measurement efficiency and accuracy, the array length with 101 frequency sweeping points and an OTDR trace average number of 1000 times are the best parameters for ultra-long-distance OPGW/OPPC distributed temperature/strain monitoring.


