
Concrete Strength Prediction Using Machine Learning Methods CatBoost, k-Nearest Neighbors, Support Vector Regression

 ,
,  ,
,  , ,
, ,  and
and
Abstract
:1. Introduction
- –
- Deep analysis of existing machine learning methods in concrete technology, analysis of the experience of their application, evaluation of such experience and the conclusion of scientific and practical deficits from the information received.
- –
- Docking of experimental empirical results obtained in the course of real physical experiments and training on their basis of special tools that allow control of the properties and predict the performance of concretes and structures based on using machine learning methods.
- –
- After processing and applying the data of a physical experiment, the development of an algorithm is based on three methods of machine learning: CatBoost gradient boosting, the k-nearest neighbors method and the support vector regression method, for processing the empirical base with further comparison of the results based on the values of the main metrics.
- –
- Assessment of the prospects for applying the developed methods in practice and the possibility of translating and projecting the results obtained on various types of concrete, and developing specific proposals for construction industry enterprises.
2. Materials and Methods
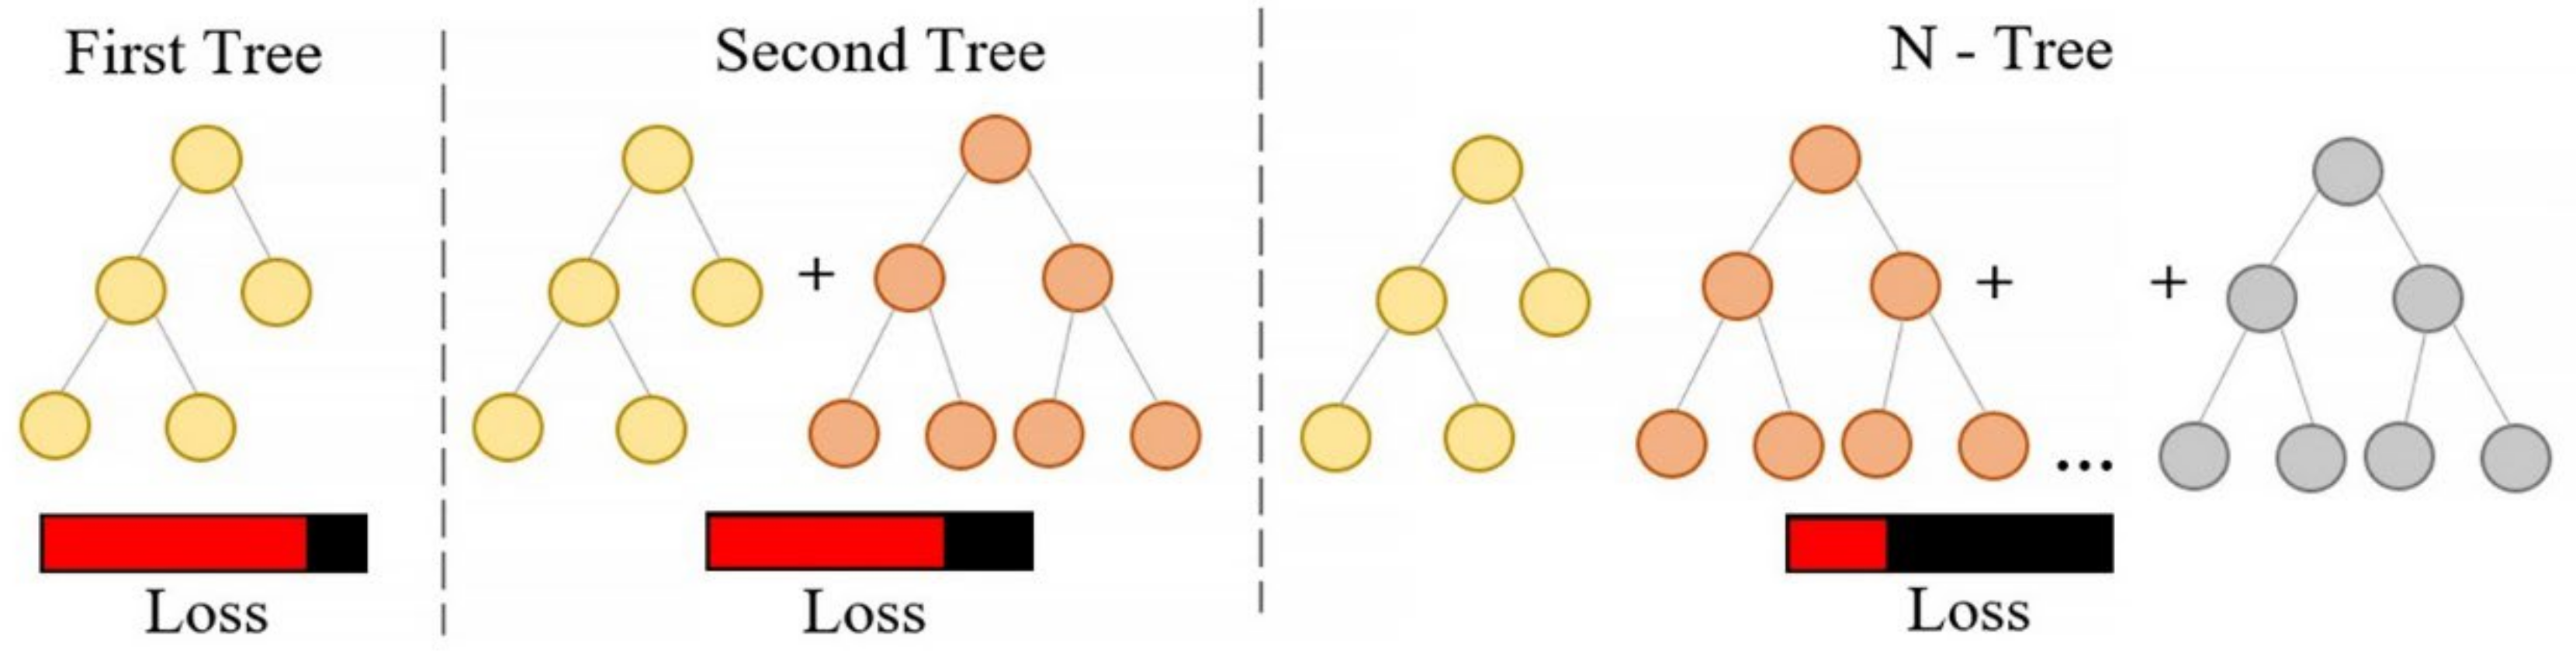
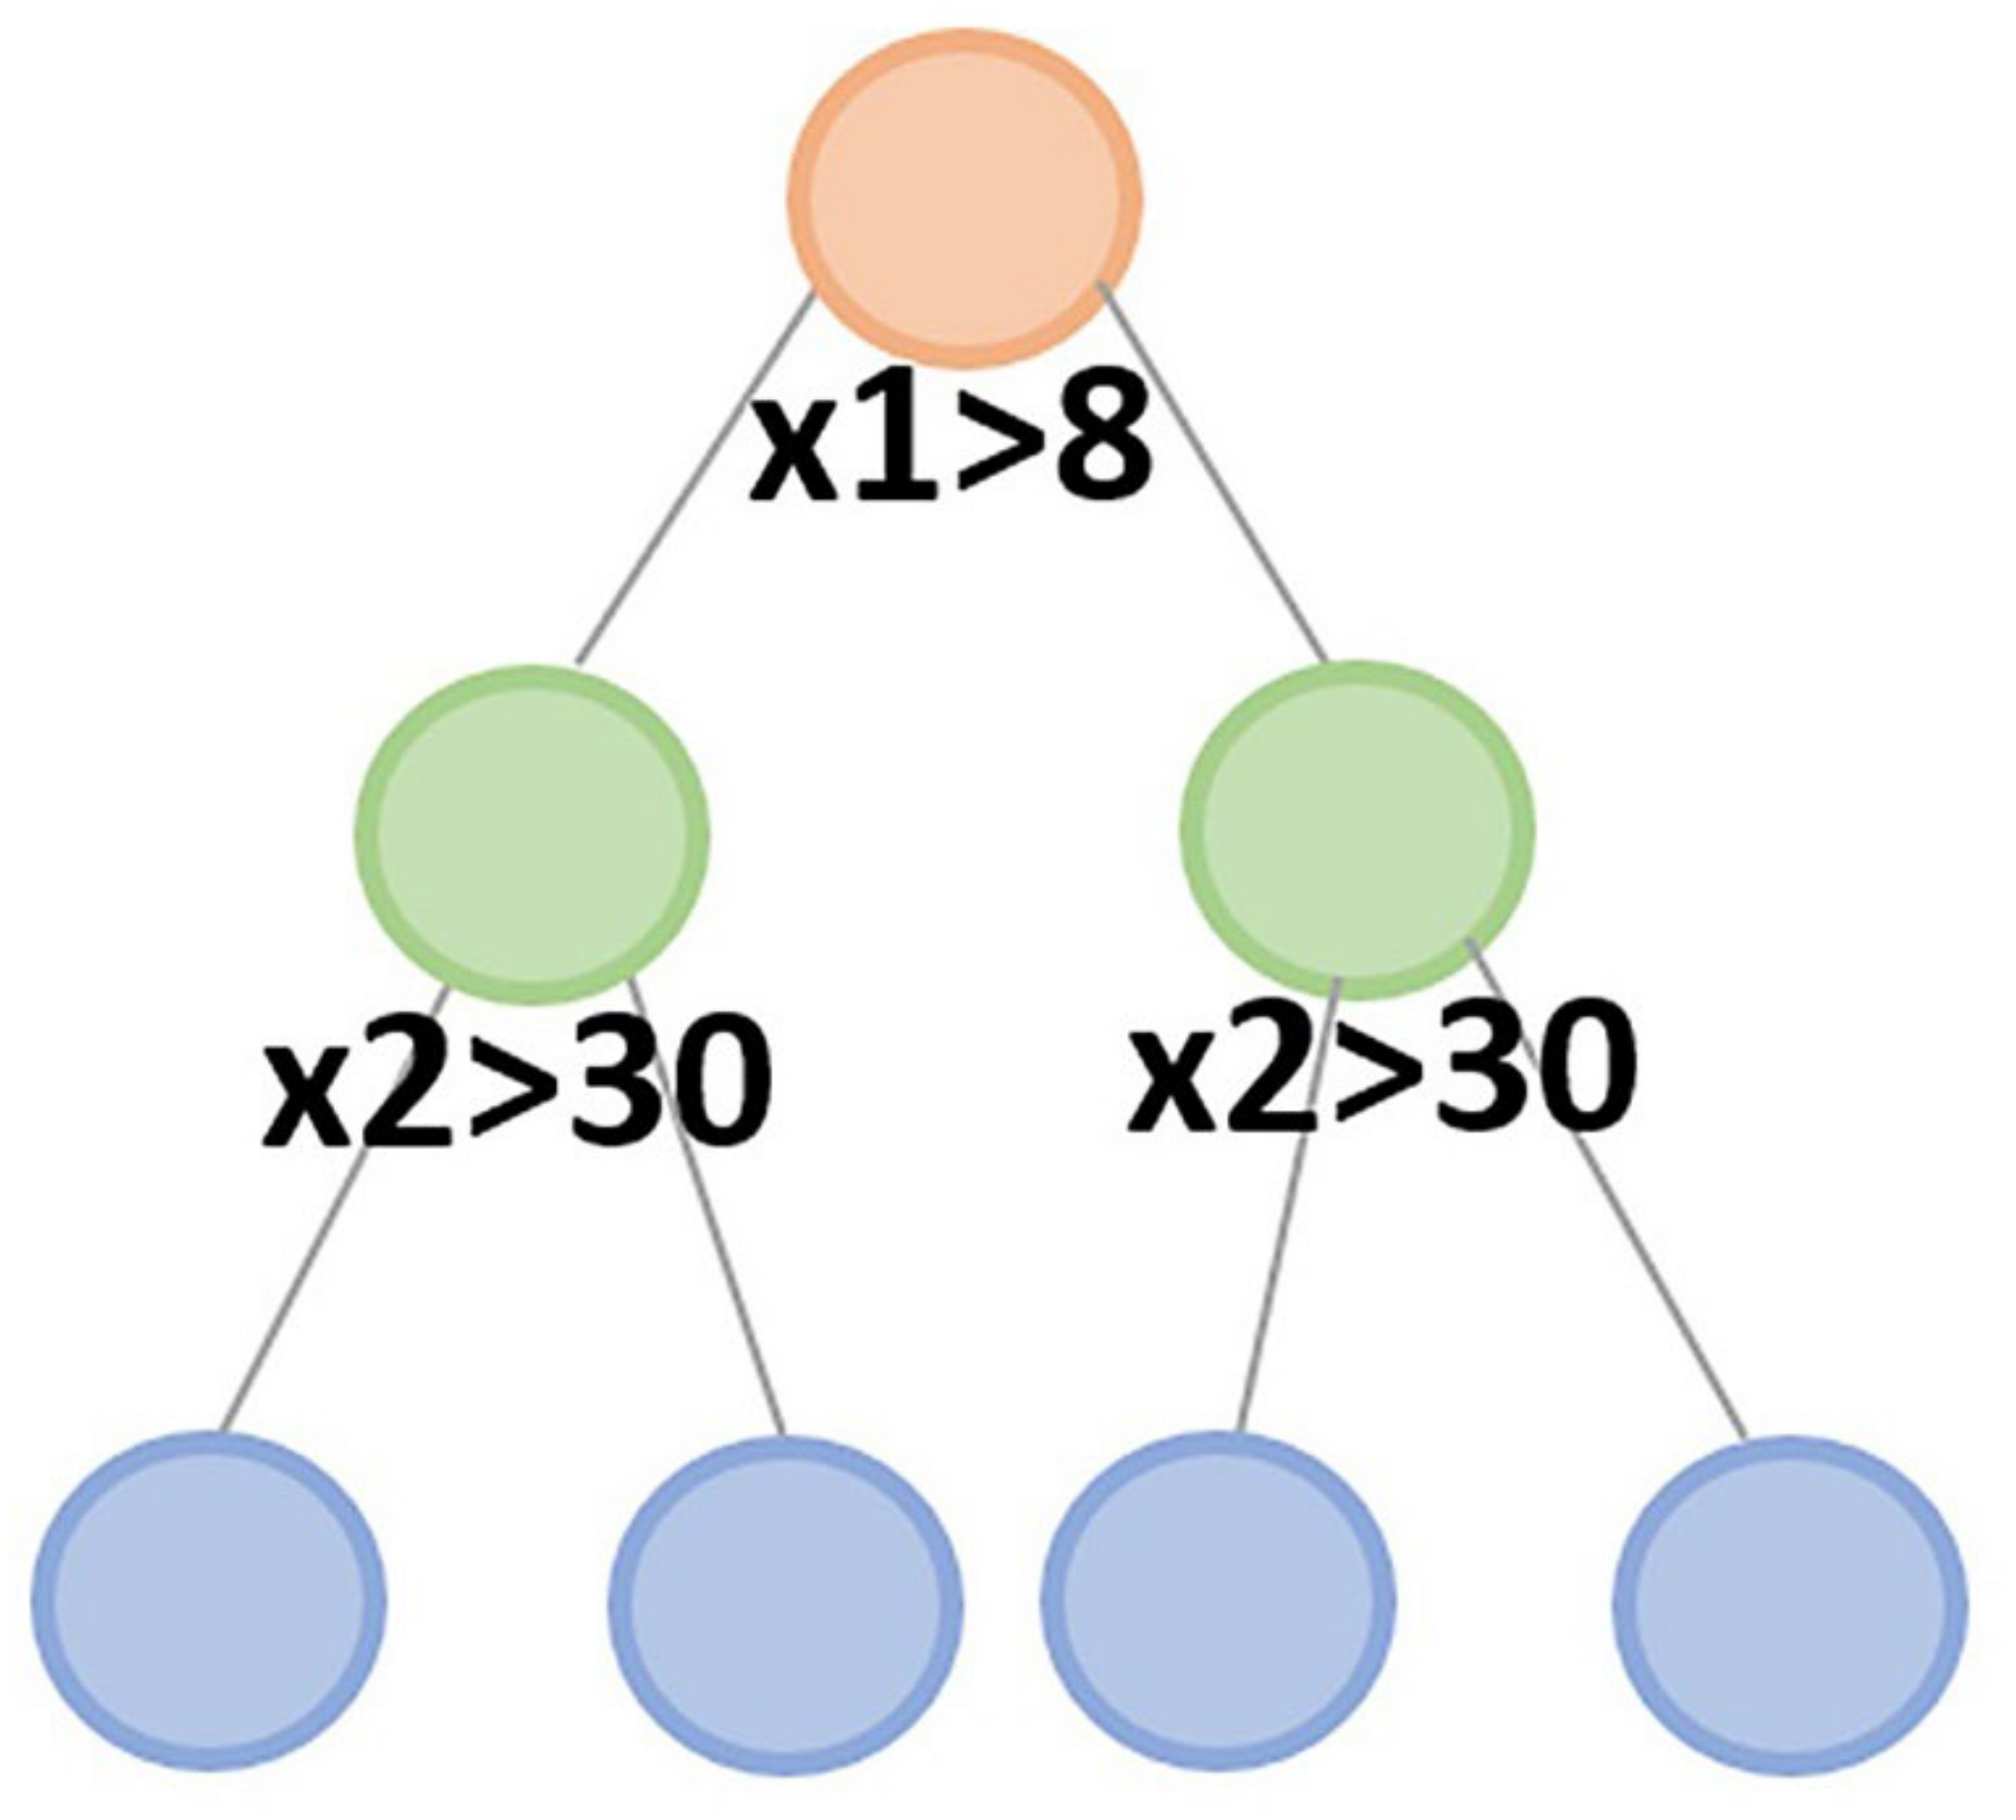
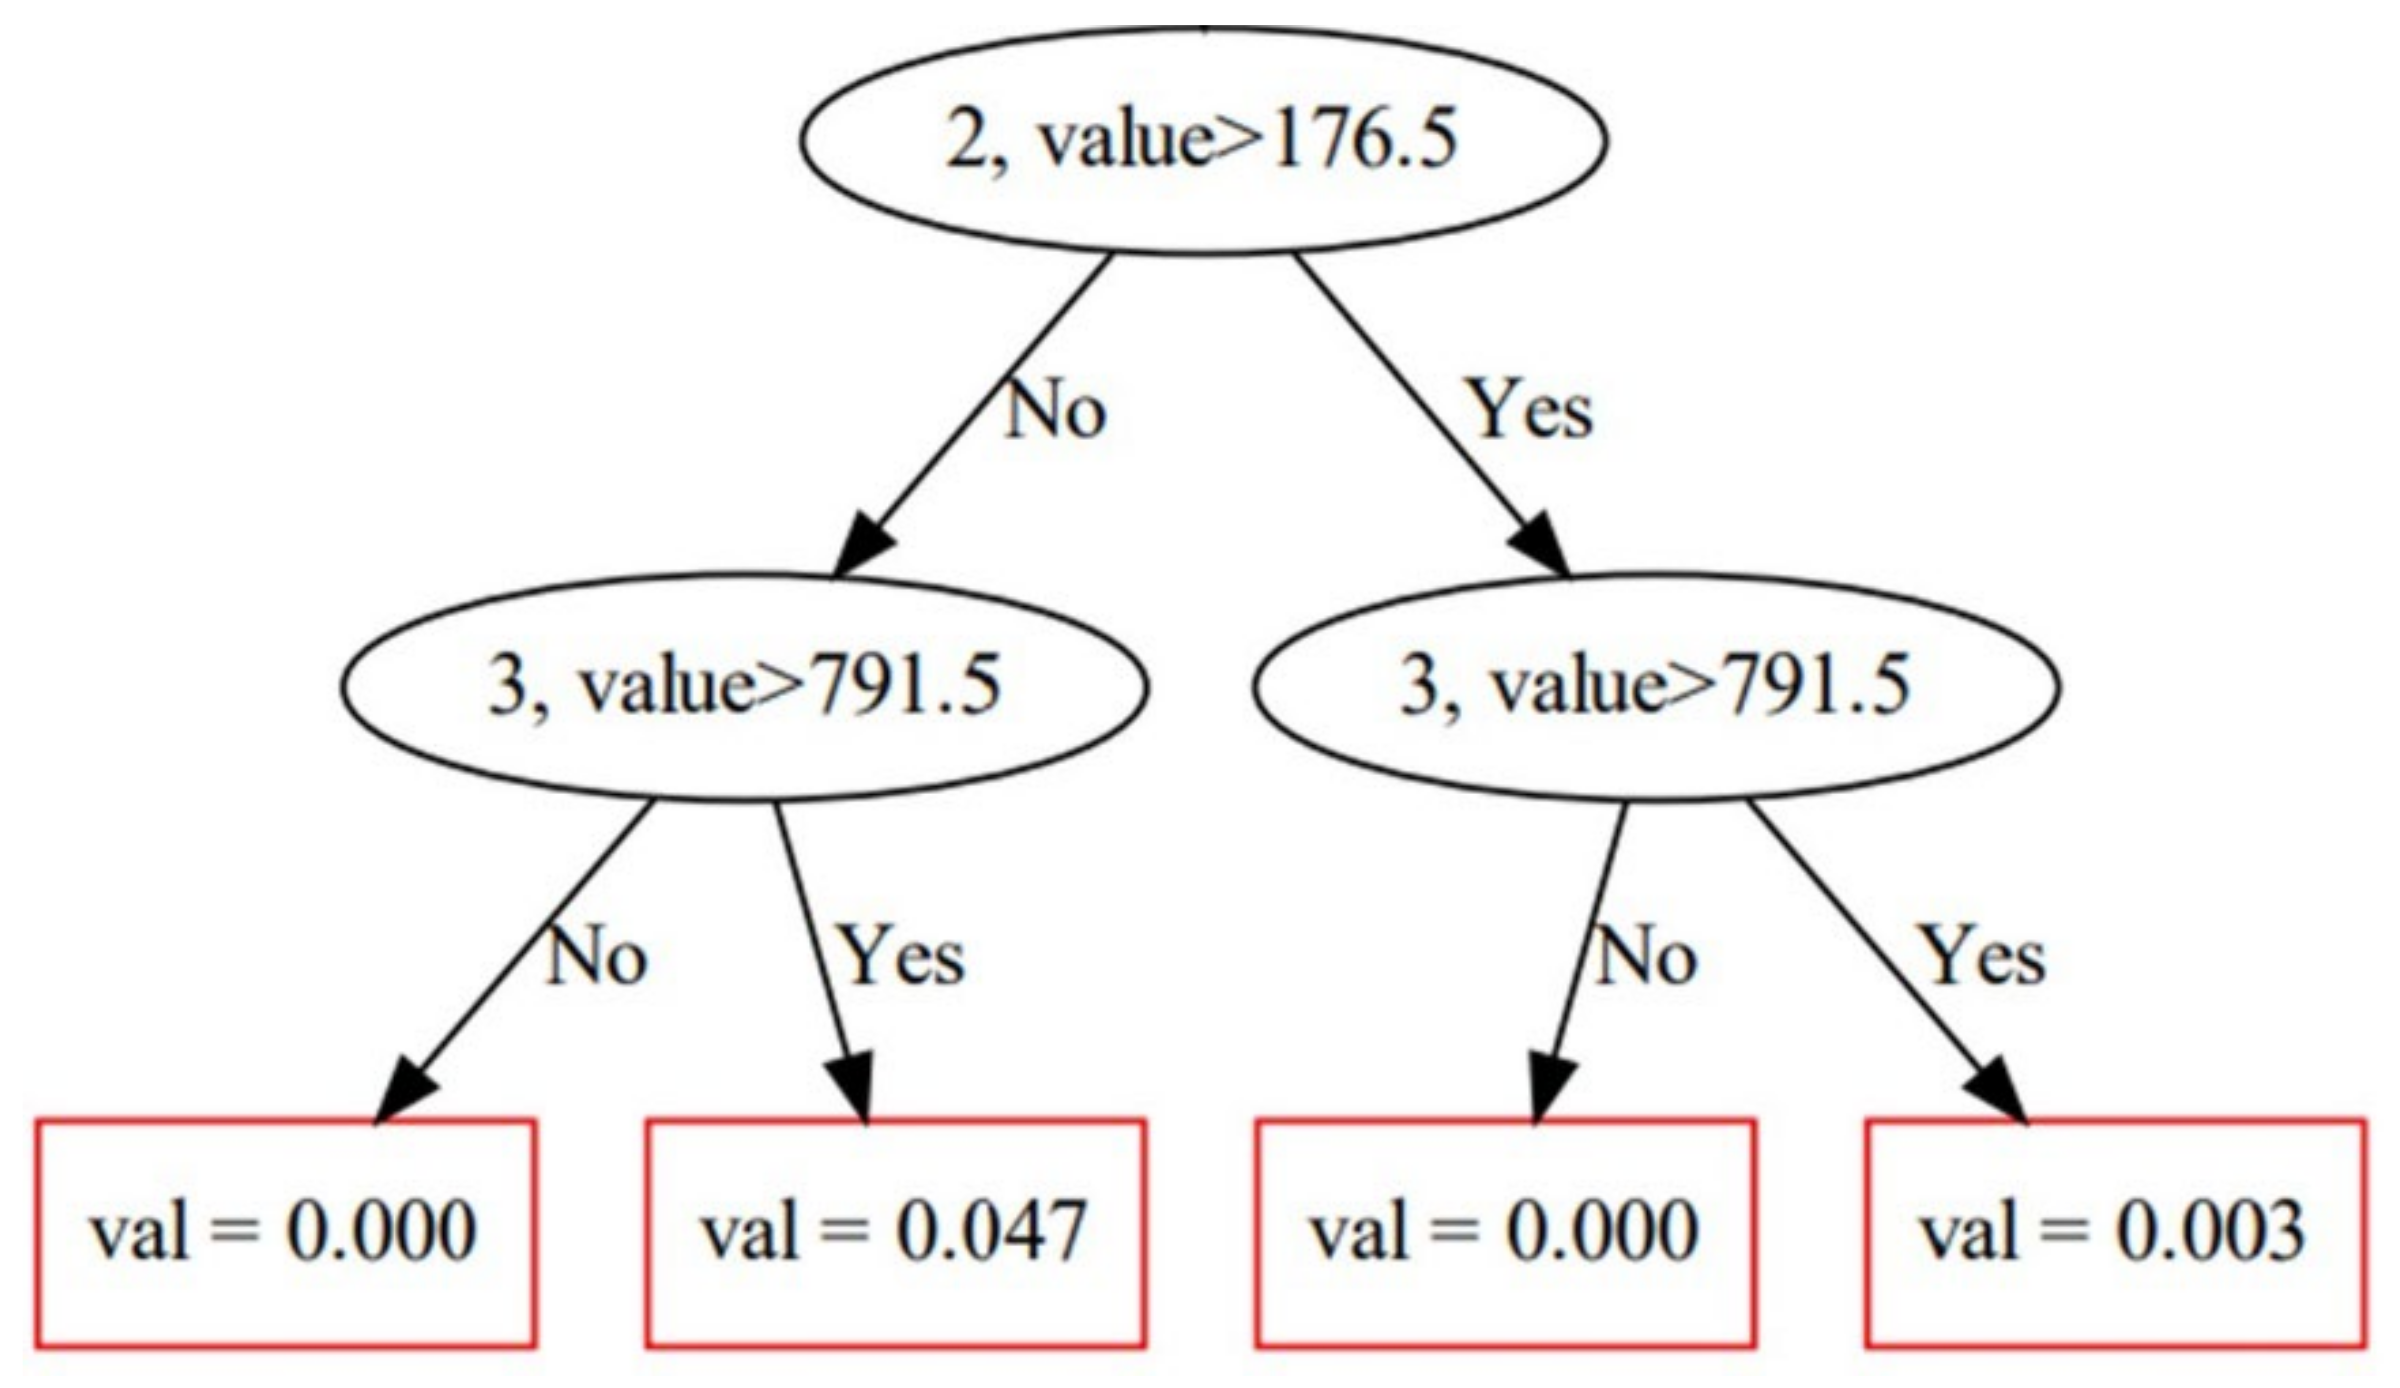
2.1. CatBoost Algorithm
2.2. k-Nearest Neighbors Method
- Input:
- 2.
- Forecasting:
2.3. Support Vector Regression (SVR)
3. Materials and Dataset
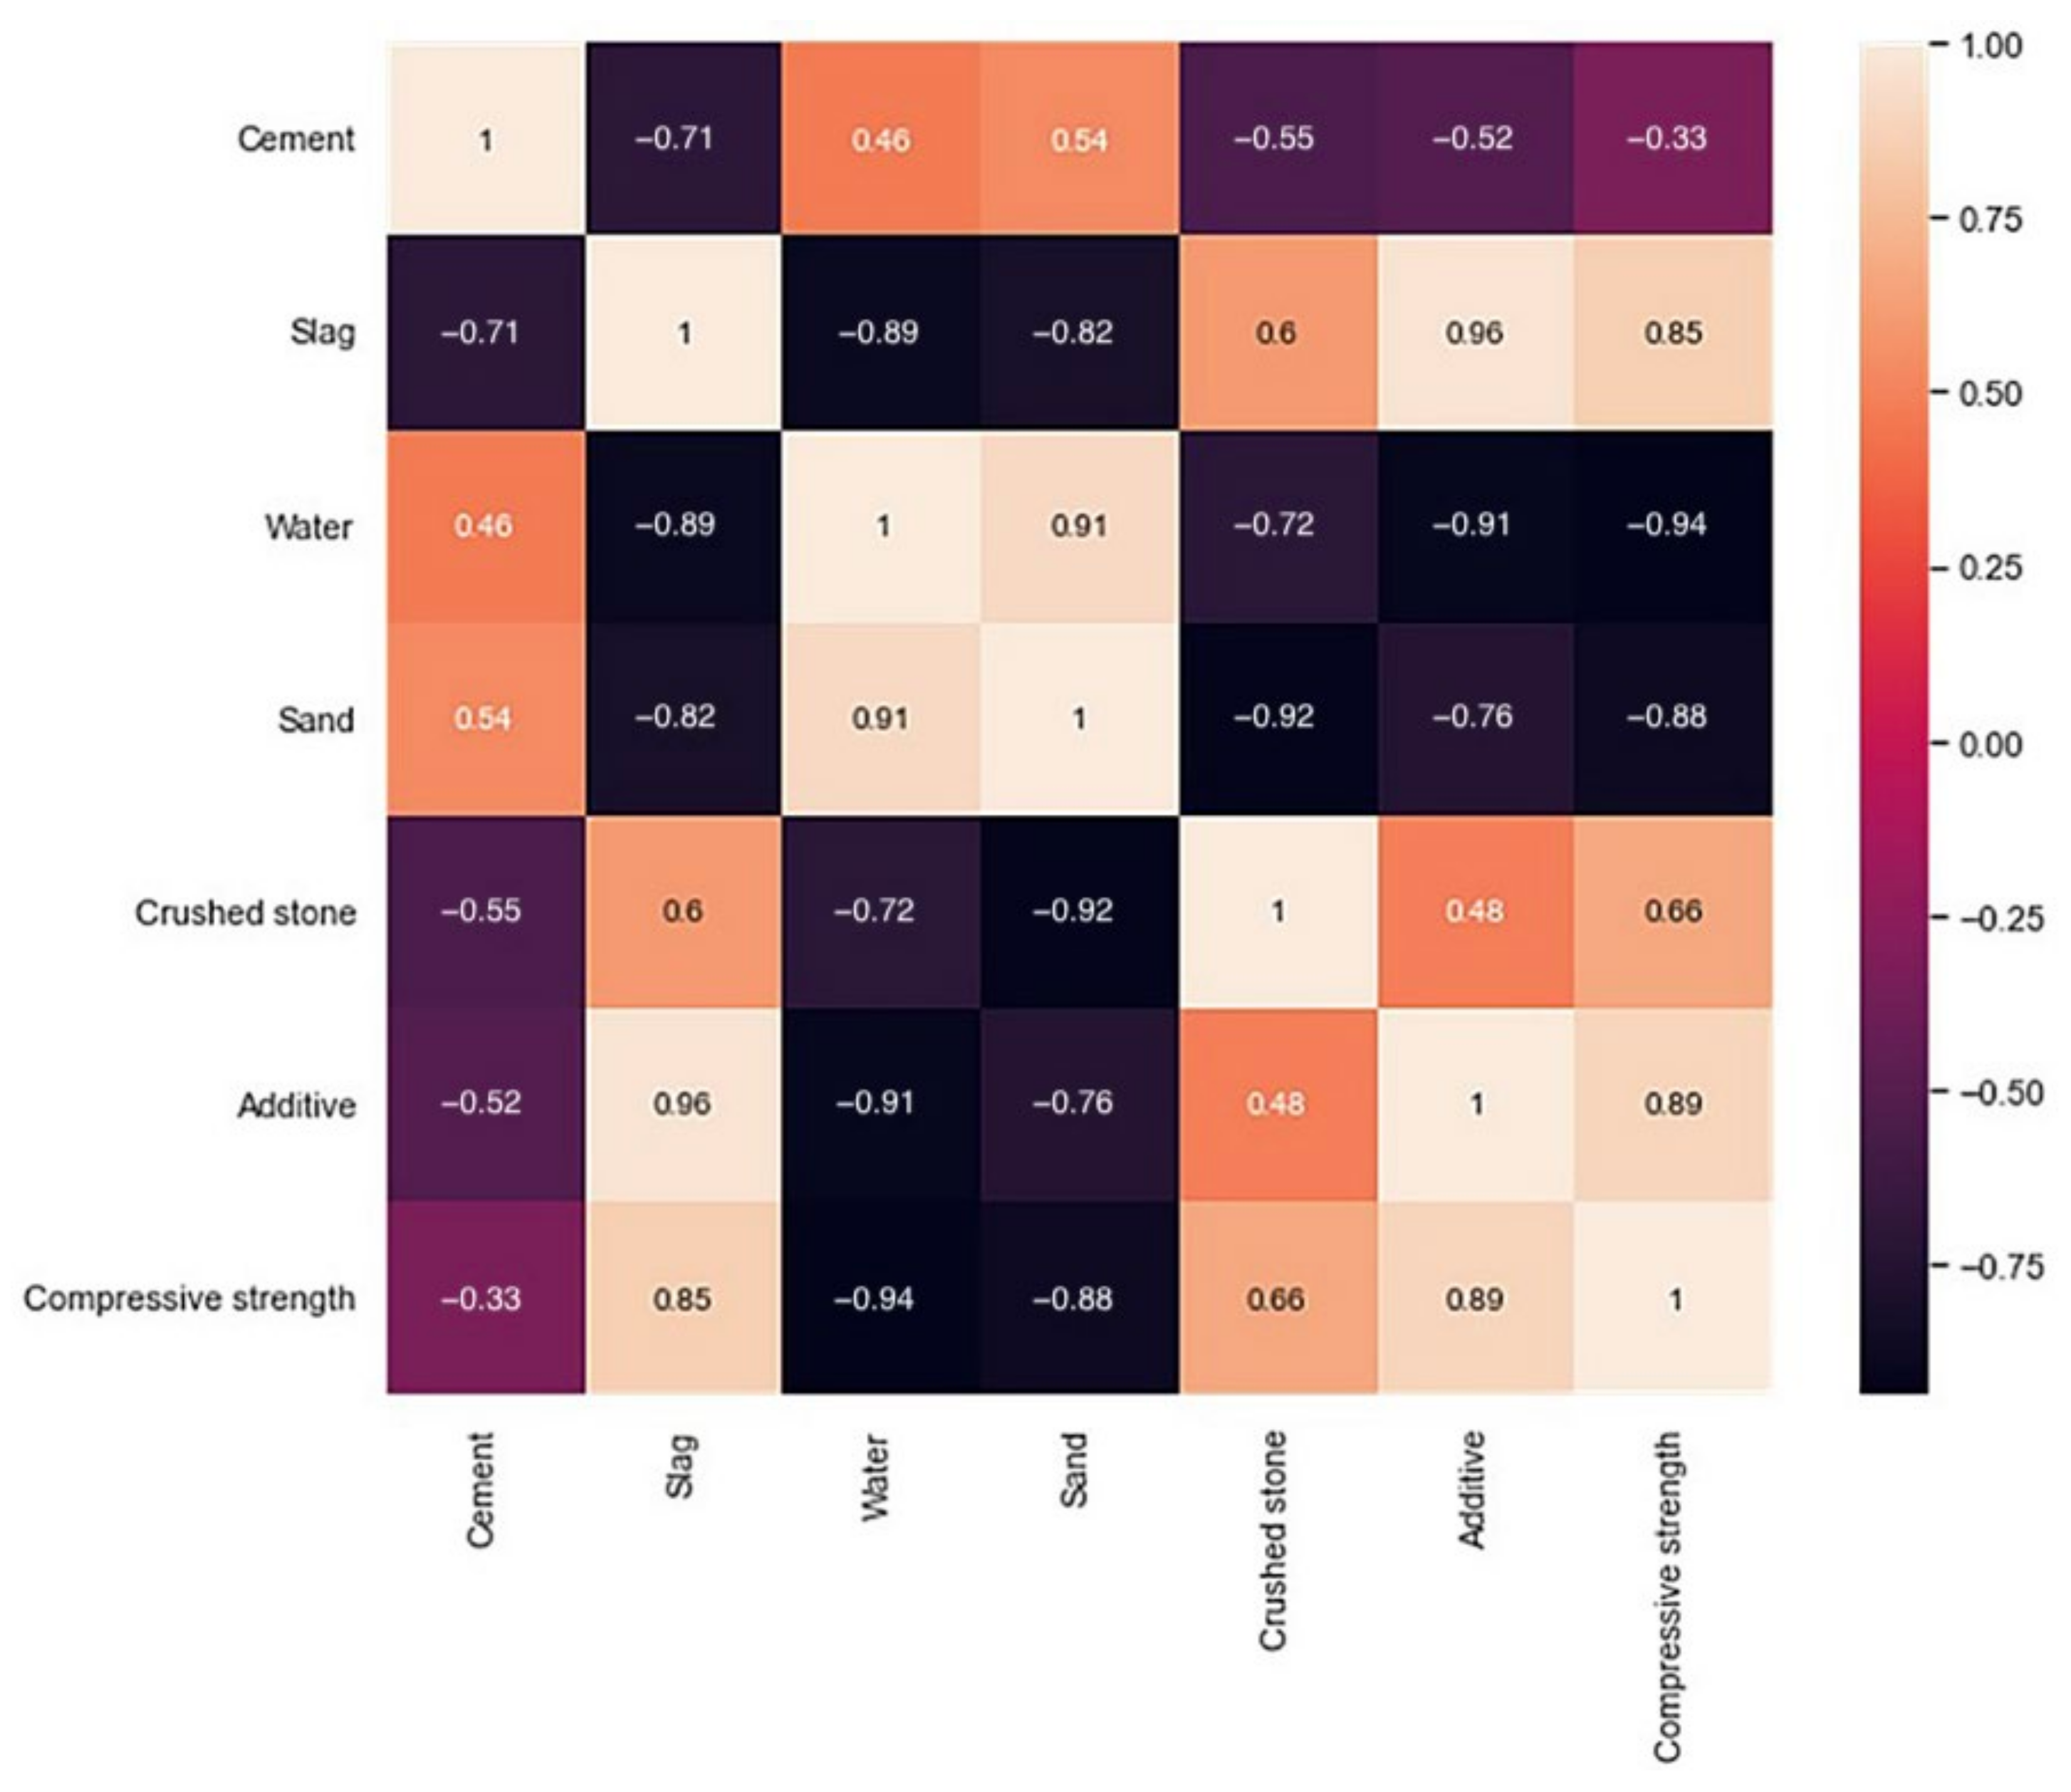
3.1. Dataset Description
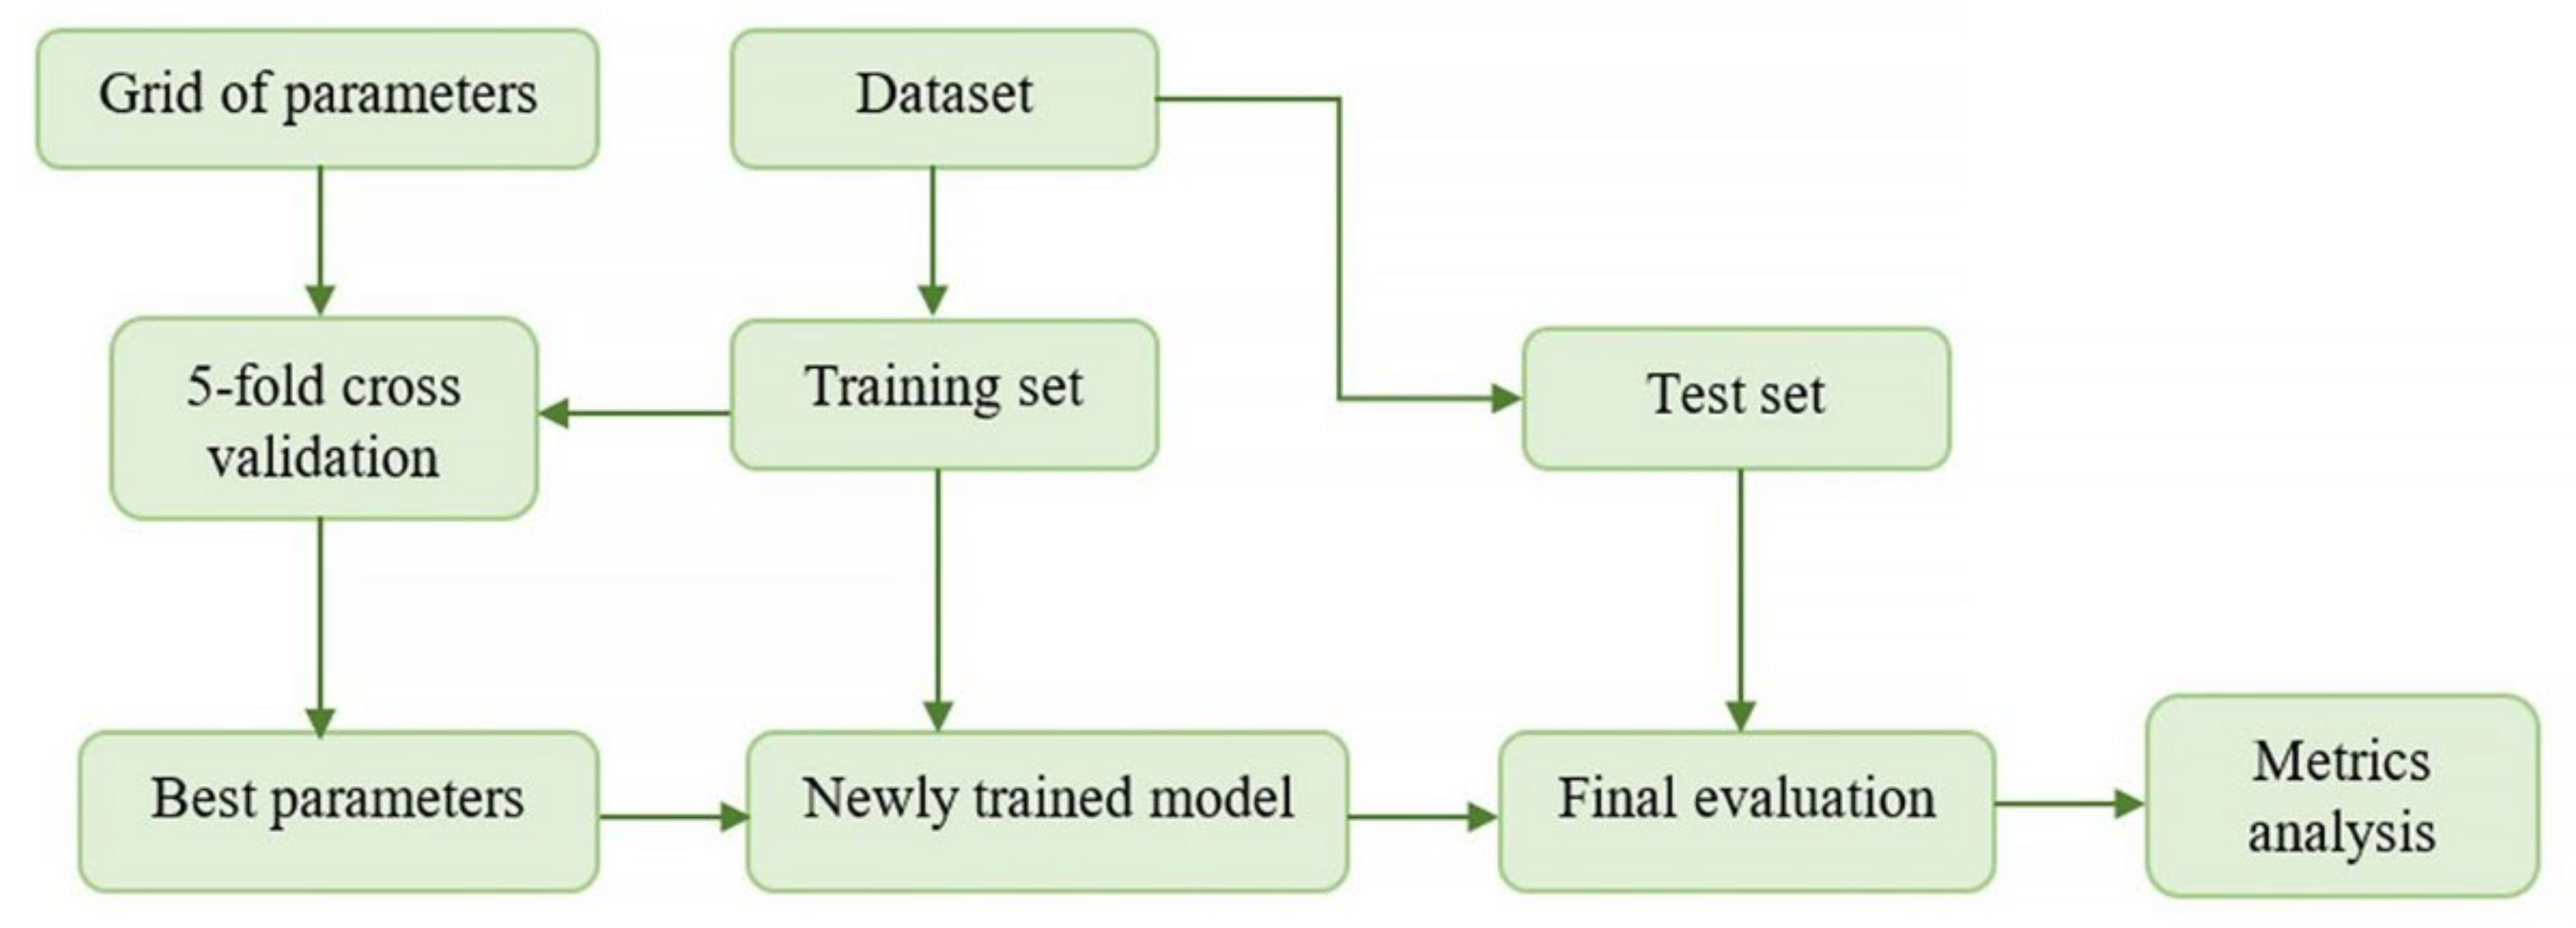
3.2. Performance Evaluation Methods
4. Model Building and Training
4.1. Model Building
4.1.1. Model Building for CatBoost
4.1.2. Model Building for k-Nearest Neighbors Algorithm
4.1.3. Model Building for SVR Algorithm
- –
- Kernel type: using this parameter, you can determine the type of hyperplane used for data separation; when using ”linear” a linear hyperplane is applied; a nonlinear hyperplane can also be used.
- –
- Regularization parameter C: the strength of regularization is inversely proportional to C.
- –
- Epsilon (ε): acceptable margin of error ε allows deviations within some threshold value.
4.2. Model Training
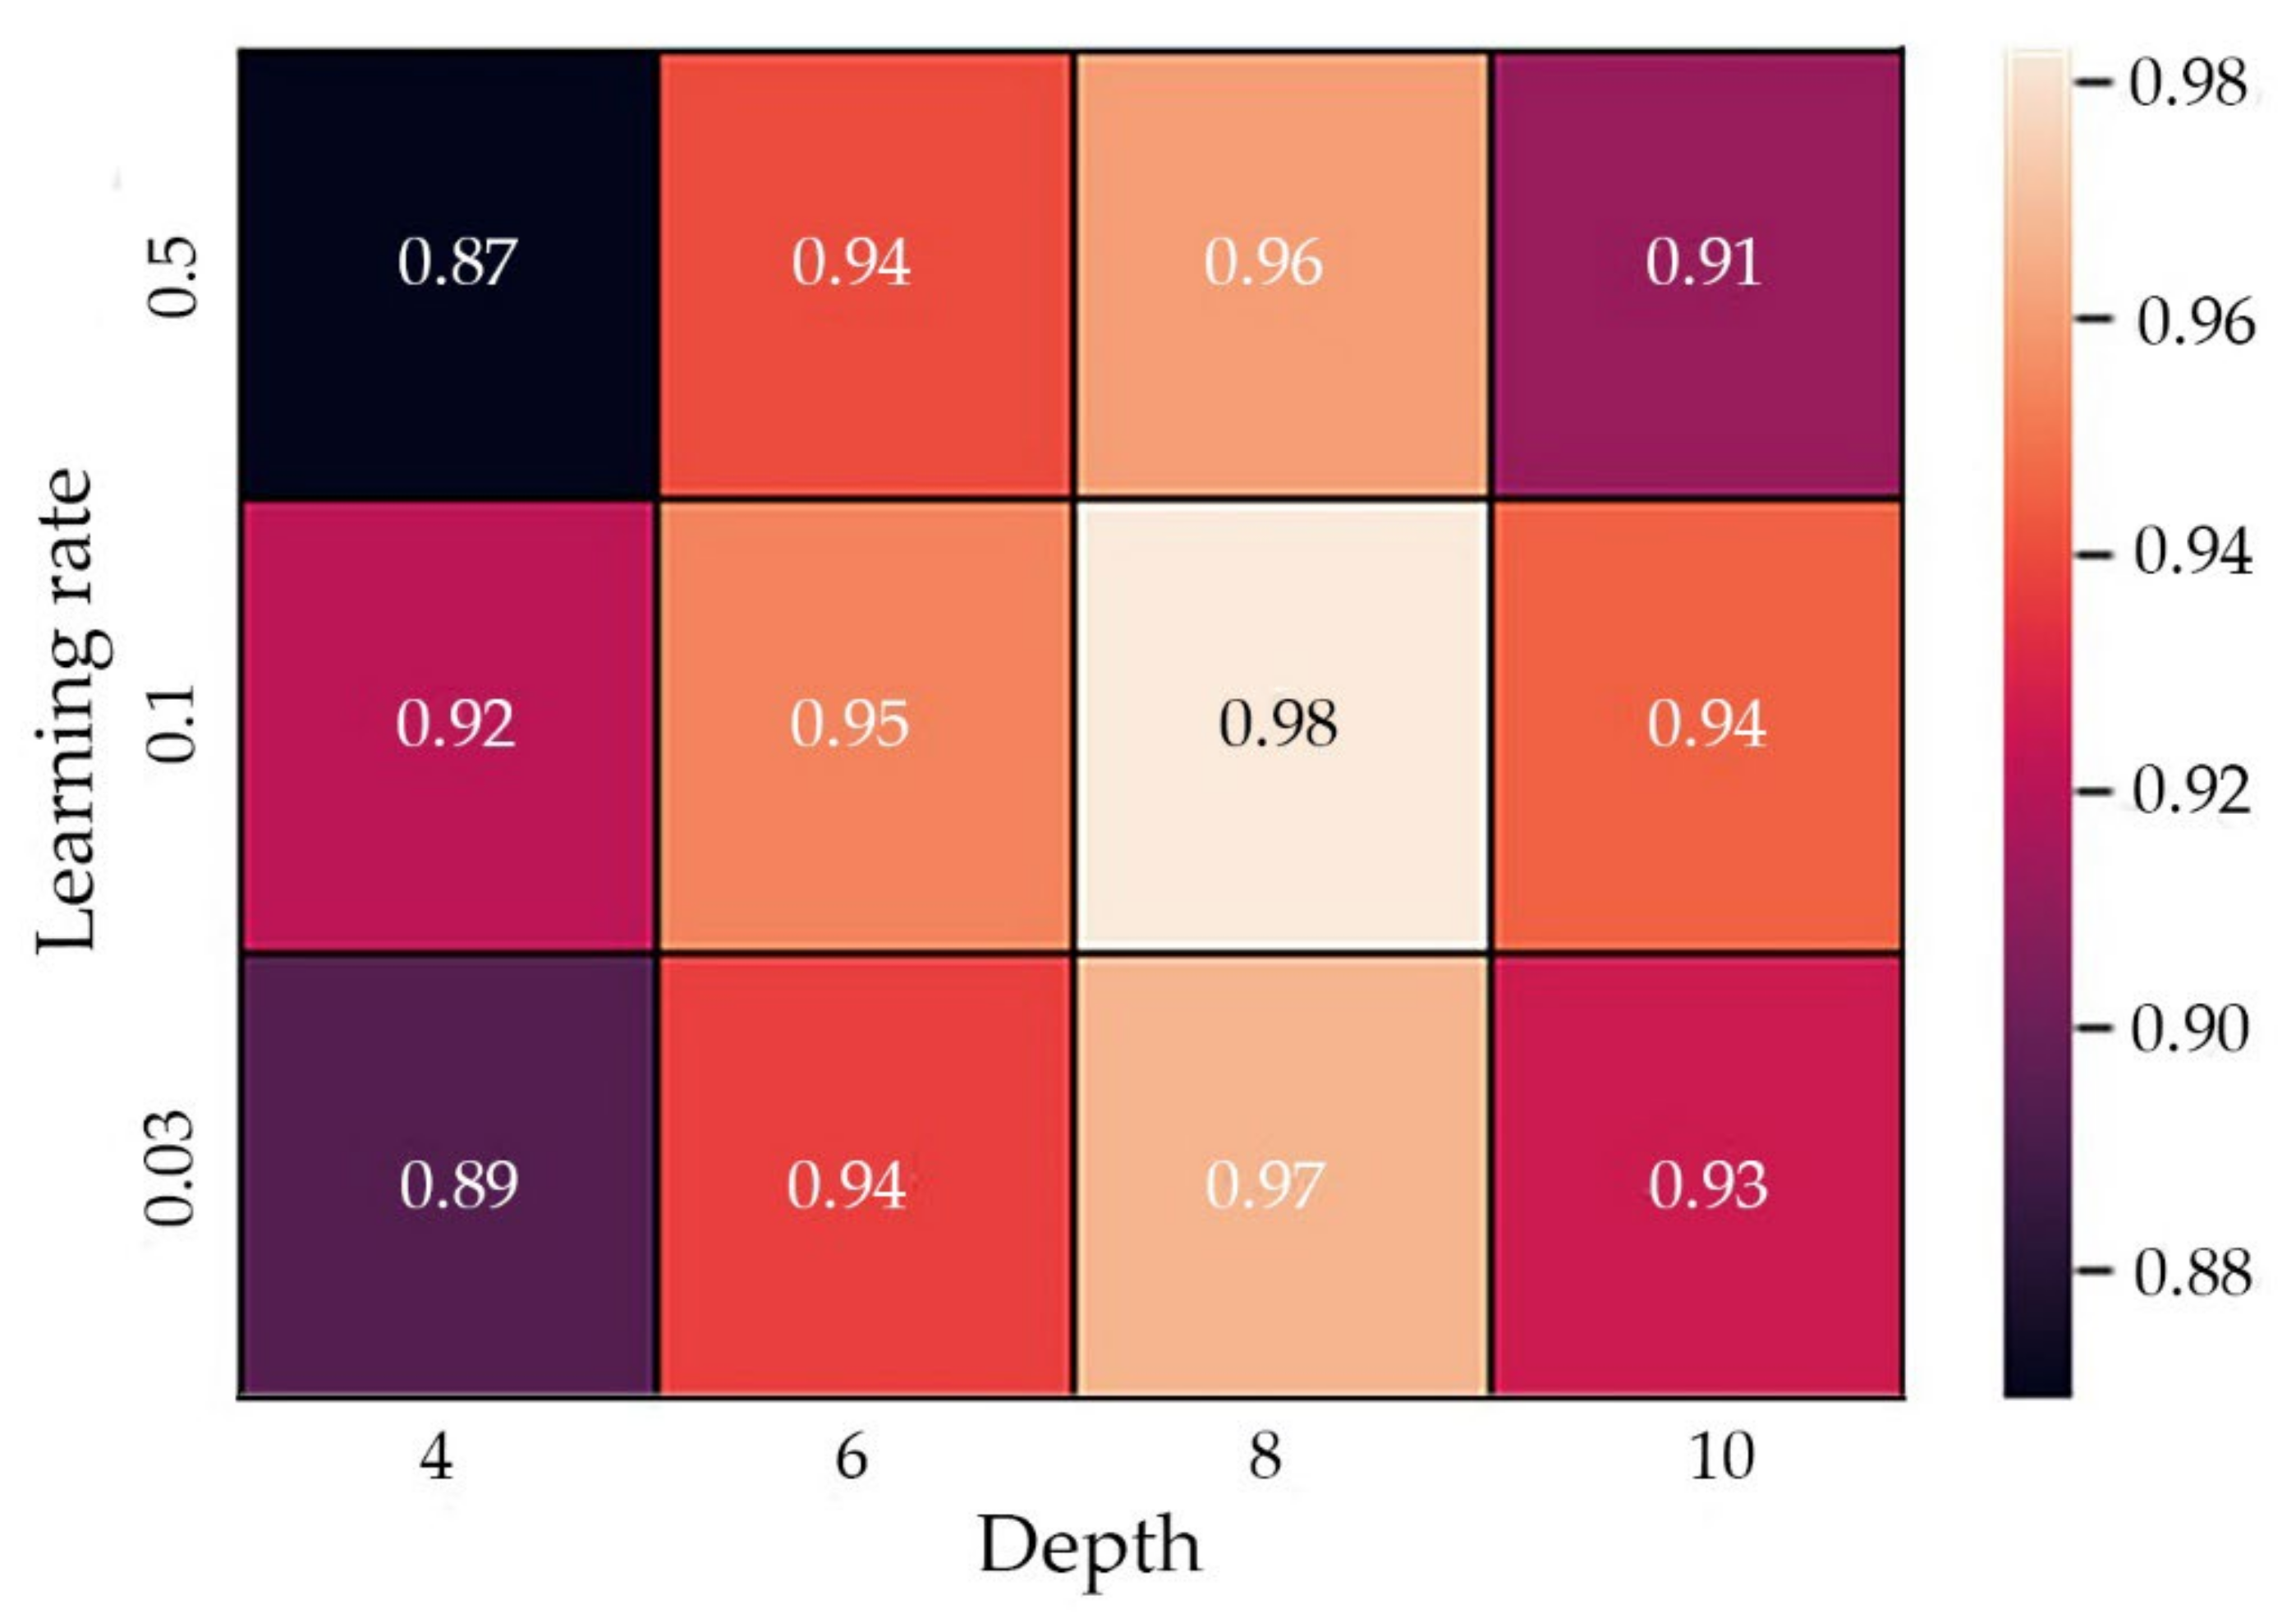
4.2.1. Model Training CatBoost
4.2.2. Model Training k-Nearest Neighbors
4.2.3. Model Training SVR
4.2.4. Parallelization of the Optimization Process and Model Training
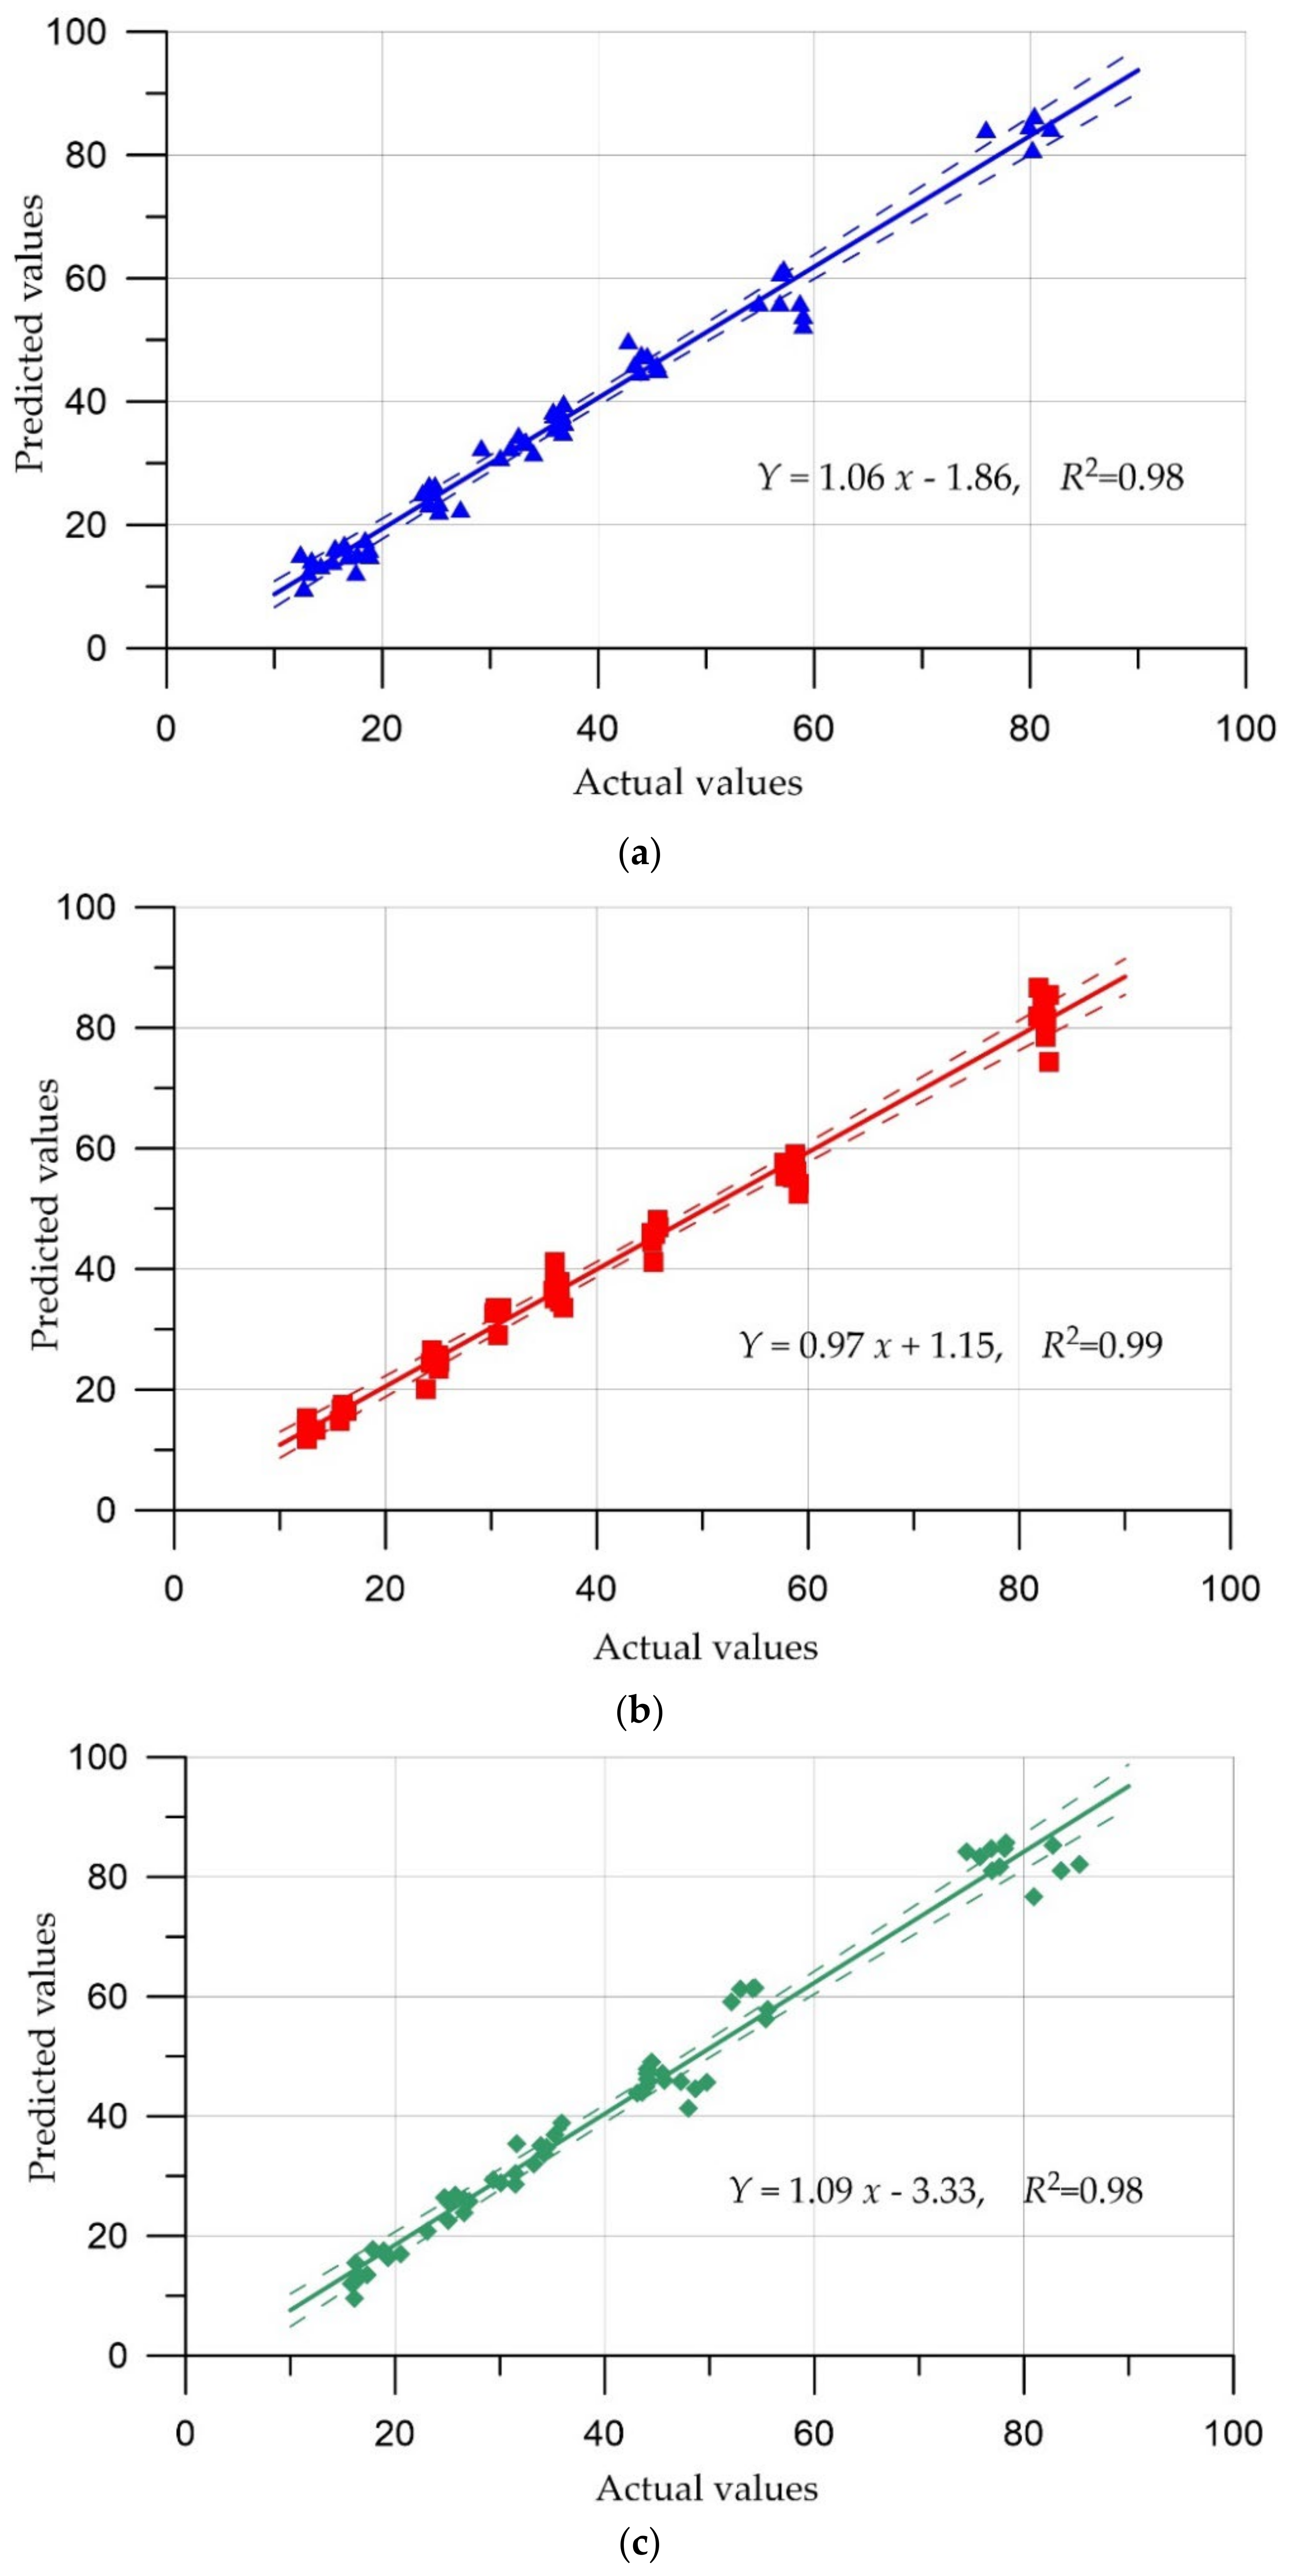
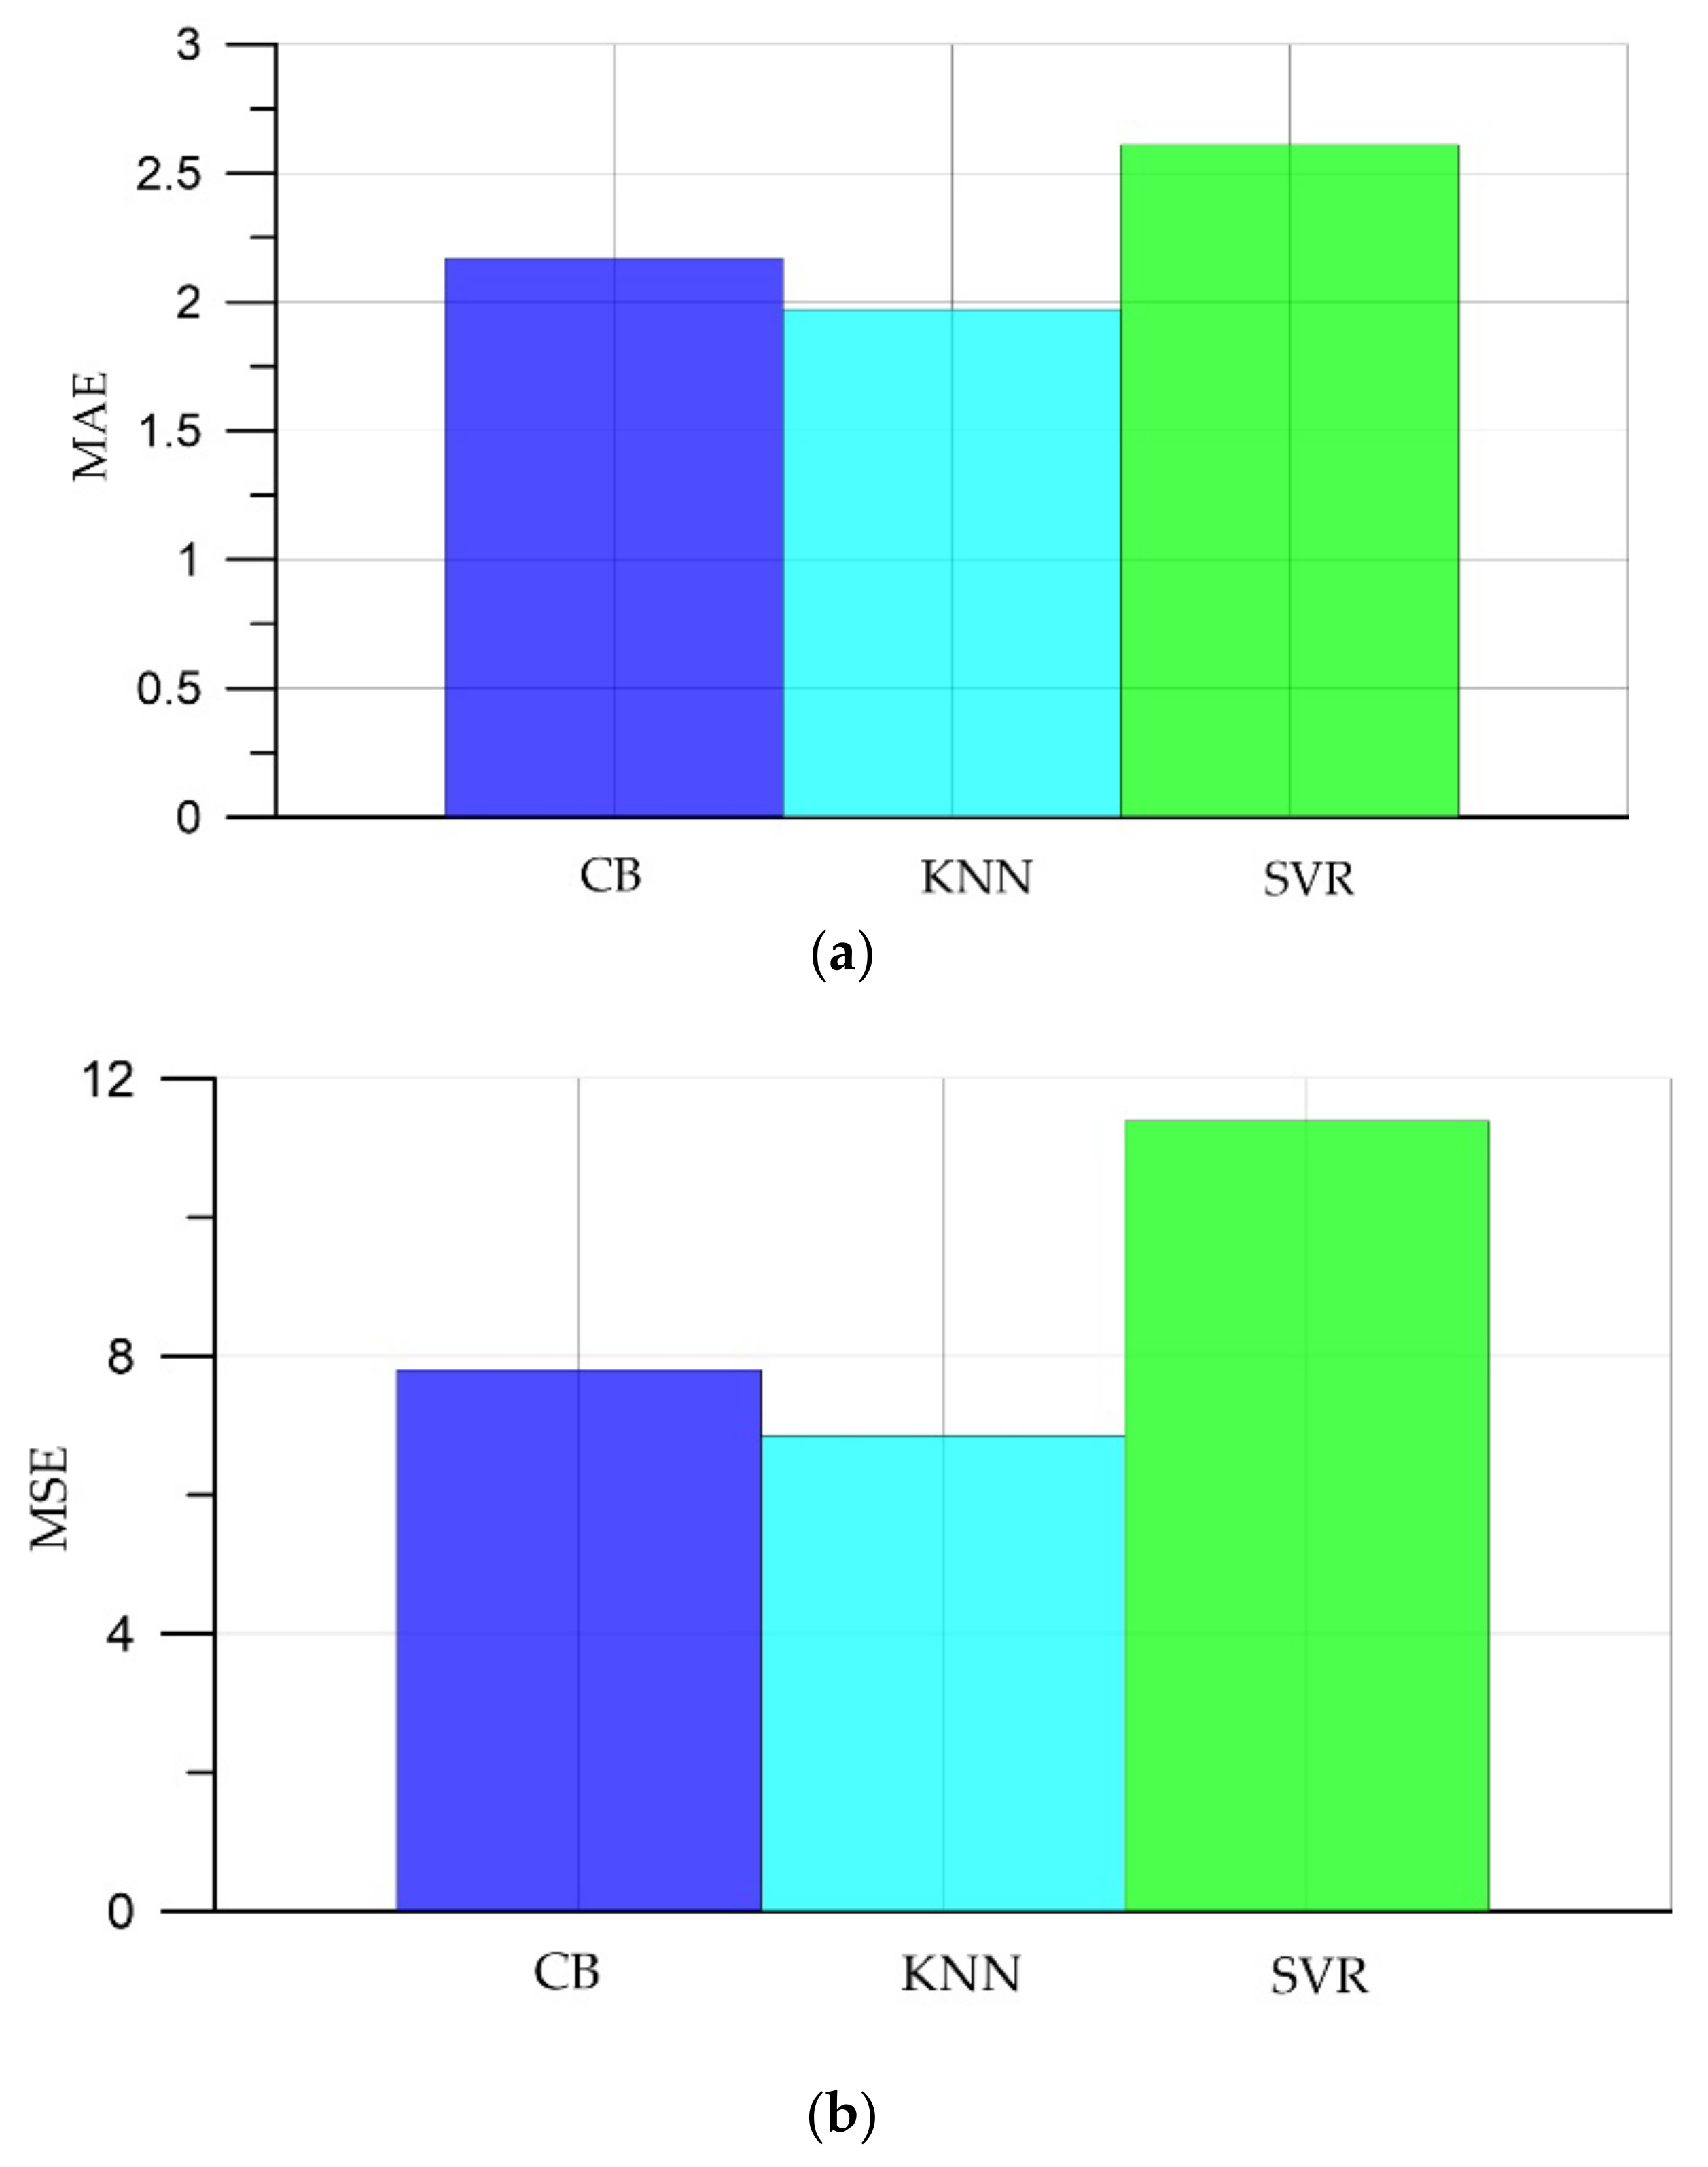
5. Comparison of Prediction Results
6. Conclusions
- (1)
- Development and comparison of three machine learning algorithms based on CatBoost gradient boosting, k-nearest neighbors (KNN) and support vector regression (SVR) were used to predict the compressive strength of self-compacting concrete by applying our accumulated empirical database and data.
- (2)
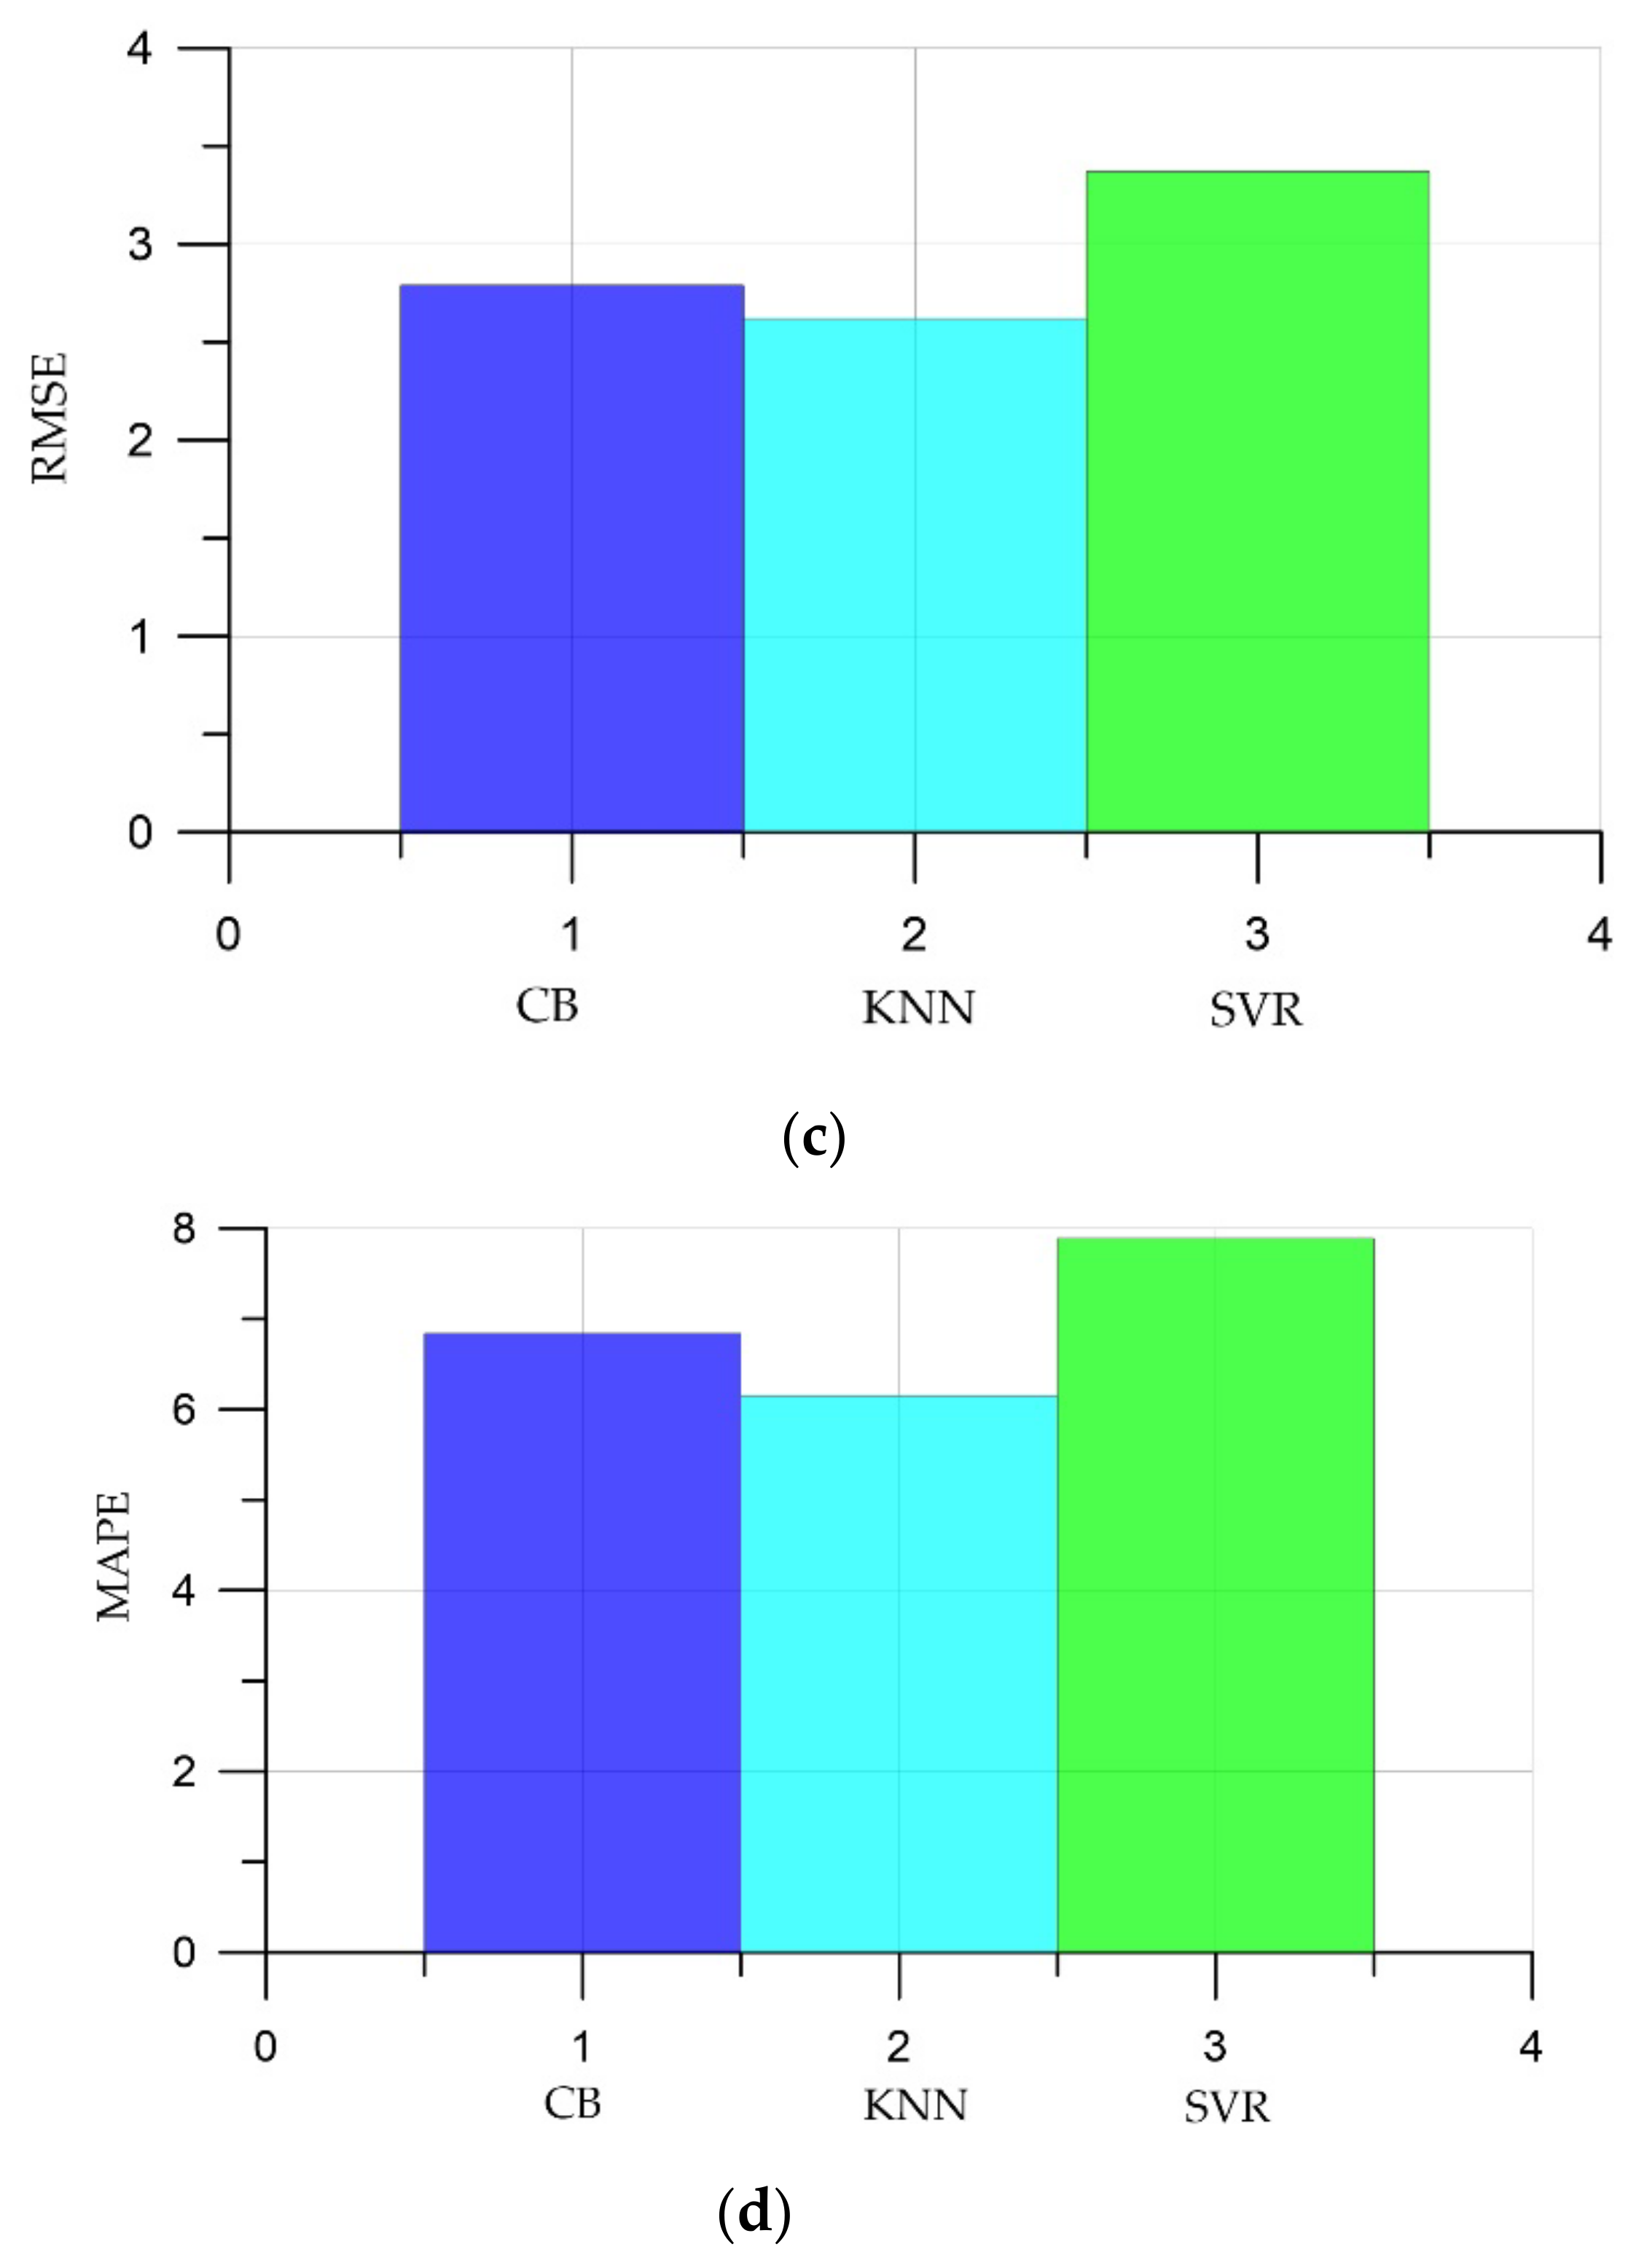
- It has been established that artificial intelligence methods can be applied to determine the compressive strength of self-compacting concrete. The developed models showed a mean absolute percentage error (MAPE) in the range 6.15–7.89%.
- (3)
- Of the three machine learning algorithms, the smallest errors and the largest coefficient of determination were observed in the KNN algorithm: MAE was 1.97; MSE, 6.85; RMSE, 2.62; MAPE, 6.15; and the coefficient of determination R2, 0.99.
- (4)
- Models can be verified and accepted for use in determining the compressive strength of self-compacting concrete, taking into account all available data.
- (5)
- The developed methods can be successfully implemented in the process of production and quality control of building materials, since they do not require serious computing resources and, in the future, based on artificial intelligence, an expert system can be created to summarize all of the accumulated experimental data, which can be located in an electronic environment university and provide data to interested workers and researchers for the development of the industry.
Supplementary Materials
Author Contributions
Funding
Institutional Review Board Statement
Informed Consent Statement
Data Availability Statement
Acknowledgments
Conflicts of Interest
References
- Chandra, S.; Björnström, J. Influence of superplasticizer type and dosage on the slump loss of Portland cement mortars—Part II. Cem. Concr. Res. 2002, 32, 1613–1619. [Google Scholar] [CrossRef]
- Farooq, F.; Czarnecki, S.; Niewiadomski, P.; Aslam, F.; Alabduljabbar, H.; Ostrowski, K.A.; Śliwa-Wieczorek, K.; Nowobilski, T.; Malazdrewicz, S. A Comparative Study for the Prediction of the Compressive Strength of Self-Compacting Concrete Modified with Fly Ash. Materials 2021, 14, 4934. [Google Scholar] [CrossRef] [PubMed]
- Beskopylny, A.N.; Shcherban’, E.M.; Stel’makh, S.A.; Mailyan, L.R.; Meskhi, B.; Evtushenko, A.; Varavka, V.; Beskopylny, N. Nano-Modified Vibrocentrifuged Concrete with Granulated Blast Slag: The Relationship between Mechanical Properties and Micro-Structural Analysis. Materials 2022, 15, 4254. [Google Scholar] [CrossRef]
- Beskopylny, A.N.; Stel’makh, S.A.; Shcherban’, E.M.; Mailyan, L.R.; Meskhi, B.; Beskopylny, N.; El’shaeva, D.; Kotenko, M. The Investigation of Compacting Cement Systems for Studying the Fundamental Process of Cement Gel Formation. Gels 2022, 8, 530. [Google Scholar] [CrossRef] [PubMed]
- Stel’makh, S.A.; Shcherban’, E.M.; Beskopylny, A.; Mailyan, L.R.; Meskhi, B.; Beskopylny, N.; Zherebtsov, Y. Development of High-Tech Self-Compacting Concrete Mixtures Based on Nano-Modifiers of Various Types. Materials 2022, 15, 2739. [Google Scholar] [CrossRef]
- Beskopylny, A.N.; Stel’makh, S.A.; Shcherban’, E.M.; Mailyan, L.R.; Meskhi, B.; Varavka, V.; Beskopylny, N.; El’shaeva, D. A Study on the Cement Gel Formation Process during the Creation of Nanomodified High-Performance Concrete Based on Nanosilica. Gels 2022, 8, 346. [Google Scholar] [CrossRef]
- Beskopylny, A.N.; Meskhi, B.; Stel’makh, S.A.; Shcherban’, E.M.; Mailyan, L.R.; Veremeenko, A.; Akopyan, V.; Shilov, A.V.; Chernil’nik, A.; Beskopylny, N. Numerical Simulation of the Bearing Capacity of Variotropic Short Concrete Beams Reinforced with Polymer Composite Reinforcing Bars. Polymers 2022, 14, 3051. [Google Scholar] [CrossRef]
- Dudukalov, E.V.; Munister, V.D.; Zolkin, A.L.; Losev, A.N.; Knishov, A.V. The use of artificial intelligence and information technology for measurements in mechanical engineering and in process automation systems in Industry 4.0. J. Phys. Conf. Ser. 2021, 1889, 052011. [Google Scholar] [CrossRef]
- Muhammad, W.; Brahme, A.P.; Ibragimova, O.; Kang, J.; Inal, K. A machine learning framework to predict local strain distribution and the evolution of plastic anisotropy & fracture in additively manufactured alloys. Int. J. Plast. 2021, 136, 102867. [Google Scholar] [CrossRef]
- Oh, W.B.; Yun, T.J.; Lee, B.R.; Kim, C.G.; Liang, Z.L.; Kim, I.S. A Study on Intelligent Algorithm to Control Welding Parameters for Lap-joint. Procedia Manuf. 2019, 30, 48–55. [Google Scholar] [CrossRef]
- Patel, A.R.; Ramaiya, K.K.; Bhatia, C.V. Artificial Intelligence: Prospect in Mechanical Engineering Field-A Review. Lect. Notes Data Eng. Commun. Technol. 2021, 52, 267–282. [Google Scholar] [CrossRef]
- Tosee, S.V.R.; Faridmehr, I.; Bedon, C.; Sadowski, Ł.; Aalimahmoody, N.; Nikoo, M.; Nowobilski, T. Metaheuristic Prediction of the Compressive Strength of Environmentally Friendly Concrete Modified with Eggshell Powder Using the Hybrid ANN-SFL Optimization Algorithm. Materials 2021, 14, 6172. [Google Scholar] [CrossRef]
- Ahmad, A.; Ahmad, W.; Chaiyasarn, K.; Ostrowski, K.A.; Aslam, F.; Zajdel, P.; Joyklad, P. Prediction of Geopolymer Concrete Compressive Strength Using Novel Machine Learning Algorithms. Polymers 2021, 13, 3389. [Google Scholar] [CrossRef] [PubMed]
- Beskopylny, A.; Lyapin, A.; Anysz, H.; Meskhi, B.; Veremeenko, A.; Mozgovoy, A. Artificial Neural Networks in Classification of Steel Grades Based on Non-Destructive Tests. Materials 2020, 13, 2445. [Google Scholar] [CrossRef] [PubMed]
- Liu, F.; Xu, J.; Tan, S.; Gong, A.; Li, H. Orthogonal Experiments and Neural Networks Analysis of Concrete Performance. Water 2022, 14, 2520. [Google Scholar] [CrossRef]
- Islam, M.M.; Hossain, M.B.; Akhtar, M.N.; Moni, M.A.; Hasan, K.F. CNN Based on Transfer Learning Models Using Data Augmentation and Transformation for Detection of Concrete Crack. Algorithms 2022, 15, 287. [Google Scholar] [CrossRef]
- Ni, X.; Duan, K. Machine Learning-Based Models for Shear Strength Prediction of UHPFRC Beams. Mathematics 2022, 10, 2918. [Google Scholar] [CrossRef]
- Rahman, S.K.; Al-Ameri, R. Experimental and Artificial Neural Network-Based Study on the Sorptivity Characteristics of Geopolymer Concrete with Recycled Cementitious Materials and Basalt Fibres. Recycling 2022, 7, 55. [Google Scholar] [CrossRef]
- Shah, H.A.; Yuan, Q.; Akmal, U.; Shah, S.A.; Salmi, A.; Awad, Y.A.; Shah, L.A.; Iftikhar, Y.; Javed, M.H.; Khan, M.I. Application of Machine Learning Techniques for Predicting Compressive, Splitting Tensile, and Flexural Strengths of Concrete with Metakaolin. Materials 2022, 15, 5435. [Google Scholar] [CrossRef]
- Behnood, A.; Behnood, V.; Gharehveran, M.M.; Alyamac, K.E. Prediction of the compressive strength of normal and high-performance concretes using M5P model tree algorithm. Constr. Build. Mater. 2017, 142, 199–207. [Google Scholar] [CrossRef]
- Behnood, A.; Olek, J.; Glinicki, M.A. Predicting modulus elasticity of recycled aggregate concrete using M5′ model tree algorithm. Constr. Build. Mater. 2015, 94, 137–147. [Google Scholar] [CrossRef]
- Naderpour, H.; Rafiean, A.H.; Fakharian, P. Compressive strength prediction of environmentally friendly concrete using artificial neural networks. J. Build. Eng. 2018, 16, 213–219. [Google Scholar] [CrossRef]
- Getahun, M.A.; Shitote, S.M.; Gariy, Z.A. Artificial neural network based modelling approach for strength prediction of concrete incorporating agricultural and construction wastes. Constr. Build. Mater. 2018, 190, 517–525. [Google Scholar] [CrossRef]
- Hadzima-Nyarko, M.; Nyarko, E.K.; Ademović, N.; Miličević, I.; Kalman Šipoš, T. Modelling the Influence of Waste Rubber on Compressive Strength of Concrete by Artificial Neural Networks. Materials 2019, 12, 561. [Google Scholar] [CrossRef] [Green Version]
- De-Prado-Gil, J.; Palencia, C.; Jagadesh, P.; Martínez-García, R. A Study on the Prediction of Compressive Strength of Self-Compacting Recycled Aggregate Concrete Utilizing Novel Computational Approaches. Materials 2022, 15, 5232. [Google Scholar] [CrossRef]
- Ghafor, K. Multifunctional Models, Including an Artificial Neural Network, to Predict the Compressive Strength of Self-Compacting Concrete. Appl. Sci. 2022, 12, 8161. [Google Scholar] [CrossRef]
- De-Prado-Gil, J.; Palencia, C.; Silva-Monteiro, N.; Martínez-García, R. To predict the compressive strength of self compacting concrete with recycled aggregates utilizing ensemble machine learning models. Case Stud. Constr. Mater. 2022, 16, e01046. [Google Scholar] [CrossRef]
- Chandramouli, P.; Jayaseelan, R.; Pandulu, G.; Sathish Kumar, V.; Murali, G.; Vatin, N.I. Estimating the Axial Compression Capacity of Concrete-Filled Double-Skin Tubular Columns with Metallic and Non-Metallic Composite Materials. Materials 2022, 15, 3567. [Google Scholar] [CrossRef]
- Kuppusamy, Y.; Jayaseelan, R.; Pandulu, G.; Sathish Kumar, V.; Murali, G.; Dixit, S.; Vatin, N.I. Artificial Neural Network with a Cross-Validation Technique to Predict the Material Design of Eco-Friendly Engineered Geopolymer Composites. Materials 2022, 15, 3443. [Google Scholar] [CrossRef]
- Amin, M.N.; Ahmad, A.; Khan, K.; Ahmad, W.; Ehsan, S.; Alabdullah, A.A. Predicting the Rheological Properties of Super-Plasticized Concrete Using Modeling Techniques. Materials 2022, 15, 5208. [Google Scholar] [CrossRef]
- Ilyas, I.; Zafar, A.; Afzal, M.T.; Javed, M.F.; Alrowais, R.; Althoey, F.; Mohamed, A.M.; Mohamed, A.; Vatin, N.I. Advanced Machine Learning Modeling Approach for Prediction of Compressive Strength of FRP Confined Concrete Using Multiphysics Genetic Expression Programming. Polymers 2022, 14, 1789. [Google Scholar] [CrossRef] [PubMed]
- Koo, S.; Shin, D.; Kim, C. Application of Principal Component Analysis Approach to Predict Shear Strength of Reinforced Concrete Beams with Stirrups. Materials 2021, 14, 3471. [Google Scholar] [CrossRef]
- Faridmehr, I.; Nehdi, M.L.; Huseien, G.F.; Baghban, M.H.; Sam, A.R.M.; Algaifi, H.A. Experimental and Informational Modeling Study of Sustainable Self-Compacting Geopolymer Concrete. Sustainability 2021, 13, 7444. [Google Scholar] [CrossRef]
- Amin, M.N.; Iqtidar, A.; Khan, K.; Javed, M.F.; Shalabi, F.I.; Qadir, M.G. Comparison of Machine Learning Approaches with Traditional Methods for Predicting the Compressive Strength of Rice Husk Ash Concrete. Crystals 2021, 11, 779. [Google Scholar] [CrossRef]
- Dabbaghi, F.; Rashidi, M.; Nehdi, M.L.; Sadeghi, H.; Karimaei, M.; Rasekh, H.; Qaderi, F. Experimental and Informational Modeling Study on Flexural Strength of Eco-Friendly Concrete Incorporating Coal Waste. Sustainability 2021, 13, 7506. [Google Scholar] [CrossRef]
- Wu, N.-J. Predicting the Compressive Strength of Concrete Using an RBF-ANN Model. Appl. Sci. 2021, 11, 6382. [Google Scholar] [CrossRef]
- Bu, L.; Du, G.; Hou, Q. Prediction of the Compressive Strength of Recycled Aggregate Concrete Based on Artificial Neural Network. Materials 2021, 14, 3921. [Google Scholar] [CrossRef] [PubMed]
- Ahmad, A.; Chaiyasarn, K.; Farooq, F.; Ahmad, W.; Suparp, S.; Aslam, F. Compressive Strength Prediction via Gene Expression Programming (GEP) and Artificial Neural Network (ANN) for Concrete Containing RCA. Buildings 2021, 11, 324. [Google Scholar] [CrossRef]
- Suescum-Morales, D.; Salas-Morera, L.; Jiménez, J.R.; García-Hernández, L. A Novel Artificial Neural Network to Predict Compressive Strength of Recycled Aggregate Concrete. Appl. Sci. 2021, 11, 11077. [Google Scholar] [CrossRef]
- Song, H.; Ahmad, A.; Ostrowski, K.A.; Dudek, M. Analyzing the Compressive Strength of Ceramic Waste-Based Concrete Using Experiment and Artificial Neural Network (ANN) Approach. Materials 2021, 14, 4518. [Google Scholar] [CrossRef]
- Kekez, S.; Kubica, J. Application of Artificial Neural Networks for Prediction of Mechanical Properties of CNT/CNF Reinforced Concrete. Materials 2021, 14, 5637. [Google Scholar] [CrossRef] [PubMed]
- Maqsoom, A.; Aslam, B.; Gul, M.E.; Ullah, F.; Kouzani, A.Z.; Mahmud, M.A.P.; Nawaz, A. Using Multivariate Regression and ANN Models to Predict Properties of Concrete Cured under Hot Weather. Sustainability 2021, 13, 10164. [Google Scholar] [CrossRef]
- Kovačević, M.; Lozančić, S.; Nyarko, E.K.; Hadzima-Nyarko, M. Modeling of Compressive Strength of Self-Compacting Rubberized Concrete Using Machine Learning. Materials 2021, 14, 4346. [Google Scholar] [CrossRef]
- Ahmad, A.; Ostrowski, K.A.; Maślak, M.; Farooq, F.; Mehmood, I.; Nafees, A. Comparative Study of Supervised Machine Learning Algorithms for Predicting the Compressive Strength of Concrete at High Temperature. Materials 2021, 14, 4222. [Google Scholar] [CrossRef]
- Stel’makh, S.A.; Shcherban’, E.M.; Beskopylny, A.N.; Mailyan, L.R.; Meskhi, B.; Razveeva, I.; Kozhakin, A.; Beskopylny, N. Prediction of Mechanical Properties of Highly Functional Lightweight Fiber-Reinforced Concrete Based on Deep Neural Network and Ensemble Regression Trees Methods. Materials 2022, 15, 6740. [Google Scholar] [CrossRef] [PubMed]
- Rajadurai, R.-S.; Kang, S.-T. Automated Vision-Based Crack Detection on Concrete Surfaces Using Deep Learning. Appl. Sci. 2021, 11, 5229. [Google Scholar] [CrossRef]
- Bin Khairul Anuar, M.A.R.; Ngamkhanong, C.; Wu, Y.; Kaewunruen, S. Recycled Aggregates Concrete Compressive Strength Prediction Using Artificial Neural Networks (ANNs). Infrastructures 2021, 6, 17. [Google Scholar] [CrossRef]
- Palevičius, P.; Pal, M.; Landauskas, M.; Orinaitė, U.; Timofejeva, I.; Ragulskis, M. Automatic Detection of Cracks on Concrete Surfaces in the Presence of Shadows. Sensors 2022, 22, 3662. [Google Scholar] [CrossRef]
- Sarir, P.; Armaghani, D.J.; Jiang, H.; Sabri, M.M.S.; He, B.; Ulrikh, D.V. Prediction of Bearing Capacity of the Square Concrete-Filled Steel Tube Columns: An Application of Metaheuristic-Based Neural Network Models. Materials 2022, 15, 3309. [Google Scholar] [CrossRef]
- Deifalla, A.; Salem, N.M. A Machine Learning Model for Torsion Strength of Externally Bonded FRP-Reinforced Concrete Beams. Polymers 2022, 14, 1824. [Google Scholar] [CrossRef]
- Kim, B.; Choi, S.-W.; Hu, G.; Lee, D.-E.; Serfa Juan, R.O. An Automated Image-Based Multivariant Concrete Defect Recognition Using a Convolutional Neural Network with an Integrated Pooling Module. Sensors 2022, 22, 3118. [Google Scholar] [CrossRef] [PubMed]
- Khokhar, S.A.; Ahmed, T.; Khushnood, R.A.; Ali, S.M.; Shahnawaz. A Predictive Mimicker of Fracture Behavior in Fiber Reinforced Concrete Using Machine Learning. Materials 2021, 14, 7669. [Google Scholar] [CrossRef]
- Lavercombe, A.; Huang, X.; Kaewunruen, S. Machine Learning Application to Eco-Friendly Concrete Design for Decarbonisation. Sustainability 2021, 13, 13663. [Google Scholar] [CrossRef]
- Nafees, A.; Javed, M.F.; Khan, S.; Nazir, K.; Farooq, F.; Aslam, F.; Musarat, M.A.; Vatin, N.I. Predictive Modeling of Mechanical Properties of Silica Fume-Based Green Concrete Using Artificial Intelligence Approaches: MLPNN, ANFIS, and GEP. Materials 2021, 14, 7531. [Google Scholar] [CrossRef] [PubMed]


| Ref. Number | Object of Study | Predictable Characteristics | Prediction Method |
|---|---|---|---|
| [15] | Geopolymer concrete based on fly ash | Compressive strength, flexural tensile strength | Orthogonal experimental plan |
| [16] | Heavy concrete | Search for cracks on the surface of concrete | Convolutional neural network |
| [17] | Beams made of ultra-high-quality fiber-reinforced concrete | Shear strength | Artificial neural network, support vector regression, extreme gradient boosting |
| [18] | Geopolymer concrete | Water absorption, water permeability, density | Artificial neural network |
| [19] | Concrete with the addition of metakaolin as a partial replacement for cement | Compressive strength, tensile strength, flexural tensile strength | Gene expression programming, artificial neural network, M5P model tree algorithm, random forest |
| [20] | Heavy concrete | Compressive strength | M5P model tree algorithm |
| [21,22] | Heavy concrete with secondary aggregate | Elastic modulus, compressive strength | Model tree algorithm M5, artificial neural network |
| [23] | Concrete containing rice husk ash and reclaimed asphalt pavement as a partial replacement for Portland cement and primary aggregates, respectively | Compressive strength | Artificial neural network |
| [24] | Concrete with partial or complete replacement of natural aggregate with waste rubber | Compressive strength | Artificial neural network |
| [25] | Self-compacting concrete with recycled aggregate | Compressive strength | Artificial neural network algorithm: Levenberg–Marquardt, Bayesian regularization, scaled conjugate gradient back-propagation |
| [2,26] | Self-compacting concrete with fly ash | Compressive strength | Nonlinear dependency model, multiregression model, artificial neural network |
| [27] | Self-compacting concrete with recycled aggregates | Compressive strength | Ensemble methods: random forest, k-nearest neighbors, extremely randomized trees, extreme gradient boosting, gradient boosting, light gradient boosting machine |
| [28] | Double-wall tubular columns with metal and nonmetal composite materials | Axial compressive strength | Random forest regression, XGBoost regression, AdaBoost regression, lasso regression, ridge regression, ANN regression |
| [29] | Geopolymer concrete | Compressive strength, flexural tensile strength | Artificial neural network based on GDX (adaptive LR with gradient descent) |
| [30] | Fresh concrete mix | Plastic viscosity, yield strength | Artificial neural network, random forest |
| [31] | Round bounded concrete columns | Compressive strength | Multiphysics programming of genetic expressions |
| [32] | Reinforced concrete beams with collars | Shear strength | Artificial neural network |
| [33] | Self-compacting geopolymer concrete | Plastic viscosity, compressive strength | Hybrid artificial neural network combined with bat. |
| [34] | Ash concrete from rice husks | Compressive strength | Artificial neural network, artificial neurofuzzy inference system |
| [35] | Environmentally friendly concrete containing coal waste | Flexural tensile strength | Hybrid artificial neural network combined with response surface methodology |
| [36] | Heavy concrete | Compressive strength | Artificial neural network RBF |
| [37,38,39] | Recycled concrete | Compressive strength | Artificial neural network, gene expression programming |
| [40] | Concrete based on ceramic waste | Mobility, compressive strength, density | Artificial neural network, decision tree |
| [12] | Concrete modified with eggshell powder | Compressive strength | Artificial neural network combined with ANL-SFL metaheuristic optimization algorithm |
| [13] | Geopolymer concrete based on fly ash with high calcium content | Compressive strength | Artificial neural network, boosting and AdaBoost ML |
| [41] | Concrete reinforced with carbon nanotubes/carbon nanofibers | Compressive strength, flexural tensile strength | Artificial neural network |
| [42] | Concrete curing in hot weather | Pulse velocity, compressive strength, depth of water penetration, split tensile strength | Artificial neural network, finite regression model |
| [43] | Self-compacting rubberized concrete | Compressive strength | Multilayered perceptron artificial neural network (MLP-ANN), ensembles of MLP-ANNs, regression tree ensembles (random forests, boosted and bagged regression trees), support vector regression and Gaussian process regression |
| [44] | Concrete at high temperatures | Compressive strength | Decision tree, artificial neural network, bagging, gradient boosting |
| Variable | Cement | Slag | Water | Sand | Crushed Stone | Additive | Compressive Strength |
|---|---|---|---|---|---|---|---|
| Unit | kg/m3 | kg/m3 | liter | kg/m3 | kg/m3 | kg | MPa |
| count | 249.00 | 249.00 | 249.00 | 249.00 | 249.00 | 249.00 | 249.00 |
| mean | 198.04 | 140.32 | 171.49 | 1027.04 | 805.36 | 4.26 | 38.79 |
| std | 42.27 | 99.57 | 10.47 | 126.76 | 104.96 | 2.16 | 21.87 |
| min | 150.00 | 47.00 | 150.00 | 790.00 | 715.00 | 2.31 | 9.60 |
| max | 286.00 | 309.00 | 186.00 | 1143.00 | 987.00 | 8.30 | 85.80 |
| Depth = 4 | Depth = 6 | Depth = 8 | Depth = 10 | |
|---|---|---|---|---|
| learning rate = 0.03 | model (depth = 4, learning rate = 0.03) | model (depth = 6, learning rate = 0.03) | model (depth = 8, learning rate = 0.03) | model (depth = 10, learning rate = 0.03) |
| learning rate = 0.1 | model (depth = 4, learning rate = 0.1) | model (depth = 6, learning rate = 0.1) | model (depth = 8, learning rate = 0.1) | model (depth = 10, learning rate = 0.1) |
| learning rate = 0.5 | model (depth = 4, learning rate = 0.5) | model (depth = 6, learning rate = 0.5) | model (depth = 8, learning rate = 0.5) | model (depth = 10, learning rate = 0.5) |
| Num | Parameter | Value |
|---|---|---|
| 1 | Number of neighbors | 2, 5, 7, 10, 15, 20 |
| 2 | Sheet size | 1, 3, 5, 10, 20 |
| 3 | weight function | ”uniform” ”distance” |
| Num | Parameter | Value |
|---|---|---|
| 1 | Kernel type | ”linear” ”poly” ”rbf” ”sigmoid” |
| 2 | Regularization parameter C | 1, 2, 3, 4, 5 |
| 3 | Epsilon | 0.1, 0.2, 0.5, 1, 1.5, 2, 3 |
| Num | Parameter | Value | Optional Description |
|---|---|---|---|
| 1 | Number of iterations | 500 | Number of decision trees |
| 2 | Tree depth | 8 | Tree structure depth |
| 3 | Learning rate | 0.1 | A parameter that determines the step size at each iteration when moving toward the minimum of the loss function |
| 4 | Metric used for learning | RMSE | Formula (4) |
| 5 | Greedy search algorithm | Symmetric tree | The tree is built level by level until it reaches the required depth |
| 6 | Type of overfitting detector | Early stopping | Stops training when the error value does not decrease within 30 iterations |
| Num | Parameter | Value |
|---|---|---|
| 1 | Number of neighbors | 15 |
| 2 | Sheet size | 5 |
| 3 | Weight function | ”uniform” |
| Num | Parameter | Value |
|---|---|---|
| 1 | Kernel type | ”rbf” |
| 2 | Regularization parameter C | 5 |
| 3 | Epsilon | 0.5 |
| Number of Cores Involved | CPU Times, s | Wall Time, s |
|---|---|---|
| 1 | 16 | 31.6 |
| 2 | 2.06 | 22.6 |
| 4 | 1.73 | 15.2 |
| 8 | 1.1 | 10.0 |
| Number of Cores Involved | CPU Times, s | Wall Time, s |
|---|---|---|
| 1 | 8 | 11.1 |
| 2 | 2.06 | 10.2 |
| 4 | 0.72 | 7.2 |
| 8 | 0.4 | 3.0 |
| Number of Cores Involved | CPU Times, s | Wall Time, s |
|---|---|---|
| 1 | 9 | 12.4 |
| 2 | 2.18 | 9.4 |
| 4 | 0.75 | 6.1 |
| 8 | 0.6 | 3.0 |
| № | Model | MAE | MSE | RMSE | MAPE, % | R2 |
|---|---|---|---|---|---|---|
| 1 | CatBoost (CB) | 2.17 | 7.8 | 2.79 | 6.84 | 0.98 |
| 2 | K-nearest neighbors (KNN) | 1.97 | 6.85 | 2.62 | 6.15 | 0.99 |
| 3 | SVR | 2.61 | 11.39 | 3.37 | 7.89 | 0.98 |
Publisher’s Note: MDPI stays neutral with regard to jurisdictional claims in published maps and institutional affiliations. |
© 2022 by the authors. Licensee MDPI, Basel, Switzerland. This article is an open access article distributed under the terms and conditions of the Creative Commons Attribution (CC BY) license (https://creativecommons.org/licenses/by/4.0/).
Share and Cite
Beskopylny, A.N.; Stel’makh, S.A.; Shcherban’, E.M.; Mailyan, L.R.; Meskhi, B.; Razveeva, I.; Chernil’nik, A.; Beskopylny, N. Concrete Strength Prediction Using Machine Learning Methods CatBoost, k-Nearest Neighbors, Support Vector Regression. Appl. Sci. 2022, 12, 10864. https://doi.org/10.3390/app122110864
Beskopylny AN, Stel’makh SA, Shcherban’ EM, Mailyan LR, Meskhi B, Razveeva I, Chernil’nik A, Beskopylny N. Concrete Strength Prediction Using Machine Learning Methods CatBoost, k-Nearest Neighbors, Support Vector Regression. Applied Sciences. 2022; 12(21):10864. https://doi.org/10.3390/app122110864
Chicago/Turabian StyleBeskopylny, Alexey N., Sergey A. Stel’makh, Evgenii M. Shcherban’, Levon R. Mailyan, Besarion Meskhi, Irina Razveeva, Andrei Chernil’nik, and Nikita Beskopylny. 2022. "Concrete Strength Prediction Using Machine Learning Methods CatBoost, k-Nearest Neighbors, Support Vector Regression" Applied Sciences 12, no. 21: 10864. https://doi.org/10.3390/app122110864