1. Introduction
High liquid limit soil [
1] refers to fine-grained soil with a liquid limit greater than 50% and a plasticity index greater than 26, which is widely distributed in areas with abundant rainfall and lakes. Because of high water content and low strength, the high liquid limit soil cannot be directly used in roadbed filling [
2] and may lead to serious problems such as roadbed cracking, uneven settlement, and slope instability [
3]. Koerner et al. [
4] suggested that slope instability under rainfall may be attributed to reduced shear strength in the soil and the interface of reinforcement steel. Rainfall will reduce the shear strength of soil, raise the groundwater level, and increase the pore water pressure. In addition, the transient saturation zones induced by prolonged and intense rainfall will appear in areas above the stable groundwater level. Meanwhile, the pore water pressure in the corresponding area will increase.
Rainfall infiltration promotes fracture propagation, leads to fracture intersection and formation of permeability zone, accelerates the process of rock and soil softening, and further reduces the safety factor of the slope [
5]. The effect of soil density on the stability of slopes under rainfall was studied by Chatra et al. [
6]. The effect of rainfall on the stability of multi-layer unsaturated soil slope had been studied [
7]. Based on the rainfall data of the Three Gorges Reservoir area, Tang et al. [
8] incorporated the initial conditions of pore water pressure distribution into the slope stability analysis. The dynamic characteristics of the loess slope under artificial rainfall were studied by the model test, considering the intensity and duration of rainfall on the slope stability [
9]. By analyzing the characteristics of the saturated zone of the soil slope and the influence of water characteristic parameters on the slope stability, a landslide prediction model was proposed based on the critical curve of the shallow saturated zone and a one-dimensional model [
10]. The effects of rainfall intensity and hydraulic characteristics on slope stability were studied through the strength reduction method and finite element seepage method [
11,
12,
13]. But the impact of the existence of anti-slide piles was ignored. Continuous rainfall was an important factor resulting in landslides because the rainfall infiltration increased the water pressure in the steep tension cracks and promoted the expansion of the sliding surface [
14,
15]. The slope instability influenced by rainfall was caused by the complex interaction of the topographic, hydrological, and geological conditions of the slope [
16]. It was very important to evaluate the controlling factors, such as slope angle, initial water content, soil properties, rainfall intensity, and intermittent rainfall, to determine the slope stability [
17]. A large number of landslide cases show that the instability of the slope is highly consistent with rainfall time and rainfall frequency [
18]. Due to the structural surface complexity specified by the steepness of the slope and its direction, Skrypnyk et al. [
19] defined that the geometric slope index requires additional correction of the potential evaporation determined by the slope of different directions and dips. The flooding of the remaining gaps could cause loss of slope stability during and after the flooding process [
20].
Although the rainfall intensity and time were two important factors affecting slope stability of shallow landslides, shallow landslides occur in the transient saturation zone of sandstone slope. The depth of the sliding surface was independent of the type and duration of rainfall [
21]. The stability of soil slope with low permeability coefficient was mainly affected by rainfall within 5 days, while the instability of soil slope with high permeability coefficient was mainly affected by the maximum rainfall of the day [
22]. However, some scholars held the opposite view, thinking that the instability of the slope was mainly affected by the shear strength parameter (
c,
φ), that is, if the strength of the soil is low, the instability threshold is low [
23,
24]. In order to reduce the infiltration of rainwater, a capillary barrier system (CBSS) was proposed to prevent slope instability, but it is not widely applicable [
25]. With the same rainfall intensity and rainfall duration, the delayed rainfall model was more harmful to the slope stability [
26]. Duan et al. [
27] suggested that high rainfall intensity easily causes damage to the slope. After rainfall, the horizontal displacement gradually picked up, and the distribution range of plastic zone began to decrease.
To sum up, there is little research on the landslide mechanism and the cumulative displacement equation of the slope. In order to solve the further problem on the slope along the Guang-Le Expressway caused by rainfall, this paper studied the high liquid limit soil slope under different rainfall times and rainfall intensities through ABAQUS numerical simulation combined with in-site monitoring. The safety factor of high liquid limit soil slope with different rainfall times was analyzed using the strength reduction method, which shows the possibility of protecting the slope before instability. The specific mechanism and typical laws of rainfall-induced landslide instability of high liquid limit soil slopes were summarized.
2. Case Study
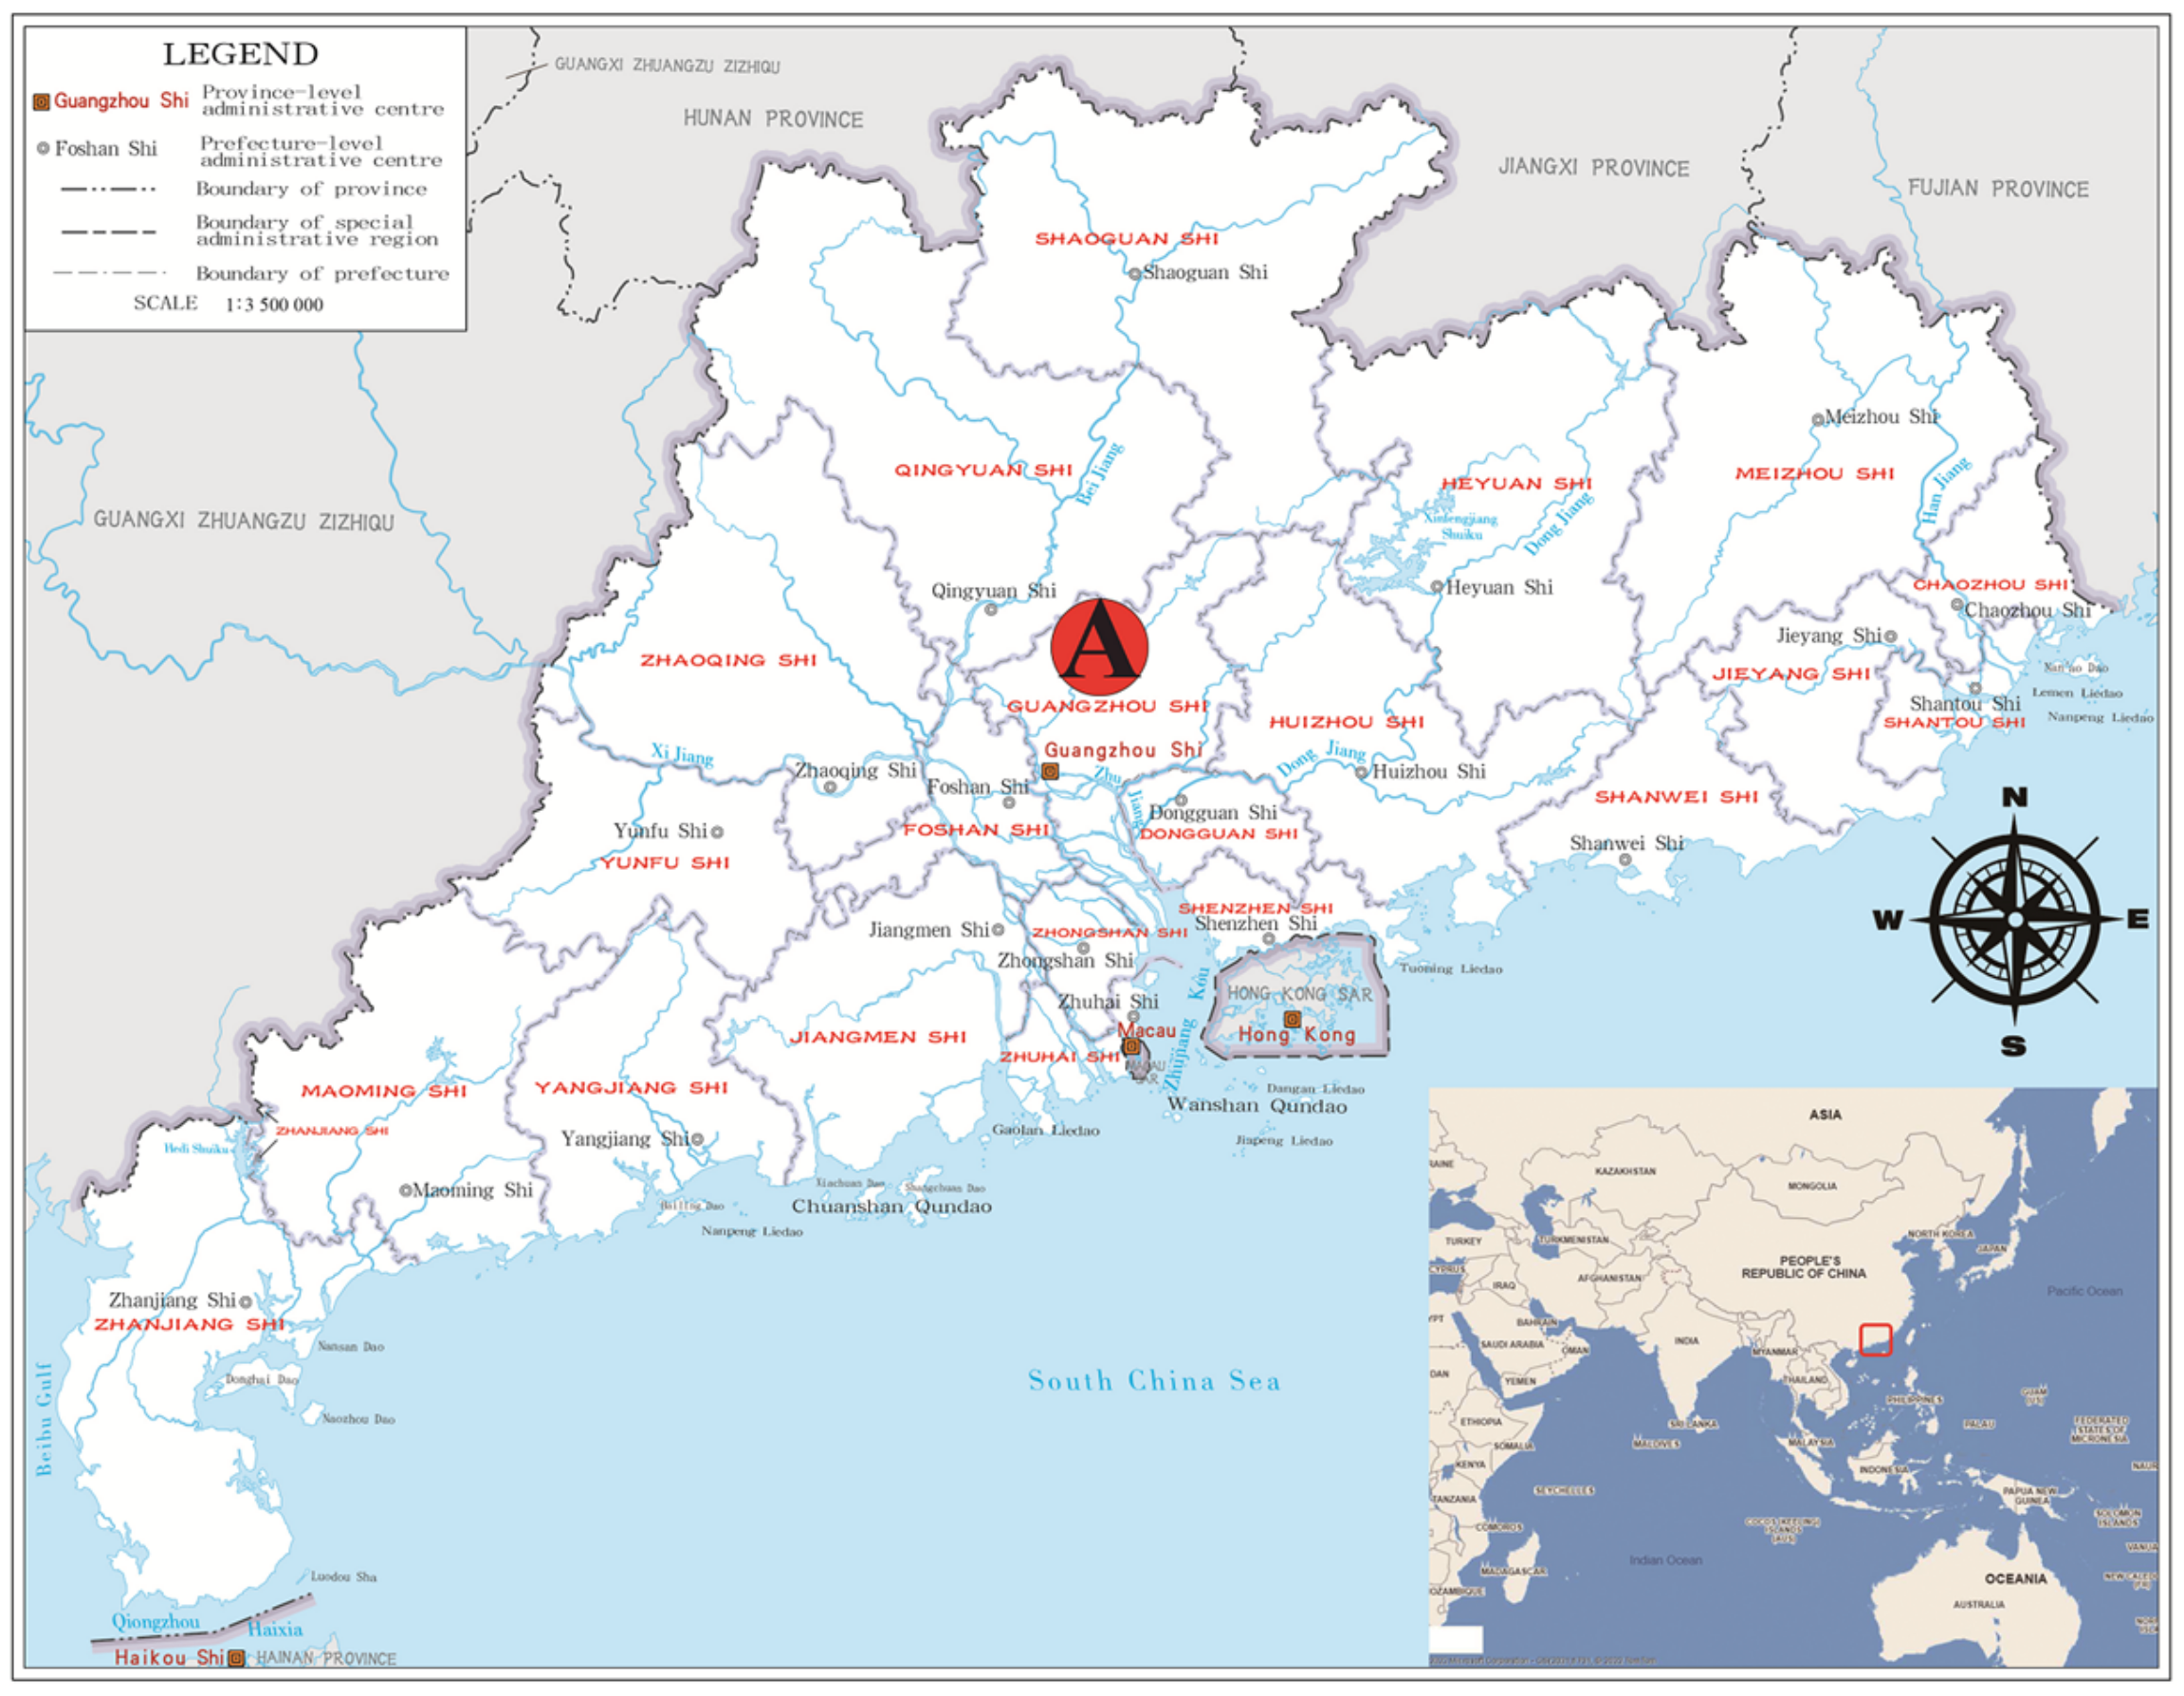
Guang-Le Expressway is located in the central part of Guangdong Province, China, marked A in
Figure 1. For the left side slope between K79 + 740~K80 + 080 of Guang-Le Expressway, the first slip occurred in February 2012, and the second slip occurred in September 2012 in the rainy season, which seriously affected the normal construction of the expressway.
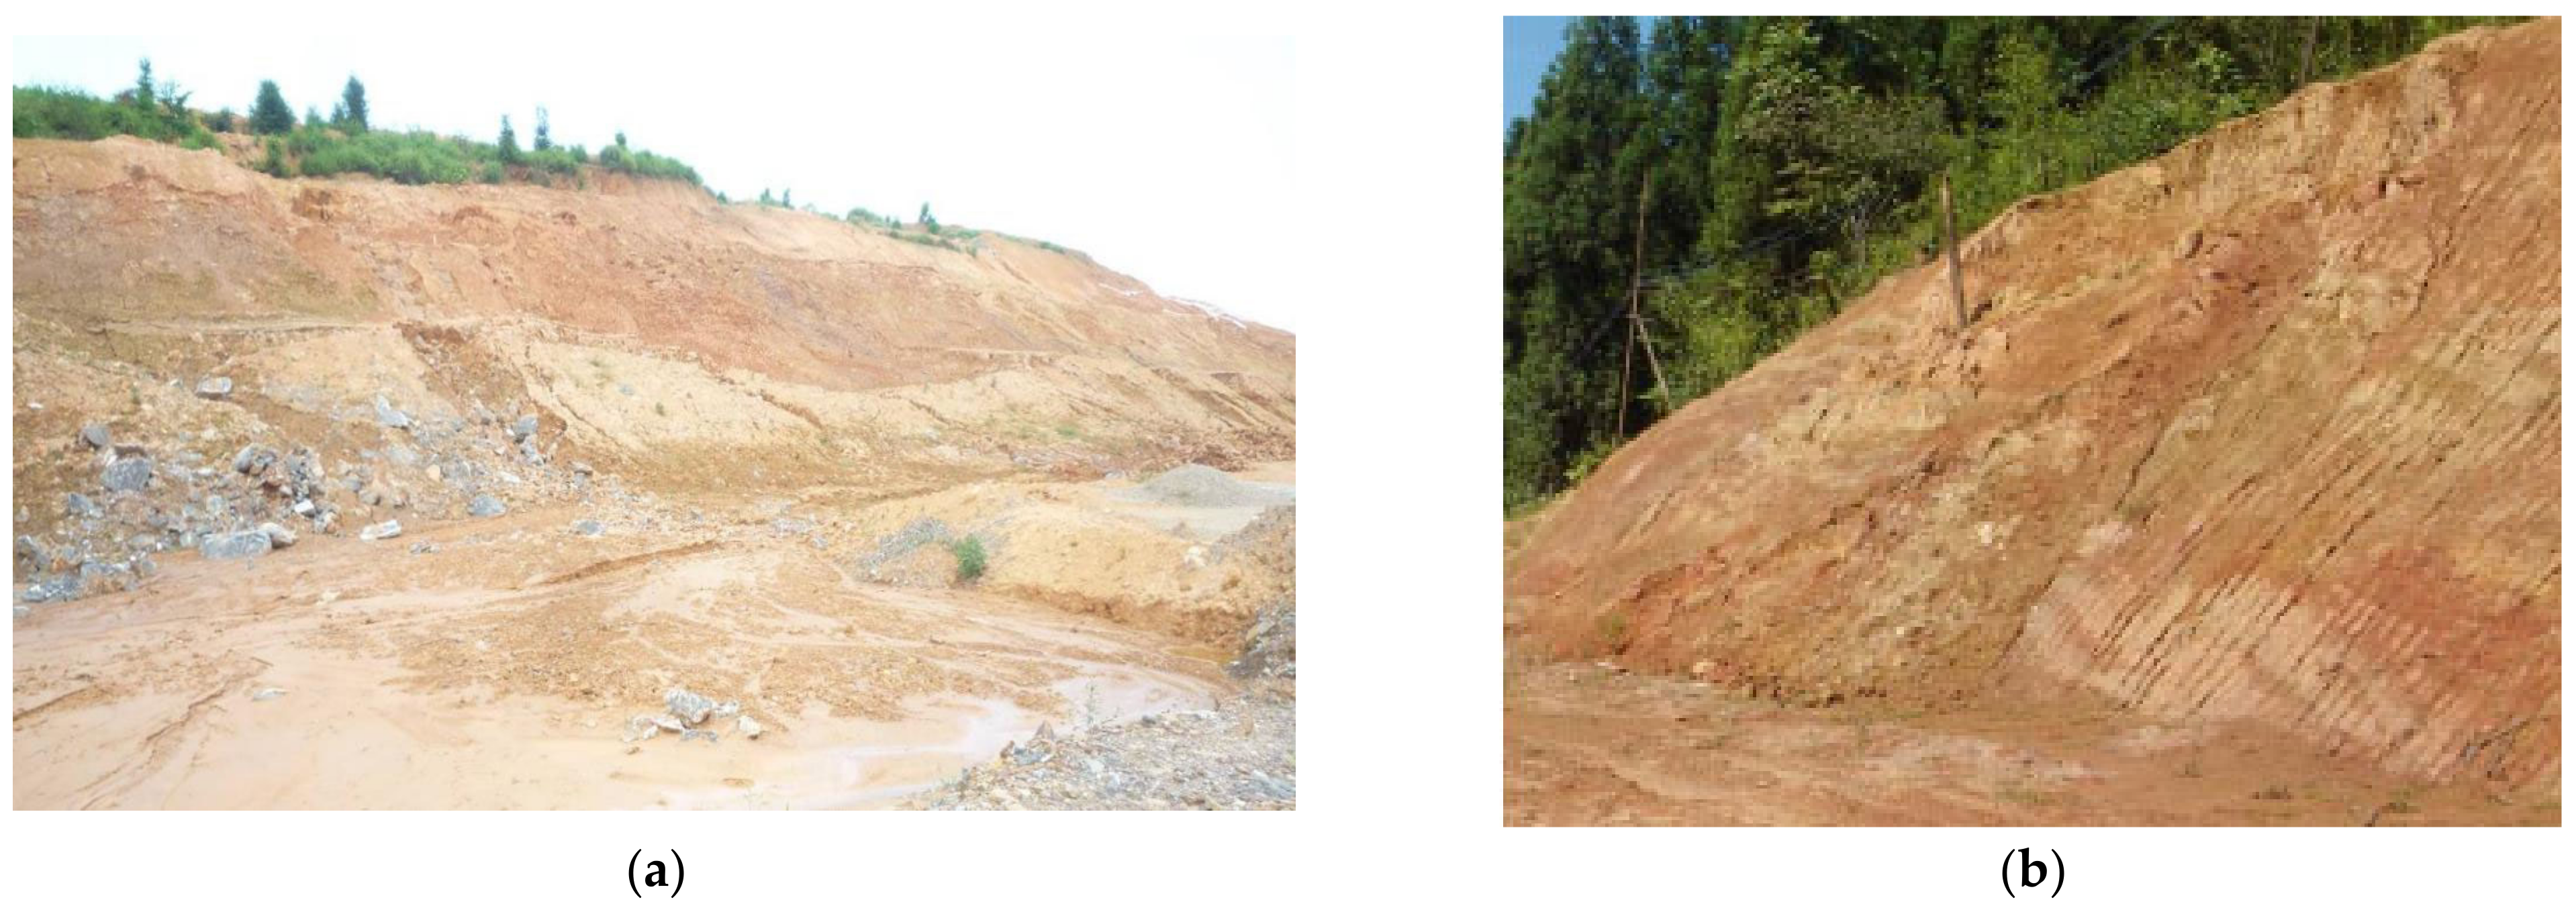
The slope was originally designed as a secondary slope, 10 m in the first grade, with a slope ratio of 1:1.25~1:1.5, and was protected by a supporting seepage ditch and grid grass planting, shown in
Figure 2.
Engineering Geological Characteristics
- (1)
Topography: this slope is located in the low mountain and hilly landform area, and the overall topography is high in the east and low in the west.
- (2)
Geological formations: no large fault structure was found in this section.
- (3)
Hydrogeology: there is no surface water body in the cutting, and the groundwater is mainly loose layer pore water, which occurs at the foot of the slope. Due to the loose structure of the high liquid limit soil, the pores are well connected, so the water permeability is good. Therefore, after infiltration of groundwater, it accumulates at the foot of the subgrade slope, causing the soil to soften, further reducing the shear strength of the rock and soil mass on the slope.
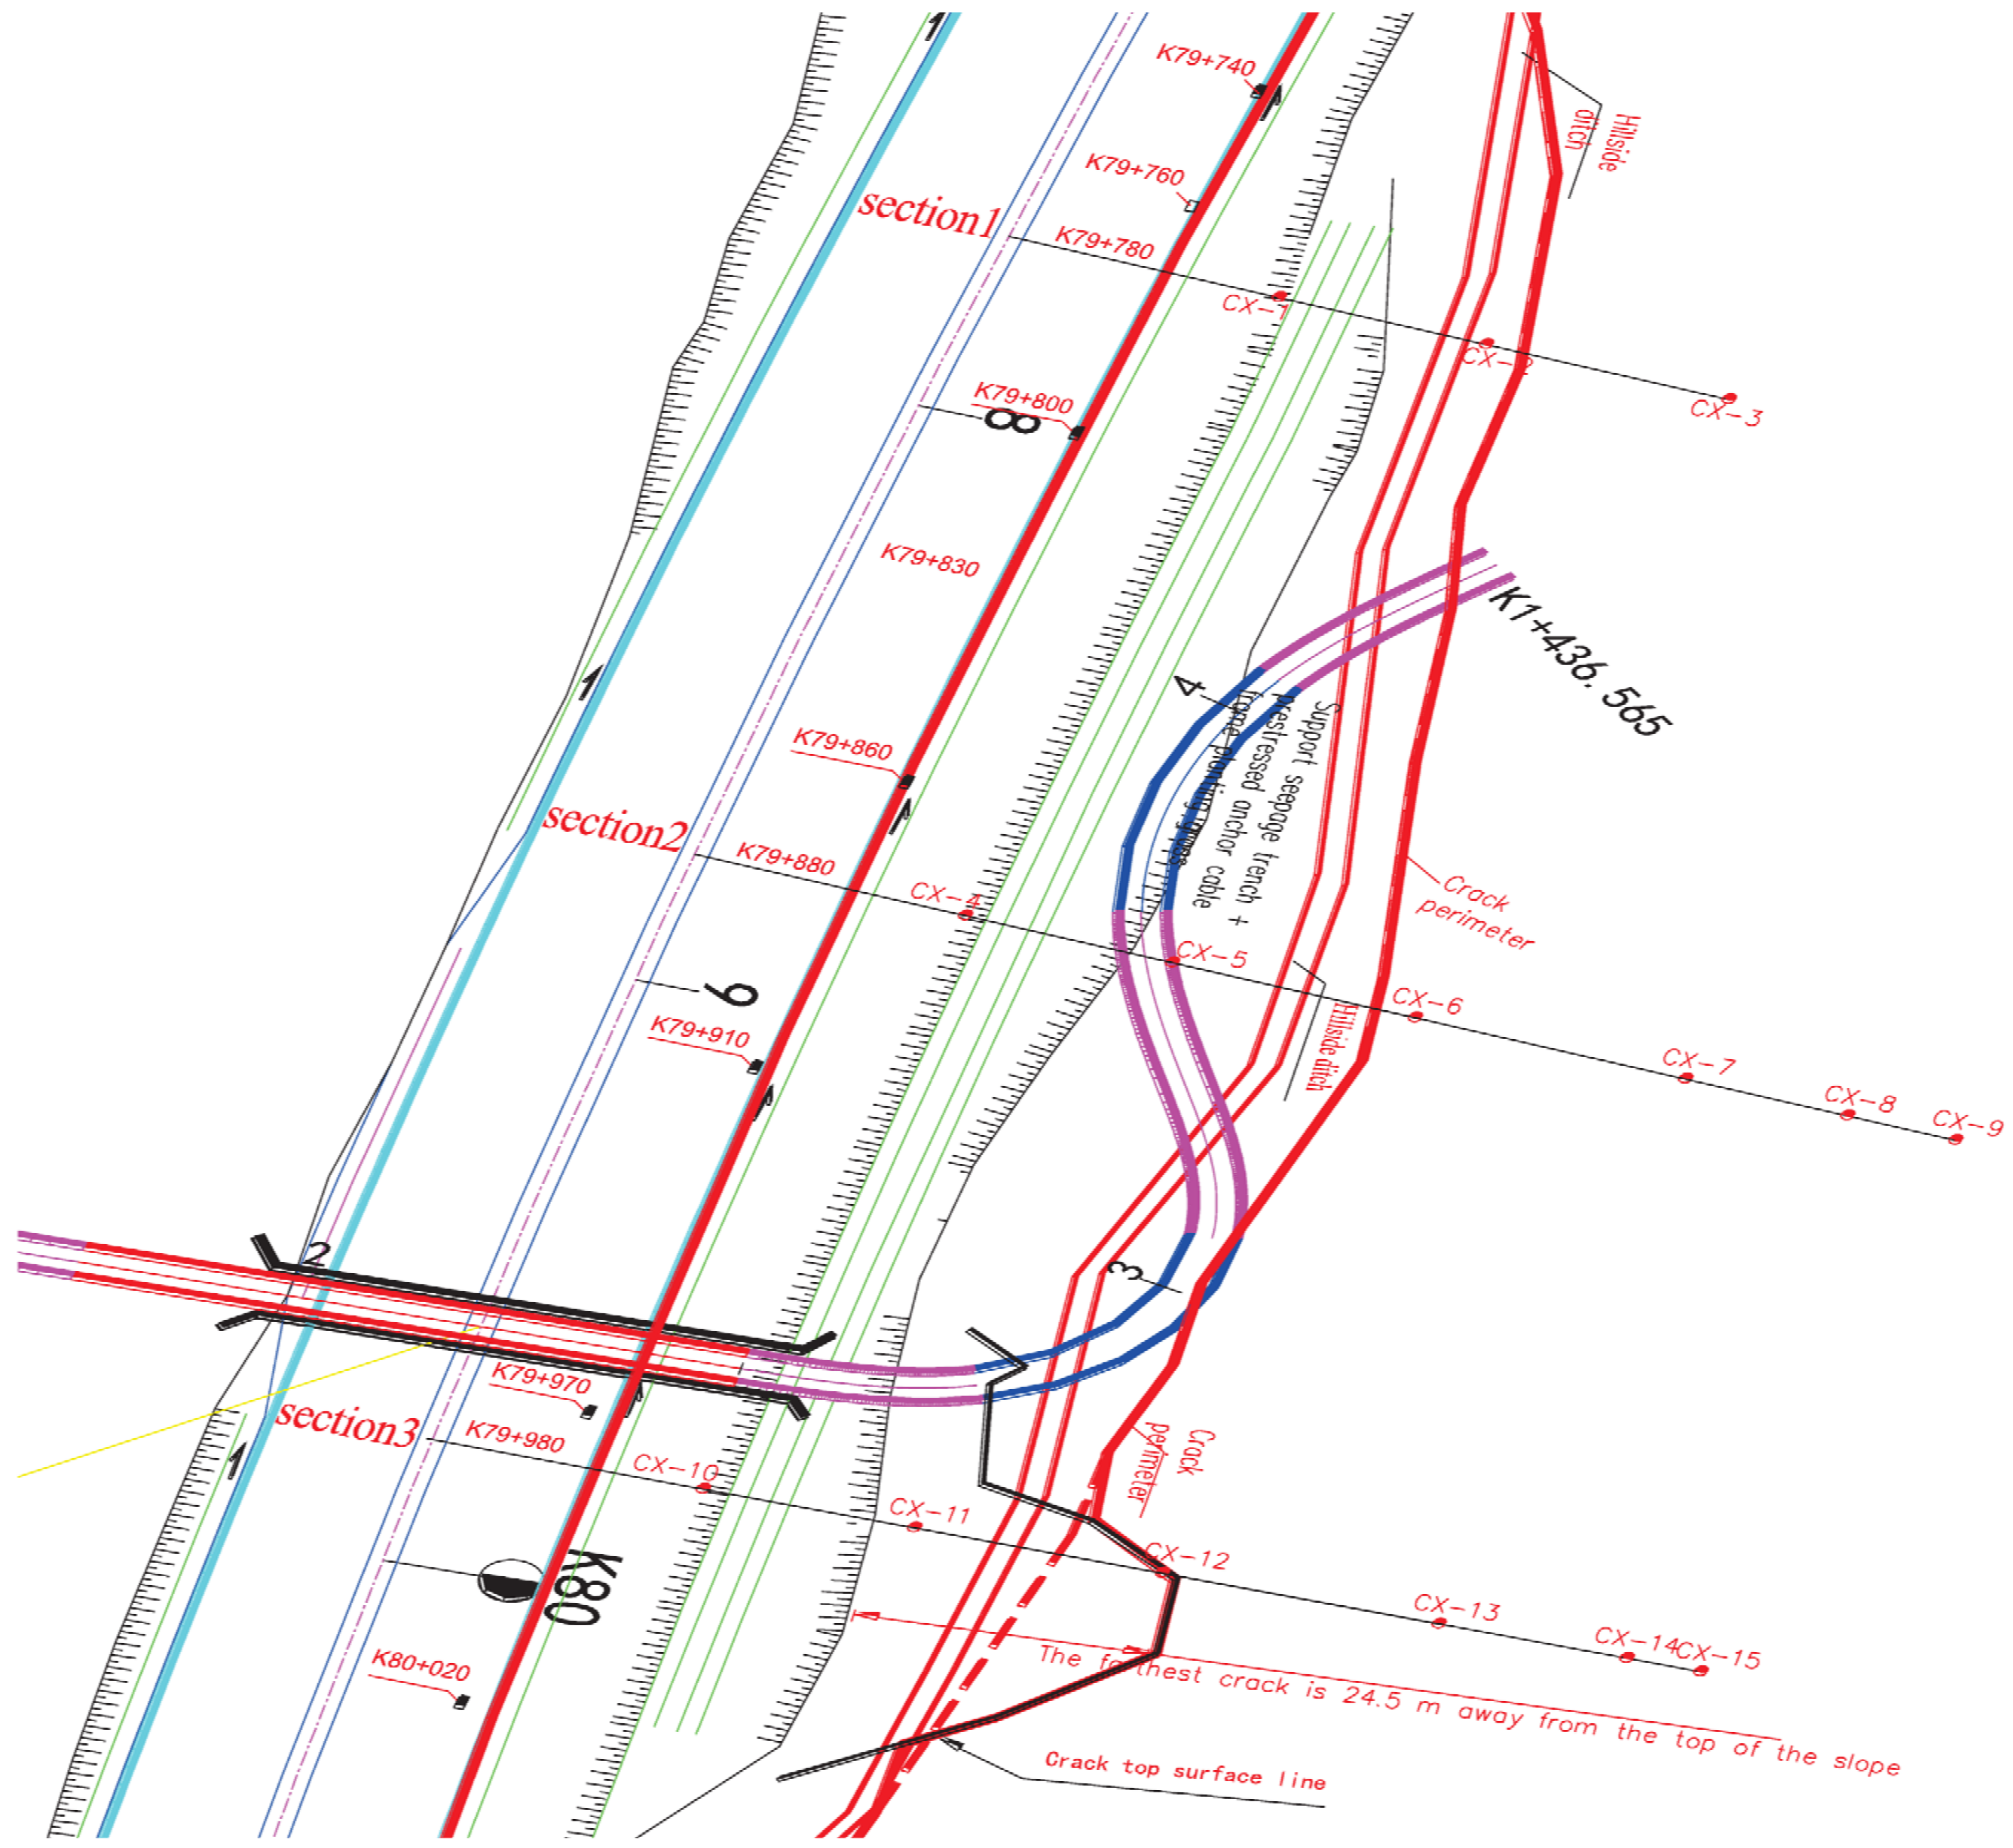
Figure 3 illustrates the layout plan of the slope measuring points on the left side for K79 + 740~K80 + 080. The deep displacement monitoring is mainly based on the K79 + 880 section. CX-4~CX-7 are inclined to measure holes to observe the deep displacement. Due to repeated continuous rainfall, the CX-4 hole for K79 + 880 section is buried. The inclination hole can measure the displacement in two mutually perpendicular directions. When the instrument measures, the A direction is set as the vertical line direction (that is, the slope is most likely to slide), and the B direction as the line direction.
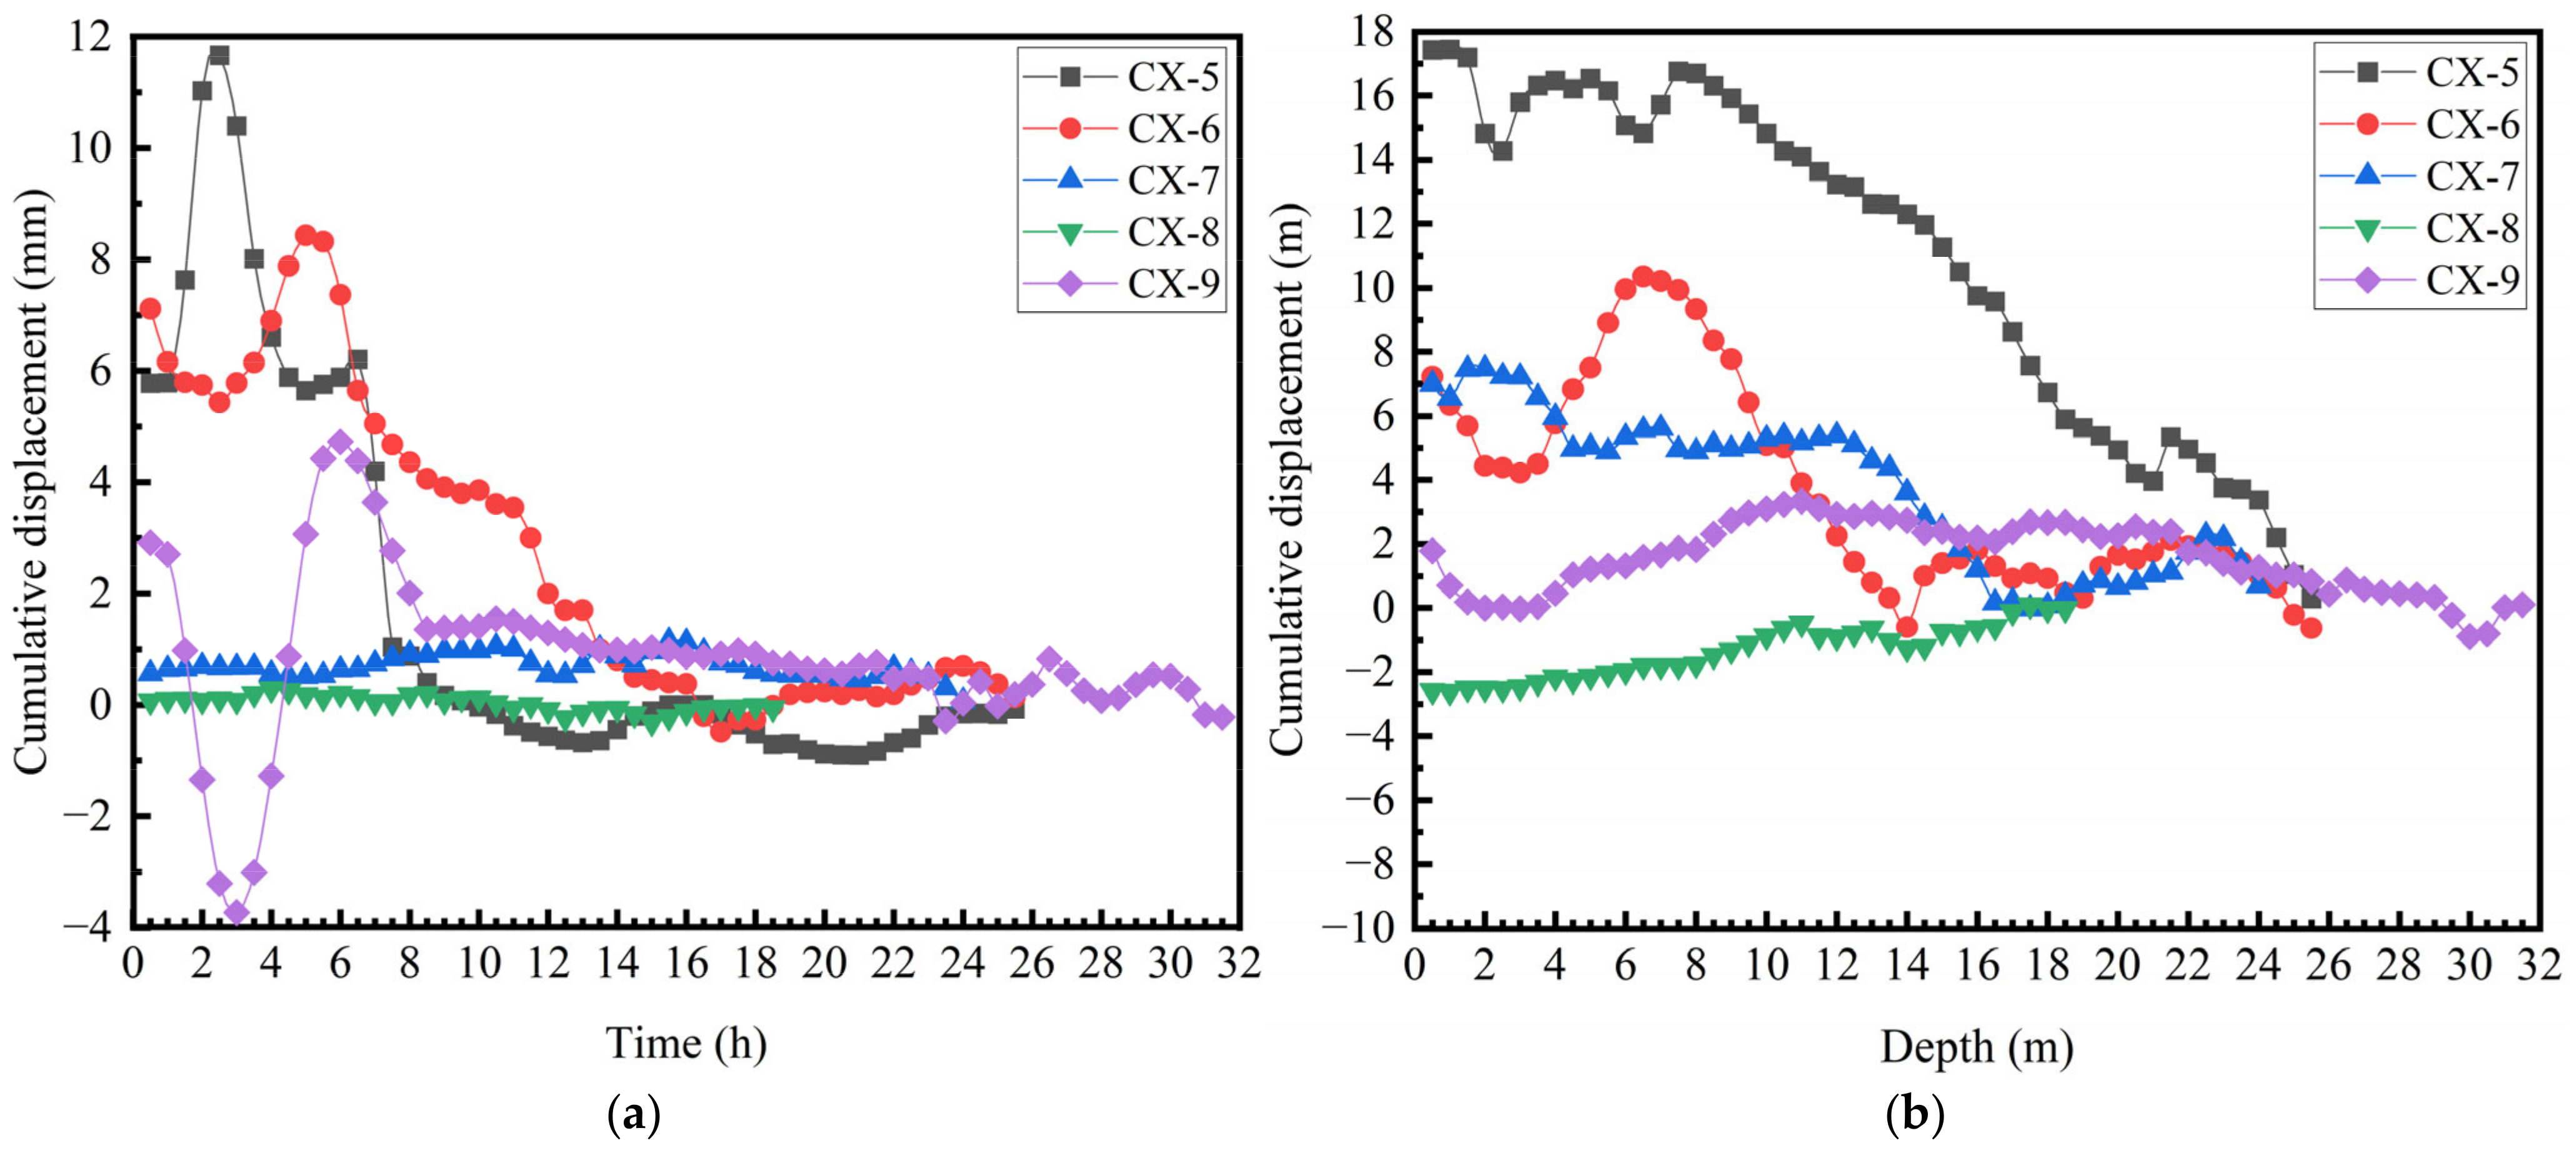
Figure 4 illustrates the variations of cumulative displacement with depth for cross-section K79 + 880 in A and B directions. For the K79 + 880 section, the measured shallow slip surface is at 9 m in the CX-5 hole, the deep slip surface is at 18.5 m in the CX-6 hole, and the maximum displacement is 11 mm. The displacement and sliding deformation of CX-5 and CX-6 were mainly concentrated in May 2013. The deformation of CX-6 is mainly concentrated in the first ten days of June, especially in the A direction. It can be seen that the landslide is a stacked tile-like traction type. The main reason for sliding is that the movement of the front sliding body causes the rear sliding body to lose its anti-slip segment and then slide due to traction. There is no obvious displacement in the A direction of the CX-7 hole, but there is an obvious sliding trend in the B direction in May, indicating that the trailing edge of the aforementioned sliding surface should be in front of CX7, while CX7 is on another sliding body and is pulled by the aforementioned sliding body. The measurement data of the CX-8 hole fluctuated on May 30 but returned to the original value in June, and the displacement oscillated back and forth, which cannot be judged. The displacement of the CX-9 hole is similar to that of the CX-7 hole in the positive B direction.
3. Numerical Simulations
3.1. Rainfall Infiltration Theory of Unsaturated Soils
3.1.1. Unsaturated Soil Strength Theory
At present, there are two main types of unsaturated soil strength theories based on single stress variables and double stress variables. Bishop’s strength theory for unsaturated soil based on a single stress variable is classical. The formulation is given by:
where
is the effective stress;
is the net stress; and
,
is the total stress;
is gas phase pressure;
s is matrix suction;
is the Bishop parameter which varies from 0 for dry soil to 1 for saturated soil;
.
The advantage of this strength theory is that its formula is simple, and its essence is to use to determine the deformation and strength of unsaturated soil like saturated soil, which is easily mastered by engineers, and easy to implement and apply in existing finite element programs. But there is also an obvious disadvantage, that is, the physical meaning is not clear and cannot be obtained through experiments. The Bishop parameter is similar to the definition of saturation, but it is found that there is no unique relationship between saturation and the effective stress parameter.
The strength theory based on a single stress variable is selected in the “Sorption” constitutive model of ABAQUS.
The effective stress parameter χ is simply taken as the value of saturation Sr owing to their similar definition. The gas phase pressure uα is 0. The constitutive model adopts effective stress, which reflects the influence of the matrix suction. From the perspective of engineering application, the research on the effective stress principle of a single stress variable and its engineering application is of practical significance.
3.1.2. Continuity Equation of Water Movement in Unsaturated Soil
The governing equations describing the flow of water in unsaturated soils generally use Richards’ differential equations [
28]. For the one-dimensional unsaturated soil water movement problem, the basic equation formed with the negative pressure head
h as the dependent variable is:
where
ρw is the water density;
g is the gravity acceleration;
is the slope of the relationship between soil water content
θ and substrate suction
S,
;
h is negative pressure head, that is matrix potential;
t is time;
K is the permeability coefficient;
z is the depth of the soil. Richards’ equation is the basic differential equation used to describe the movement of water in unsaturated soil, and it is also the seepage control equation of finite element software.
3.1.3. Rainfall Infiltration Theory
Many infiltration models based on Richards’ equation have been established. These models are in good agreement with the results of field soil water experiments to some extent. As early as the beginning of the 20th century, the G-A infiltration model [
29] assumed that there was a thin layer of water in the upper layer of the dry soil at the initial stage of infiltration, and that there was always an infiltration front, that is, the wetting front. In addition, it is assumed that there are only two regions in the infiltrated soil: the wet region with saturated water content and the initial water content region below the infiltration front. The basic formula is as follows:
where
zf is the wetting front depth;
sf is the soil matrix suction at the infiltration front;
H is the surface water depth;
s is the saturated water content;
i is the initial soil water content.
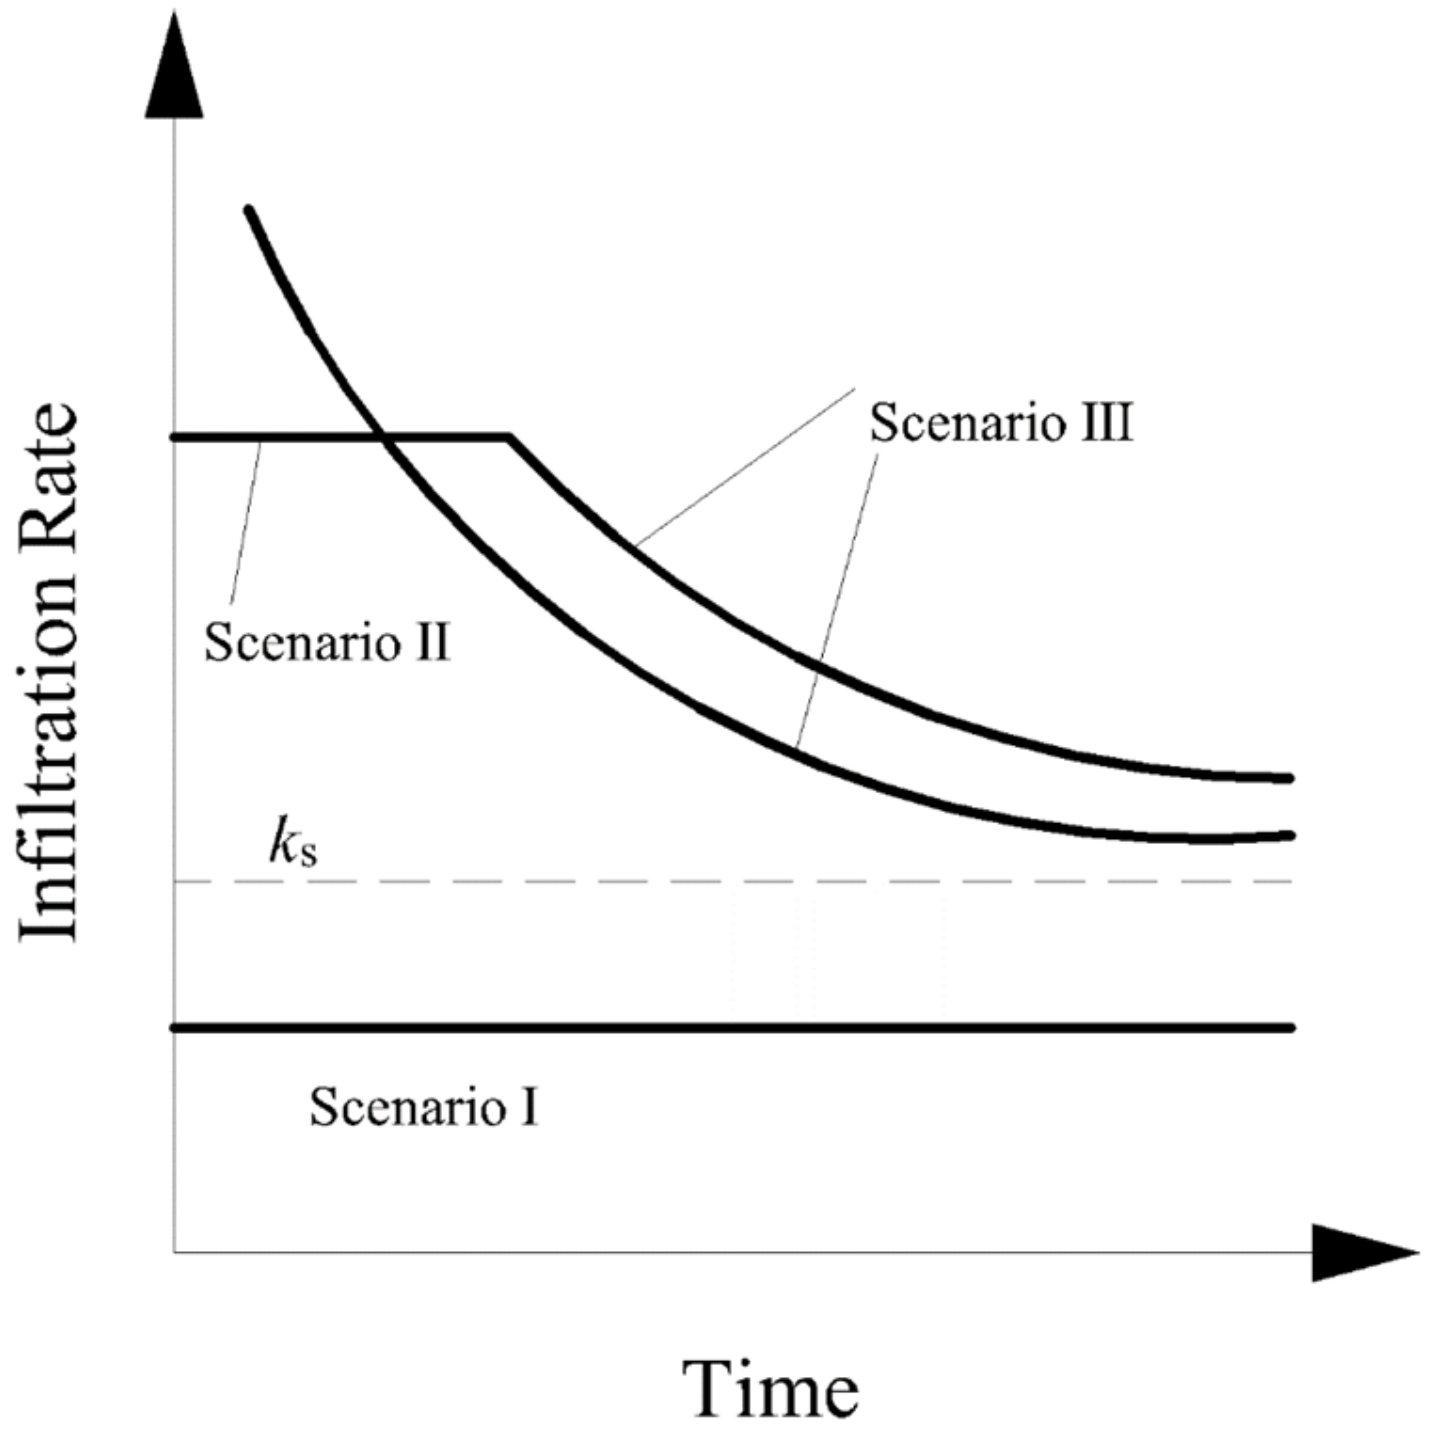
An improved model [
30] which applied the G-A model to rainfall scenarios believed that the allowable soil infiltration
fp was related to the rainfall intensity
I and the permeability coefficient
ks, which can be divided into three cases to discuss, shown in
Figure 5.
- (1)
I < ks: Surface runoff does not occur and all rainfall infiltrates.
- (2)
ks < I ≤ fp: For all rainfall infiltration, the soil saturation near the surface gradually increases over time, and after a certain time, the soil shifts to the Situation (3).
- (3)
I ≥ fp: Since the rainfall intensity is greater than the infiltration capacity of the soil, part of the rainfall does not infiltrate, resulting in surface runoff. At this time, the soil on the slope is basically in a saturated state. The infiltration rate gradually decreases after the rainfall reaches the infiltration capacity.
The influence of slope angle on infiltration and runoff under rainfall was studied by the G-A model [
31]. It is found that slope angle had a certain influence on the rainfall infiltration at the beginning of rainfall, and with the increase of rainfall time, the difference became smaller which can be ignored.
Based on the G-A model, the stability of slope under the rainfall condition was studied using the numerical simulation in this paper.
3.2. Model Establishing
3.2.1. Model Description
The numerical model is based on the engineering example at the K79 + 880 section of the left cutting slope of Guang-Le Expressway between K79 + 740 and K80 + 080, shown in
Figure 3. It is divided into three slopes. The first and second-grade slope height is 8 m, and the third-grade slope height is 11 m. The first, second, and third-grade slope rates are 1:1.15, 1:1.75, and 1:1.75, respectively.
3.2.2. Simplification and Hypothesis of the Model
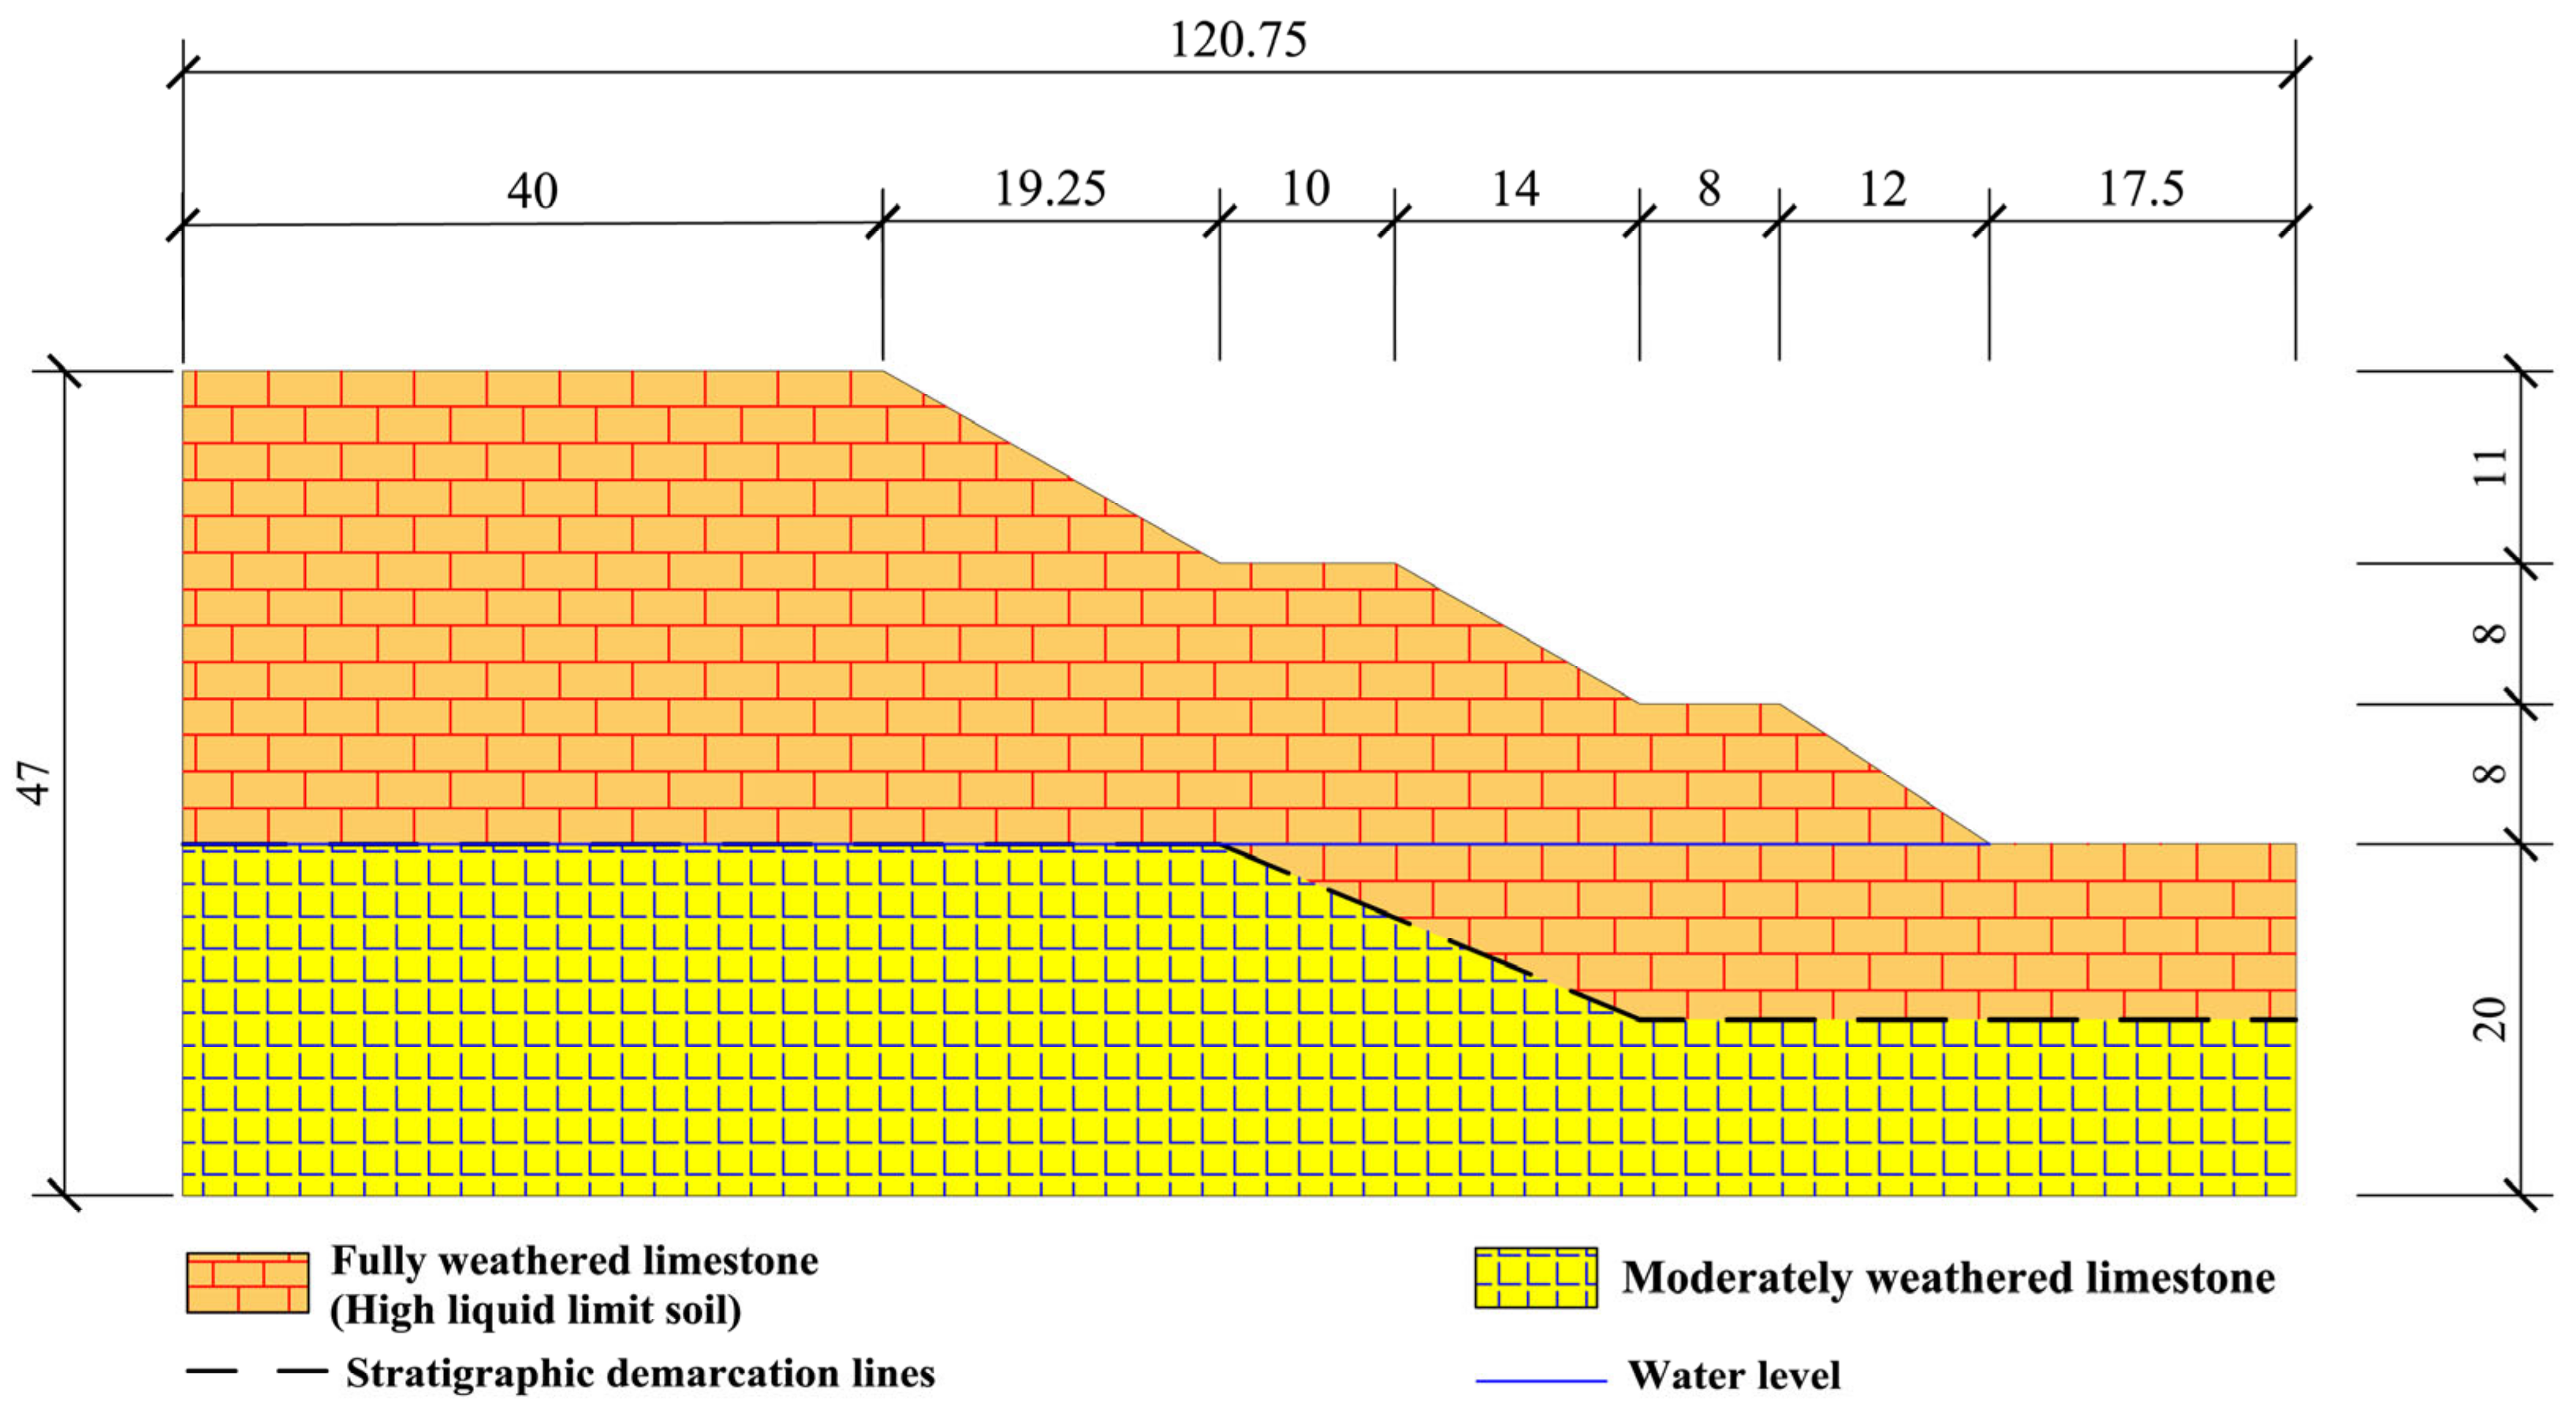
Due to the complex terrain of the high liquid limit soil slope, to simplify the calculation, the slope model was changed to a rock-soil dual structure slope for numerical simulation. The specific model scheme is shown in
Figure 6. Considering the pore pressure and fluid-solid interaction in this model, the elastic-plastic constitutive model is used for fully weathered rock which is high liquid limited soil. The elastic constitutive model is used for the medium-weathered limestone ignoring the plastic changes. Three-dimensional eight-node pore-pressure element C3D8P is used for all elements. The mesh model consists of 29,280 elements and 34,317 nodes. The measured water level line of the slope is an approximately horizontal and gently sloping curve, which is assumed to be a horizontal water level line in the numerical simulation, and the elevation is the same as the top surface of the roadbed. The bottom boundary of the model constrains the displacement in three directions, the left and right sides constrain the x and z axis displacement, and the front and rear sides only constrain the z axis displacement. In addition to displacement constraints, the pore-pressure boundary conditions need to be set. The spatial distribution function is used to set the hydrostatic pore pressure boundary linearly increasing with depth at the left and right sides of the X-axis, which is 10(20 − y) kPa, and the remaining boundaries are set as undrained boundaries at initial conditions.
The material parameters of the geotechnical layer for the numerical model are summarized in
Table 1.
Due to the particularity of the pore-pressure unit, it is difficult to balance the in situ stress of the slope. It is necessary to assume and improve the slope parameters first and then perform the field variable transformation. Before the rainfall infiltration analysis, the field variable of high liquid limit soil is set to 1, that is, a higher strength index is used. In addition, a series of initial conditions such as the initial stress distribution, the initial saturation distribution, and the initial pore pressure distribution need to be set. The setting of initial conditions is mainly input by Edit Keywords, and the porosity ratio, the initial pore pressure distribution and the initial in situ stress file are set for the slope material through Create Predefined Field to balance the in situ stress. The reduction coefficient parameters are summarized in
Table 2.
3.2.3. Selection of Penetration Parameters
- (1)
Hydraulic characteristic curve of unsaturated red clay.
The soil–water characteristic curve describes the functional relationship between soil saturation and matrix suction. Most mathematical models of soil-water characteristic curves [
32,
33] were established based on experience and soil structure characteristics.
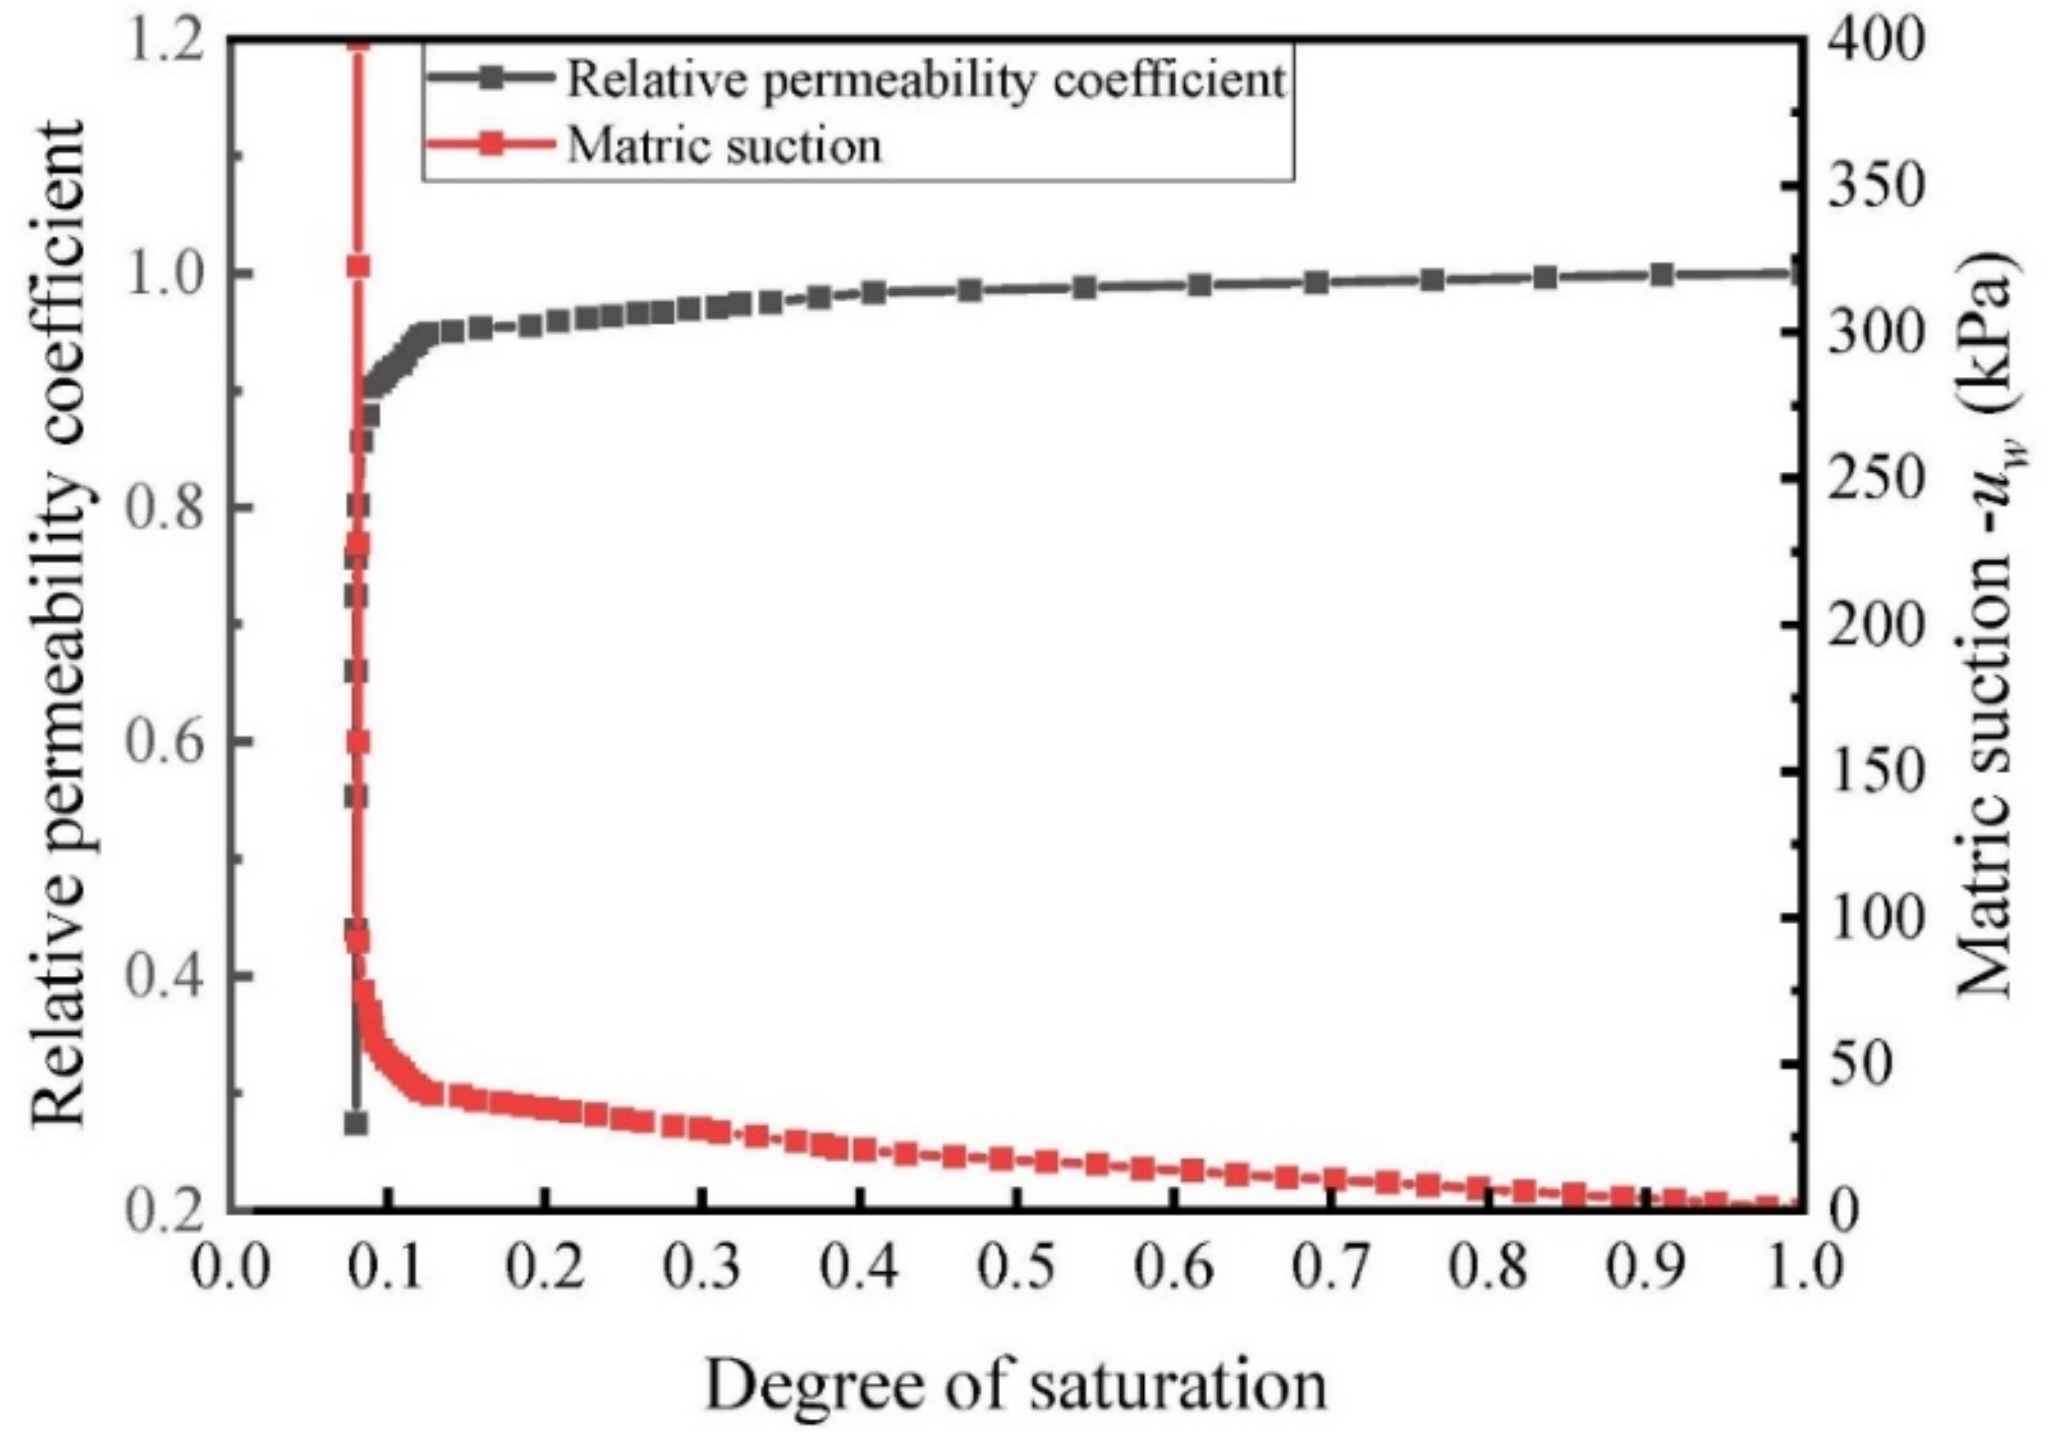
The permeability function describes the functional relationship between the permeability coefficient of unsaturated soil and the matrix suction or saturation. At present, the main methods to predict permeability function are the empirical formula and the statistical model. According to the data provided by our field measurement, the hydraulic characteristic curve of unsaturated red clay with a high liquid limit is shown in
Figure 7.
- (2)
Single factor grouping of numerical simulation.
According to the meteorological data of the location of the project, the rainfall in a hundred years is 9.78 mm/h, and the permeability coefficient of soil is 0.018 m/h, which belongs to the case (1) in
Figure 5. Because the influence of vertical cracks should be considered in the actual situation, the rainfall infiltration rate of the general high liquid limit soil slope is greater than its permeability coefficient owing to the existence of cracks. Therefore, the influence of seepage velocity and rainfall time on the high liquid limit soil slope is studied by numerical simulation. The main method of simulating rainfall infiltration is that the vertical infiltration velocity
v and rainfall duration
t is conducted on the slope surface and top of the slope, as summarized in
Table 3. The pore pressure boundary condition of the road surface is set to 0 because of the crown and drainage ditch.
To establish the slope model of unsaturated high liquid limit soil, the water–soil characteristic curve describing the relationship between the matrix suction and the saturation should be accurately selected, so as the permeability function describing the relationship between the permeability coefficient and the saturation. Before the modeling, the initial state of unsaturated soil needs to be established. The biggest difference between unsaturated soil and saturated soil is that the stress state of unsaturated soil under the action of matrix suction needs to be constructed based on saturated soil. For the water–soil characteristic curve and permeability function, the matrix suction is the independent variable of two kinds of functions. In ABAQUS, the pore pressure distribution curve needs to be set in advance, and the saturation and permeability coefficients are automatically fitted according to the pore pressure distribution curve.
3.3. Analysis of Numerical Simulation Results
3.3.1. In Situ Stress Balance before Rainfall
After in situ stress balance, the initial maximum vertical displacement of the whole slope is only 2.721 × 10⁻⁴ m, which can be ignored. To sum up, the ground stress balance is good.
3.3.2. Analysis of Safety Factors after Rainfall
When the horizontal position in the x direction suddenly changes, the slope reduces the failure, that is, the safety factor is achieved.
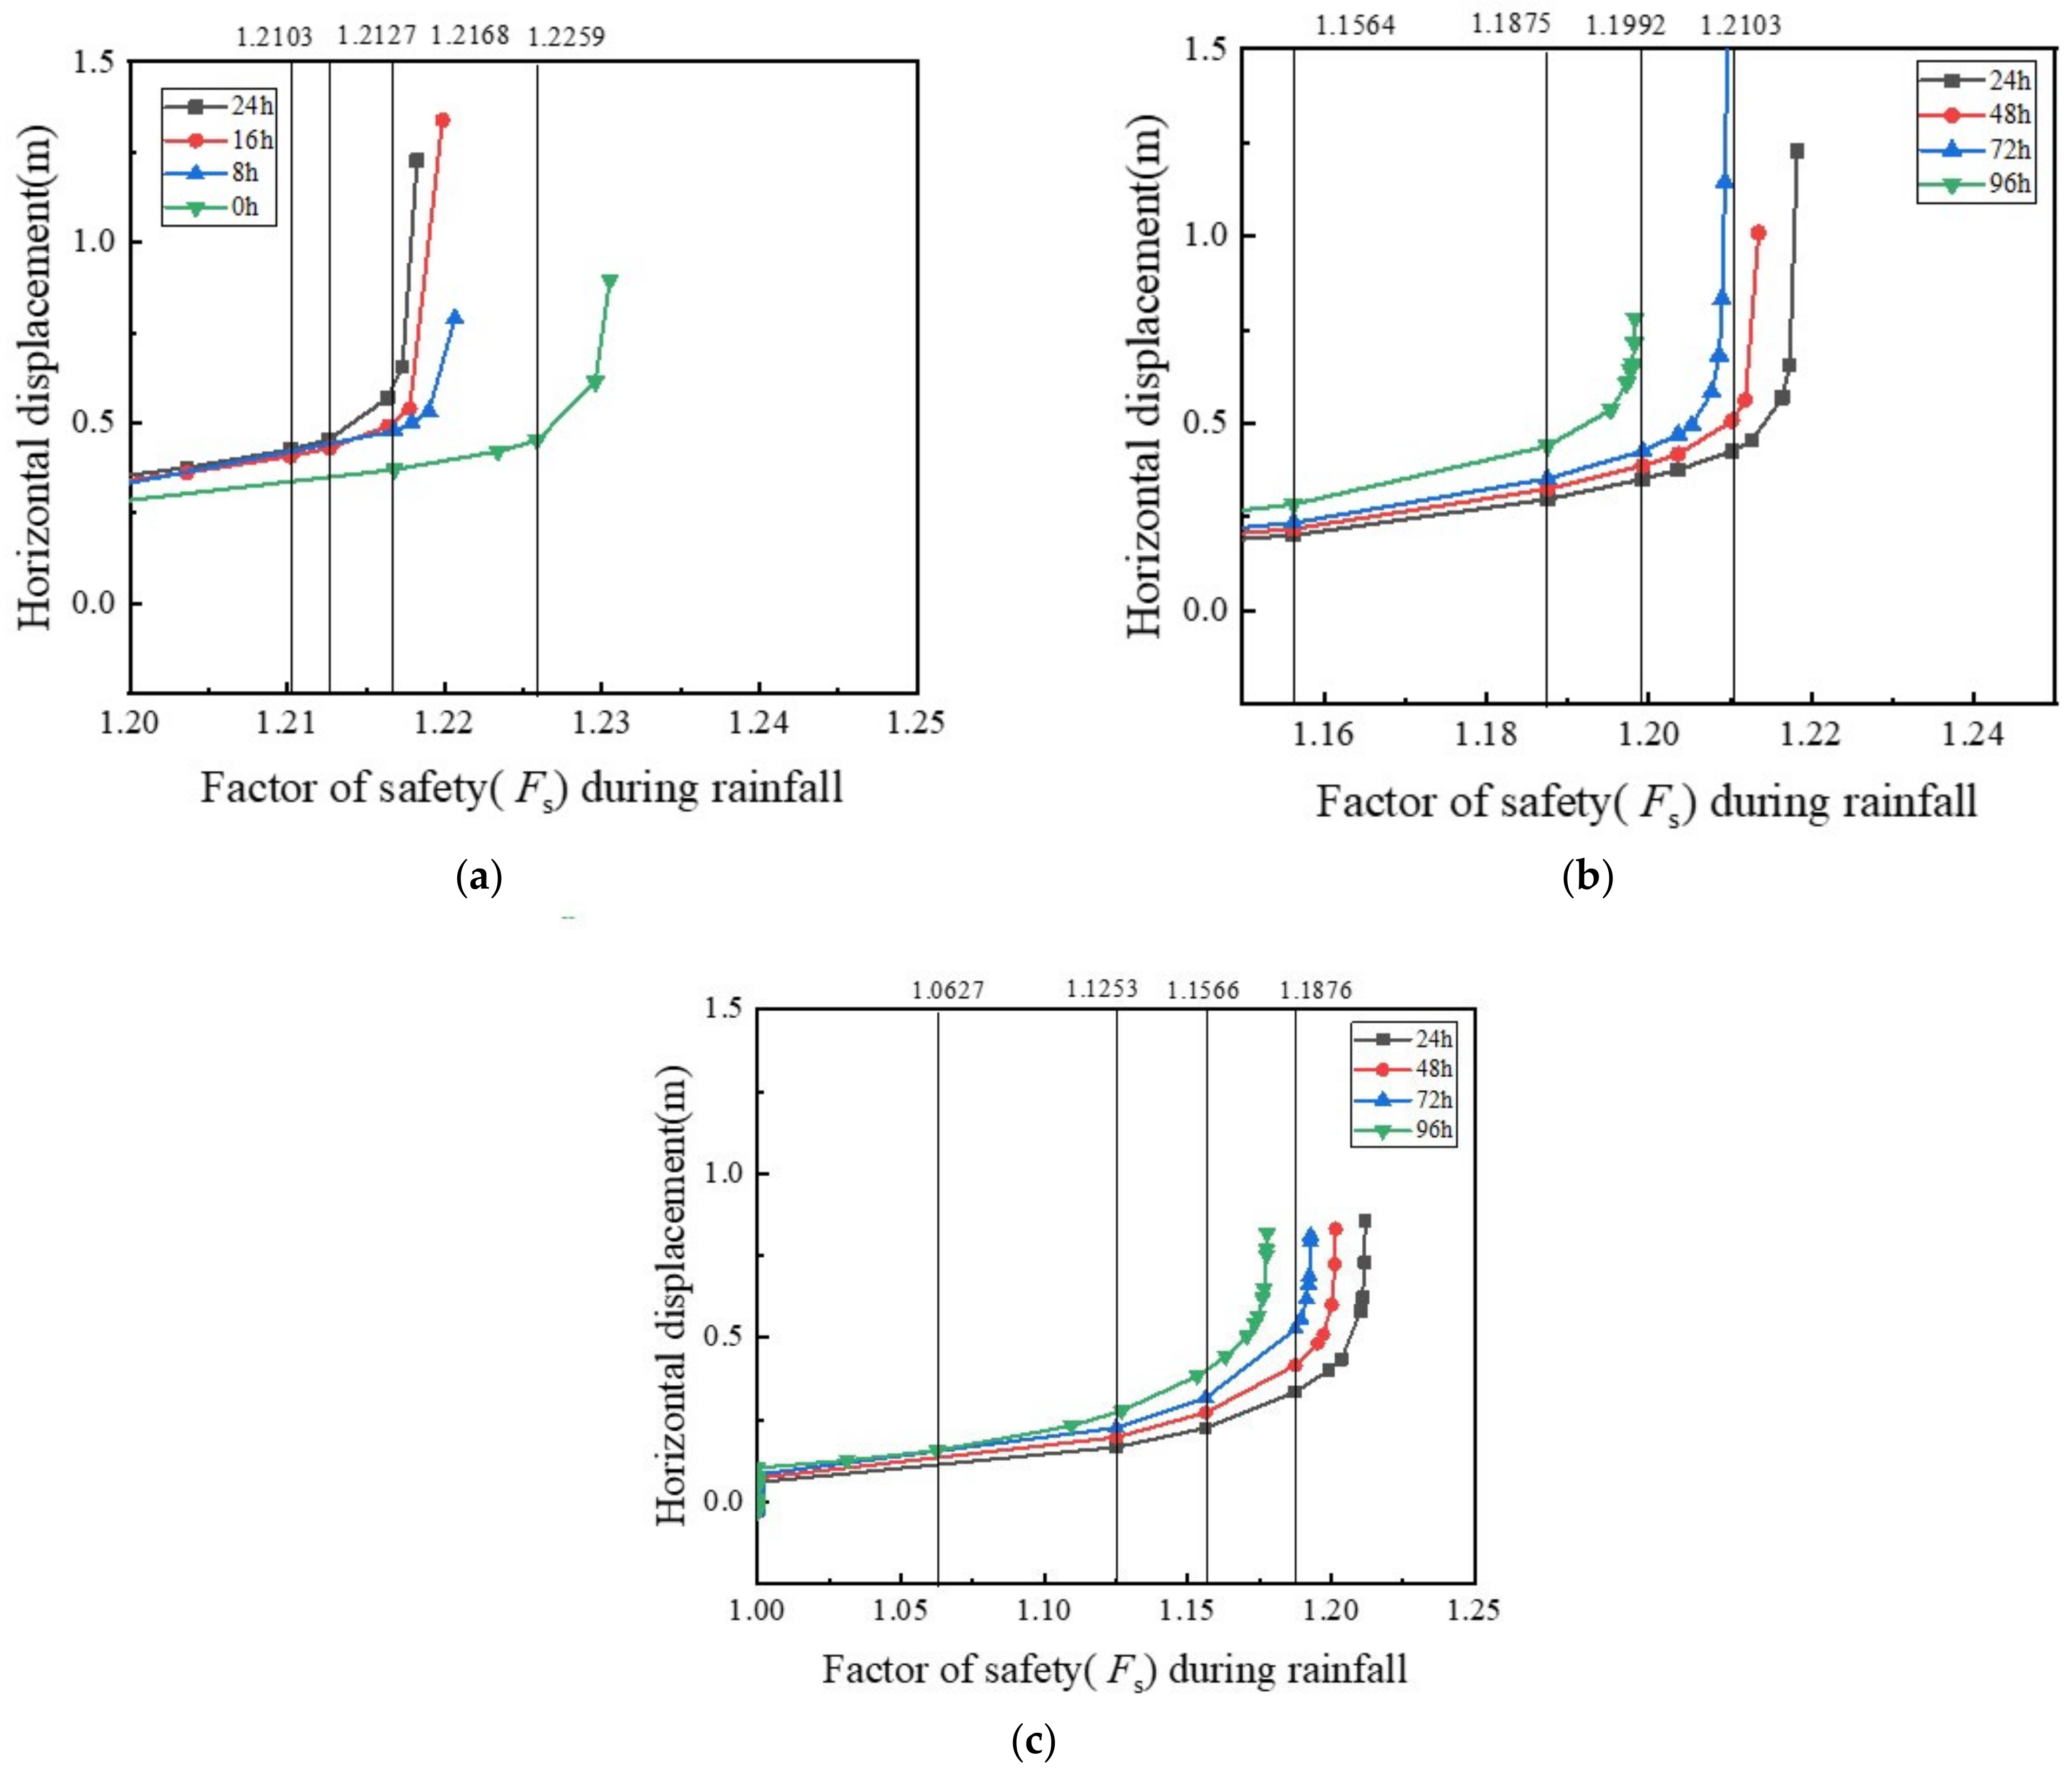
Figure 8a shows that under the infiltration velocity of 0.01 m/h, the longer the rainfall time is, the lower the safety factor is, but the overall decrease is relatively small. After 24 h of rainfall, the slope safety factor is reduced by 0.0156. In group B, the safety factor is reduced by 0.0695 after 96 h of rainfall, which is shown in
Figure 8b.
Figure 8c shows that under the infiltration velocity of 0.02 m/h, the safety factor decreases with an average of 0.0408 for each 24 h increase of rainfall, and it increases with the increase of rainfall time. The safety factor of 96 h of rainfall in Group C is 0.1249 lower than that of 24 h of rainfall, which is roughly twice that of Group B, indicating that the greater the intensity of rainfall, the greater the negative impact on slope stability. It can be seen that the duration of the rainfall and its cumulative effect have a great influence on the safety factor of high liquid limit soil slope during prolonged rainfall for 96 h. The main reason is that the sliding surface automatically searched by ABAQUS in the reduction coefficient method is saturated and deep. However, the rainfall has almost no effect on the strength of the saturated area in the short term within 24 h. On the other hand, because of the low permeability coefficient of the soil, it is difficult for the soil to go deep into the deep sliding surface in a short time, so the rainfall has little influence on the overall stability of the soil slope and has a great influence on the shallow sliding of the slope. However, when the rainfall time reaches 96 h, rainwater can infiltrate into the deeper soil, so that the overall stability of the slope begins to be greatly reduced. To sum up, more optimized anti-slide support should be given to the high liquid limit soil slope in long-term rainfall.
3.3.3. Stress Variation Characteristics
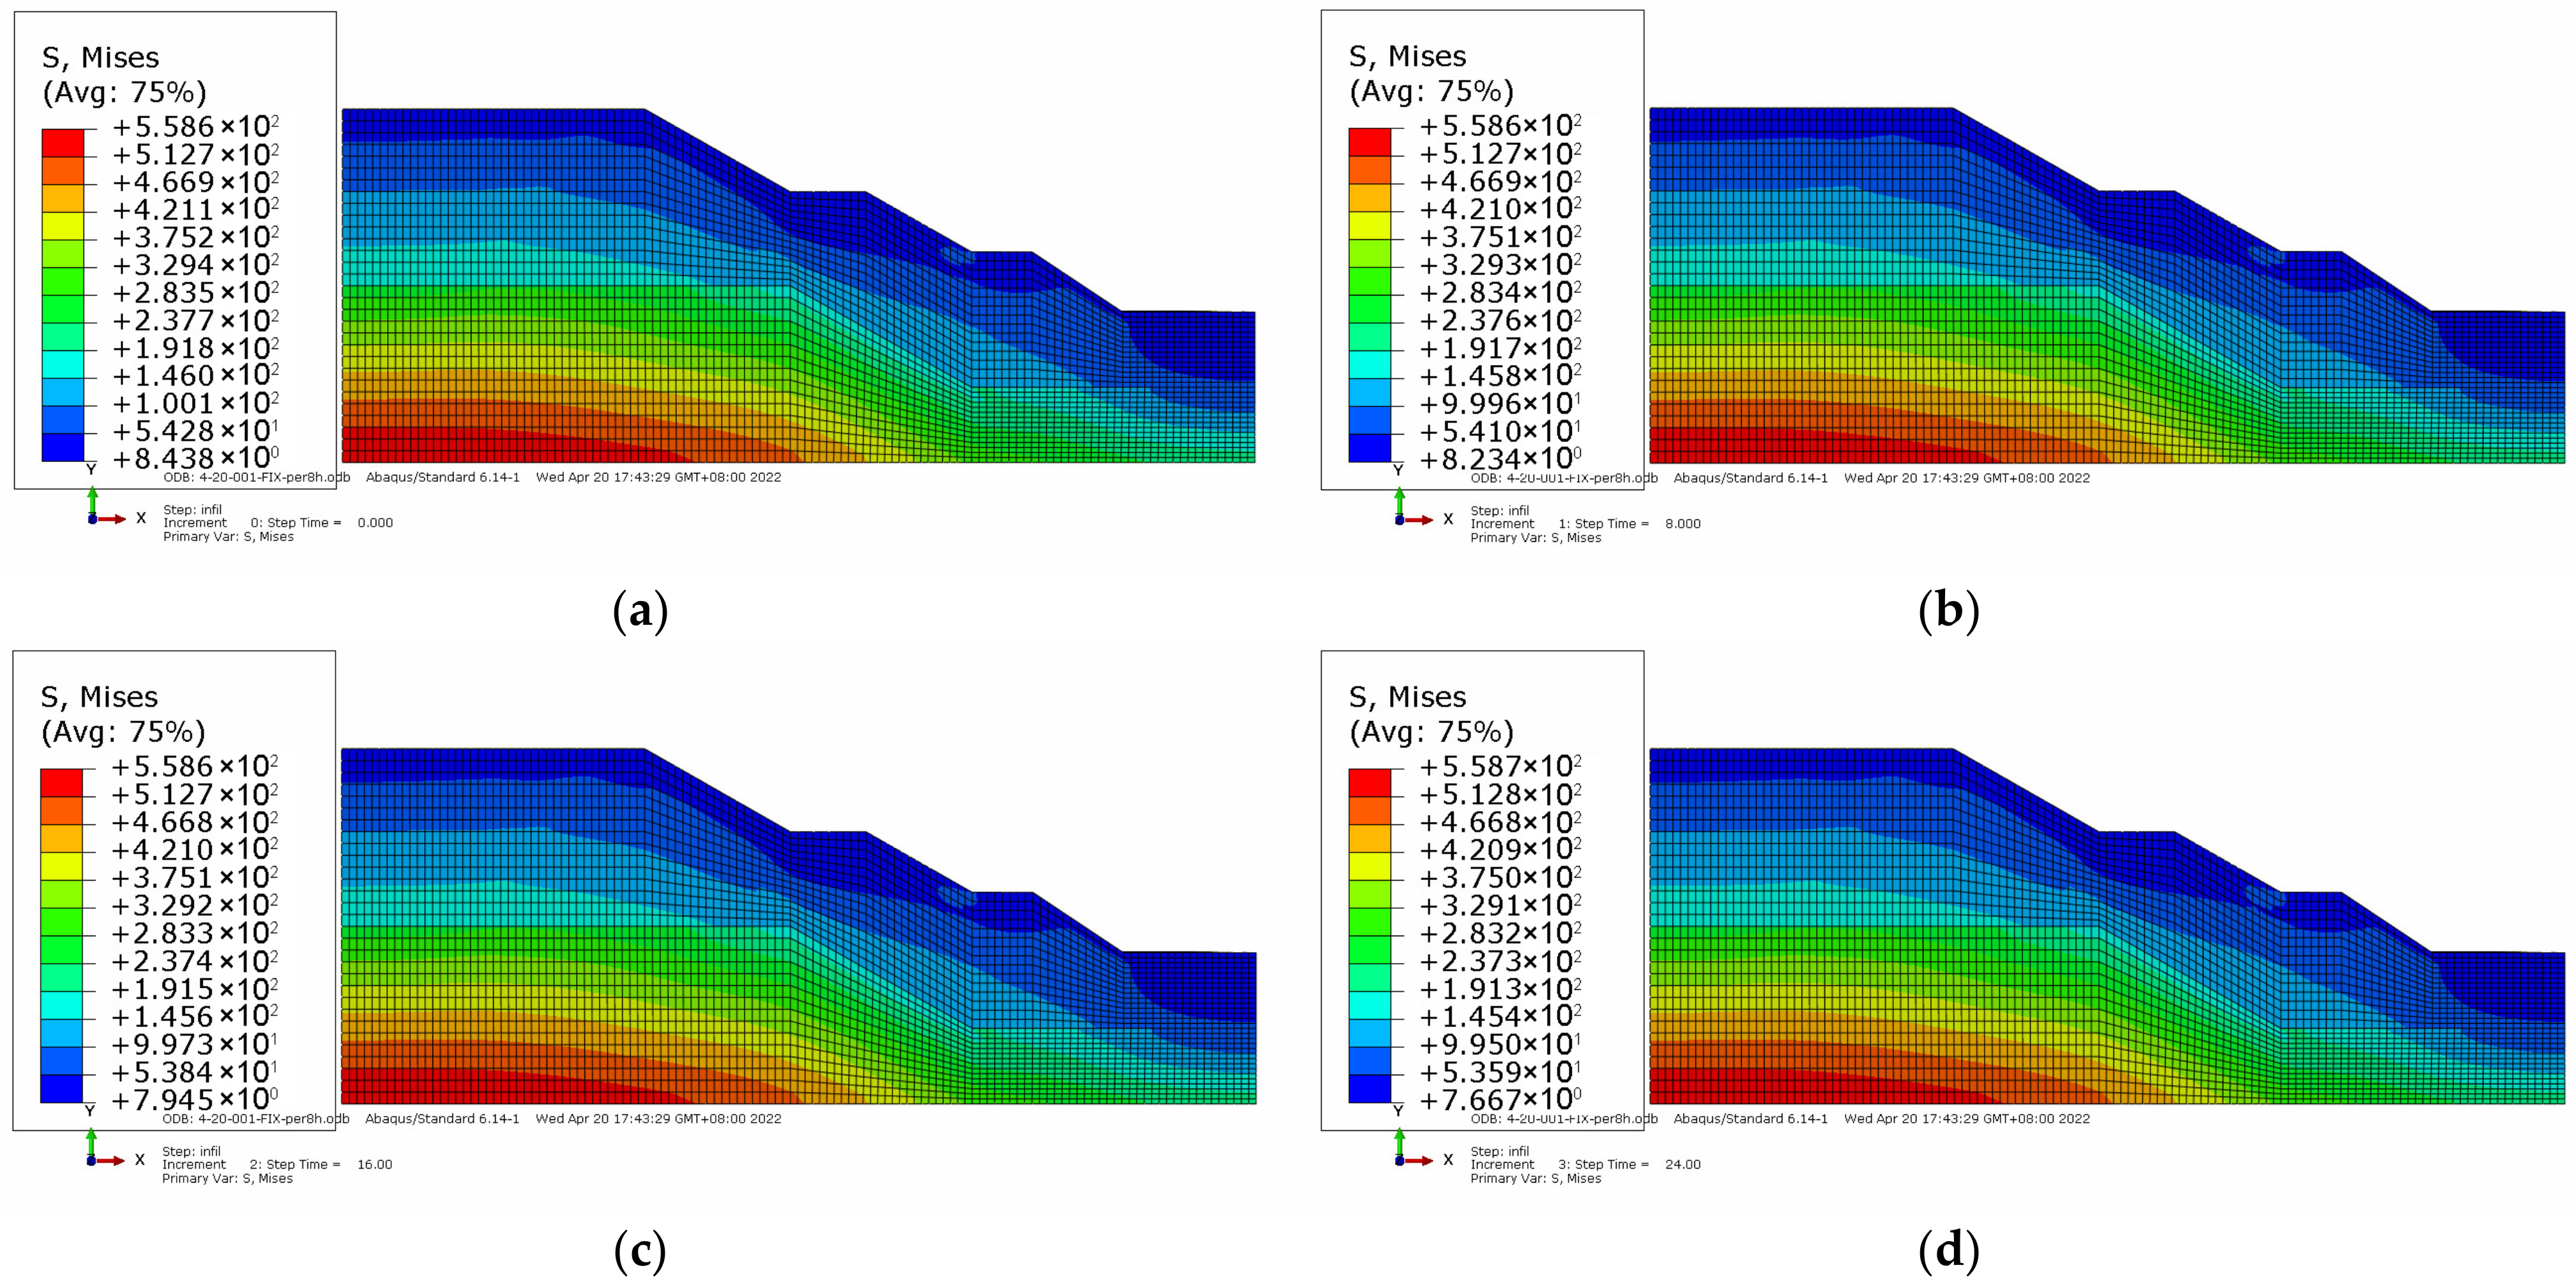
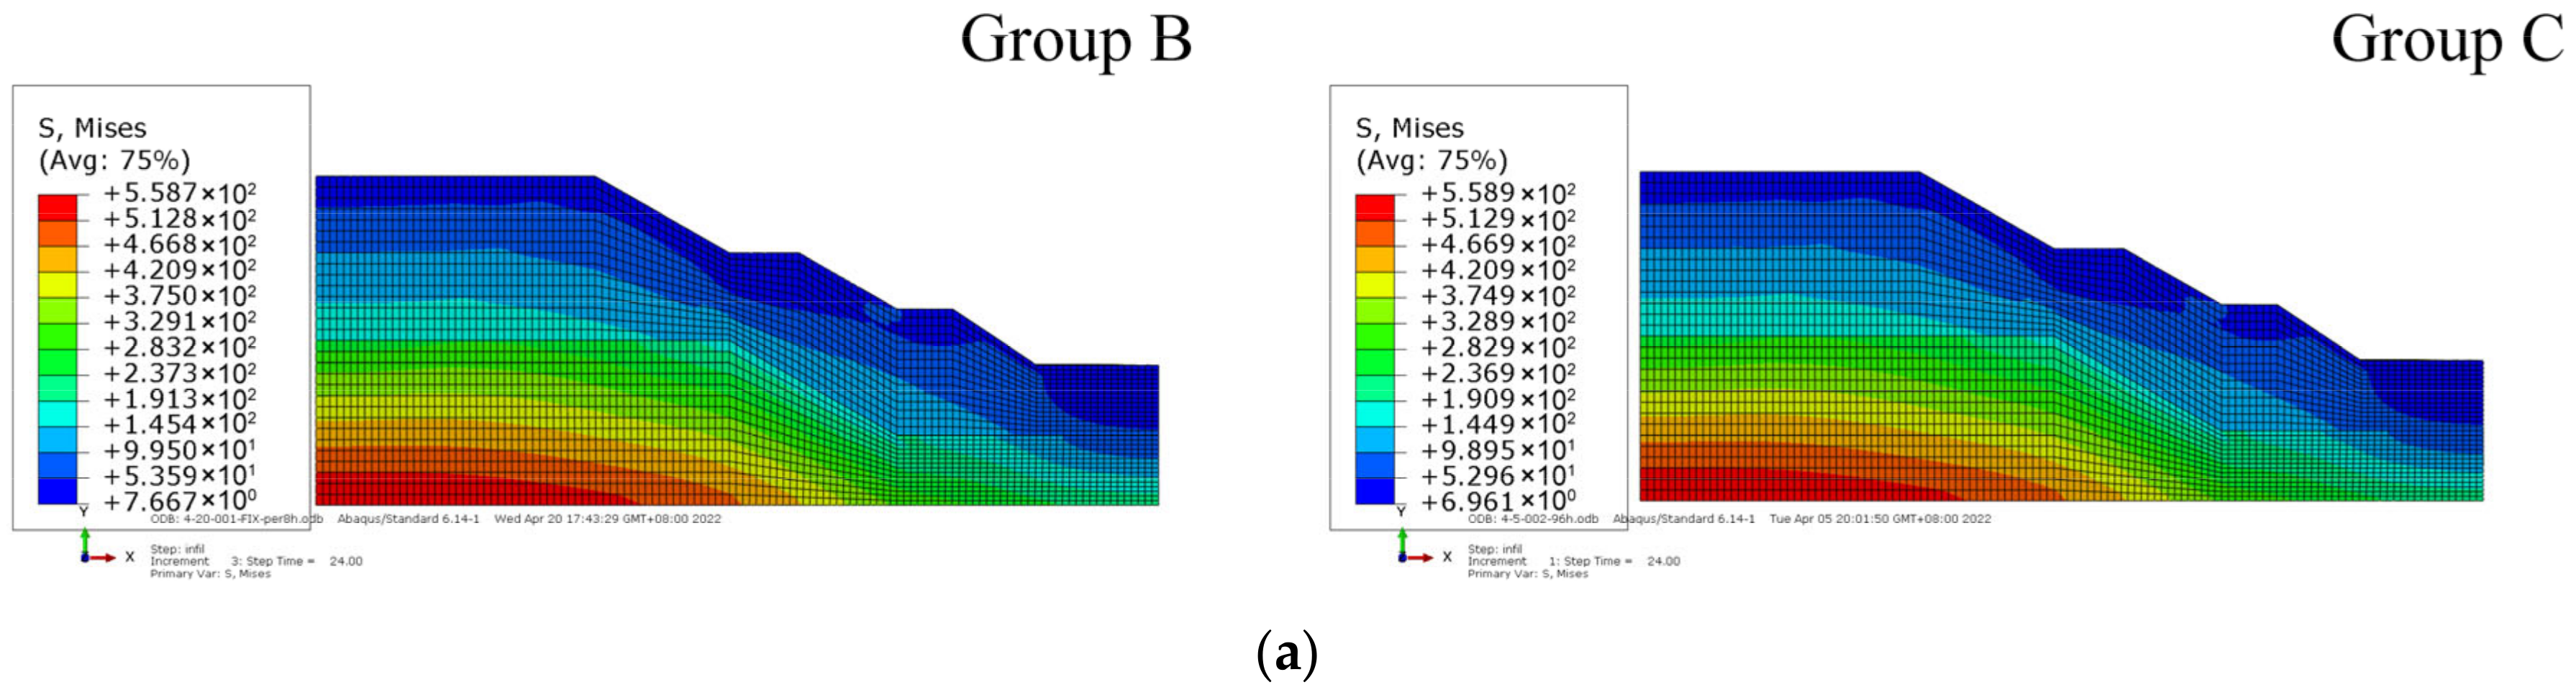
As can be seen in
Figure 9 and
Figure 10, the changing trend of surface and deep, the Mises stress of slope in Group A and Group B is different with the duration of rainfall. On the surface of the slope, the matrix suction decreases, and the pore pressure decreases due to rainfall. In the deep layer of the slope, there is mainly saturated soil, and the Mises stress is mainly affected by the overlying load. Therefore, with the passage of rainfall time, the Mises stress in the deep layer of the slope increases. The increase of rainfall intensity accelerates the decrease of surface Mises stress, and compared with the surface minimum Mises stress of Group B for 96 h and Group C for 48 h (6.304 kPa and 6.294 kPa respectively), it can be found that the effect of doubling of rainfall intensity on the surface minimum Mises stress of high liquid limit soil slope is greater than that of rainfall time.
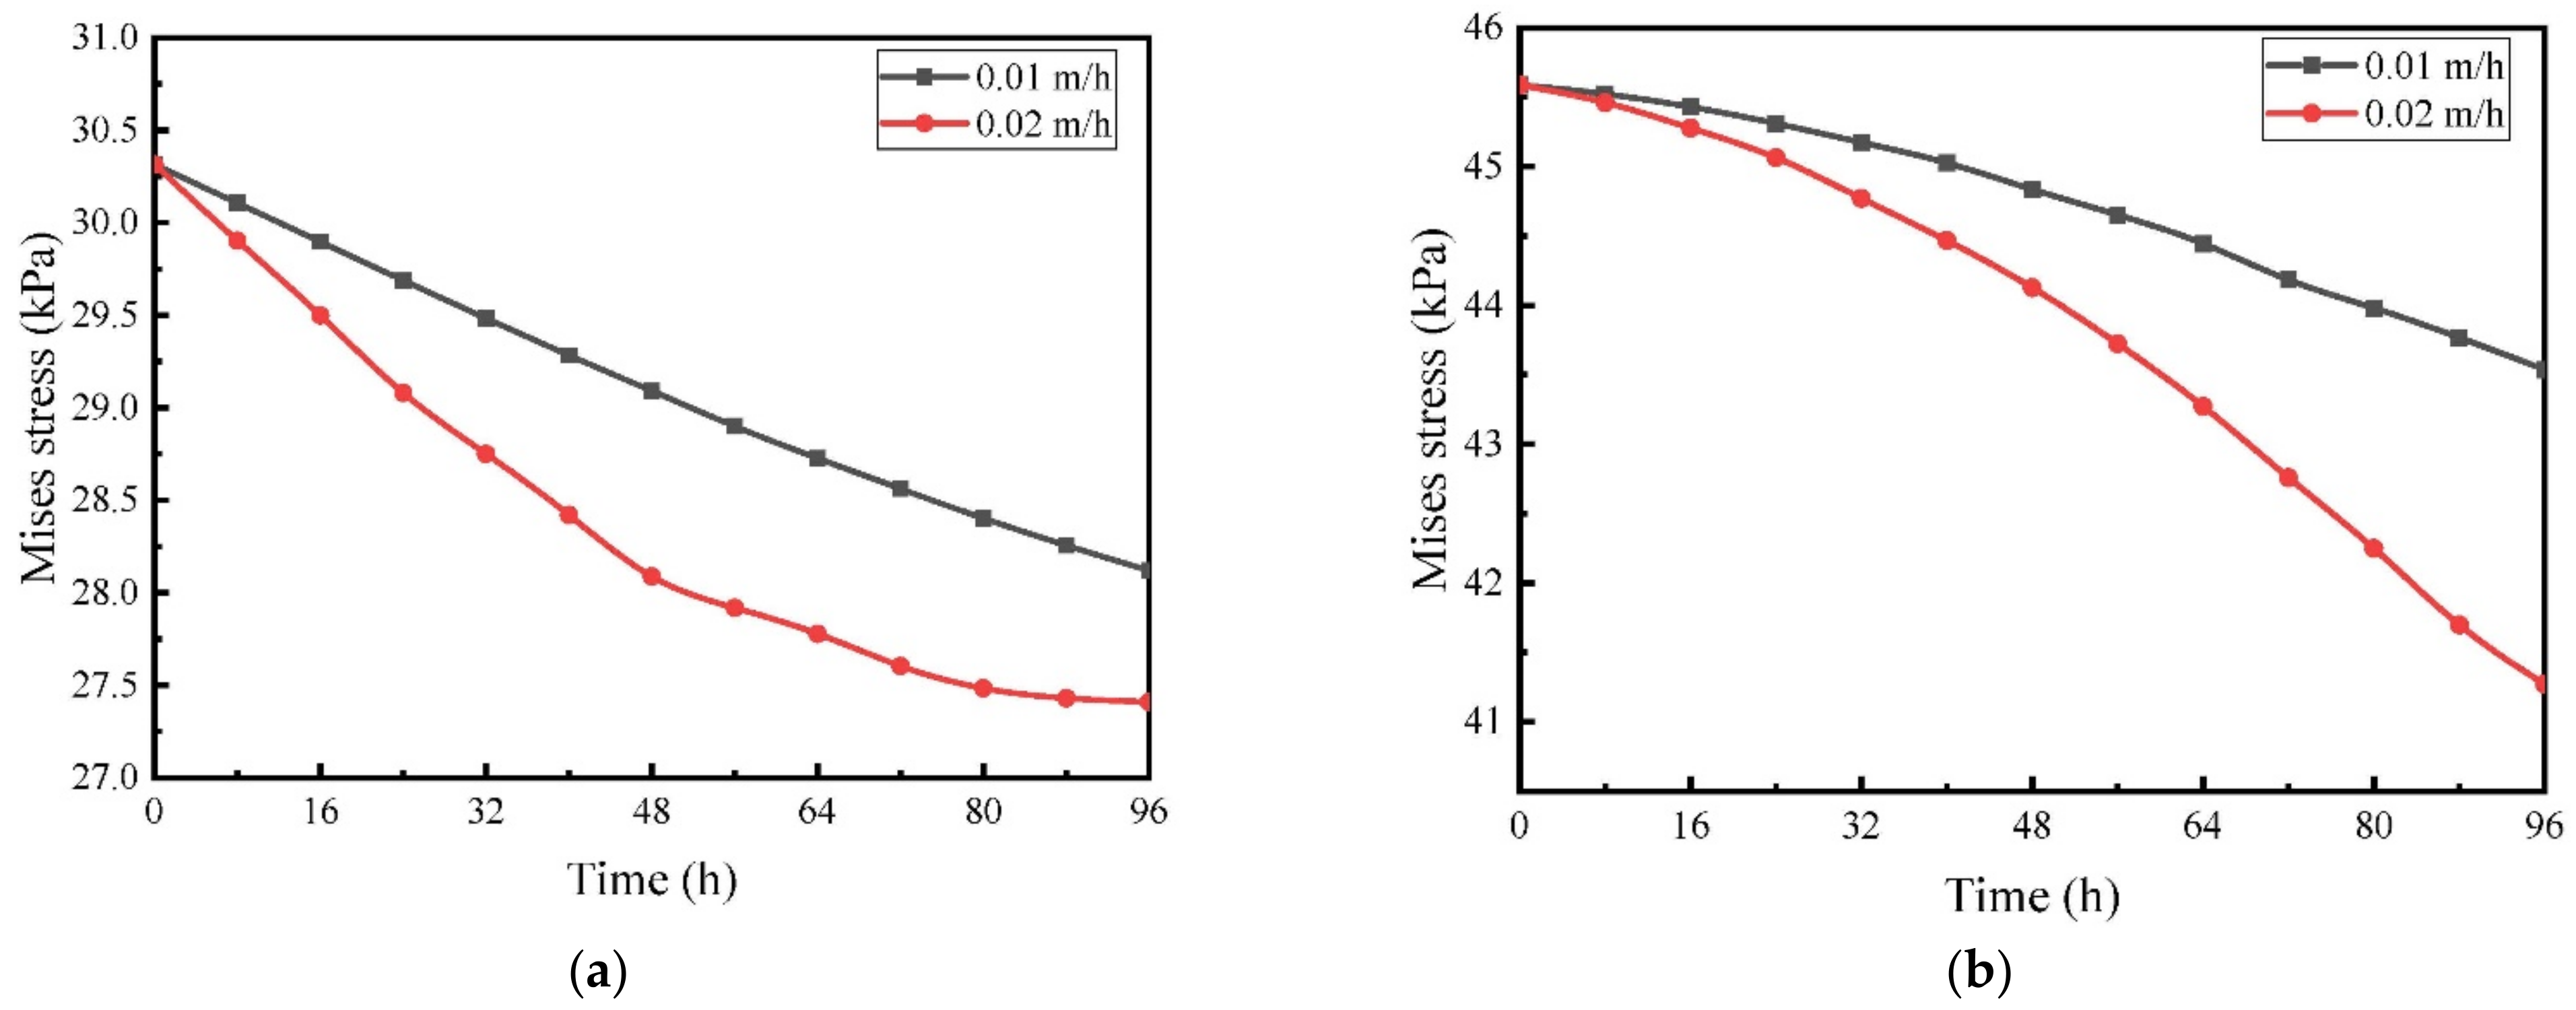
Because the instability failure of the slope often occurs at the foot and top of the slope, the Mises stress of the top and foot of the high liquid limit soil slope is analyzed with time.
Figure 11 shows that after 96 h of continuous rainfall, the surface Mises stress at the top and bottom of the slope gradually decreases with time. The cumulative changes of Mises stress in Group B and Group C are −2.19 kPa and −2.91 kPa, respectively, and the cumulative decreases were −7.22% and −9.60%, respectively. The cumulative changes of Mises stress in Group B and Group C were −2.05 kPa and −4.32 kPa, respectively, and the cumulative decreases were −4.50% and −9.48%, respectively. In addition, it can be seen in
Figure 11a,b that the effect of rainfall intensity on the Mises stress at the top of the slope is less than the rainfall time, and the effect of rainfall intensity on the Mises stress at the foot of the slope is greater than that of rainfall time.
Figure 12 illustrates the shear stress with rainfall time at different depths from the top of the slope. At the position above 28.8 m, the shear stress increases gradually with the depth, mainly because the overlying load weight of the upper soil can be ignored. When the total load is constant, the pore pressure increases, and the Mises stress decreases. It is saturated at 28.8 m before the rainfall, which mainly reflects that the increase of overlying load leads to the increase of Mises stress. With the increase of rainfall time, the shear stress in the surface layer decreases gradually and approaches 0, which is easily causes a landslide. With the infiltration of rainwater, the shear stress of each layer decreases except for that of the deep layer.
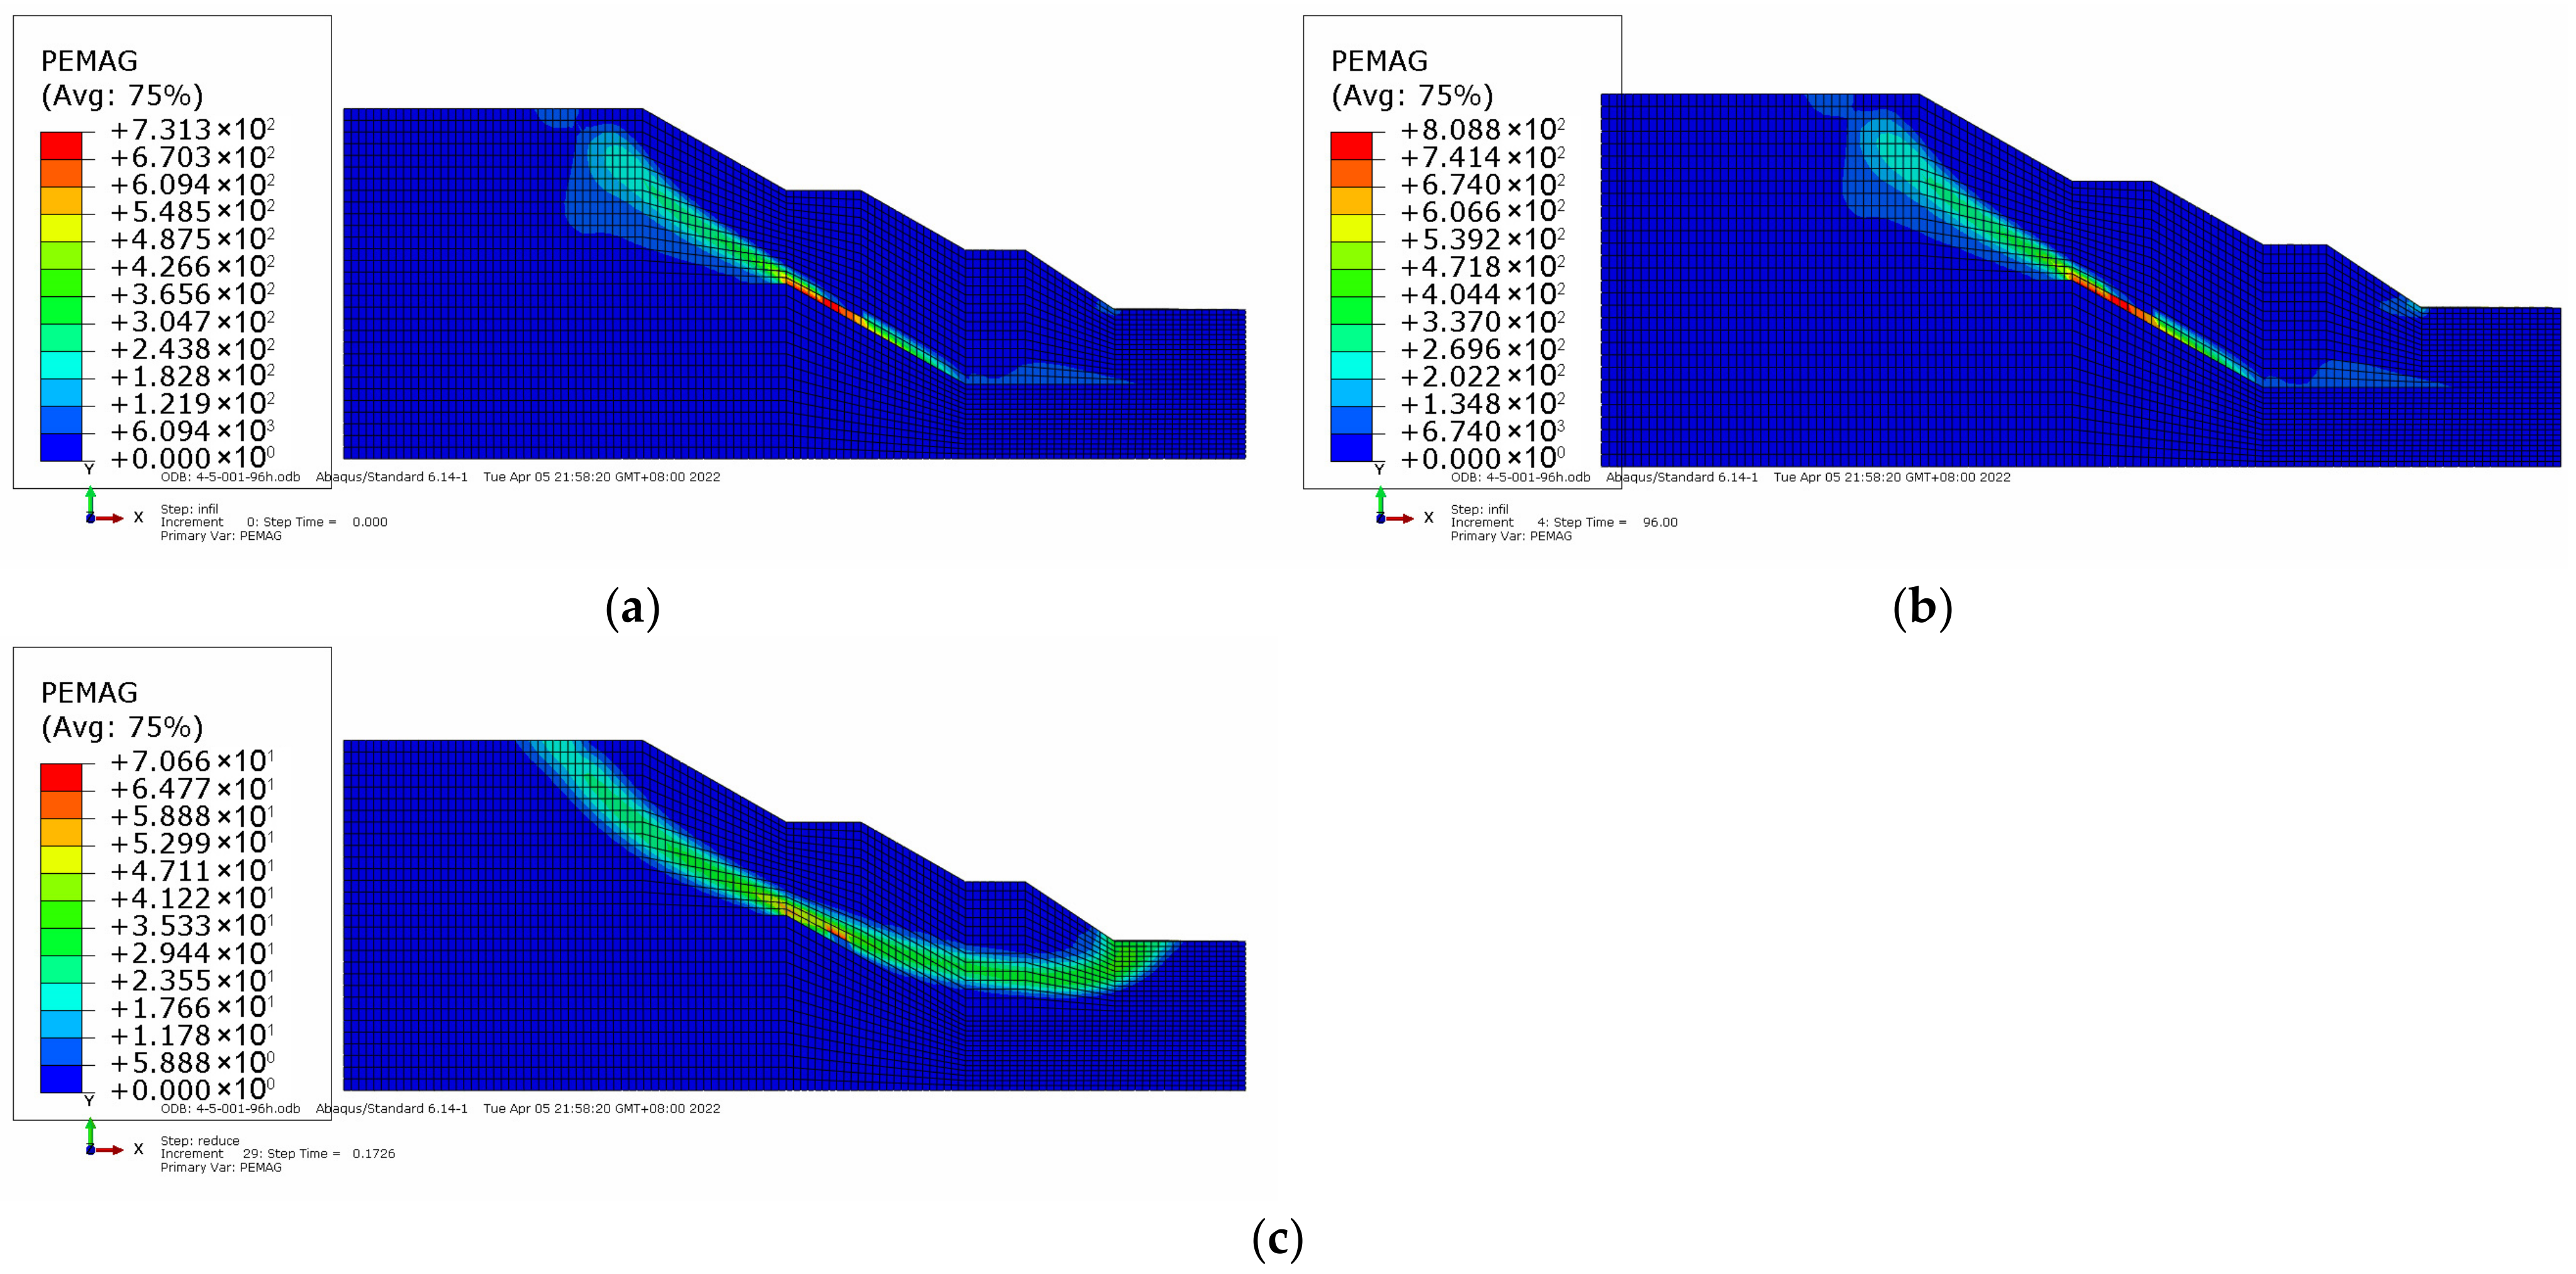
3.3.4. Development Characteristics of Plastic Strain Zone
Figure 13 shows that the plastic strain of the soil has not changed much during the whole process of rainfall, and the effect of rainfall on deep unsaturated soil is limited, as shown in
Figure 13b. In
Figure 13c, the distribution of the most dangerous slip surface of the slope is deep, which is located in the deep layer of the secondary slope. Compared with
Figure 13a,b, after 96 h of rainfall, the dangerous slip surface of the deep layer of the slope gradually connects with the foot of the top of the slope. Through the strength reduction, we can see that the final failure surface is a surface that runs through the top of the slope, the foot of the slope, and the deep dangerous surface. In addition, the series of the slope does not affect the plastic strain of the slope, and there is no obvious plastic failure of the primary slope and the secondary slope in the diagram. Therefore, to prevent the landslide and plastic failure of the high liquid limit soil slope, the main support can be carried out at the top and foot of the slope, and the anti-slide pile can be driven into the deep layer of the secondary slope.
3.3.5. Soil Displacement Characteristics
To study the effects of rainfall intensity and rainfall time on cumulative displacement, the dimensionless displacement coefficient K is proposed.
where
is the cumulative displacement after
t time when the rainfall intensity is
v;
is the cumulative displacement of the shallow layer with rainfall time of 24 h and rainfall intensity of 0.01 m/h.
For the shallow layer, the linear relationship between dimensionless K, rainfall time
t, and rainfall intensity
v is established for each monitoring hole. For the area without a detector, the cumulative displacement of each depth can be inferred by numerical simulation, and then, the relationship can be established by this method.
With the help of MATLAB, the parameter
is calculated for the existing calculation results, and the average value of
is 1.1957. To facilitate the calculation, the parameter
of the slope takes 1.2. Thus, we can figure out the following equations.
Let
, we can get the final performance of the equation.
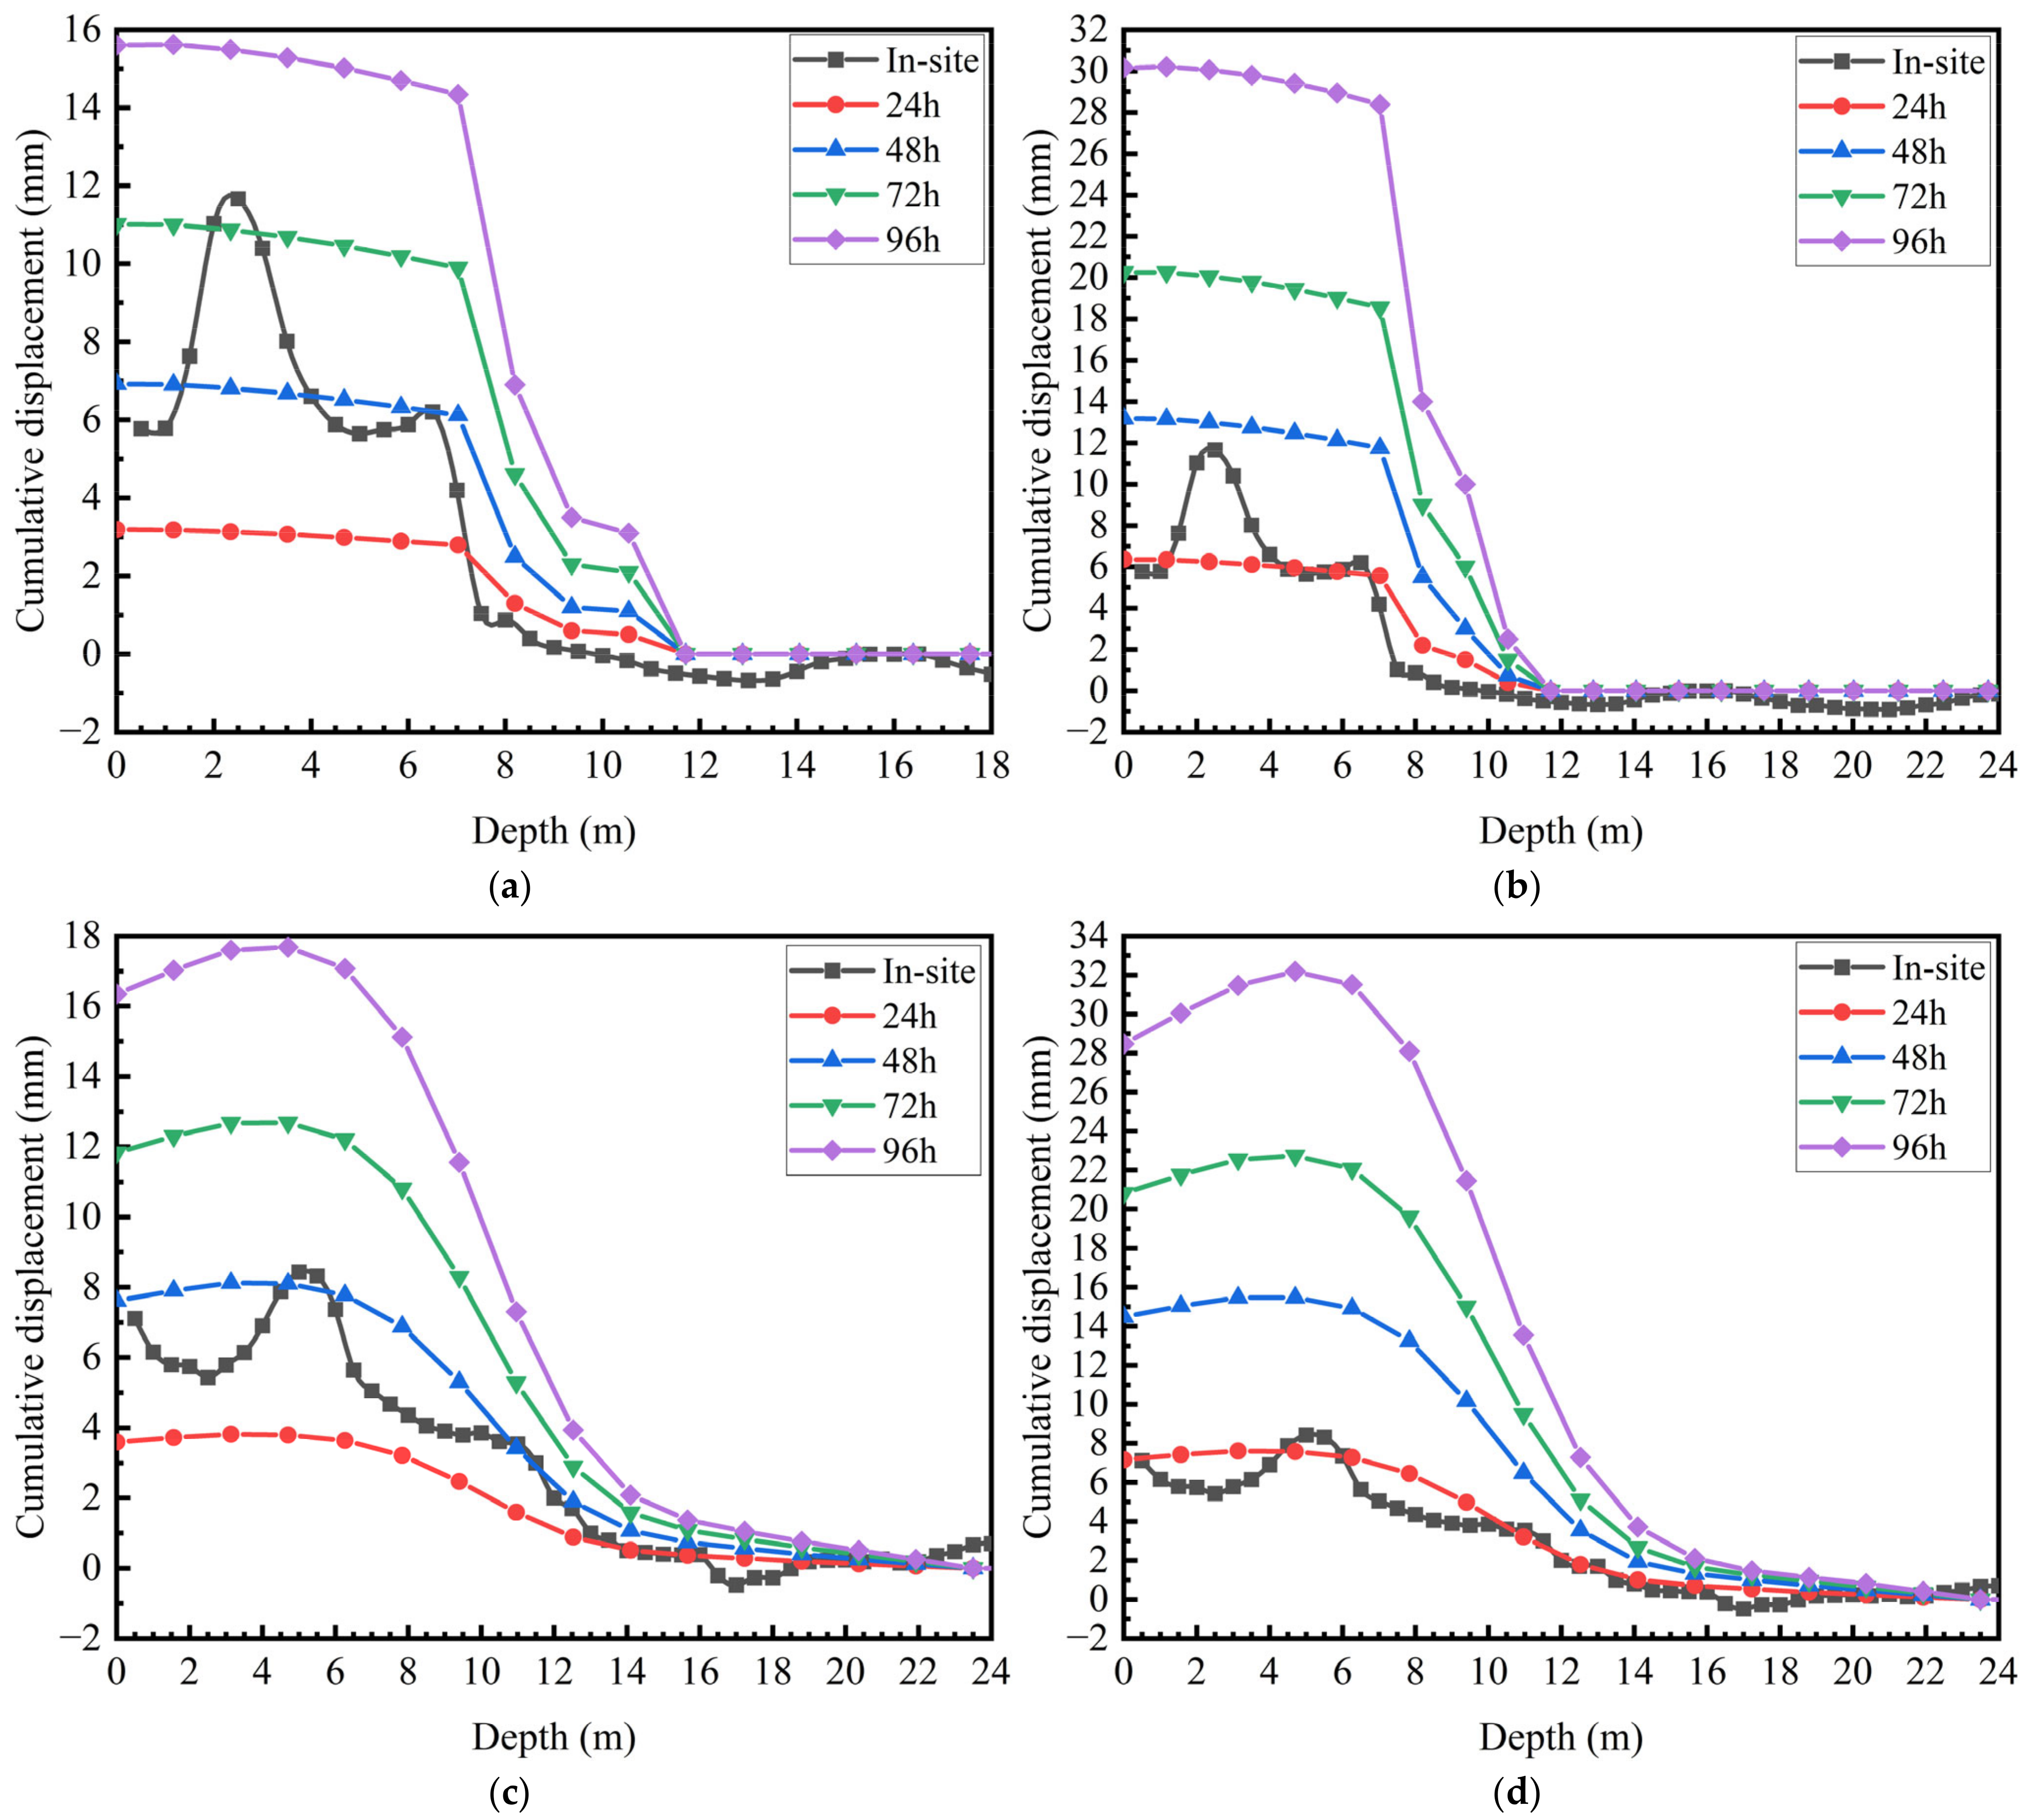
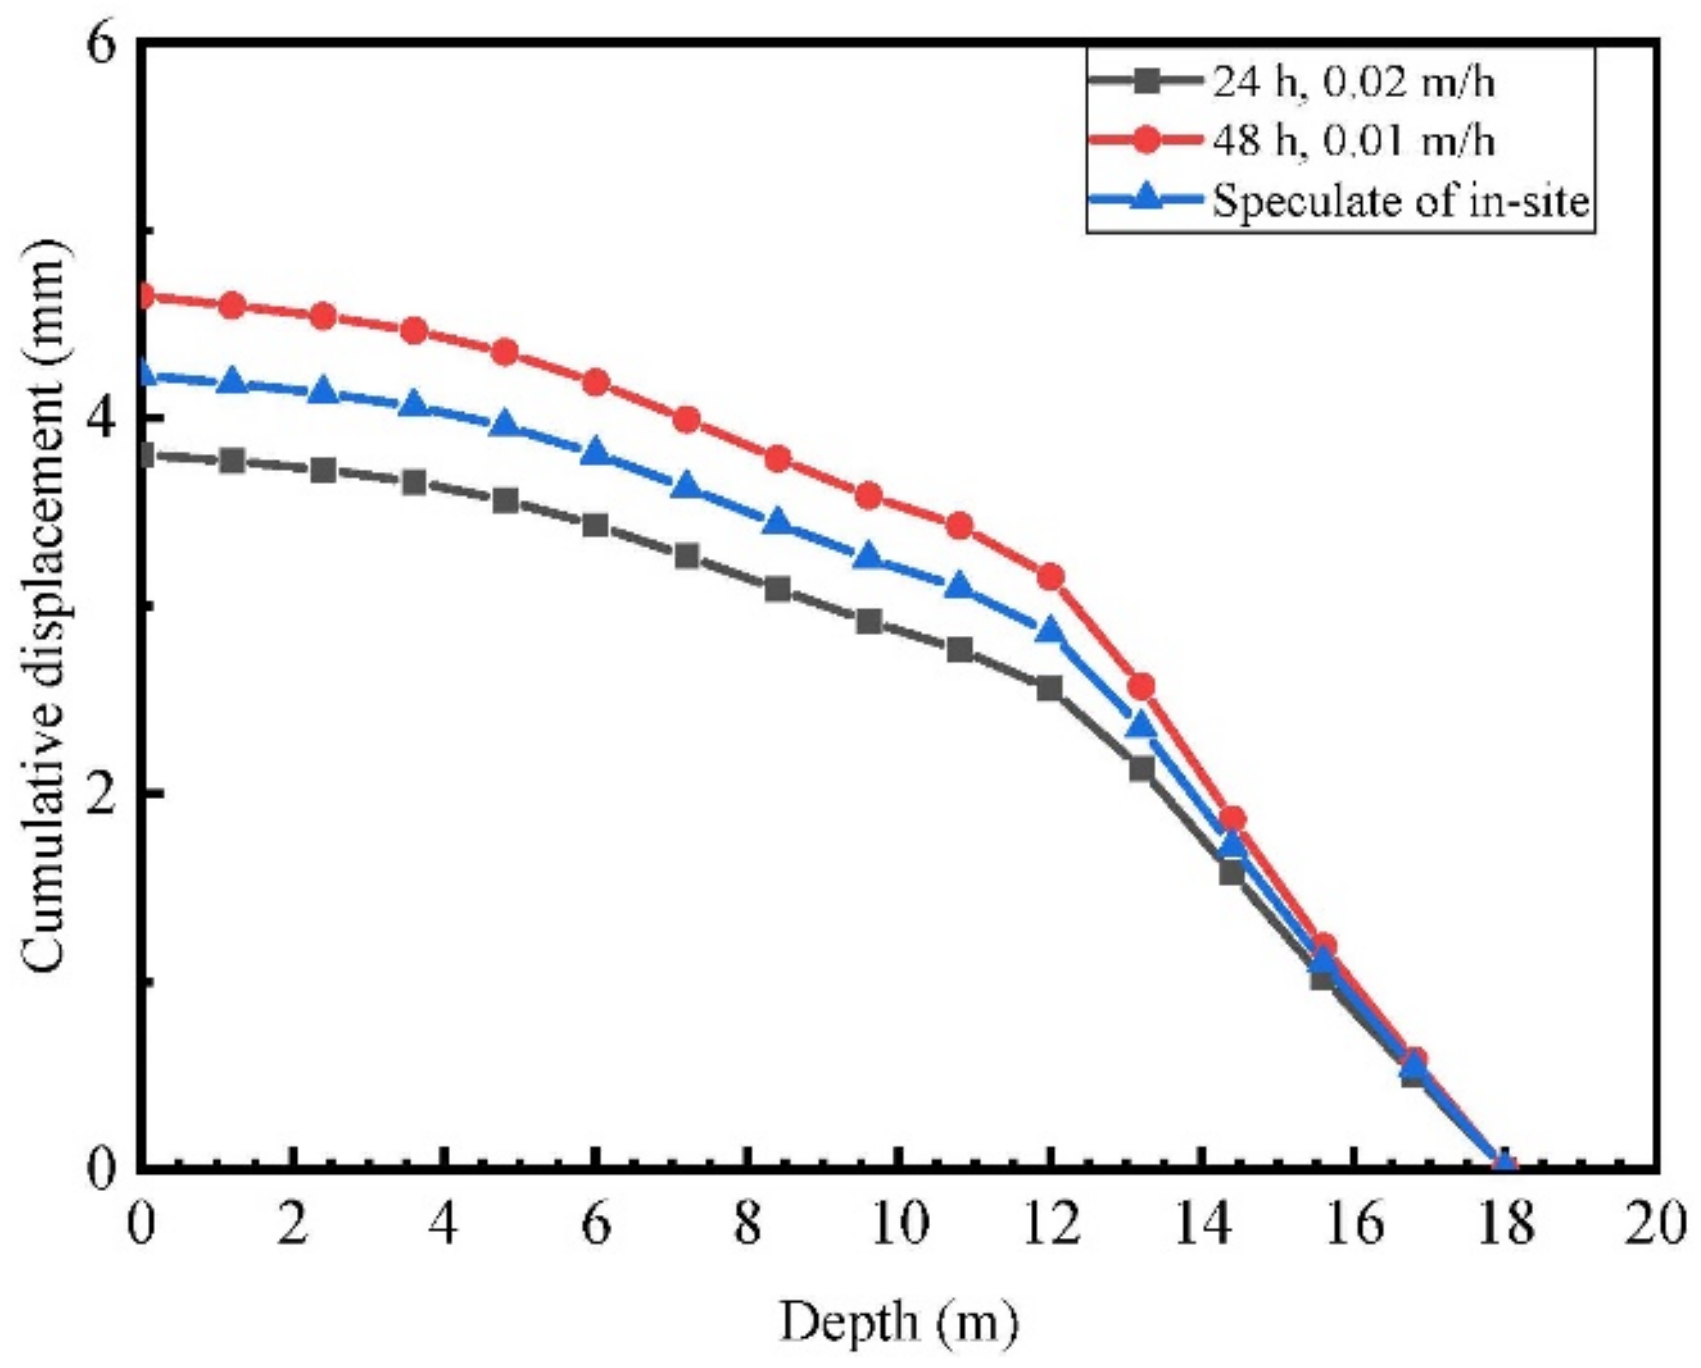
Figure 14 shows the in-site monitoring and numerical simulation of the CX-5 and CX-6 holes. The cumulative displacement of A direction in groups B and C varies with depth in each rainfall period. Compared with the in-site monitoring data, the in-site monitoring data are close to the data at the 48 h of Group B or the 24 h in Group C, indicating the numerical model has high accuracy. Although the sensor is damaged due to the burying of the CX-4 hole, its data can be speculated by taking the average of the data at 48 h for Group B or at 24 h for Group C, as shown in
Figure 15. Compared with
Figure 14a,b, the increase of rainfall intensity directly changes the cumulative displacement of high liquid limit soil slope at the same depth. The time of rainfall increases the cumulative displacement, but the influence is not as great as that of rainfall intensity.
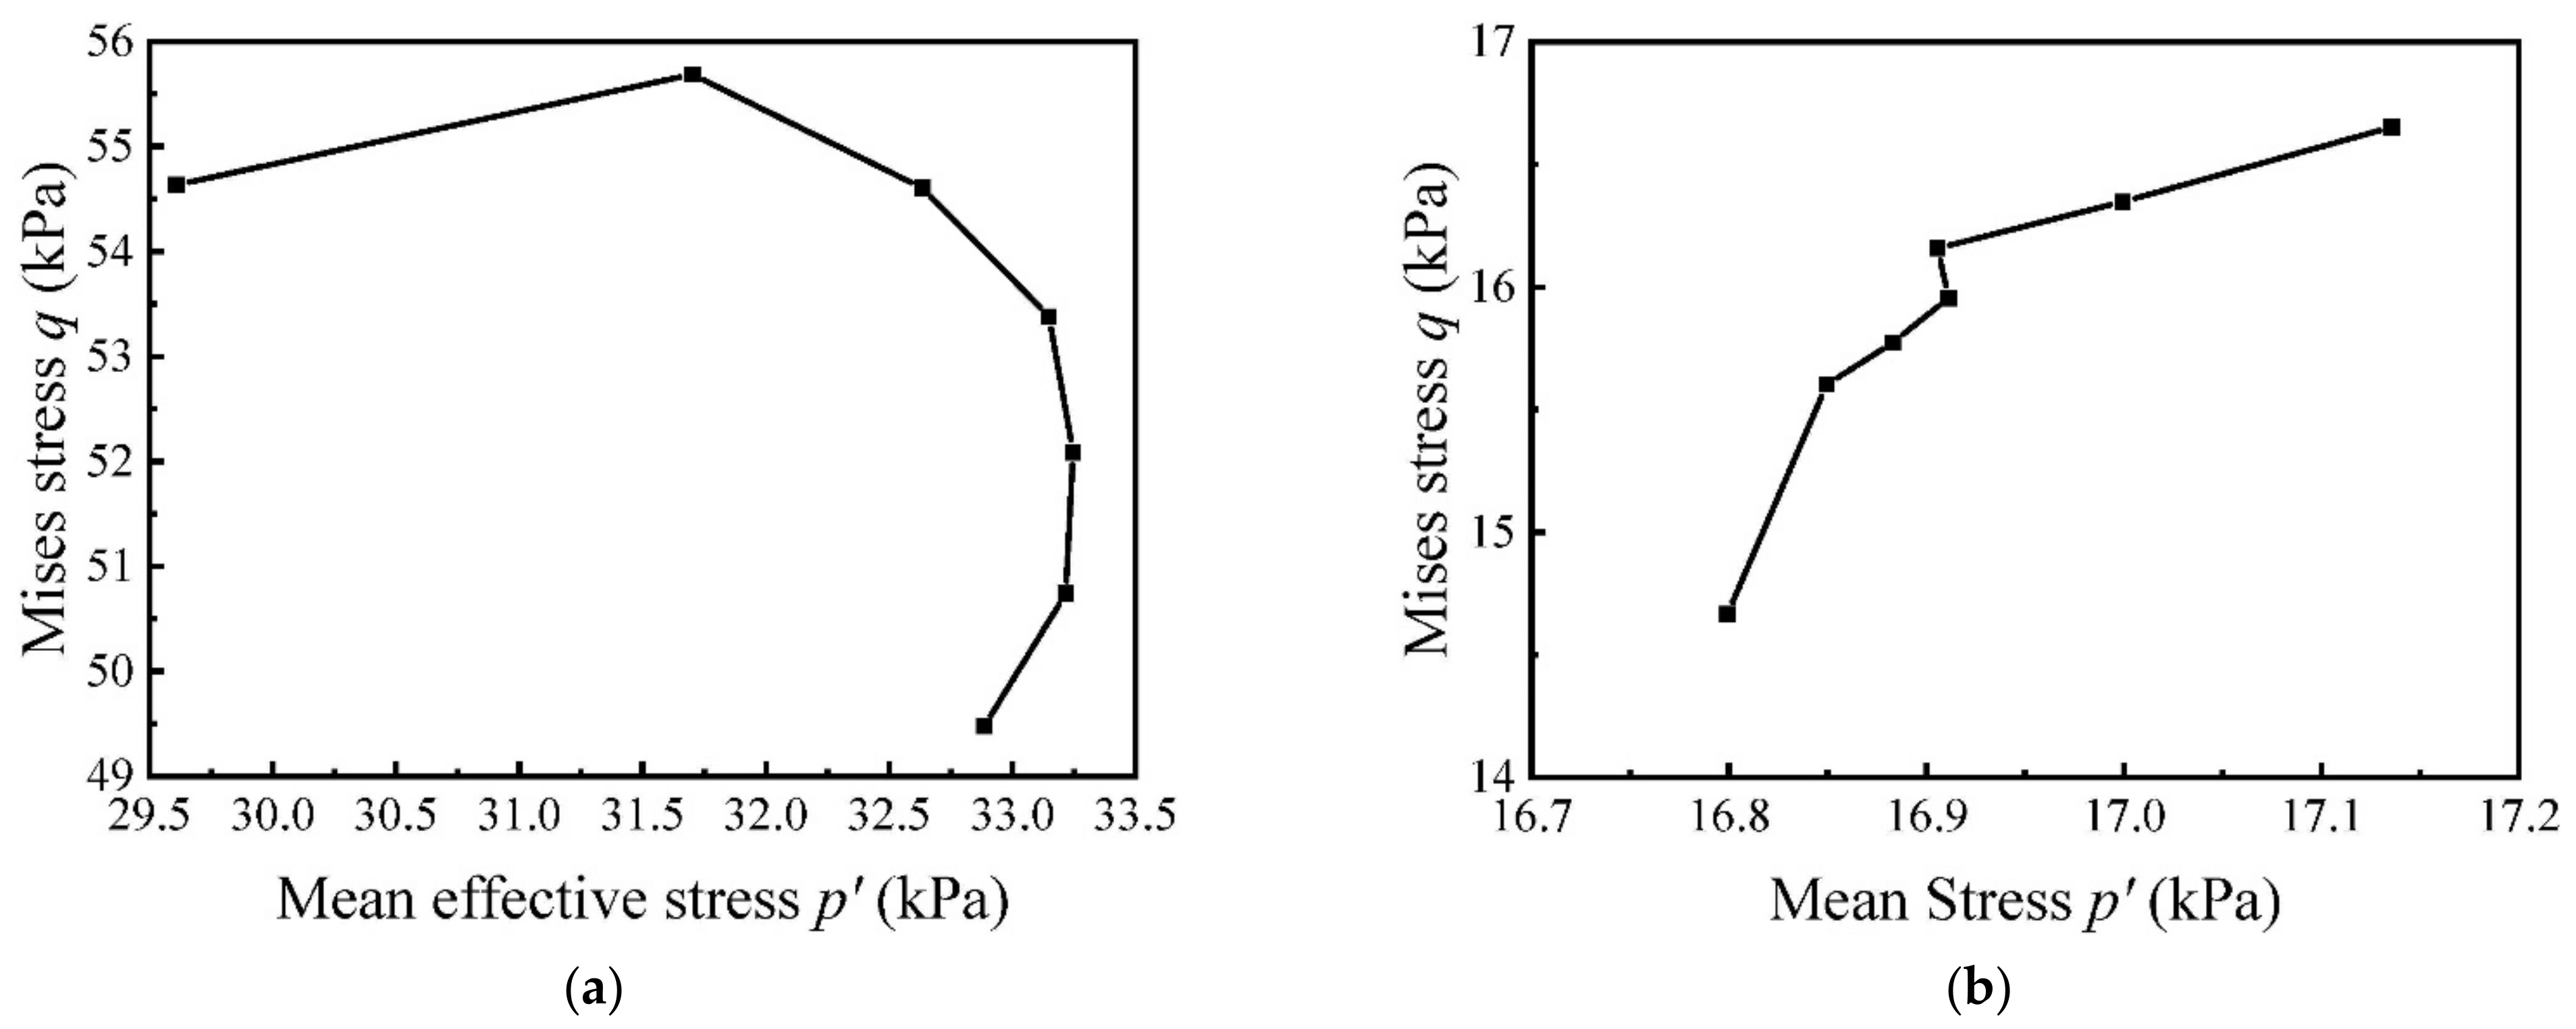
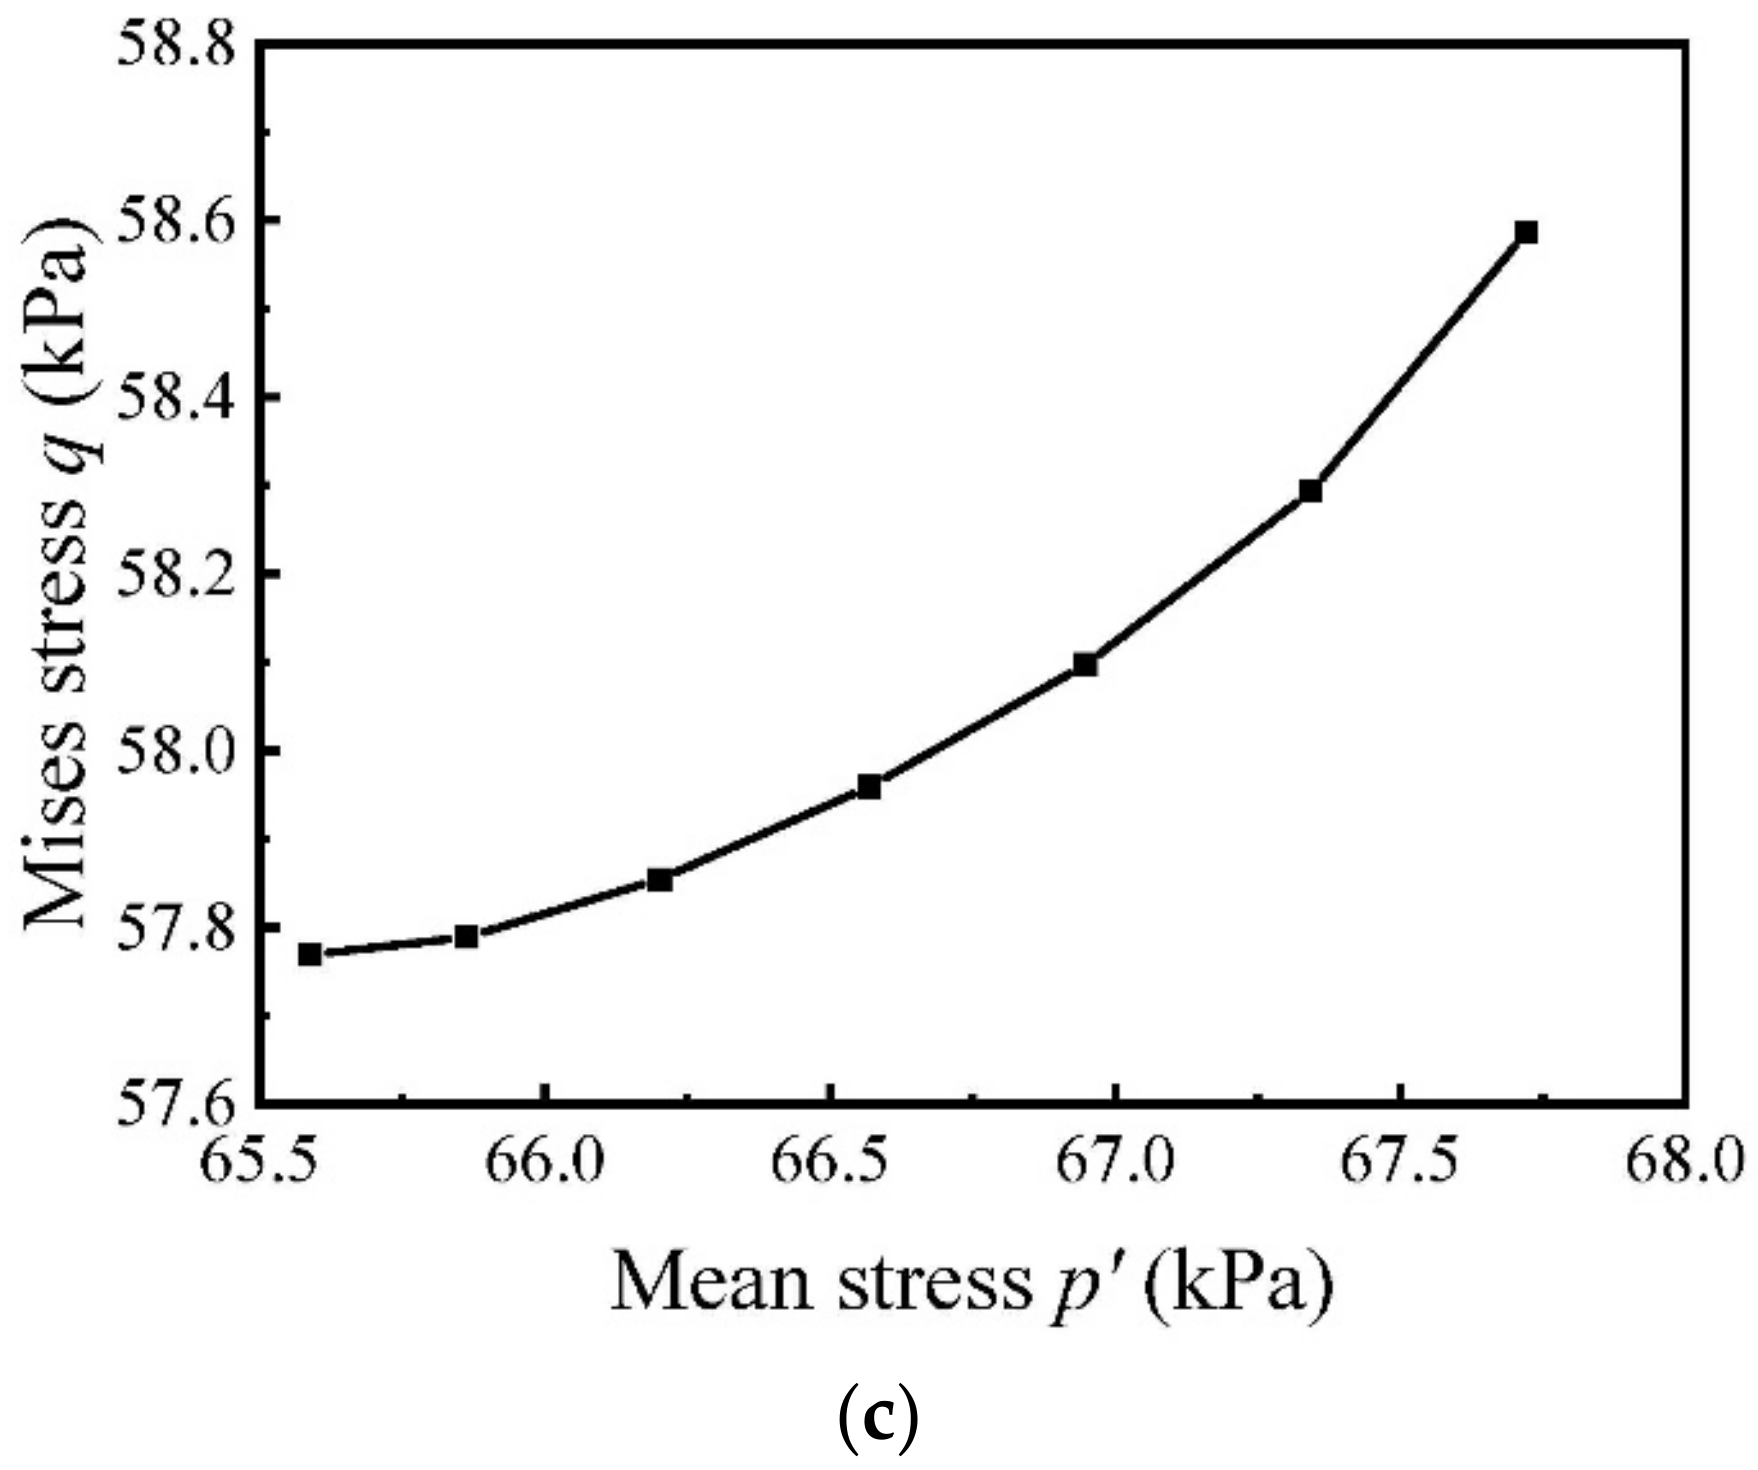
3.3.6. Analysis of Stress Path
In this paper, the mean stress and equivalent deviatoric stress paths of two typical points at the foot of the slope and the top of the first-grade slope during rainfall are compared. It can be found that the stress paths in
Figure 16 show different characteristics. For the point at the foot of the slope, under the action of rainfall infiltration, the pore pressure increases, and the effective average stress decreases, which moves to the left in the figure. On the other hand, partial stress increases all the time, and the path moves upward. When the effective stress path is reduced to a certain extent, the effective stress path continues to approach the yield surface, and then the stress path moves along the yield-oriented unloading direction and gradually reaches yield. From
Figure 16b, it is located in the middle and lower part of the soil slope, and the bulk density of the upper unit increases gradually after absorbing water, resulting in a continuous increase in the average effective stress and partial stress at this point, but the increase is irregular because the unit is affected by the external rainfall, rising water level, and increasing load. From
Figure 16c, it can be seen that its change law is obvious, that is, both
and
are increasing, but the partial stress increases rapidly, which means that it is gradually approaching the yield surface, but its amplitude is lower than that of
Figure 16a.
The stress path curves of the above three points also confirm the infiltration front theory, that is, the rainfall infiltration mainly affects the change of shallow strength of slope. For the high liquid limit soil, it is easy to produce slope instability such as the surface flow collapse, and the influence on the deep sliding surface is limited.
3.3.7. Analysis of Numerical Simulation Results
The effect of doubling of rainfall intensity on the surface minimum Mises stress of high liquid limit soil slope is greater than that of rainfall time.
More optimized anti-slide support should be given to the high liquid limit soil slope in long-term rainfall.
The effect of rainfall intensity on the Mises stress at the top of the slope is less than the rainfall time, and the effect of rainfall intensity on the Mises stress at the foot of the slope is greater than that of rainfall time.
With the infiltration of rainwater, the shear stress of each layer decreases except for the deep layer.
The main support can be carried out at the top and foot of the slope, and the anti-slide pile can be driven into the deep layer of the secondary slope.
The dimensionless displacement coefficient K is proposed to study the effects of rainfall intensity and rainfall time on cumulative displacement. As K increases, the possibility of the slope instability rises.
The equation of the cumulative displacement is proposed based on the accurate numerical simulation which is nearly close to the in-site monitor.
4. Discussions
According to the measured data, there are several sliding bodies developed at the typical high liquid limit geotechnical sites in this paper, which are imbricate landslides. The instability mechanism is mainly due to the softening of high liquid limit soil water on the top surface of bedrock caused by rainfall, which leads to the instability of the slope along the water level. The numerical model is in good agreement with the in-site monitoring data, and the position and shape of the sliding body are consistent with the in-site monitoring data, which shows the accuracy of the model.
24 h short-term rainfall has little effect on the slope stability, while over 48 h long-term rainfall has a great influence on the slope stability. In Group A, after 24 h of rainfall, the slope safety factor decreases by 0.0156. In Group B, the safety factor decreases by about 0.0695 after 96 h of rainfall. With the increase of rainfall for 24 h, the safety factor of Group C decreases by an average of 0.0408, and with the increase of rainfall time, the safety factor increases, and the safety factor of 96 h of rainfall in Group C is 0.1249 lower than that of 24 h of rainfall.
The influence range of rainfall infiltration is mainly in the shallow layer of the slope; on the other hand, because of the low permeability coefficient of the soil, it is difficult for rainwater to go deep into the position of the deep sliding surface, especially on the suction of the surface matrix. However, with continuous rainfall, the dangerous slip surface of the deep layer of the slope gradually connects with the foot of the top of the slope. Through the strength reduction, we can see that the final failure surface is a surface that runs through the top of the slope, the foot of the slope, and the deep dangerous surface. In addition, the series of the slope does not affect the plastic strain of the slope. The distribution of the most dangerous slip surface of the slope is deep, and the rainfall can only affect the strength of the foot and the top of the slope.
A similar pattern of results was obtained in the cumulative displacement curve of the in-site and the numerical simulation, which ensures the accuracy of the ABAQUS numerical model. In the subsequent construction of this expressway, sensors can be reduced by using the equation or the numerical simulation. But the method is only applicable to the area from K79 + 740 to K80 + 080. During different rainfall times and intensities, the effects of the high-liquid limited soil slope are summarized by numerical simulation. We will carry out some indoor model experiments to improve the applicability of our equation.
The stress path curves at the foot of the slope, the secondary slope, and 3 m below the secondary slope confirm the infiltration front theory, that is, the rainfall infiltration mainly affects the change of shallow strength of the slope.
In further research, some indoor model tests on high liquid limited soil slope will be conducted to establish an evaluation system of slope instability.
5. Conclusions
The instability of the high liquid limit soil slope of the Guang-Le Expressway in Guangdong Province was studied in this paper. Through field measurement and numerical simulation, the mechanism of instability induced by high liquid limit soil slope under rainfall conditions was analyzed.
The longer the rainfall time, the lower the safety factor. The duration of the rainfall and its cumulative effect have a great influence on the safety factor of the high liquid limit soil slope.
To prevent a landslide and plastic failure of the high liquid limit soil slope, the main support can be carried out at the top and foot of the slope, and the anti-slide pile can be driven into the deep layer of the secondary slope.
With the increase in rainfall time and saturation, the pore water pressure increases, and the matrix suction of the shallow soil decreases or disappears. The slope top matrix suction of Group B and Group C decreases by 57.6% and 84.7%, respectively. The greater the rainfall intensity, the greater the slope top matrix suction variation, and the more prone to shallow landslides at the top of the high liquid limit soil slope. With the continuous infiltration of rainfall, the soil moisture content and bulk density increase.
For the high liquid limit soil, it is easy to produce slope instability phenomena such as the surface flow collapse, and the influence on the deep sliding surface is limited.
The K values of slopes are different. The third-grade slope and the second-grade slope are seriously affected, owing to the soil of the third-grade slope and the second-grade slope slipping to the first-grade slope under the rainfall. The in-site monitoring in this study can be speculated by the 48 h of Group B and the 24 h of Group C. The cumulative displacement of the K79 + 880 slope where the sensor is not placed can be known through this method.
In further research, the method in this paper can be used in other slopes induced by rainfall if the material parameters of the soil and slope are known. The limitation is that the method maybe not suitable for saturated soil, and it still needs more research.
Author Contributions
Conceptualization, J.-J.J. and Z.-D.C.; methodology, J.-J.J.; software, J.-J.J. and Z.-D.C.; validation, J.-J.J. and Z.-D.C.; formal analysis, J.-J.J.; investigation, J.-J.J. and Z.-D.C.; data curation, J.-J.J. and Z.-D.C.; writing—original draft preparation, J.-J.J. and Z.-D.C.; writing—review and editing, J.-J.J. and Z.-D.C.; visualization, J.-J.J.; supervision, Z.-D.C.; project administration, J.-J.J. and Z.-D.C.; funding acquisition, Z.-D.C. All authors have read and agreed to the published version of the manuscript.
Funding
This work in this paper was funded by the national key research and development program (Grant No. 2017YFC1500702).
Institutional Review Board Statement
Exclude this statement.
Informed Consent Statement
Not applicable.
Data Availability Statement
All data, models, and codes generated or used during the study appear in the submitted article.
Conflicts of Interest
The authors declare no conflict of interest.
References
- Lu, Z.; Fang, R.; Zhan, Y.; Yao, H. Study on the dynamic deformation of road high liquid limit subgrade soil. Adv. Civ. Eng. 2019, 2019, 1–7. [Google Scholar] [CrossRef]
- Que, Y.; Lin, Y.Q.; Gong, F.Z. Experimental Study on the Performance of Compound Improved HLLS (High Liquid Limit Soil) with Various Curing Agents. Key Eng. Mater. 2017, 753, 300–304. [Google Scholar] [CrossRef]
- Zhang, J.; Fan, H.; Zhang, S.; Liu, J.; Peng, J. Back-Calculation of Elastic Modulus of High Liquid Limit Clay Subgrades Based on Viscoelastic Theory and Multipopulation Genetic Algorithm. Int. J. Geomech. 2020, 20, 04020194. [Google Scholar] [CrossRef]
- Koerner, R.M.; Soong, T.Y. Geosynthetic reinforced segmental retaining walls. Geotext. Geomembr. 2001, 19, 359–386. [Google Scholar] [CrossRef]
- Li, Q.; Wang, Y.M.; Zhang, K.B.; Yu, H.; Tao, Z.Y. Field investigation and numerical study of a siltstone slope instability induced by excavation and rainfall. Landslides 2020, 17, 1485–1499. [Google Scholar] [CrossRef]
- Chatra, A.S.; Dodagoudar, G.R.; Maji, V.B. Numerical Modelling of Rainfall Effects on the Stability of Soil Slopes. Int. J. Geotech. Eng. 2019, 13, 425–437. [Google Scholar] [CrossRef]
- Wang, Y.; Chai, J.; Cao, J.; Qin, Y.; Xu, Z.; Zhang, X. Effects of Seepage on a Three-Layered Slope and its Stability Analysis under Rainfall Conditions. Nat. Hazards 2020, 102, 1269–1278. [Google Scholar] [CrossRef]
- Tang, D.; Li, D.Q.; Cao, Z.J. Slope Stability Analysis in the Three Gorges Reservoir Area Considering Effect of Antecedent Rainfall. Georisk: Assess. Manage. Risk Engineered Syst. Geohazards 2017, 11, 161–172. [Google Scholar]
- Wu, L.Z.; Zhou, Y.; Sun, P.; Shi, J.S.; Liu, G.G.; Bai, L.Y. Laboratory Characterization of Rainfall-Induced Loess Slope Failure. Catena 2017, 150, 1–8. [Google Scholar] [CrossRef]
- He, J.; Wang, S.; Liu, H.; Nguyen, V.; Han, W. The Critical Curve for Shallow Saturated Zone in Soil Slope under Rainfall and its Prediction for Landslide Characteristics. Bull. Eng. Geol. Environ. 2021, 80, 1927–1945. [Google Scholar] [CrossRef]
- Cai, F.; Ugai, K. Numerical Analysis of the Stability of a Slope Reinforced with Piles. Soils Found. 2000, 40, 73–84. [Google Scholar] [CrossRef]
- Cai, F.; Ugai, K. Numerical Analysis of Rainfall Effects on Slope Stability. Int. J. Geomech. 2004, 4, 69–78. [Google Scholar] [CrossRef]
- Yao, Y.; Ni, J.; Li, J. Stress-Dependent Water Retention of Granite Residual Soil and its Implications for Ground Settlement. Comput. Geotechnics 2021, 129, 103835. [Google Scholar] [CrossRef]
- Larsen, M.C.; Simon, A. A rainfall intensity-duration threshold for landslides in a humid-tropical environment, Puerto Rico. Geogr. Ann. Ser. A Phys. Geogr. 1993, 75, 13–23. [Google Scholar] [CrossRef]
- Miao, F.; Wu, Y.; Xie, Y.; Yu, F.; Peng, L. Research on progressive failure process of Baishuihe landslide based on Monte Carlo model. Stoch. Environ. Res. Risk Assess. 2016, 31, 1683–1696. [Google Scholar] [CrossRef]
- Sorbino, G.; Nicotera, M.V. Unsaturated soil mechanics in rainfall induced flow landslides. Eng. Geol. 2013, 165, 105–132. [Google Scholar] [CrossRef]
- Rahardjo, H.; Ong, T.H.; Rezaur, R.B.; Leong, E.C. Factors controlling instability of homogeneous soil slopes under rainfall. J. Geotech. Geoenviron. Eng. 2007, 133, 1532–1543. [Google Scholar] [CrossRef]
- Matsuura, S.; Asano, S.; Okamoto, T. Relationship between rain and/or meltwater, pore-water pressure and displacement of a reactivated landslide. Eng. Geol. 2008, 101, 49–59. [Google Scholar] [CrossRef]
- Skrypnyk, O.; Shapar, A.; Taranenko, O. Determining local wetness conditions within the mined lands using GIS. Min. Miner. Depos. 2020, 14, 53–58. [Google Scholar] [CrossRef]
- Lazar, M.; Apostu, I.; Faur, F.; Rotunjanu, I. Factors influencing the flooding process of former coal open-pits. Min. Miner. Depos. 2021, 15, 124–133. [Google Scholar] [CrossRef]
- Li, Q.; Wang, Y.; Zhang, K. Failure Mechanism of Weak Rock Slopes considering Hydrological Conditions. KSCE J. Civ. Eng. 2022, 26, 685–702. [Google Scholar] [CrossRef]
- Kim, Y.; Rahardjo, H.; Nistor, M.M. Assessment of critical rainfall scenarios for slope stability analyses based on historical rainfall records in Singapore. Environ. Earth Sci. 2022, 81, 39. [Google Scholar] [CrossRef]
- Zhang, Y.; Zhu, Y.; Yan, X. A determination method of rainfall type based on rainfall-induced slope instability. Nat. Hazards 2022, 113, 315–328. [Google Scholar] [CrossRef]
- Zhou, B.; Zhang, Y.; Wei, S. Slope Instability Analysis in Permafrost Regions by Shear Strength Parameters and Numerical Simulation. Sustainability 2022, 14, 9401. [Google Scholar] [CrossRef]
- Scarfone, R.; Wheeler, S.J.; Smith, C.C. Numerical modelling of the application of capillary barrier systems for prevention of rainfall-induced slope instability. Acta Geotech. 2022, 1–24. [Google Scholar] [CrossRef]
- Song, X.; Tan, Y. Experimental investigation on the influences of rainfall patterns on instability of sandy slopes. Environ. Earth Sci. 2021, 80, 1–21. [Google Scholar] [CrossRef]
- Duan, X.; Hou, T.; Jiang, X. Study on stability of exit slope of Chenjiapo tunnel under extreme rainstorm conditions. Nat. Hazards 2021, 107, 1387–1411. [Google Scholar] [CrossRef]
- Richards, L.A. Capillary Conduction of Liquids Through Porous Mediums. J. Appl. Phys. 1931, 1, 318–333. [Google Scholar] [CrossRef]
- Green, W.H.; Ampt, G.A. Studies on soil physics, 1. The flow of air and water through soils. J. Agric. Sci. 1931, 4, 1–24. [Google Scholar]
- Mein, R.G.; Larson, C.L. Modeling infiltration during a steady rain. Water Resour. Res. 1973, 9, 384–394. [Google Scholar] [CrossRef] [Green Version]
- Chen, L.; Young, M.H. Green-Ampt infiltration model for sloping surfaces. Water Resour. Res. 2006, 42, 887–896. [Google Scholar] [CrossRef]
- Van Genuchten, M.T. A closed-form equation for predicting the hydraulic conductivity of unsaturated soils. Soil Sci. Soc. Am. J. 1980, 44, 892–898. [Google Scholar] [CrossRef]
- Fredlund, D.G.; Xing, A. Equations for the soil-water characteristic curve. Can. Geotech. J. 1994, 31, 521–532. [Google Scholar] [CrossRef]
Figure 1.
Location of the study site in mid-eastern Guangdong Province, China.
Figure 1.
Location of the study site in mid-eastern Guangdong Province, China.
Figure 2.
View of the high liquid limited slope: (a) slope panorama, (b) landslide part.
Figure 2.
View of the high liquid limited slope: (a) slope panorama, (b) landslide part.
Figure 3.
Layout of left slope measurement point between K79 + 740 and K80 + 080.
Figure 3.
Layout of left slope measurement point between K79 + 740 and K80 + 080.
Figure 4.
Variations of cumulative displacement with depth at cross-section K79 + 880 in A and B directions: (a) A direction and (b) B direction.
Figure 4.
Variations of cumulative displacement with depth at cross-section K79 + 880 in A and B directions: (a) A direction and (b) B direction.
Figure 5.
Different infiltration conditions during rainfall.
Figure 5.
Different infiltration conditions during rainfall.
Figure 6.
Numerical model section (m).
Figure 6.
Numerical model section (m).
Figure 7.
Hydraulic characteristics curves of unsaturated high liquid limit soil.
Figure 7.
Hydraulic characteristics curves of unsaturated high liquid limit soil.
Figure 8.
Variations of slope safety factors of Groups A, B, and C with suffering rainfall infiltration time: (a) Group A; (b) Group B; and (c) Group C.
Figure 8.
Variations of slope safety factors of Groups A, B, and C with suffering rainfall infiltration time: (a) Group A; (b) Group B; and (c) Group C.
Figure 9.
Variations of Mises stress with rainfall time for Group A (kPa): (a) 0 h; (b) 8 h; (c) 16 h; and (d) 24 h.
Figure 9.
Variations of Mises stress with rainfall time for Group A (kPa): (a) 0 h; (b) 8 h; (c) 16 h; and (d) 24 h.
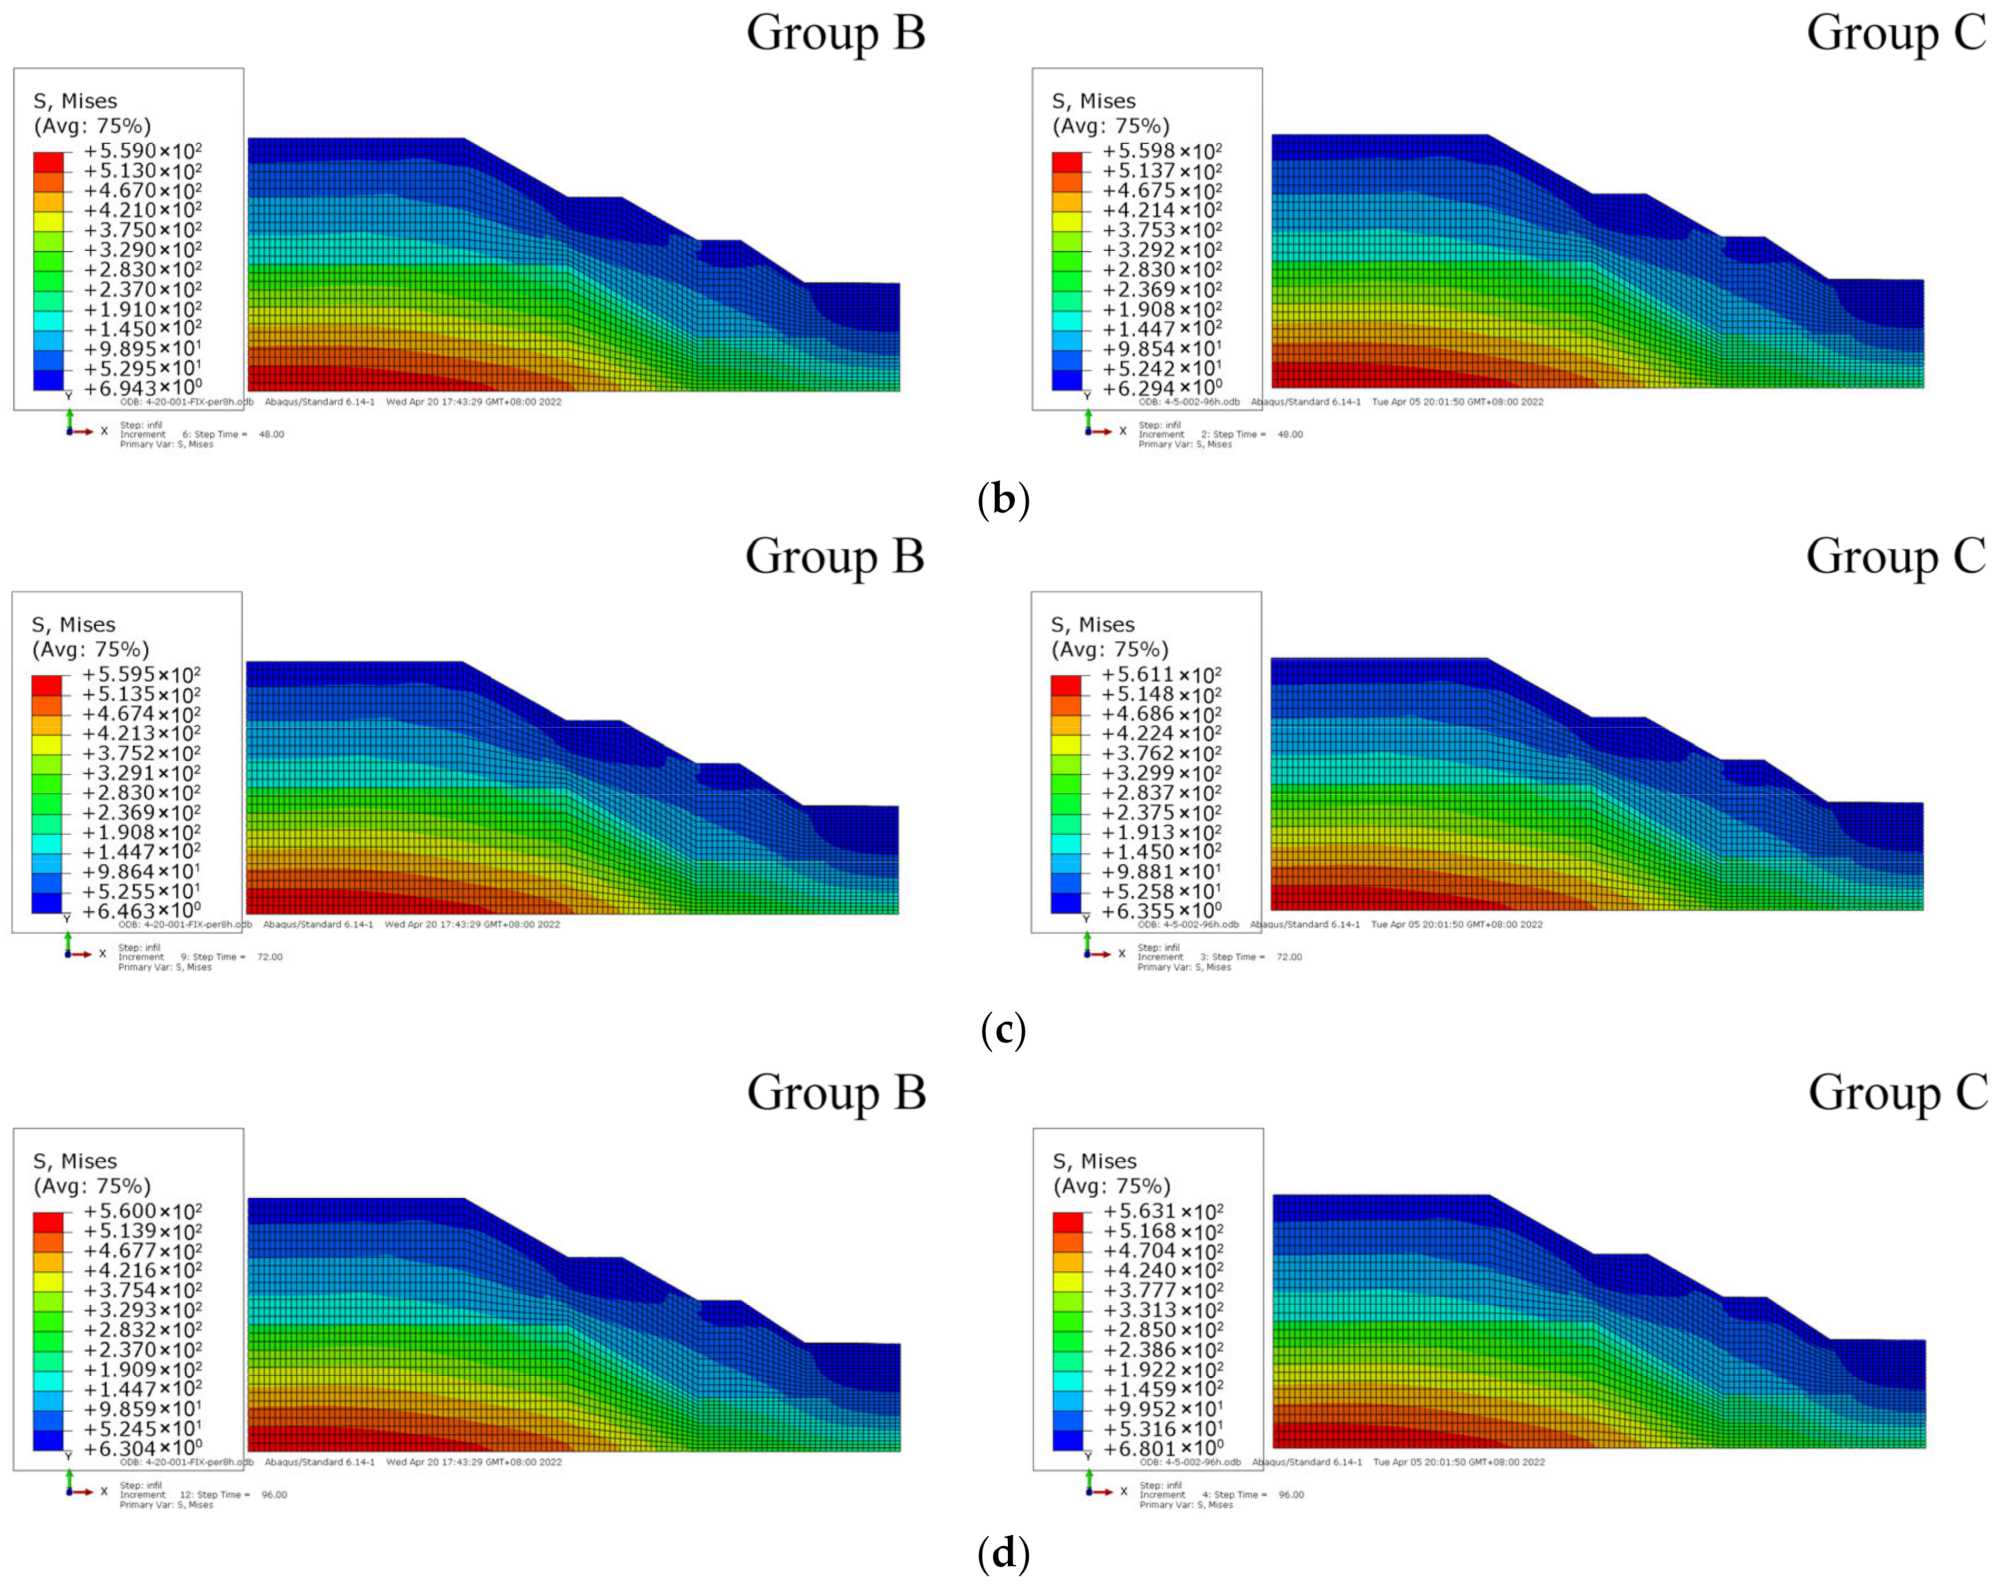
Figure 10.
Variations of Mises stress with rainfall time for Groups B and C (kPa): (a) 24 h; (b) 48 h; (c) 72 h; and (d) 96 h.
Figure 10.
Variations of Mises stress with rainfall time for Groups B and C (kPa): (a) 24 h; (b) 48 h; (c) 72 h; and (d) 96 h.
Figure 11.
Variations of Mises stress at the top and bottom of the slope with the infiltration: (a) slope top and (b) slope bottom.
Figure 11.
Variations of Mises stress at the top and bottom of the slope with the infiltration: (a) slope top and (b) slope bottom.
Figure 12.
Variations of the shear stress with rainfall time at different depths of the slope top.
Figure 12.
Variations of the shear stress with rainfall time at different depths of the slope top.
Figure 13.
Plastic strain area variation nephogram of Group B: (a) 0 h; (b) 96 h; and (c) strength reduced to damage.
Figure 13.
Plastic strain area variation nephogram of Group B: (a) 0 h; (b) 96 h; and (c) strength reduced to damage.
Figure 14.
Cumulative displacement for Group B and Group C at A direction of CX-5 or CX-6 hole (mm): (a) CX-5 for group B; (b) CX-5 for group C; (c) CX-6 for group B; (d) CX-6 for group C.
Figure 14.
Cumulative displacement for Group B and Group C at A direction of CX-5 or CX-6 hole (mm): (a) CX-5 for group B; (b) CX-5 for group C; (c) CX-6 for group B; (d) CX-6 for group C.
Figure 15.
Speculating of CX-4 in-site monitoring data.
Figure 15.
Speculating of CX-4 in-site monitoring data.
Figure 16.
Stress path analysis of Group B (kPa): (a) at the foot of the slope; (b) at the secondary slope; and (c) at 3 m below the secondary slope.
Figure 16.
Stress path analysis of Group B (kPa): (a) at the foot of the slope; (b) at the secondary slope; and (c) at 3 m below the secondary slope.
Table 1.
Physical and mechanical parameters of soil.
Table 1.
Physical and mechanical parameters of soil.
| Soils | Dry Density (g/cm3) | Poisson’s Ratio | Elastic Modulus (MPa) | Cohesion (kPa) | Internal Friction Angle (°) |
|---|
| High liquid limit soil | 1.5 | 0.3 | 10 | 16 | 15.8 |
| Medium-weathered limestone | 2.5 | 0.25 | 3 × 10⁴ | - | - |
Table 2.
Reduction coefficient parameters.
Table 2.
Reduction coefficient parameters.
| Field | Void Ratio | Elastic Modulus (MPa) | Cohesion (kPa) | Internal Friction Angle (°) |
|---|
| 1.00 | 1.0 | 10 | 16 | 15.8 |
| 1.25 | 1.0 | 10 | 12.8 | 12.64 |
| 1.50 | 1.0 | 10 | 10.67 | 10.53 |
| 1.75 | 1.0 | 10 | 9.14 | 9.02 |
| 2.00 | 1.0 | 10 | 8 | 7.9 |
| 2.25 | 1.0 | 10 | 7.11 | 7.02 |
Table 3.
Single factor grouping table.
Table 3.
Single factor grouping table.
| Group Number | Rainfall Duration t (h) | Infiltration Rate v (m/h) |
|---|
| GroupA | 0 | 0.01 |
| 8 | 0.01 |
| 16 | 0.01 |
| 24 | 0.01 |
| GroupB | 24 | 0.01 |
| 48 | 0.01 |
| 72 | 0.01 |
| 96 | 0.01 |
| Group C | 24 | 0.02 |
| 48 | 0.02 |
| 72 | 0.02 |
| 96 | 0.02 |
| Publisher’s Note: MDPI stays neutral with regard to jurisdictional claims in published maps and institutional affiliations. |
© 2022 by the authors. Licensee MDPI, Basel, Switzerland. This article is an open access article distributed under the terms and conditions of the Creative Commons Attribution (CC BY) license (https://creativecommons.org/licenses/by/4.0/).


