Article

Analysis of Freeze–Thaw Response and Pore Characteristics of Artificially Frozen Soft Soil under Combined Formation Seepage

1
Department of Geotechnical Engineering, College of Civil Engineering, Tongji University, 1239 Siping Road, Shanghai 200092, China
2
Key Laboratory of Geotechnical and Underground Engineering, Tongji University, Ministry of Education, 1239 Siping Road, Shanghai 200092, China
3
State Key Laboratory of Frozen Soil Engineering, Northwest Institute of Eco-Environment and Resources, CAS, Lanzhou 730000, China
*
Author to whom correspondence should be addressed.
Appl. Sci. 2022, 12(20), 10687; https://doi.org/10.3390/app122010687
Submission received: 2 October 2022 / Revised: 11 October 2022 / Accepted: 14 October 2022 / Published: 21 October 2022
(This article belongs to the Special Issue Artificial Ground Freezing Technology)

Abstract

:
Artificial ground freezing (AGF) is a widely used method in coastal tunnel construction and reinforcement. With more and more underground construction in coastal areas, clay–sand combined formation, which is common in coastal areas, brings more challenges to AGF. In this paper, the frost–thaw characteristics of soft clay during AFG under the construction of combined formation seepage were studied by model test. It was found that the shape of the freezing curtain changed under the condition of seepage, and the water content of the upper soft soil layer decreased markedly after settlement. Subsequently the micro characteristics of melted soil by CT were also conducted for further mechanism analysis, and it was indicated that the distribution of CT number had obvious segmentation characteristics along the height. Finally, the 3D structure of melted clay was reconstructed, and a method was proposed to calculate freeze–thaw settlement through CT numbers.

1. Introduction

Artificial ground freezing (AGF) is widely used in urban rail transit construction. However, there are many problems in the use of AGF, such as uneven ground settlement, tunnel segment leakage, and so on. Sand clay combination strata are common in China’s coastal areas, and the seepage in the sand layer aggravates the uncertainty of the problems above.
Sudisman [1] found that the existence of seepage delays the closure of freezing curtain. Xiao et al. [2] obtained that the symmetry of frozen walls decreased, and the formation time of the frozen wall increased under the condition of seepage from model test. Wang et al. [3] also reached a similar conclusion through model test. Jian et al. [4] used COMSOL to simulate the formation process of freezing wall under different seepage velocities and found that the freezing temperature field inhomogeneity increases as the initial stratum seepage velocity increases. The maximum thickness of the downstream frozen wall initially increases and then decreases. However, the average thickness of the frozen wall linearly decreases, and when the seepage velocity is greater than 7 m/d, the frozen wall can hardly be formed. Some scholars put forward the concept of critical seepage velocity; that is, when the seepage velocity is greater than this threshold, the frozen curtain does not close. M. Vitel et al. [5] proposed that when the seepage velocity is greater than 2 m/d, the stratum is difficult to be frozen according to their coupled thermo-hydraulic model. Su et al. [6] draw the conclusion that the frozen curtain does not close with seepage velocity up to 2.5 m/d by model test and Bakholdin’s analytic solution of temperature field. Seepage also affects the formed frozen curtain. In sudden seepage, Song et al. [7] found that when the seepage velocity was 0–30 m/d, it caused obvious damage to the upper reaches of the frozen curtain, while the wall was strengthened in the middle and lower reaches to a small extent, but when the flow velocity was more than 30 m/d, the frozen curtain was completely damaged. Reasonable arrangement of freezing pipes increases the critical seepage velocity to adapt to more complex situations. After encrypting the freezing pipes in the range of 120 degrees upstream of the outer ring of the double-loop pipes, Dong et al. [8] shortened the freezing time and increased the thickness of frozen curtain. Liu et al. [9] found that when the freezing pipe layout coincides with the seepage direction, reducing the freezing pipe spacing cannot shorten the freezing time. Coolant properties are also important influencing factors. When the cooling medium is brine, the critical seepage velocity is 1–2 m/d [10]. AGF using liquid nitrogen as refrigeration circulating liquid can be applied when the seepage velocity is 20 m/d and 50 m/d [11].
As a non-destructive testing technology, computed tomography (CT) has been widely used in geotechnical field in recent years [12]. The change of micro-structure in different parts of soil can be measured by the statistical characteristics of CT number [13]. Konrad studied the ice thickness and spacing of different soil in different freezing time through X-ray test [14]. The ice thickness and spacing in frozen soil increase with the decrease of temperature, and the ice thickness and spacing of different types of soil are different. Zhang Shijian [15] reflected the damage of rock through CT image and CT number, studied the relationship between strength change and damage expansion of mudstone and water supply and loading and unloading process, and put forward the concept of damage rate. CT scanning can reduce the extraction of pore data by artificial intervention. Based on genetic algorithm, Liu et al. [16] determined the gray-level threshold of CT image segmentation and achieved the recognition of water, ice, and rock, which assured the digital expression of water and ice content. Lang et al. [17] used a median filtering algorithm to remove the noise of CT image and made it better reflect the complex pore structure in the rocks. More accurate and intuitive data can be obtained by improving the spatial and temporal resolution of CT images, improving image processing software and developing new image reconstruction algorithms [18]. Sun [19], using Avizo, an advanced three-dimensional visualization image processing software application, reconstructed the core by scanning method and made it digitalized and visualized. The reconstructed core mode can show the pore size, pore throat size and connection mode more intuitively, and at the same time, it can get the quantitative distribution state of porosity ratio, matrix skeleton structure ratio and other data. Luo et al. [20] quantified the three-dimensional pore network in soil column by using the improved method through Avizo version 5 software, including the continuous change of pore network along depth, macropore size distribution, network density, surface area, length density, length distribution, average hydraulic radius, curvature, inclination (angle), and connectivity (path number and node density). On this basis, Luo et al. [21] found that large porosity, path number, hydraulic radius, and large pore angle are the best predictors of hydraulic parameters of silty sand.
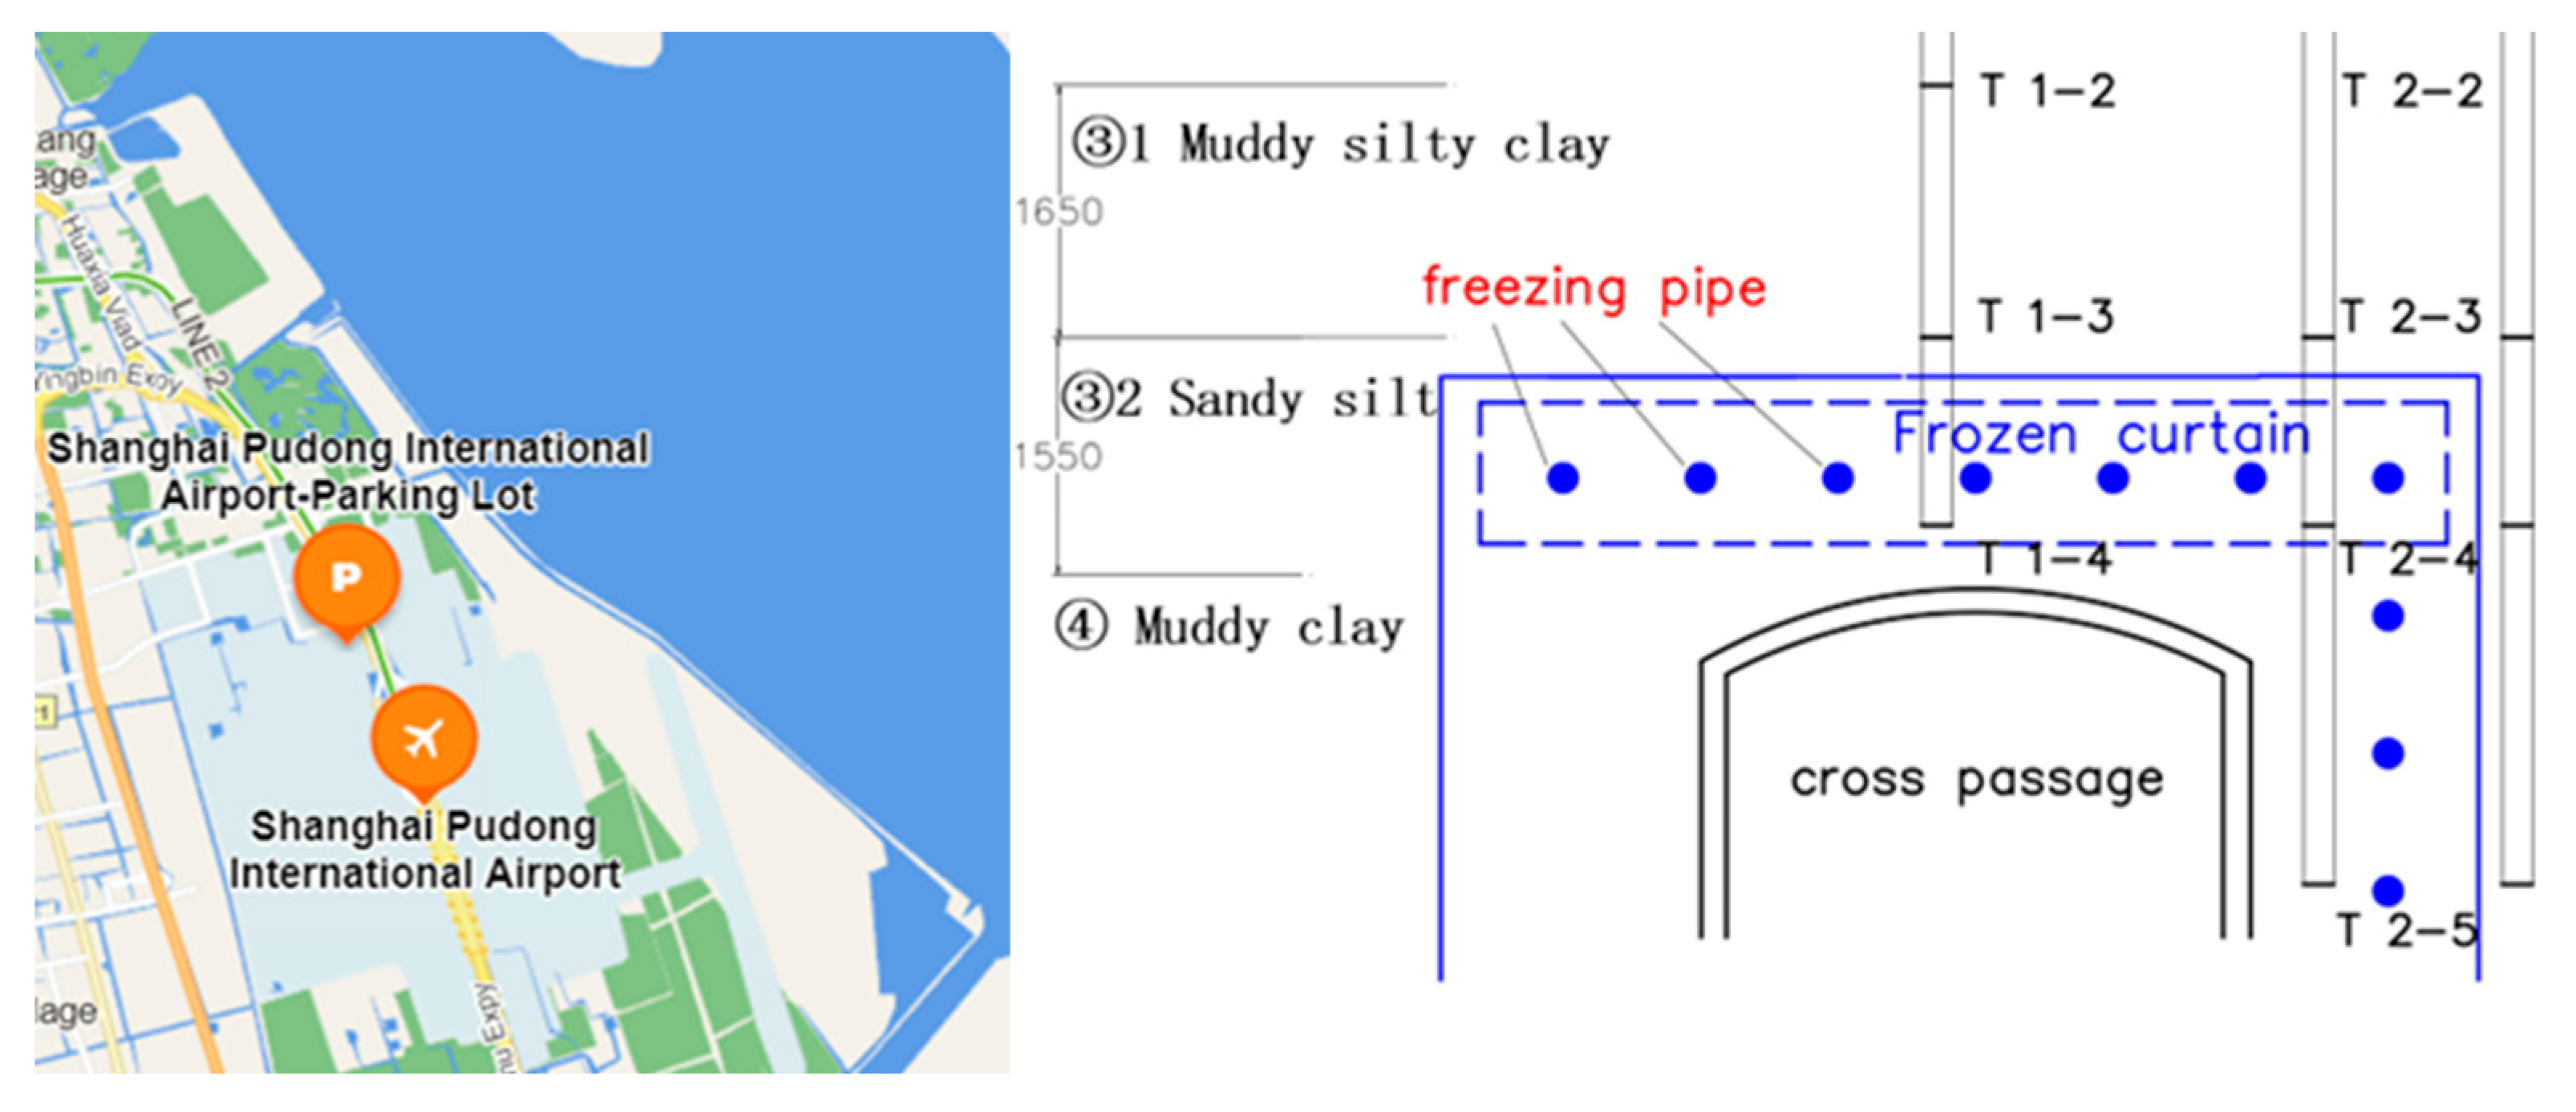
When the construction process of AGF is applied in the clay layer, the boundary conditions (such as temperature boundary and water replenishment condition) with seepage are more complex than the case where there is no seepage. In order to explore the response characteristics of soft clay in AGF construction under the presence of seepage, a model test was designed to obtains the micro characteristics of frozen and thawed soil by CT, and puts forward a settlement calculation method based on CT in this paper.

2. The Model Test Program

2.1. Engineering Background

The AGF project chosen was applied in the cross passage in the Satellite Hall of Pudong Airport. (Figure 1. Left) Freezing pipe crossed the sandy silt layer and mucky clay layer. The top row of freezing pipes was selected as the research object (Figure 1. Right). Table 1 shows the site construction parameters after generalization.
The layer of mucky clay is widely distributed in Shanghai, which is crossed by many underground projects. Mucky clay has the characteristics of high-water content, low strength, and sensitivity to frost heave and thaw settlement, so it is an unfavorable layer which should be emphasized. When designing the model test, considering the most unfavorable factors, the freezing pipes were placed in the mucky clay. The basic physical and mechanical properties of mucky clay are shown in Table 2.

2.2. Model Test Design

The selection of model similarity ratio is very important in model test. Considering the actual conditions in the laboratory and the accuracy of the model test, the geometrical ratio of this model test chosen was CL = 10. According to the above generalized prototype construction model and the selected geometric similarity constants, the similarity ratio of some basic physical quantities can be obtained (Table 3).
The artificial freezing model experimental system we used consists of three parts: a refrigeration system, model test box, and acquisition system. The schematic diagram of the experimental system is shown in Figure 2. The model test box is independently developed, and it can control the velocity of water in the underlying layer of clay (sand layer) at 1.2 m/d, the widespread seepage velocity in the engineering stratum of Shanghai.

2.3. Model Test Process

In the test process, we used remolded soil samples which was similar to the actual construction situation. The mucky clay used was taken from the foundation pit at the southeast corner of the intersection of Tiantong road and Fujian north road in Jing’an District, Shanghai, with a depth of 12.5 m. After laying the sand layer at a thickness of 20 cm at the bottom, the freezing pipes were set up on the upper part and fill the test box with clay. The freezing pipe is set 10 cm above the junction of sand and clay. The water content and degree of consolidation of soil samples are similar to those of undisturbed soil samples by remodeling and compaction.
After the preloading consolidation settlement was stable, we removed the load and started the freeze–thaw cycle. The seepage velocity of the lower sand layer was controlled through the inflow and outflow of water, and collected the data including settlement moisture content and temperature change through the sensor. In order to obtain the physical and mechanical parameters after freeze-thaw, after the test, samples were taken in layers in the model box to measure the moisture content and dry density at different depths. We also explored a method of taking large original soil sample in model box and using CT to analyze the structural characteristics of undisturbed samples.
After the model test, the undisturbed soil was taken out from the model box with a sampler and an iron cylinder, as shown in Figure 3a. The diameter of the iron bucket used for soil borrowing was designed 200 mm high and 127 mm wide. The bottom surface of the undisturbed soil taken out is shown in Figure 3b. The structure of the sample bottom surface is clear, which means this method can maintain the structure of the soil well. Four groups of soil samples were taken, and the sampling locations are shown in Figure 4 and Table 4. After that, the internal structures of soil samples were obtained through CT in the Cold and Arid Regions Environmental and Engineering Research Institute, which is shown in Figure 5.

3. Result and Discussion

3.1. Change of the Temperature Field in Model Test

The original data of temperature field of model test are shown in Figure 6. According to the temperature data in the box, the temperature at each point decreases rapidly after freezing, and the temperature near the freezing pipe decreases most rapidly. After stopping freezing, the temperature of frozen soil increases rapidly in a short time, and there is an interval near 0 °C. When the temperature rises to this interval, the temperature rise rate slows down, which is roughly [−1.4, −0.6]. This is because in this interval, a large amount of ice changes into water and absorbs latent heat. This interval is the main phase change interval of the muddy clay in Shanghai.
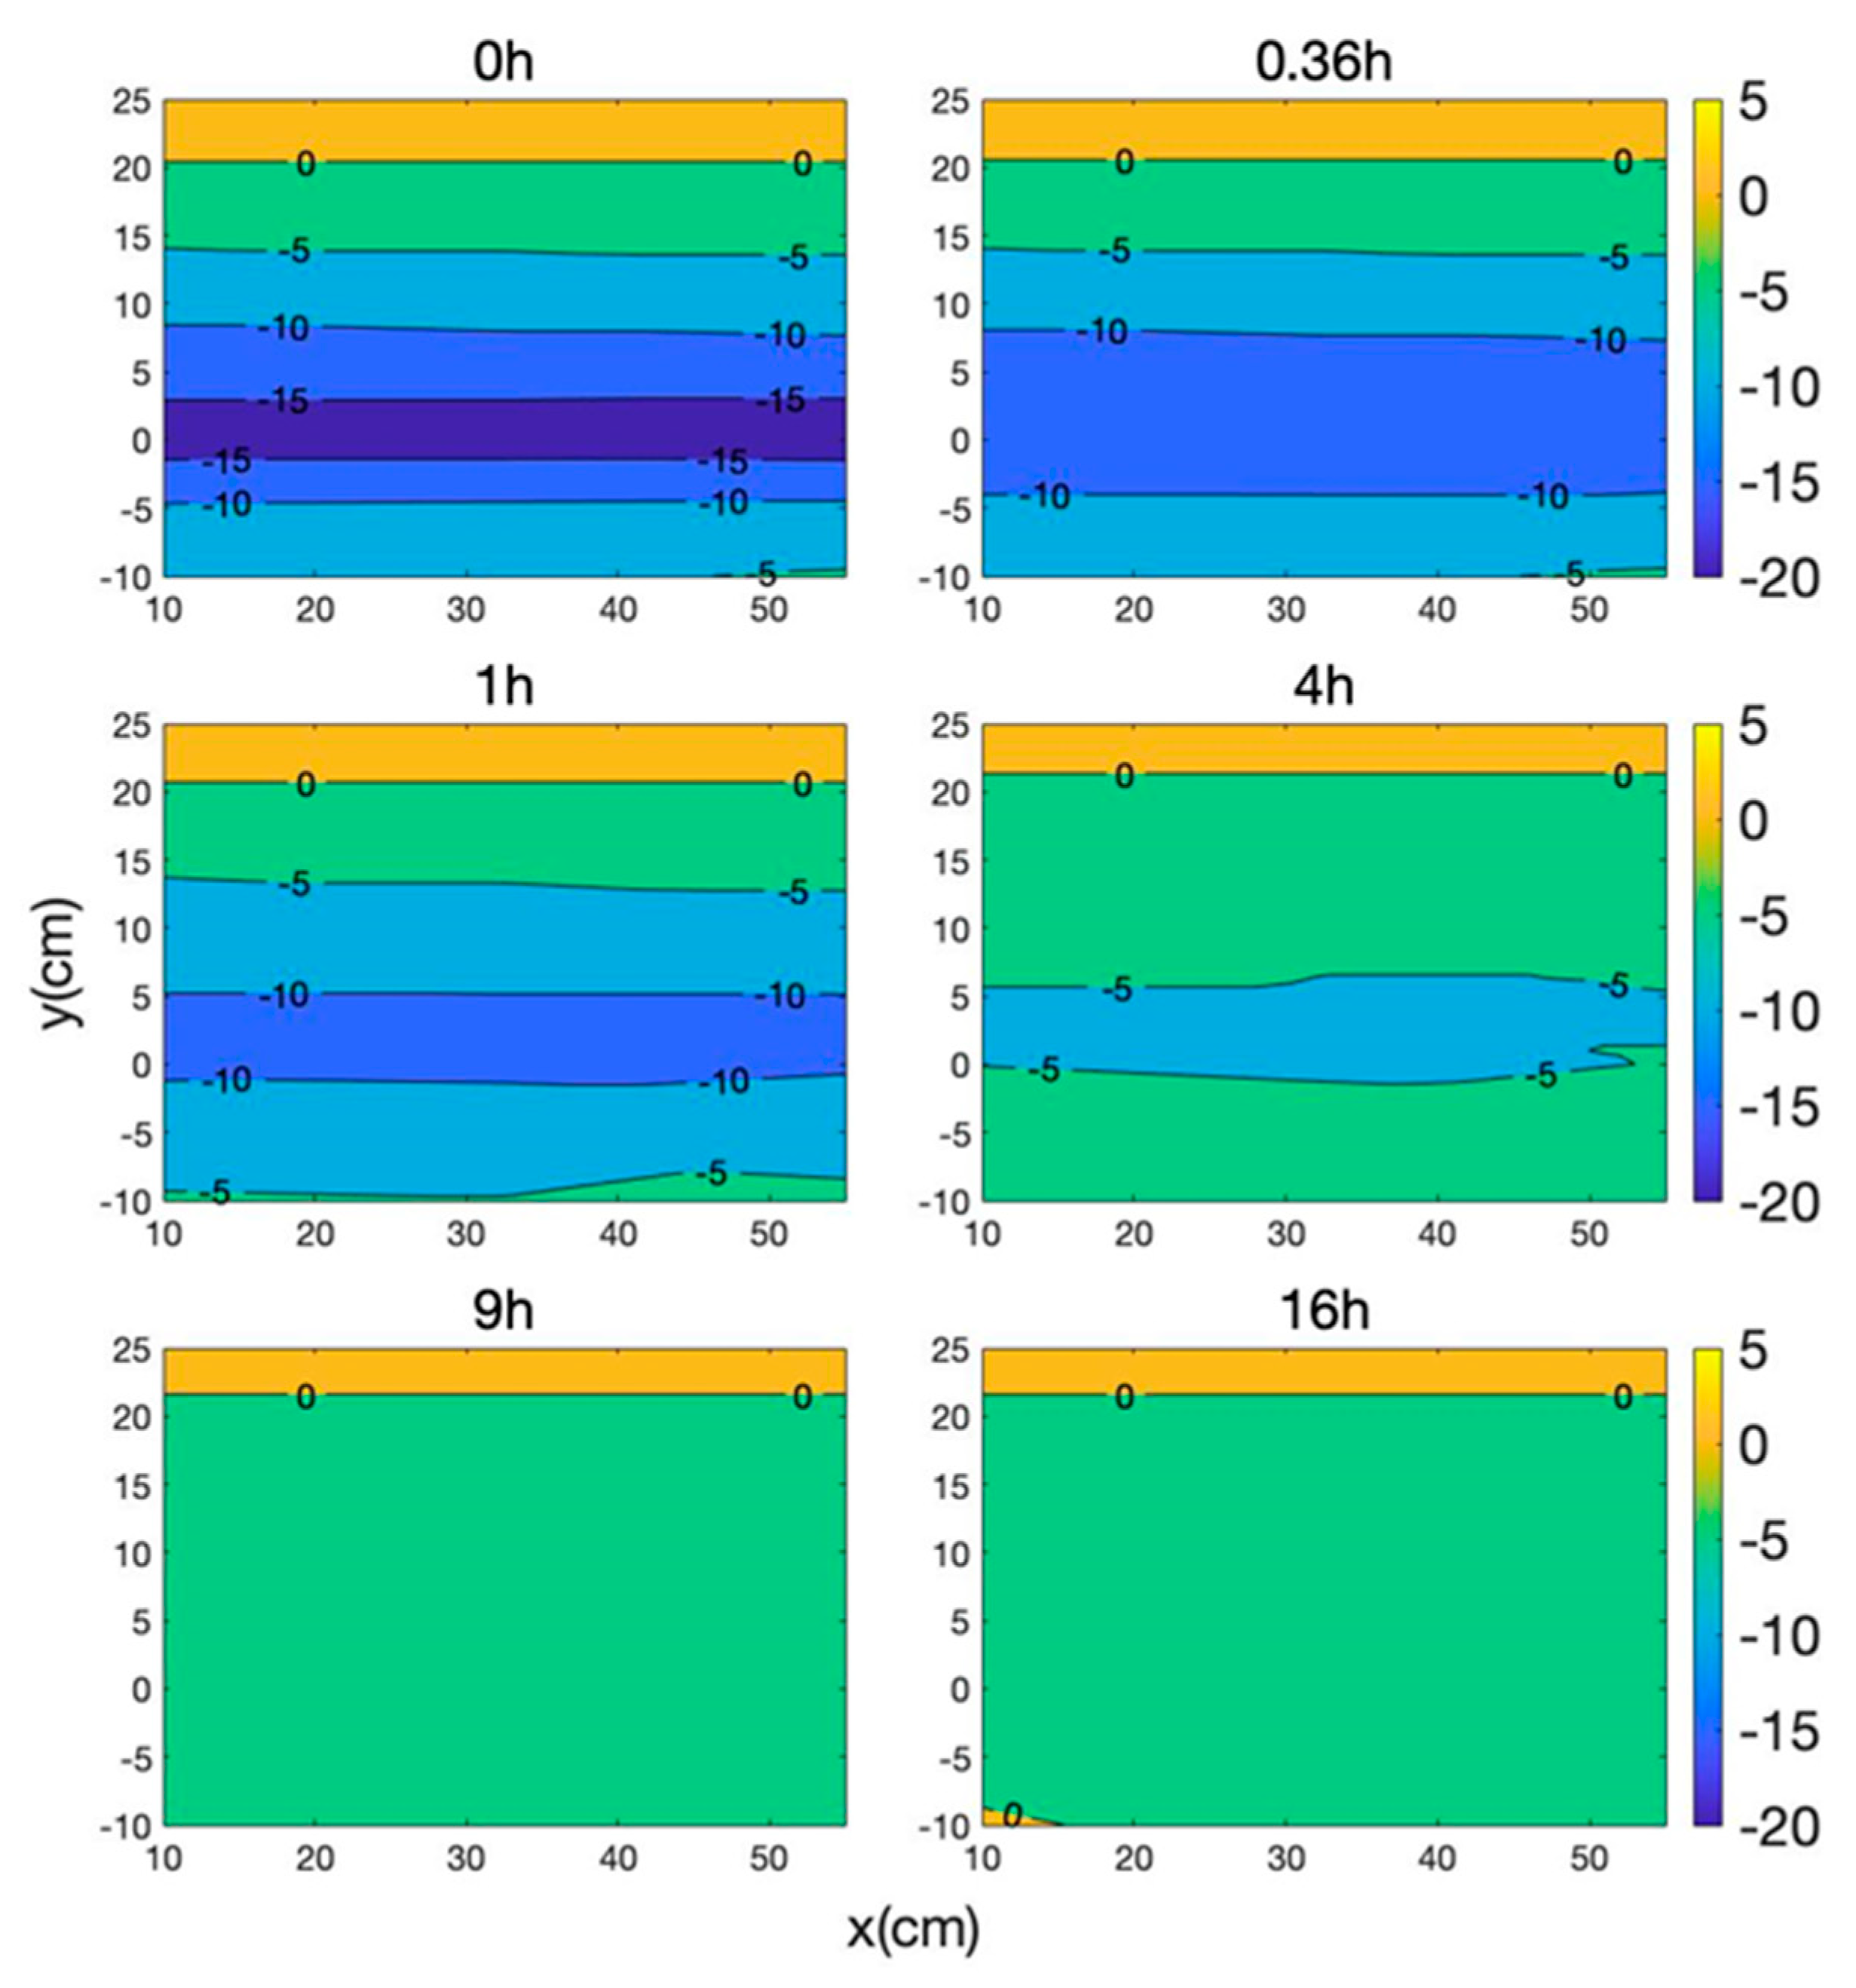
In order to more intuitively show the distribution of the temperature field, the cloudy map of the freezing process is shown in Figure 7 and that of the melting process is shown in Figure 8.
According to the temperature cloudy map in the freezing process box, it can be seen that with the passage of freezing time, the expansion of the freezing front above the freezing pipe becomes slower and slower.
Due to the influence of seepage, the temperature field distribution in the freezing process is not symmetrical about the freezing pipe. At 32 h, the −10 °C isotherm above the freezing pipe is 8 cm away from the freezing pipe, while the −10 °C isotherm below the freezing pipe is only 5 cm away from the freezing pipe. There is strong convection under the freezing pipe, and the freezing curtain is thinner than that above the freezing pipe.
In the freezing process of combined formation with seepage, the heat transfer can be divided into two parts, including heat conduction in clay layer and heat convection at the junction of the clay layer and sand layer. During the freezing process, the temperature at the liquid inlet of the freezing pipe is 5 °C lower than that at the liquid outlet, which causes the temperature of the clay layer near the liquid inlet to be lower than that at the liquid outlet. However, the existence of seepage brings the cold energy of the upstream to the downstream, resulting in the downstream temperature lower than that of the upstream. It can be seen from the test data that under the seepage velocity of 1.2 m/d, the temperature cloudy map in the box shows a “bell mouth” opening into the upstream. The upstream temperature is lower than the downstream, which is particularly prominent at the beginning of freezing. This shows that when the seepage velocity is 1.2 m/d, the influence of heat conduction in clay layer on soil temperature is greater than that of heat convection.
Within 16 h after stopping freezing, the temperature in the area around the freezing pipe increases, and the temperature in the freezing area is gradually uniform, but the area with a temperature less than 0 °C does not shrink. During the melting process, the influence of seepage is more obvious. As can be seen from Figure 8, seepage accelerates the melting of the upstream freezing curtain and brings the cold energy to the downstream, delaying the melting of the downstream.

3.2. Frost Heave, Thawing Settlement, and Change of Moisture Content in Model Test

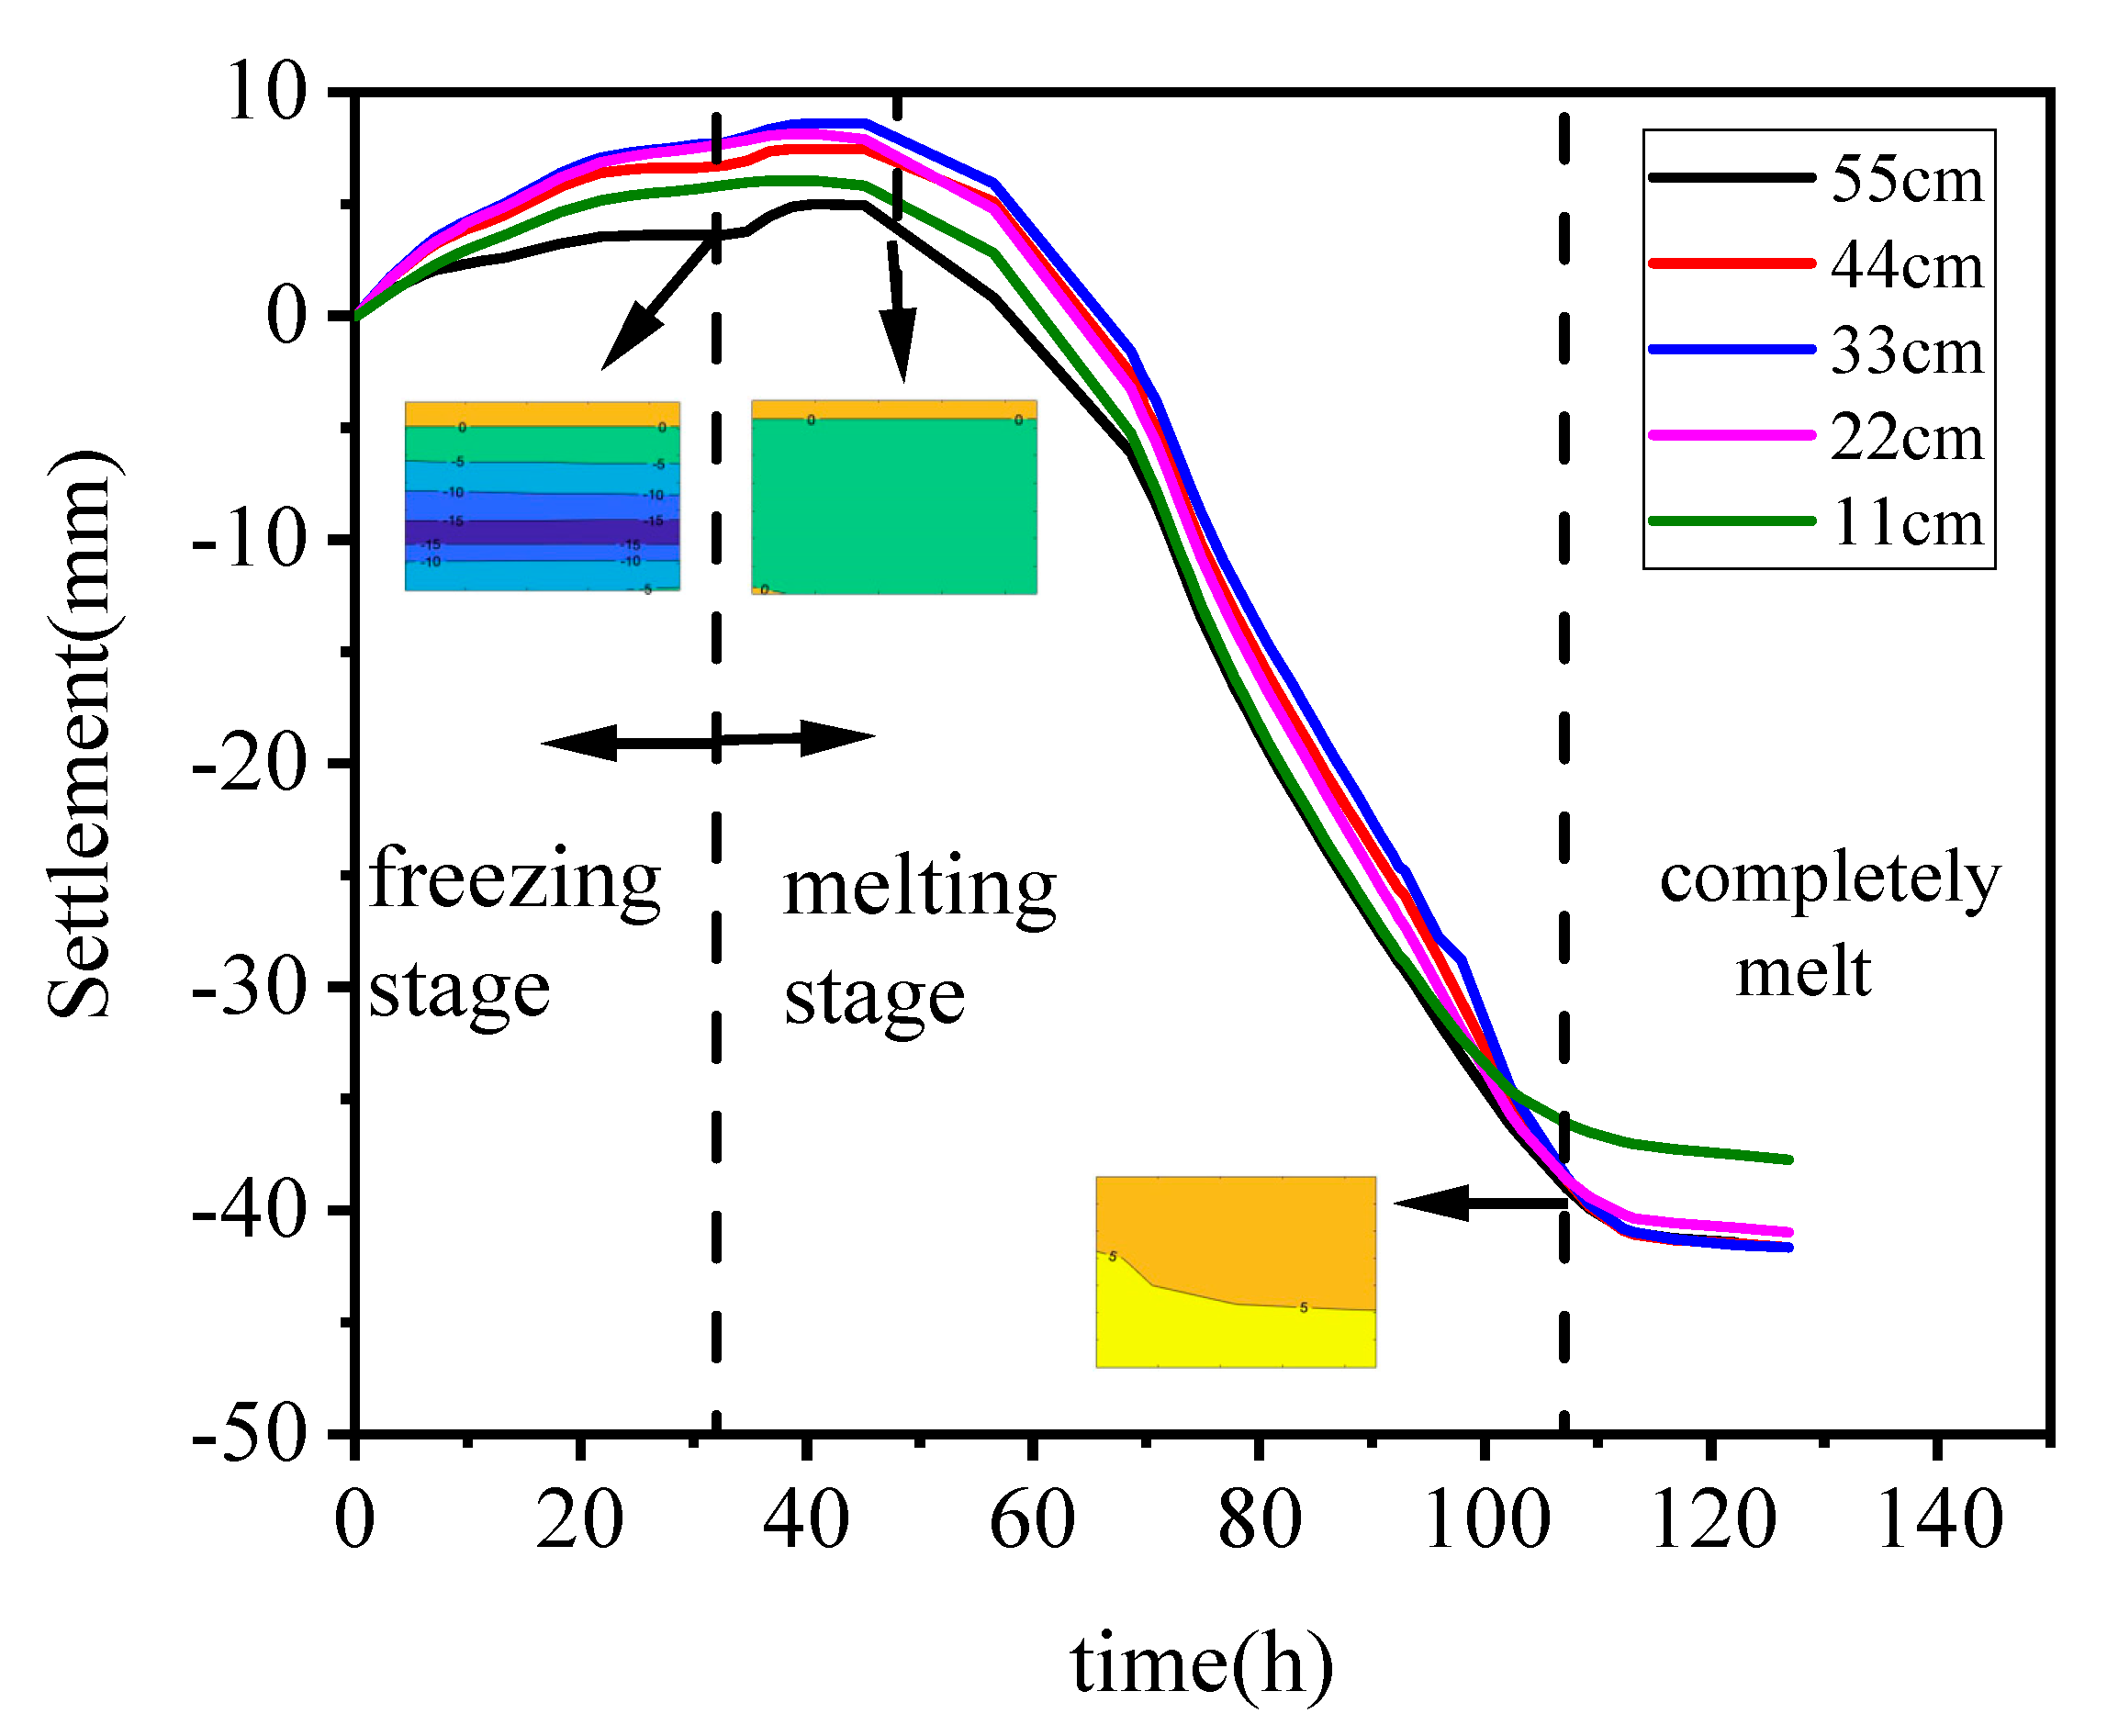
During the test, the surface displacement is monitored, and the frost heave and thaw settlement at different distances from the upstream box wall are shown in Figure 9.
The colored solid lines in the figure above show the surface displacement recorded by dial indicators at different distances from the upstream box wall. The dotted line on the left is the time when the pump is turned off, and the dotted line on the right is the time when the soil in the box is completely melted (the temperature of any part of the model inward is >0 °C).
Frost heave develops with the beginning of freezing, but after freezing stopped, the area of the frozen area did not decrease, and water in the unfrozen area still migrated to the frozen area and changed into ice. After the pump is shut down for about 15 h, the surface heave reaches max, at 8 mm. Then the melting settlement increased to 40 mm, which was much larger than the frost heave. Combined with the cloud diagram analysis, it can be concluded that when there is an area with temperature >0 °C in the frozen clay, the settlement begins to develop rapidly. When the soil in the box is completely melted (the temperature at each point in the box is >0 °C), the settlement tends to be stable in a short time.
The thaw settlement develops first at 11 cm and the settlement reaches stability first, indicating that the area near the upstream melts first and completes the consolidation first under the action of seepage. That also confirms the temperature development trend in the temperature cloud map, the upstream melts first and gradually develops to the downstream area.
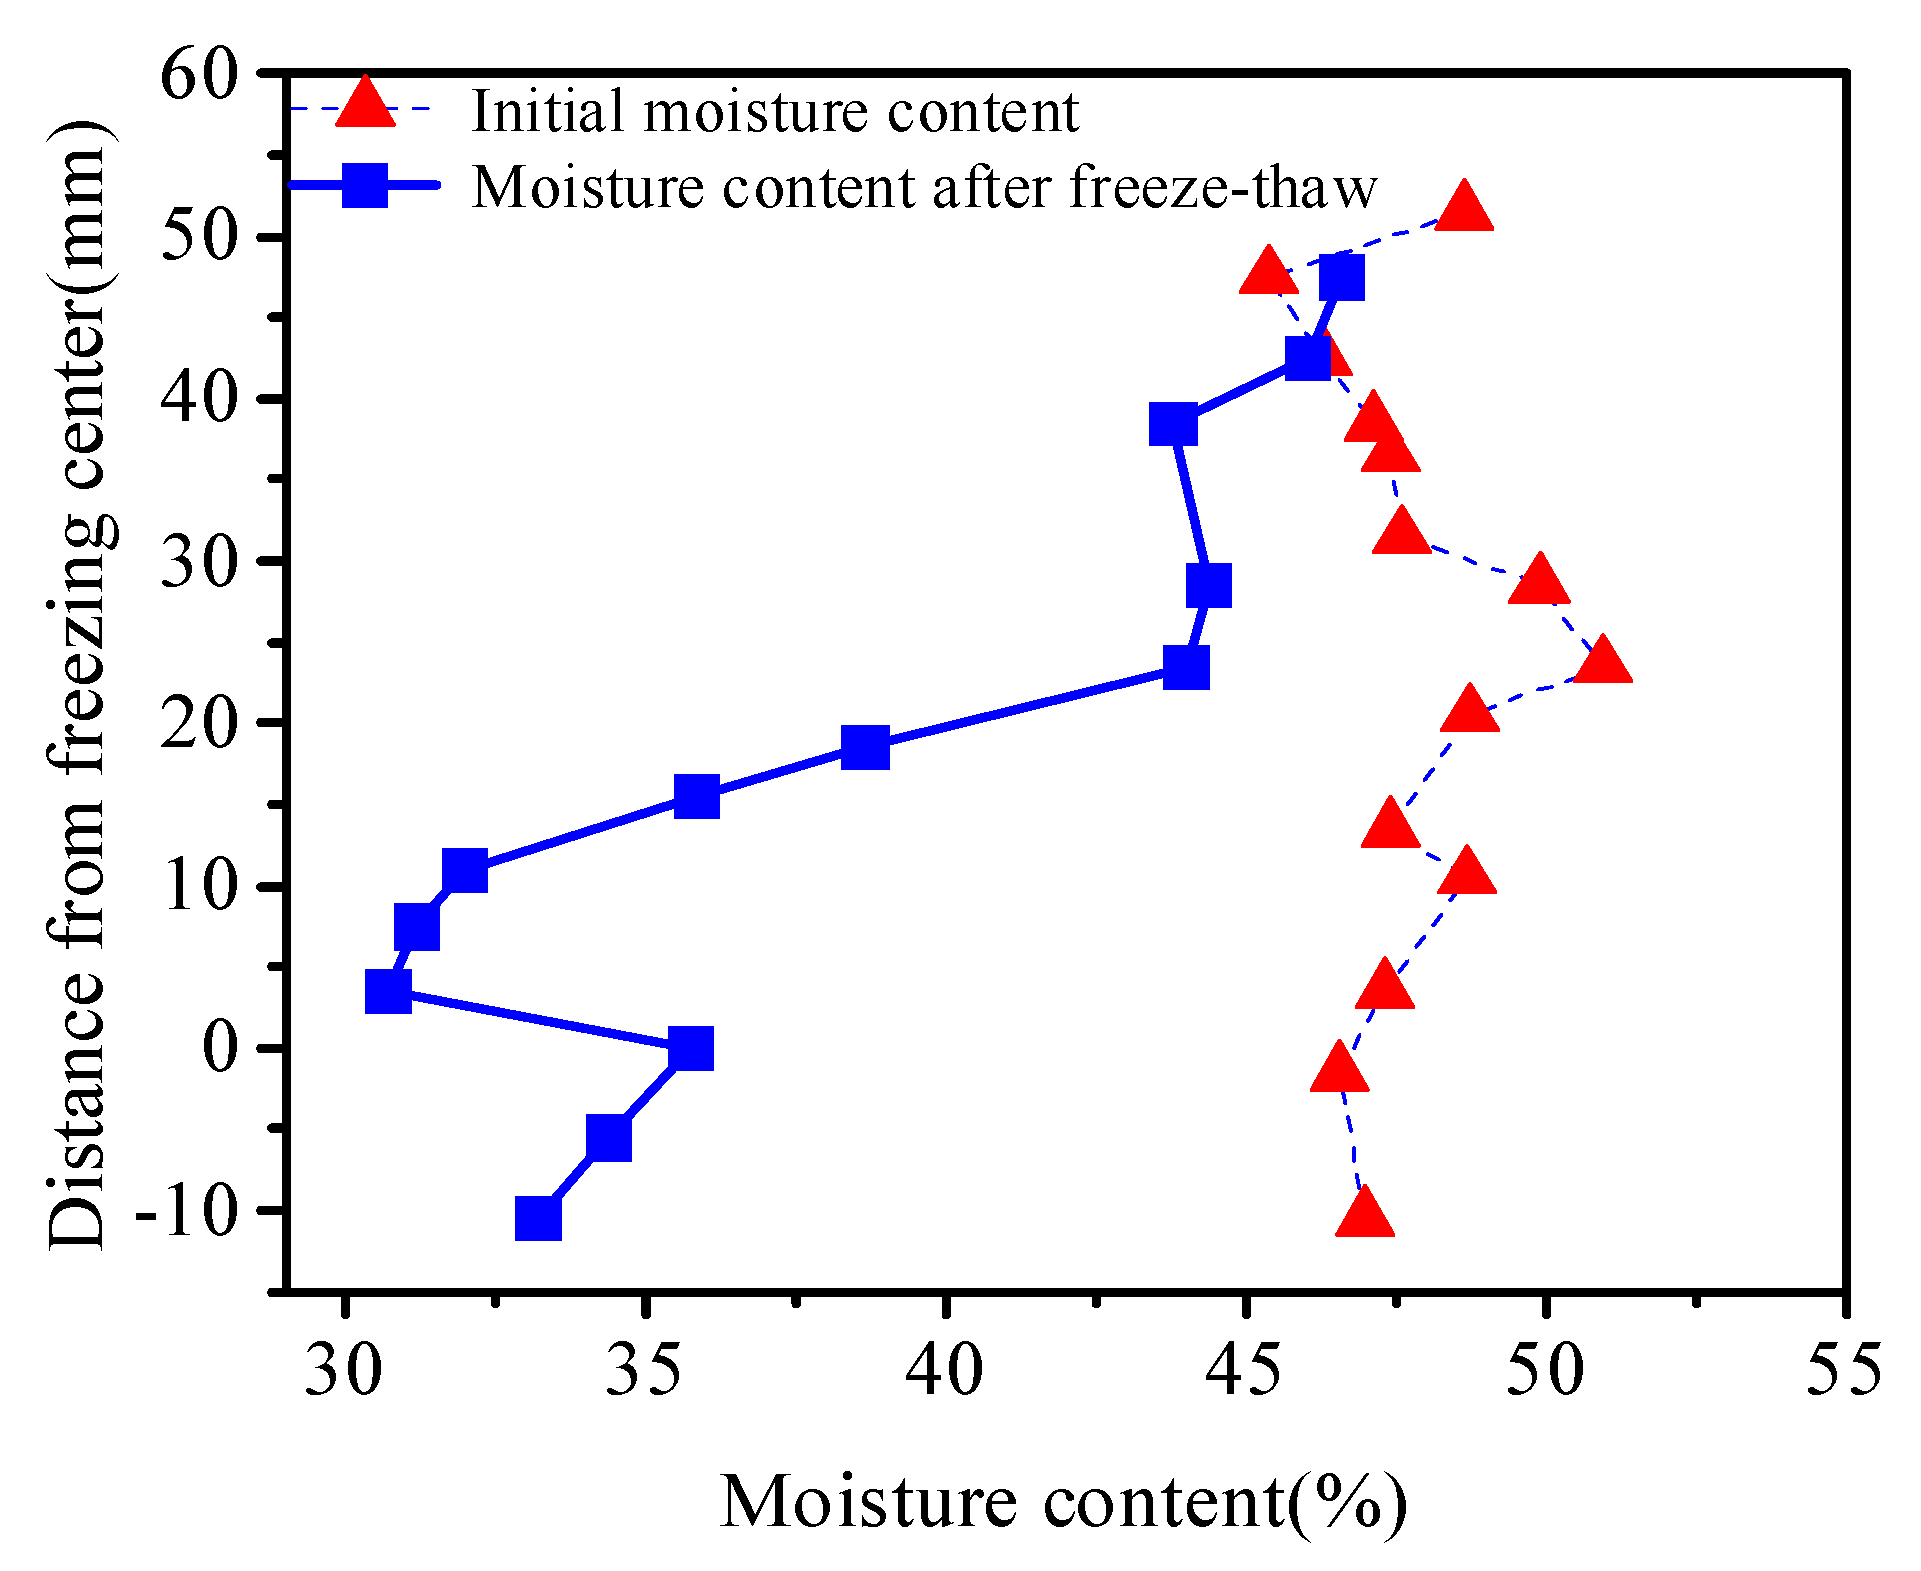
Before and after the test, some soil samples were extracted to determine the moisture content. The test results are shown in Figure 10.
From the water content distribution before and after freezing and thawing, the water content of each soil layer during filling is near the set value of 48%, mainly distributed in the range of 45–50%, which proves that the soil quality of remolded soil is relatively uniform. After the freeze–thaw cycle, the moisture content of the soil layer far from the freezing pipe changes little compared with that of the filling soil. The water content in the frozen area is low, and the lowest water content is only 30%, indicating that a large amount of liquid water in the frozen area is discharged in the melting stage, which is also the cause of melting settlement. Compared with other areas within the freezing range, the water content in the freezing pipe is higher, at 39%. The same trend was also observed in the dry density distribution shown in Figure 11. The dry density increases in the frozen area but decreases in the freezing pipe area.

3.3. Relationship between CT Number and Soil Settlement

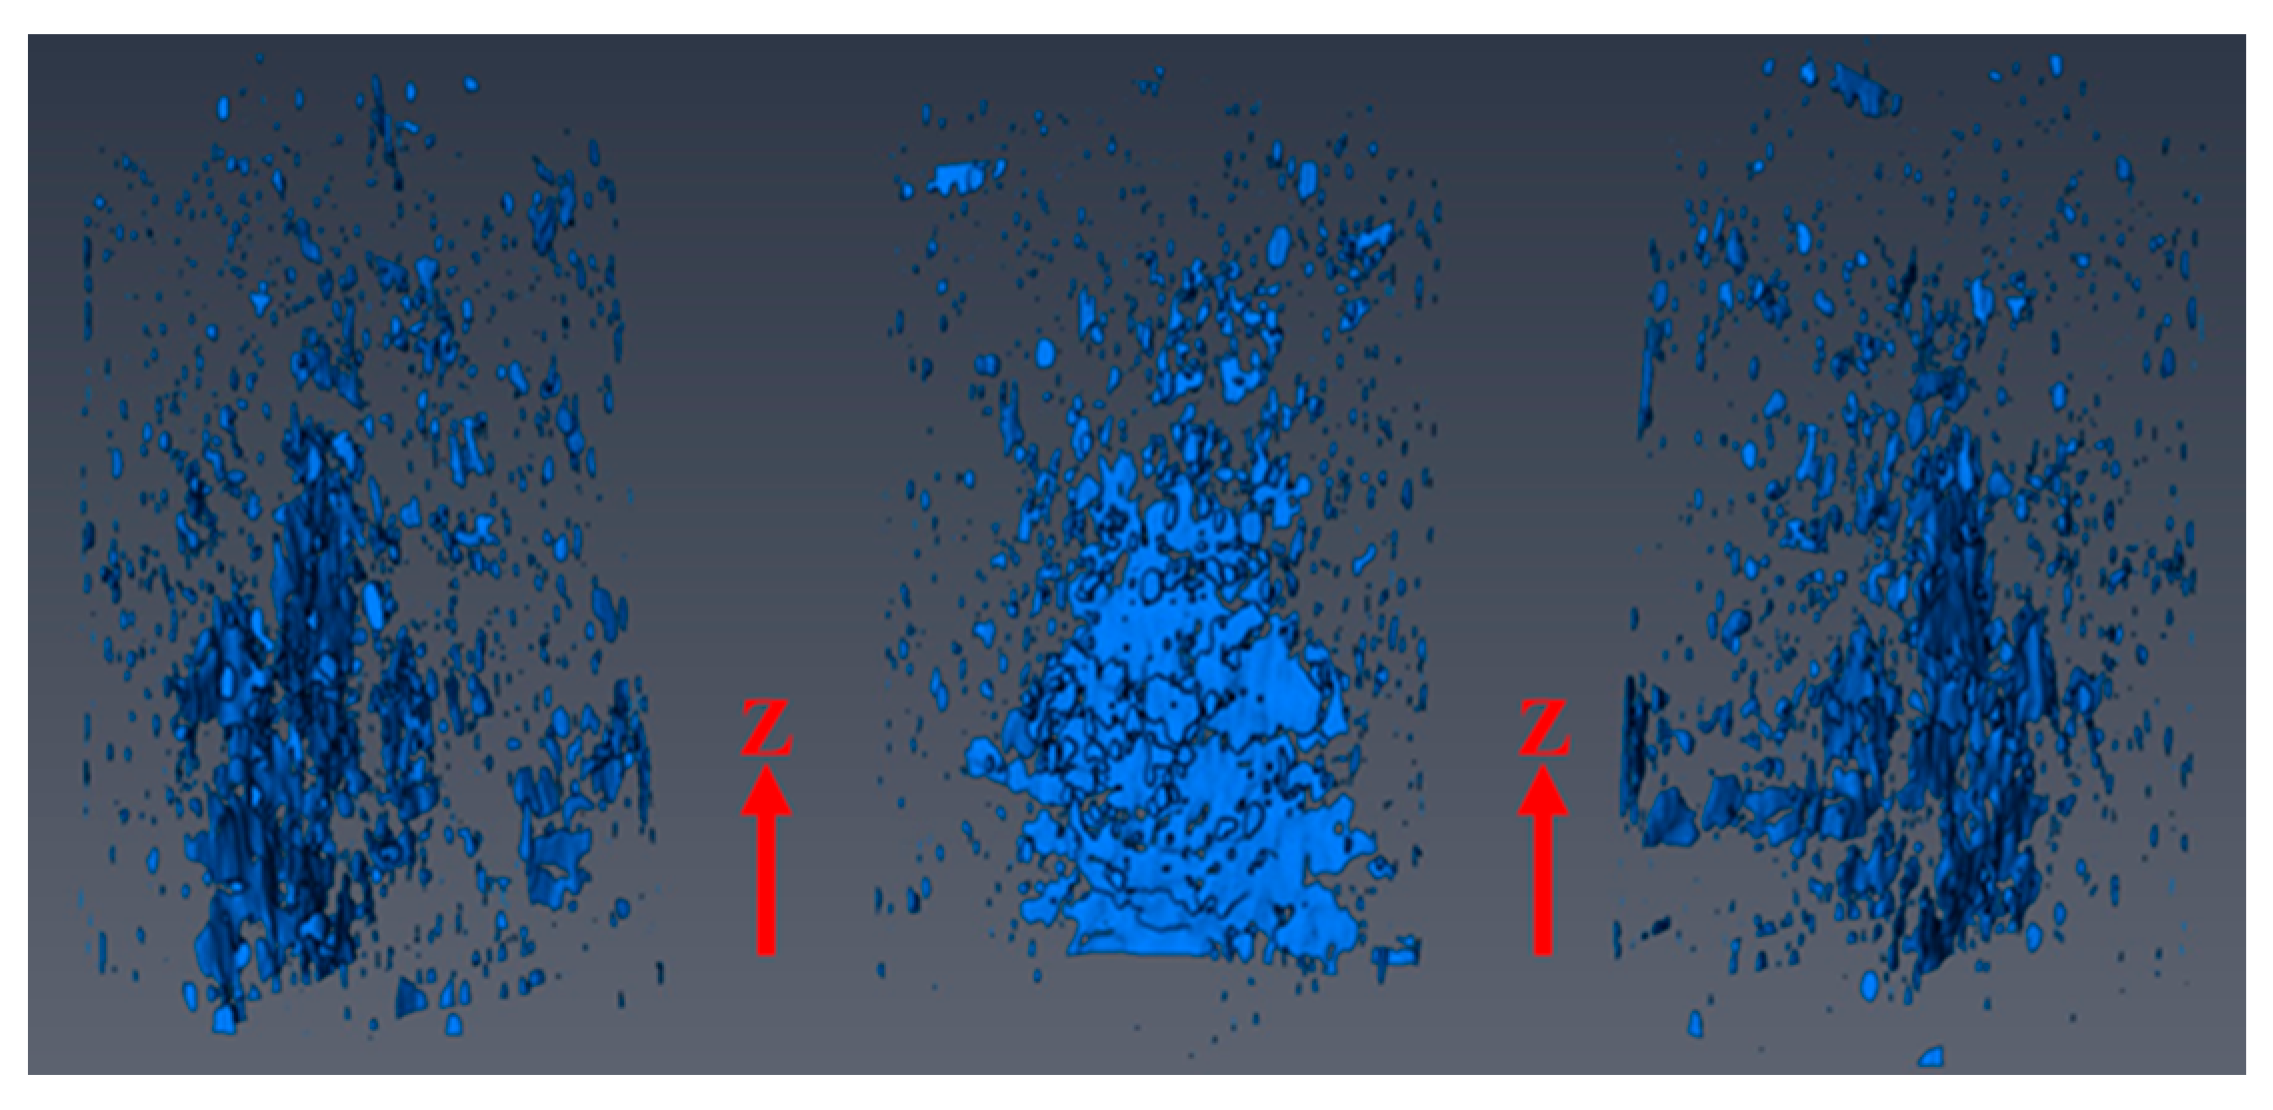
In order to obtain the 3D distribution characteristics of pores in the clay, the software “Aviso” was used to realize the 3D reconstruction of CT image. In order to reduce the error, we selected the region in the red ring as the basis of soil structure remodeling in every CT image, as in Figure 12. The 3D reconstruction results are shown in Figure 13.
As can be seen from Figure 14, the distribution of CT numbers along the height can be divided into three areas:
① The average value of CT number in 0–125 mm area is higher than other areas, the CT number near the freezing front is the largest, and the soil is the densest. There is a linear relationship between CT number CT (H) and height h :
CT H = 0.341 × h + 1199.9
② In the 125–150 mm section, the CT number decreases rapidly with the increase of height. After melting, the final position of the freezing front is 150 mm from the centerline of the freezing pipe. The water in the unfrozen area above the freezing front migrates to the freezing area below the freezing front. The water in the freezing area is continuously enriched during freezing, and the clay drainage consolidation in the melting stage. The relationship between CT number CT (H) and height h in this section is as follows:
CT H = 6.1318 × h + 2010.6
③ In the 150–485 mm section, the CT number in this section decreases slowly with the increase of height. During the freezing process, the moisture in the unfrozen area near the front decreases continuously, the soil loses water and compresses, and the soil layer becomes dense. The CT number in this interval is negatively correlated with the distance from the freezing front:
CT H = 0.261 × h + 1125.8
Actually, the CT number reflects the density of the object. The CT numbers collected from each layer were connect with the dry density and obtained the fitting curve shown in Figure 15.
It can be seen from Figure 15 that there is a good linear relationship between CT number and dry density:
ρ dry = 0.0012 CT H 0.0341
In the above formula, the correlation coefficient R 2 = 0.9483 , so the dry density value can be calculated according to the CT number. It should be noted that in Figure 15, the experimental data at the point near CT (H) = 1150 are missing because the CT number decreases rapidly in the 125–150 mm section away from the freezing pipe, and the interval range is only 25 mm, while the height of the ring knife sample for measuring the dry density is 20 mm, and the dry density is not measured in this interval.
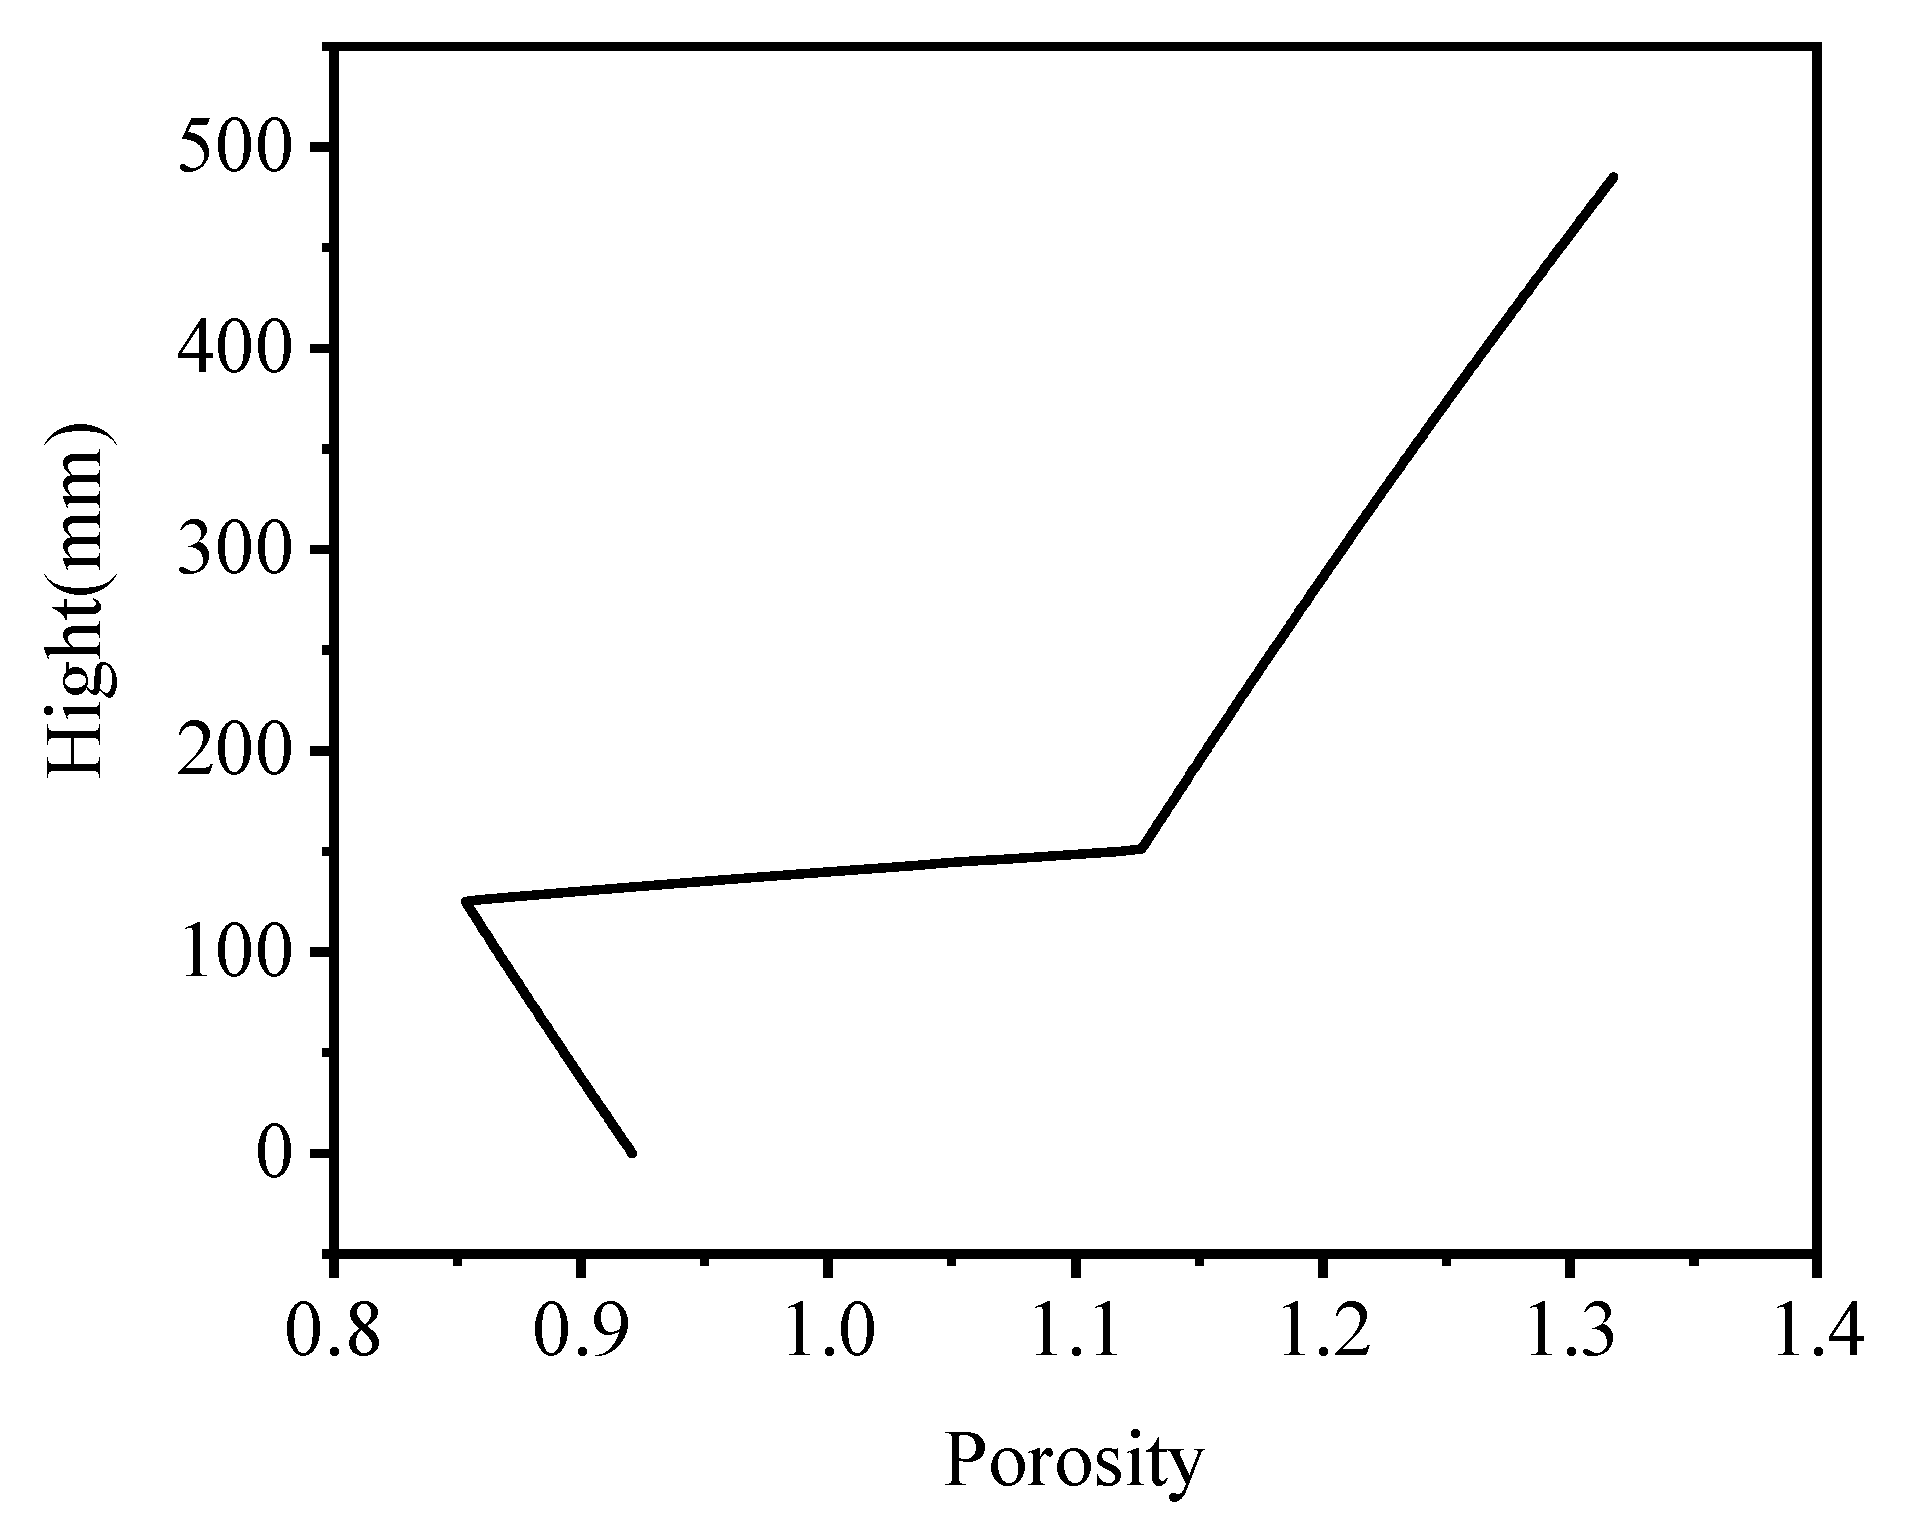
The void ratio e h of soil can be calculated according to the relationship between dry density and height h :
e h = ρ w G s ρ dry h     1
The calculated void ratio distribution along the height is shown in Figure 16.
Without considering the lateral deformation, the thawing settlement of soil belongs to a one-dimensional compression problem:
S = e 1 e 2 1 + e 1 H
where e 1 and e 2 is the void ratio of soil before and after freezing and thawing, and H is the thickness of soil layer.
According to the CT test results, the spatial distribution e h of void ratio along the vertical direction after melting has been obtained, and the melting settlement can be obtained by integration:
S = h 1 h 2 e 1 e h 1 + e 1 h   d h
where h 1 and h 2 are the upper and lower limit height of the frozen area.
The void ratio at the height of h = 485 mm (at the surface) is taken as the initial value e 1 before freezing and thawing. According to the settlement calculated by the void ratio, the settlement of the soil layer (0–485 mm) from the freezing pipe to the surface is 41.2 mm.
It should be pointed out that there is also 100 mm of thick, remolded mucky clay under the freezing pipe in the model test. Theoretically, this part of soil is also greatly compressed during freezing and thawing. However, due to the limitation of sampling conditions, CT samples of 100 mm thick clay under the freezing pipe were not taken. In order to obtain the settlement of this layer, layered settlement markers were buried on the horizontal plane where the center line of the freezing pipe is located during filling. After the test, the height of layered settlement markers was recorded. The compression value of 100 mm thick soil layer under the freezing pipe in the freezing and thawing stage was 5 mm.
The total settlement is 46.24 mm by adding the soil layer compression value above the freezing pipe calculated from the CT test results to the measured compression value below the freezing pipe, and the measured surface settlement is 42 mm. The settlement calculated from CT data is very close to the measured value, indicating that the settlement calculation method proposed in this paper is reliable.

4. Conclusions

In this test, sensors were used to determine the temperature, water content, and dry density at different depths and explored the method of obtaining undisturbed large-scale soil column in the model box, which can well maintain the undisturbed structure of soil sample. The CT tomography tests were also carried out on the soil sample in the model test and obtained the full section CT test data above the freezing pipe. By analyzing all the data, we found that:
  • Seepage has a very significant impact on the thickness of the freezing curtain. In the freezing process, due to the existence of seepage, the freezing curtain on the side near the sand layer below the freezing pipe is 40% thinner than that above. When melting, the seepage brings the upstream cooling capacity to the downstream. The process of drainage consolidation at the upstream is faster than the downstream.
  • The freezing–thawing cycle under the influence of seepage leads to the change of soil moisture content, especially in the area close to the frozen area, the moisture content of soft clay has decreased by 9% to 18%. The decrease of water content before and after freezing–thawing may be due to the fact that pores caused by freezing–thawing cycle promote the settlement of soil layer and then promote the drainage of soil water.
  • The distribution of the CT number along the height has obvious segmentation characteristics, and the CT number in the frozen area is significantly higher than that in the unfrozen area. We combined the CT number with the dry density obtained from the test and proposed a method for calculating the melt settlement according to the CT number and the real settlement of the model test. The calculated value is very close to the measured value, which means that the fitting method is accurate and effective.

Author Contributions

Conceptualization, J.Z. and C.W.; methodology, C.W. and Z.G.; software, Z.L. and H.Z.; validation, Z.G., C.W. and H.Z.; formal analysis, Z.G., C.W. and H.Z.; investigation, Z.G. and C.W.; resources, W.P.; data curation, Z.L. and H.Z.; writing—original draft preparation, C.W. and Z.G.; writing—review and editing, J.Z. and Z.G.; visualization, Z.L.; supervision, J.Z.; project administration, J.Z. and W.P.; funding acquisition, W.P. All authors have read and agreed to the published version of the manuscript.

Funding

The research work herein was supported by the National Natural Science Foundation of China (No. 41702299) and the Foundation of State Key Laboratory of Frozen Soil Engineering (No. SKLFSE201916).

Institutional Review Board Statement

Not applicable.

Informed Consent Statement

Not applicable.

Data Availability Statement

Not applicable.

Conflicts of Interest

The authors declare no conflict of interest.

References

  1. Sudisman, R.A.; Osada, M.; Yamabe, T. Heat Transfer Visualization of the Application of a Cooling Pipe in Sand with Flowing Pore Water. J. Cold Reg. Eng. 2016, 31, 04016007. [Google Scholar] [CrossRef]
  2. Yang, X.; Ji, Z.; Zhang, P.; Qi, J. Model test and numerical simulation on the development of artificially freezing wall in sandy layers considering water seepage. Transp. Geotech. 2019, 21, 100293. [Google Scholar] [CrossRef]
  3. Wang, B.; Rong, C.; Cheng, H.; Cai, H. Experimental investigation on heat transfer law of multiple freezing pipes in permeable stratum with high seepage velocity. Int. J. Heat Mass Transf. 2022, 182, 121868. [Google Scholar] [CrossRef]
  4. Lin, J.; Cheng, H.; Cai, H.B.; Tang, B.; Cao, G.Y. Effect of seepage velocity on formation of shaft frozen wall in loose aquifer. Adv. Mater. Sci. Eng. 2018, 2018, 2307157. [Google Scholar] [CrossRef] [Green Version]
  5. Vitel, M.; Rouabhi, A.; Tijani, M.; Guérin, F. Thermo-hydraulic modeling of artificial ground freezing: Application to an underground mine in fractured sandstone. Comput. Geotech. 2016, 75, 80–92. [Google Scholar] [CrossRef]
  6. Su, Y.L.; Yue, Z.R.; Li, X.K. Model Test Study on Freezing of Sand Layer under Seepage Condition. Railw. Stand. Des. 2020, 64, 94–100+108. [Google Scholar]
  7. Zhang, S.; Yue, Z.; Sun, T.; Han, Y.; Gao, W.; Hu, T.; Han, Y. Evolution laws for frozen wall formation under conditions of sudden seepage. Math. Probl. Eng. 2020, 2020, 8836149. [Google Scholar] [CrossRef]
  8. Dong, Y.B.; Rong, C.X.; Wang, B.; Yang, F. Study on Optimal Arrangement Method of Multi—Circle Frozen Hole Under Action of Large Velocity Groundwater. Saf. Coal Mines 2020, 51, 18–25. [Google Scholar]
  9. Liu, Y.; Li, K.Q.; Li, D.Q.; Tang, X.S.; Gu, S.X. Coupled thermal–hydraulic modeling of artificial ground freezing with uncertainties in pipe inclination and thermal conductivity. Acta Geotech. 2022, 17, 257–274. [Google Scholar] [CrossRef]
  10. Andersland, O.B.; Ladanyi, B. Frozen Ground Engineering; John Wiley & Sons: Hoboken, NJ, USA, 2003. [Google Scholar]
  11. Harris, J.S. Ground Freezing in Practice. Int. J. Rock Mech. Min. Sci. Geomech. Abstr. 1995, 11, 173A. [Google Scholar]
  12. Chen, S.J.; Zhao, S.P.; Ma, W. Studying frozen soil with CT technology: Present studies and prospects. J. Glaciol. Geocryol. 2013, 35, 193–200. [Google Scholar]
  13. Zhao, S.; Wei, M.A.; Zheng, J.F. CT real-time monitoring on frozen Lanzhou loess at different temperatures and under uniaxial loading. Rock Soil Mech. 2010, 31, 92–97. [Google Scholar]
  14. Konrad, J.-M. Frost heave in soils: Concepts and engineering. Can. Geotech. J. 1994, 31, 223–245. [Google Scholar] [CrossRef]
  15. Zhang, S.; Lai, Y.; Zhang, X. Study on the damage propagation of surrounding rock from a cold-region tunnel under freeze—Thaw cycle condition. Tunn. Undergr. Space Technol. 2004, 19, 295–302. [Google Scholar] [CrossRef]
  16. Liu, H.; Yang, G.; Ye, W.; Shen, Y.; Zhang, H.; Tang, L. Analysis of water and ice content and damage characteristics of the frozen rock during freezing based on the three-valued segmentation of CT images. J. Min. Saf. Eng. 2016, 33, 1130–1137. [Google Scholar]
  17. Lang, Y.; Liang, Z.; Duan, D.; Cao, Z. Three-dimensional parallel numerical simulation of porous rocks based on CT technology and digital image processing. Rock Soil Mech. 2019, 40, 1204–1212. [Google Scholar]
  18. Wen, H.; Fan, S.; Ma, L.; Guo, J.; Cheng, X.; Tong, X. CT Scanning Technology on coal-rock damage: A comprehensive review. Coal Sci. Technol. 2019, 47, 44–51. [Google Scholar]
  19. Sun, Z. A Method of Extracting Pore Data of Tight Sandstone Based on 3D CT Scanning Image. J. North China Inst. Sci. Technol. 2020, 17, 6–13. [Google Scholar]
  20. Luo, L.; Lin, H.; Li, S. Quantification of 3-D soil macropore networks in different soil types and land uses using computed tomography. J. Hydrol. 2010, 393, 53–64. [Google Scholar] [CrossRef]
  21. Luo, L.; Lin, H.; Schmidt, J. Quantitative Relationships between Soil Macropore Characteristics and Preferential Flow and Transport. Soil Sci. Soc. Am. J. 2010, 74, 1929–1937. [Google Scholar] [CrossRef]
Figure 1. Prototype location and working condition.
Applsci 12 10687 g001
Figure 2. The schematic diagram of the whole experimental system. (1. Refrigerated circulation pump; 2. Refrigerant inlet; 3. Refrigerated outlet; 4. Upstream flume; 5. Downstream flume; 6. Temperature sensor; 7. Earth pressure sensor; 8. Pore pressure sensor; 9. The clay; 10. Freezing pipe; 11. Sand; 12. Refrigerant; 13. Dial indicator; 14. Acquisition instrument; 15. USB cable; 16. Information processing terminal).
Applsci 12 10687 g002
Figure 3. Sampling in model box. (a) Sampling and (b) sample bottom.
Applsci 12 10687 g003
Figure 4. CT sampling diagram.
Applsci 12 10687 g004
Figure 5. CT scan sample.
Applsci 12 10687 g005
Figure 6. Temperature distribution during the model test.
Applsci 12 10687 g006
Figure 7. Temperature distribution nephogram during the freezing stage (x stand for the horizontal position and y stand for the distance from the freezing center).
Applsci 12 10687 g007
Figure 8. Temperature distribution nephogram during the melting stage (x stand for the horizontal position and y stand for the distance from the freezing center).
Applsci 12 10687 g008aApplsci 12 10687 g008b
Figure 9. Frost heaving and thawing settlement.
Applsci 12 10687 g009
Figure 10. Change of water content.
Applsci 12 10687 g010
Figure 11. Dry density obtained by cutting ring method.
Applsci 12 10687 g011
Figure 12. Image cutting.
Applsci 12 10687 g012
Figure 13. Pore 3D reconstruction results.
Applsci 12 10687 g013
Figure 14. Distribution of CT number along height.
Applsci 12 10687 g014
Figure 15. The relationship between CT number and dry density.
Applsci 12 10687 g015
Figure 16. Void ratio along height.
Applsci 12 10687 g016
Table 1. Simplified site construction parameters.
Prototype ParametersValue
Buried depth of freezing pipe8.8 m
Frozen curtain thickness1.7 m
Freezing pipe length7.3 m
Freezing pipe spacing0.9 m
Number of freezing pipe36
Total flow of freezing pipe200 m3/h
Single pipe flow of freezing pipe5.56 m3/h
Outer diameter of freezing pipe89 mm
Wall thickness of freezing pipe8 mm
Average brine temperature−29 °C
Average temperature of frozen soil−10 °C
Table 2. The basic physical and mechanical properties of mucky clay.
Engineering IndexMucky Clay
Water content, W ( % ) 48.1
Natural bulk density, γ ( kN / m 3 ) 16.9
Specific gravity, Gs2.75
Void ratio, e 1.363
Saturation, Sr ( % ) 97
Liquid limit, W L ( % ) 43.9
Plastic limit, W p ( % ) 23.1
Vertical permeability, K(cm/s)2.19 × 10−7
Table 3. Similarity ratio.
Physical ParametersDimensionSimilarity Constant
Geometric length, l L C L = 10
Density, ρ ML−3 C ρ = 1
Displacement, δ L C δ = C ε C L = 10
Temperature, T Θ C T = 1
Permeability coefficient, k LT−1 C k = C K C ρ C g C μ = 1
Time, t T C t = C L 2 = 100
Table 4. Sampling location.
NumberY1Y2Y3Y4
Height (mm)5–2005–200110–310290–490
Publisher’s Note: MDPI stays neutral with regard to jurisdictional claims in published maps and institutional affiliations.

