Article

Kinetic and Equilibrium Studies of Fe(III) Sorption from an Aqueous Solution Using Palmyra Palm Fruit Fibres as a Biosorbent

by
Suphapan Satchawan
1,*,
Pongthipun Phuengphai
2,
Acharaporn Ratanamanee
3 and
Nonglak Meethong
4
1
Department of Chemistry, Faculty of Science, Chandrakasam Rajabhat University, Bangkok 10900, Thailand
2
Program of Chemistry, Department of Fundamental Science, Faculty of Science and Technology, Surindra Rajabhat University, Surin 32000, Thailand
3
Department of Chemistry, Faculty of Engineering, Rajamangala University of Technology Isan, Khon Kaen Campus, Khon Kaen 40000, Thailand
4
Materials Science and Nanotechnology Program, Department of Physics, Faculty of Science, Khon Kaen University, Khon Kaen 40002, Thailand
*
Author to whom correspondence should be addressed.
Appl. Sci. 2022, 12(20), 10540; https://doi.org/10.3390/app122010540
Submission received: 21 September 2022 / Revised: 12 October 2022 / Accepted: 15 October 2022 / Published: 19 October 2022
(This article belongs to the Topic Advances in Biomaterials)

Abstract

:
This research focused on the removal of Fe(III) ions from an aqueous solution of wastewater through an adsorption process using biosorbents of natural palmyra palm fruit fibres (N–PPF) and chemically modified palmyra palm fruit fibres (C–PPF). BET was used to determine the pore volume and pore size of the biosorbents; the C–PPF was more than N–PPF at 0.01069 cm3/g and 450.2094 Å, respectively. The initial concentration of Fe(III), the adsorbent dosage, solution pH, and contact time for optimal adsorption were investigated for adsorption, and it was found that the dosage of the adsorbent was 2.0 g, pH 4, and 300 min for adsorbent dosage, solution pH, and contact time, respectively. The adsorption data were consistent with the three models, though the Freundlich model provided the best fit. The characteristics for both before/after adsorption were examined by FT–IR, which showed that hydroxyl groups were involved in adsorption. SEM–EDX analysis confirmed the successful increase of containing functional groups during adsorption. Adsorption proceeded according to a pseudo–first–order kinetic model for N–PPF, while the adsorption of C-PPF was according to both kinetic models. It was revealed that Fe(III) adsorption is an exothermic process that occurs on the surface of heterogeneous adsorbents and physisorption. The intra-particle diffusion model is appropriate to explain the rate-controlling step in the Fe(III) adsorption process of natural fibres.

1. Introduction

Heavy metals are becoming an increasingly serious pollutant, as they are prevalent components in wastewater discharges. These discharges tend to accumulate more heavy metals, which have negative direct effects on humans and other forms of life [1]. They are able to penetrate aquatic animals, and discharges occur as a result of industrial activity, such as of the metal plating, fertiliser, battery manufacture, tannery, paper, and chemical industries [2]. Heavy metals are not biodegradable, and toxicity depends on concentration level, which will then be accumulated in the food chain. Humans are the last link in the chain, and thus may suffer a variety of illnesses and other problems. The most dangerous heavy metals are lead and cadmium. In humans, ingestion can cause significant damage to the kidneys, neurological system, bones, and brain [3].
Iron is an essential element in the world. Iron ions are produced by dissolving rocks and soil into groundwater. It can also occur through waste contamination of industrial processes and can be found in municipal waste effluent [3,4]. Iron ions are essential elements for good health, but, like all heavy metals, when adding iron excessively they can be harmful [3,5]. Iron ions that are in heavy metals can cause serious problems in the environment, humans and animals, including diarrhoea, anorexia, metabolic acidosis, hypothermia, oliguria, diphasic shock, and even death [6]. In addition, receiving a large amount of iron will cause acute toxicity to the liver, kidney, heart, brain, spleen, adrenal glands and thymus gland, and the iron storage of the liver can become cirrhotic and become cancer of the liver [5,7]. Thus, the World Health Organisation and the Thai Ministry of Public Health has set a guideline for iron intake in drinking water at 0.3 mg/L [8].
However, successful decontamination of heavy-metal-containing water through treatment is extremely difficult. The chemical precipitation/coagulation, ion exchange, solvent extraction, electrolysis and adsorption are currently being used for pollutant removal from aqueous medium [3,4,9,10,11]. Adsorption is a wastewater treatment method in which pollutants, such as ions, atoms, and molecules, are removed onto the surface of adsorbents. Because of its low cost, adsorption has become the most commonly utilised technology. However, commercial adsorbent materials are exorbitantly expensive. Therefore, they tend to only be used in limited circumstances [5,6,7].
Many studies have concentrated on the use of natural sorbents as an alternative to conventional ones, taking into consideration both environmental and economic concerns. Previously, activated carbon was typically utilised as an adsorbent, despite the fact that it was more expensive than alternative materials. Since then, a significant amount of studies have been performed on the use of low-cost agricultural products and byproducts as adsorbents for heavy metal removal. Fruit peels, peat, rice husk, sawdust, sugar beet pulp, and soya bean hulls have been found to be effective agricultural waste adsorbents. Furthermore, related minerals outperformed other adsorbents developed utilising physical and chemical methods for the removal of heavy metals [8,9,10,11,12,13,14].
The major elements of agricultural waste are lignin and cellulose, although it also contains hemicellulose, fatty sugars, starches, water, hydrocarbons, ash, and other substances. When left untreated, agricultural waste is a biosorbent, which can impact a number of problems, including low adsorption capacity, increased chemical oxygen demand, and biological oxygen demand [15,16,17]. Previously, agricultural waste was employed as an adsorbent for Fe(III) adsorption. Rice straw was crushed and microwave-treated with distilled water (0.75 mg/g−1), oxalic acid (0.81 mg/g−1), sulfuric acid (0.86 mg/g−1), and sodium hydroxide (0.59 mg/g−1) to be used as an adsorbent for Fe(III) adsorption [10]. Carbonised rice straw was produced by drying rice straw in an oven at 500 °C. After that, the carbonised rice straw was employed in the Fe(III) adsorption procedure. It is the Langmuir model and the qmax was 58.82 mg/g−1 [3]. Waste from the sugar cane industry was chemically treated and turned into powder for use as an adsorbent in the removal of Fe(III) from sample water as well as to study adsorption. Its sorption fitted well with the Langmuir model and qmax was 18.54 mg/g [18]. Coconut husk is an agricultural waste product that was cut and blended to a particle size range of 0.15–0.5 mm, after which it was treated for use as an adsorbent and in the adsorption process of Fe(III). The Freundlich model was utilized for adsorption [19]. Previous research found that agricultural waste can be crushed and treated, either chemically or by heat until carbonised, for use as an adsorbent. However, the amount of qmax is the same or less, except for rice straw charcoal and sugar cane. This study compares the adsorption of Fe(III) by the fibre of palmyra palms that have been untreated and chemically treated.
Palmyra palms, also known as toddy palms, are mostly grown in Africa, South Asia, and Southeast Asia. The edible mesocarp, or ripe pulp, has a delicate orange-yellow hue that is rich in carotenoids and is considered delicious [20]. The fibre is derived from palm fruit. The chemical components of the fibre include α-cellulase (53.4%), hemicellulose (29.6%) and lignin (17%). Strong alkalis can reduce the quantity of hemicellulose and lignin [21]. The goal of this work was to investigate the removal of Fe(III) by adsorption on natural palmyra palm fruit (Borassus flabellifer L.). First, the equilibrium adsorption was calculated. The adsorption rate was then determined using the batch contact time approach. Certain parameters, such as solution pH and adsorbent dose, have an impact on the adsorption process. The equilibrium adsorption data were simulated using three distinct isotherm models: Langmuir, Freundlich, and Temkin. The results revealed that a simple chemical modification technique could be used to boost the adsorption capacity of biosorbents, resulting in low-cost and locally available natural adsorbents for the removal of Fe(III) ions.

2. Materials and Methods

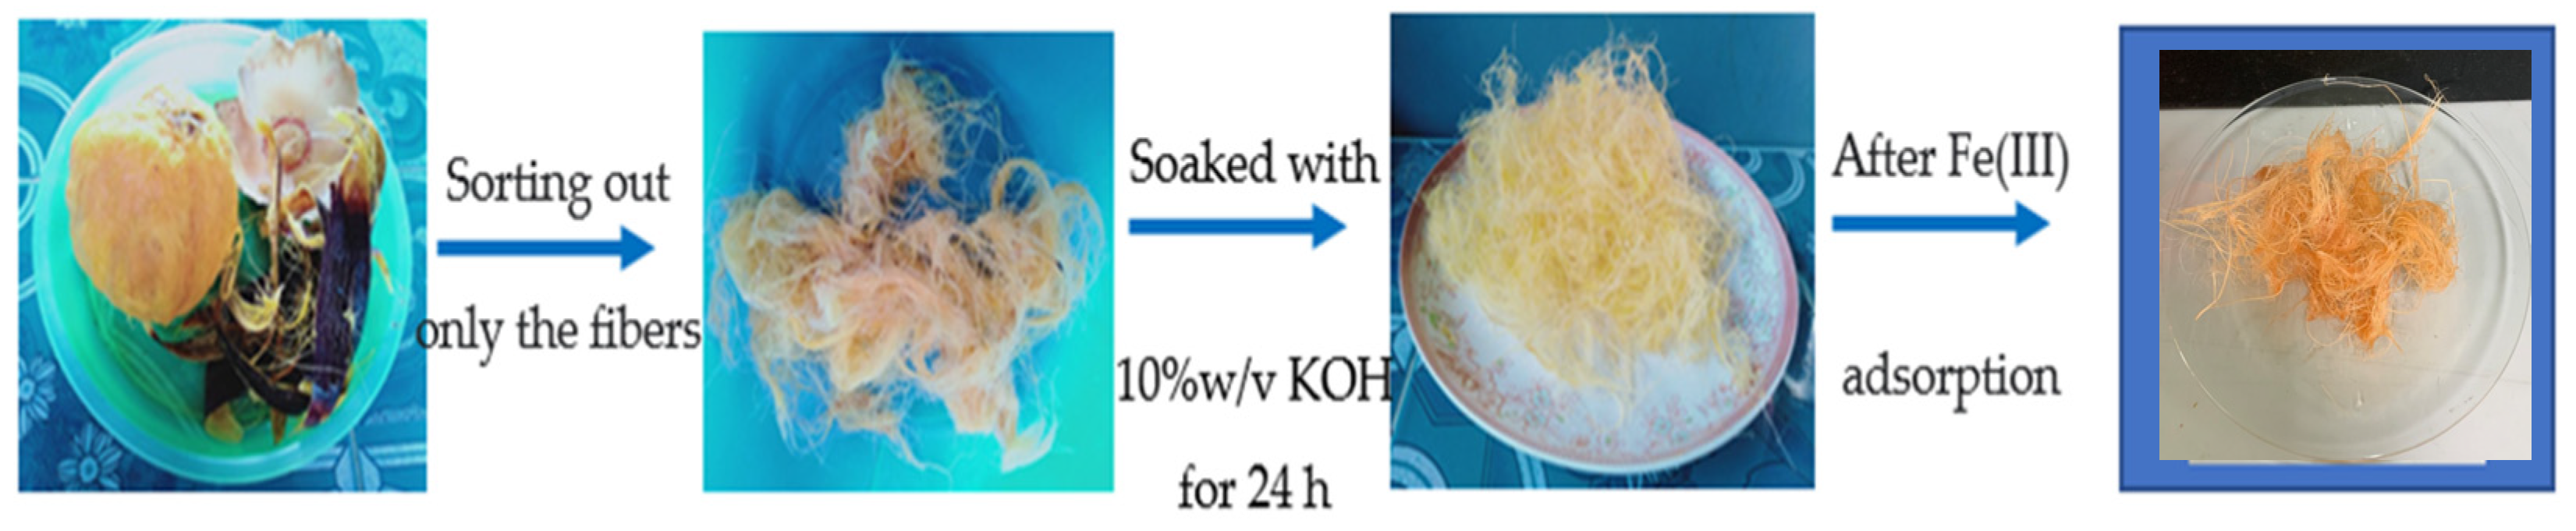
2.1. Adsorbent Preparations

Ripe palmyra palm fruits were gathered from Chainat Province in Thailand, consisting of black peel, fibre, the meat of toddy palm and seed. It was washed gently with tap water to eliminate dirt and water-soluble impurities, after which palmyra palm fruits were extracted by peeling off the black outer skin and removing seeds. Subsequently, water was added, followed by stirring or manual squeezing to remove the meat of the toddy palm from the fibres. After the natural fibres were washed with water, they were dried in an oven at 60 °C for 24 h. The fibres were then divided into two groups: untreated fibres and chemically treated fibres. In this work, the untreated and chemically treated samples are referred to as N–PPF and C–PPF, respectively. The C–PPF sample was produced by soaking natural fibres in 10% w/v 2.5 M KOH for 24 h. The fibres were then filtered and washed several times with DI water to remove the base, the pH of the washing water was measured at 7.87, followed by drying in an oven at 60 °C for 24 h. Both biosorbents were stored in a desiccator. The physical appearance of the biosorbents during the preparation and adsorption processes is shown in Figure 1.

2.2. Synthetic Wastewater

Iron solution was prepared as a 200 mg/L stock solution. A total of 1.404 g of ferrous ammonium sulphate [Fe(NH4)2(SO4)26H2O] was dissolved in 50 mL of DI water, which was mixed with 20 mL of concentrated sulphuric acid. Then, the potassium permanganate (KMnO4) was added to the ferrous ammonium sulphate solution until the mixture became a pink colour. The total stock solution had a volume of 1000 mL [15,16].

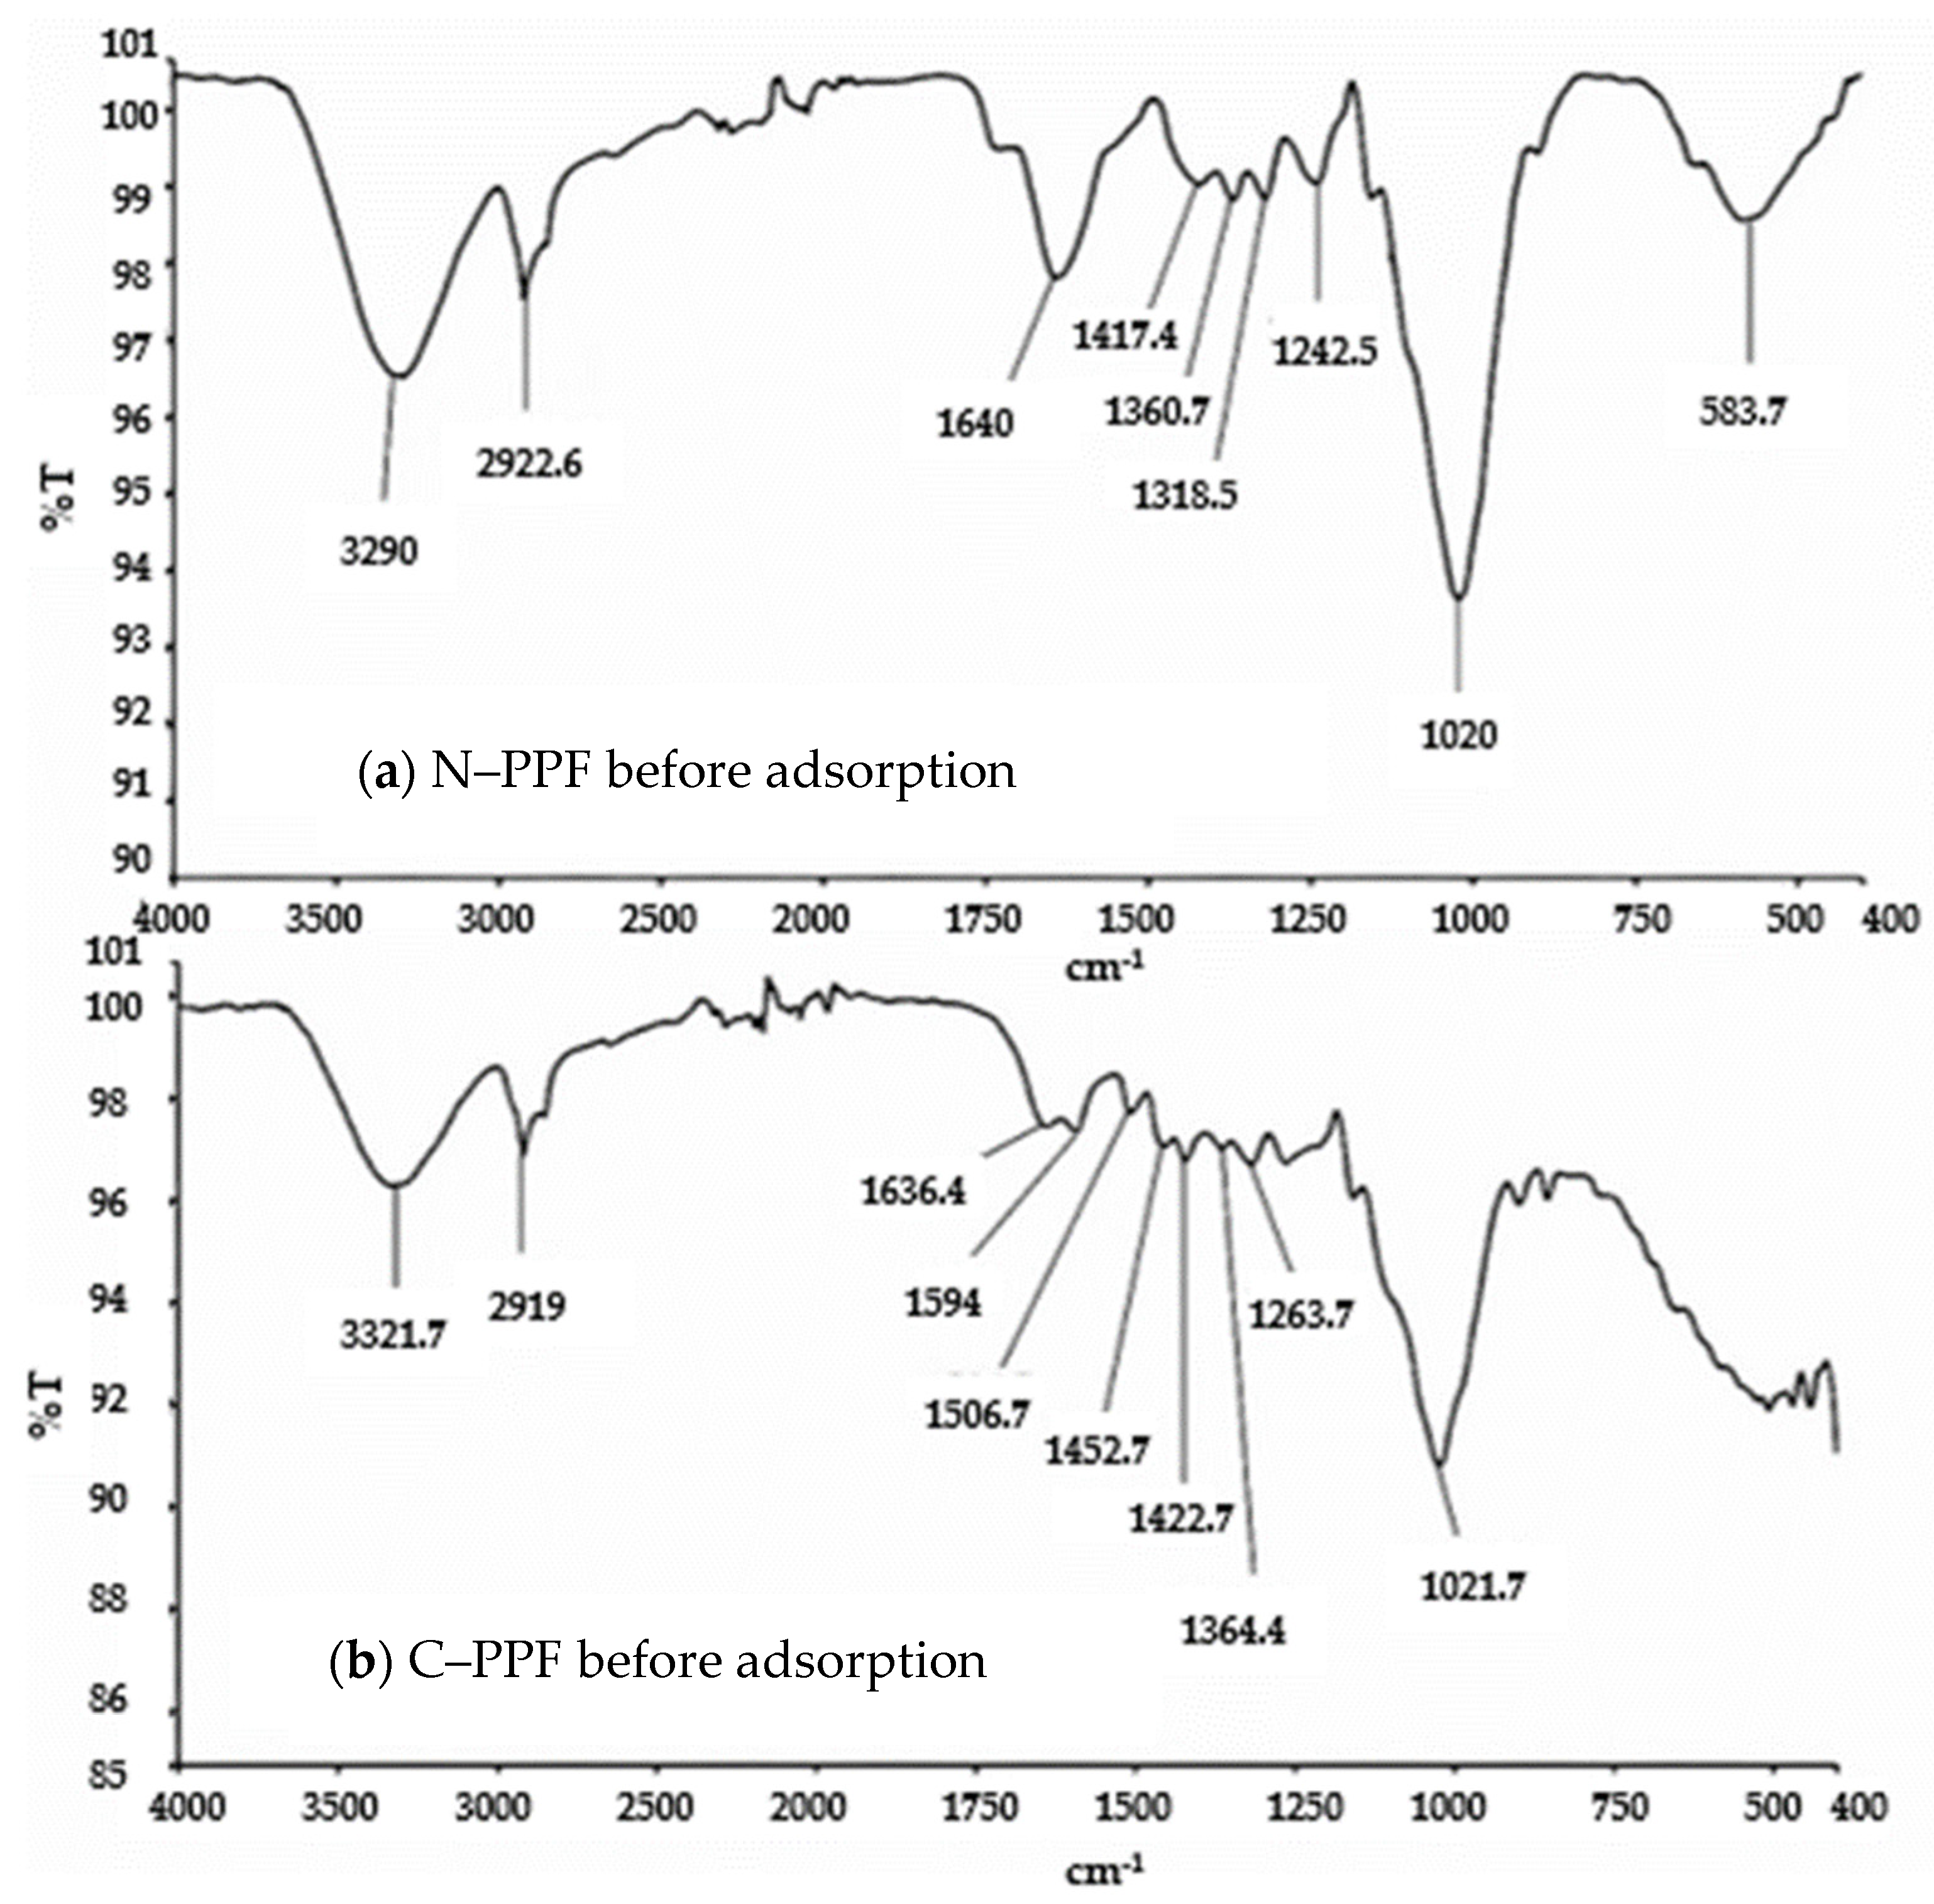
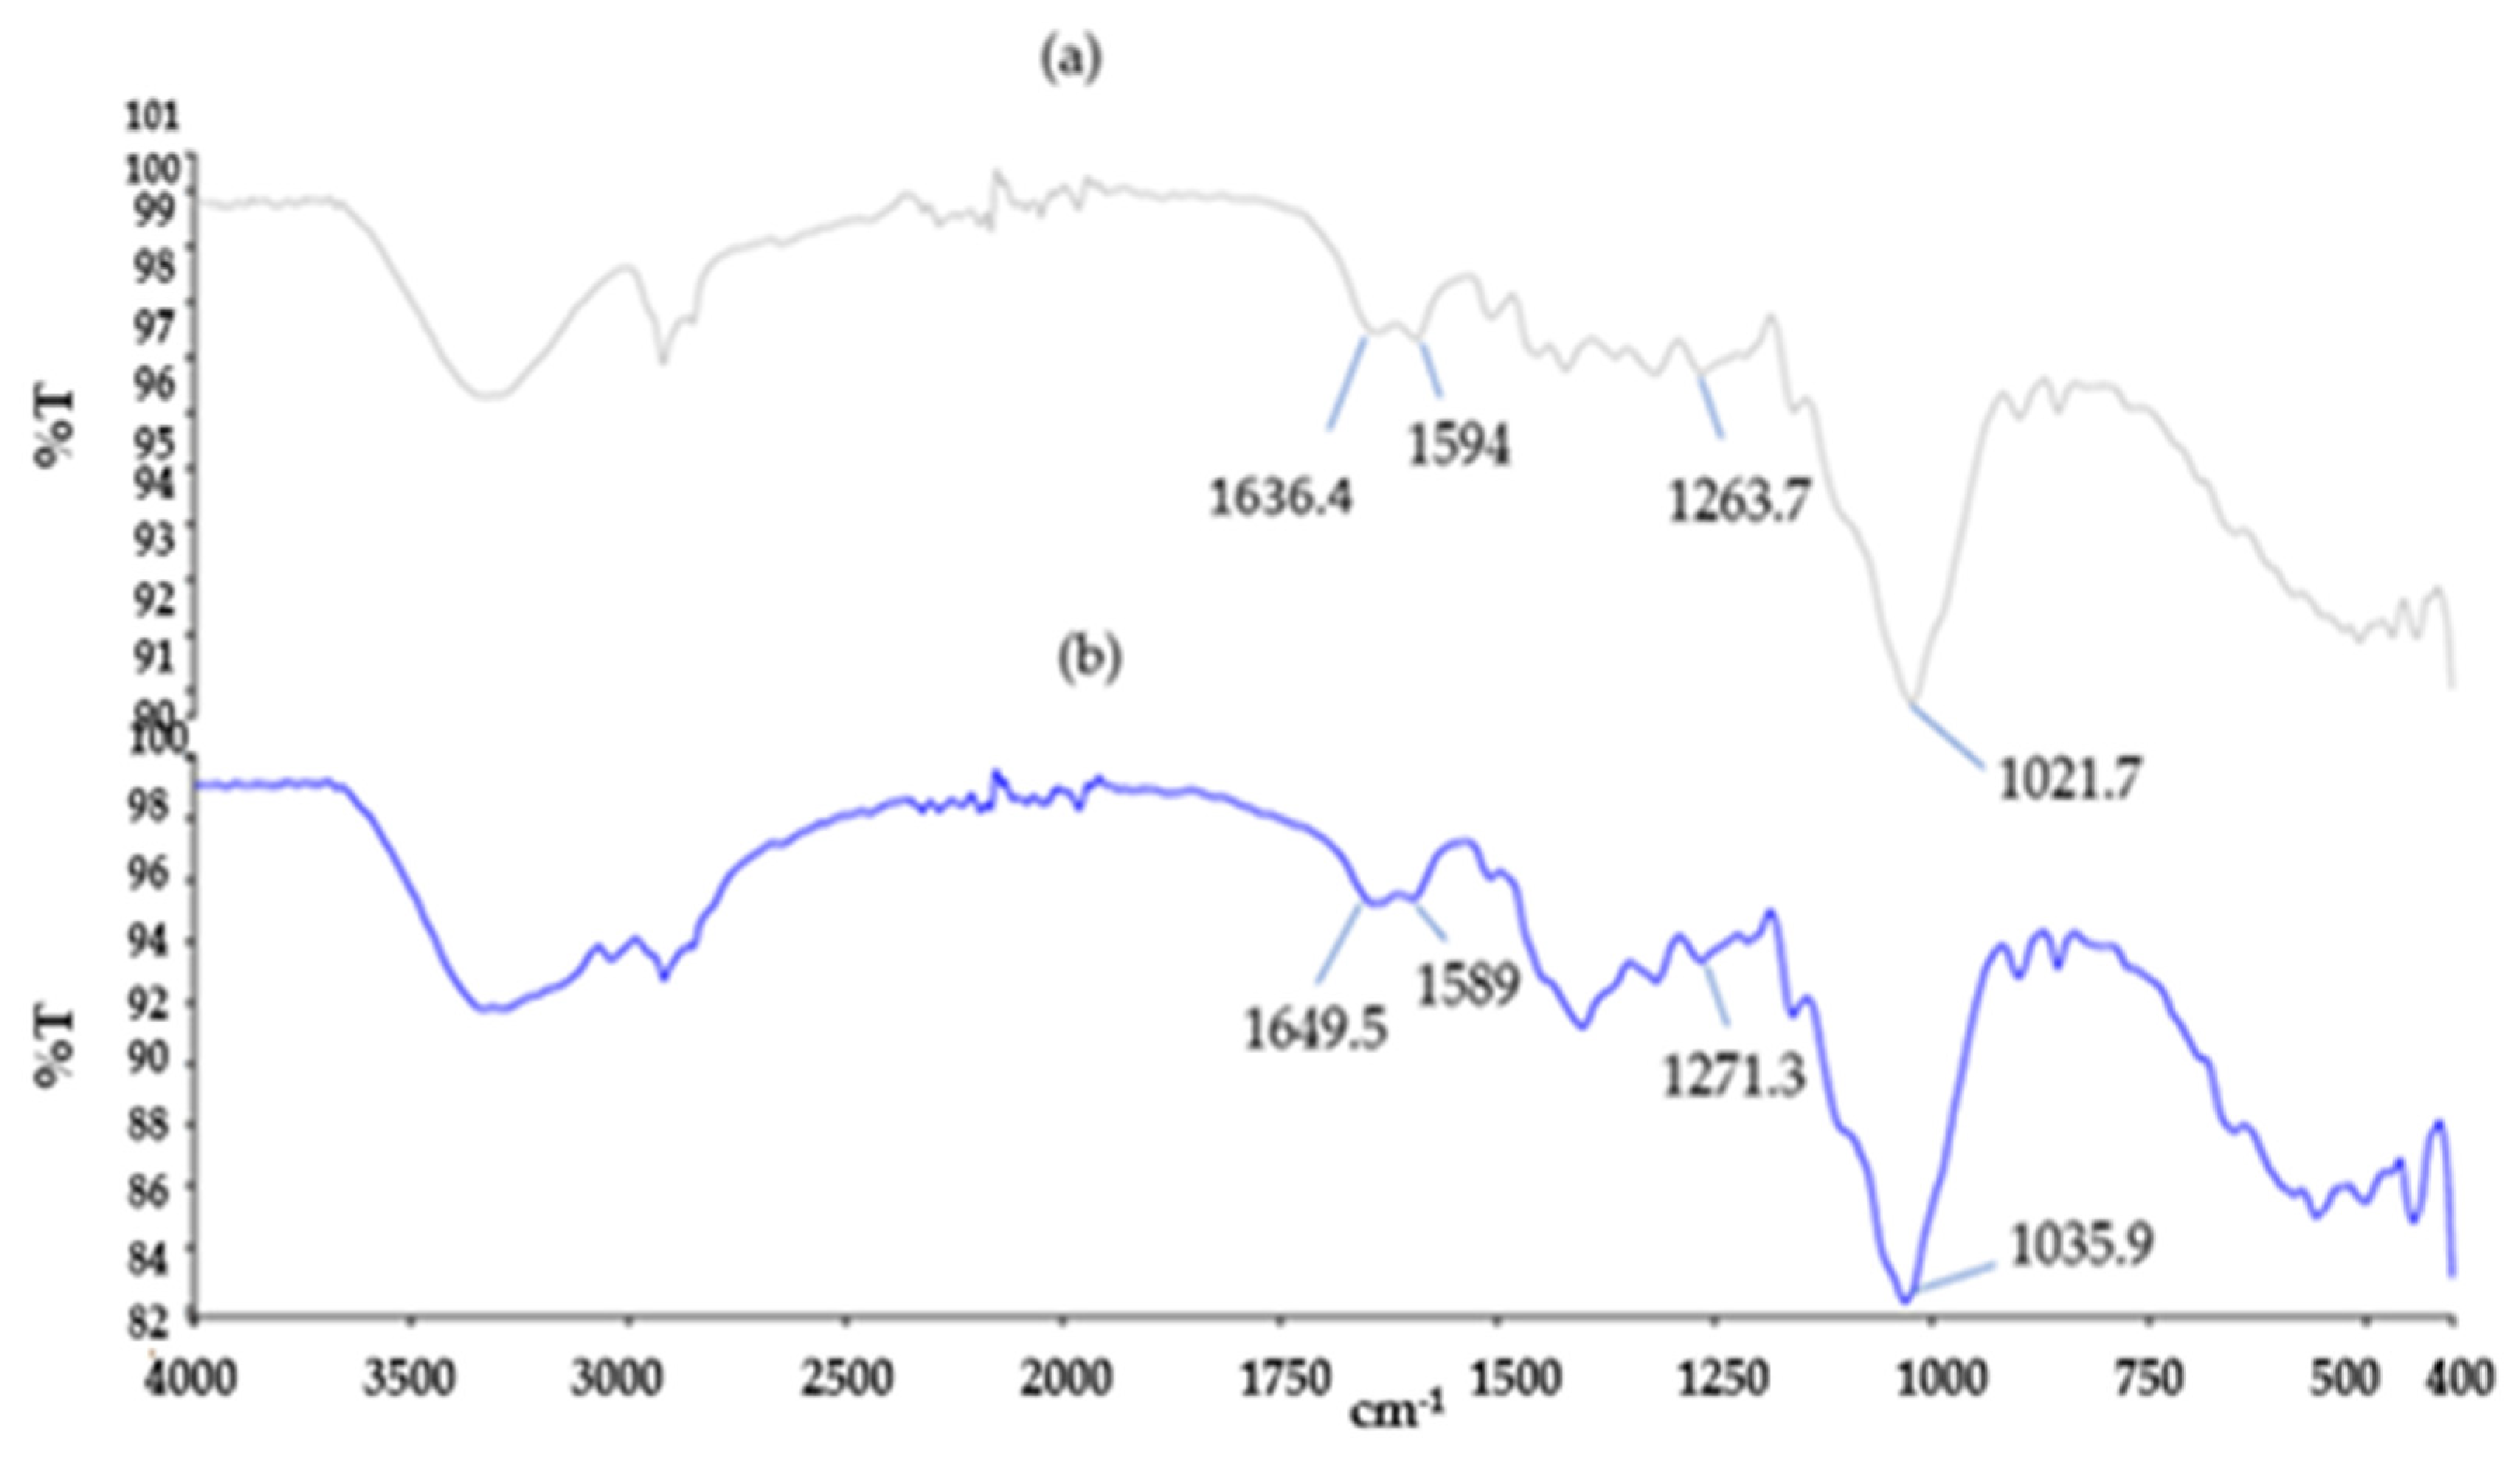
2.3. Characterisation of the Biosorbents

The surface areas (m2/g) of the biosorbents were measured and calculated based on nitrogen adsorption at 77 K using the Brunauer–Emmett–Teller (BET) method. The PerkinElmer FT–IR (model Spectrum 2), operating in attenuated total reflection (ATR) mode, was used to record the FT-IR spectra at wavenumbers 4000–400 cm−1. The morphology and elemental analysis on the samples were investigated by a scanning electron microscope (SEM, Helios Nano Lab G3 CX, FEI) coupled with energy dispersive X-ray (EDX) elemental mapping images of C, O and Fe elements. The concentration of Fe(III) ions was estimated by measuring absorbance at 510 nm using a UV-Vis spectrophotometer and calculating the adsorption capacity.

2.4. Variation in Optimal Operating Conditions

Metal ion adsorption tests were performed on both biosorbents at various masses, namely 0.5, 1.0, 2.0, and 3.0 g. In four independently labeled flasks, a solution of Fe(III) (4 mg/L) was evenly agitated of the biosorbents for 300 min at 30 °C and an initial solution pH of 4. The metal ion solutions were measured into three labeled beakers. A similar approach was used to investigate the influence of starting solution pH and contact duration variation on metal ion adsorption at pH values of 2, 4, 8, and 12 at time intervals ranging from 15 to 720 min. The pH of the working solution was changed to 4 by adding HCl or NaOH solutions. The amounts of remaining metal ions in the filtrate were measured using UV-Vis, and the amount of adsorbed metal ions was estimated.

2.5. Effect of Initial Concentration of Fe(III)

Adsorption study in Section 2.6 was performed by shaking 2.0 g of biosorbent with 100 mL of Fe(III) solutions in initial concentrations of 0.10, 0.30, 0.50, 0.80, 1.00, 2.00, 3.00, and 5.00 mg/L at time, temperature, and pH constant (5 h, 30 °C and pH 4).

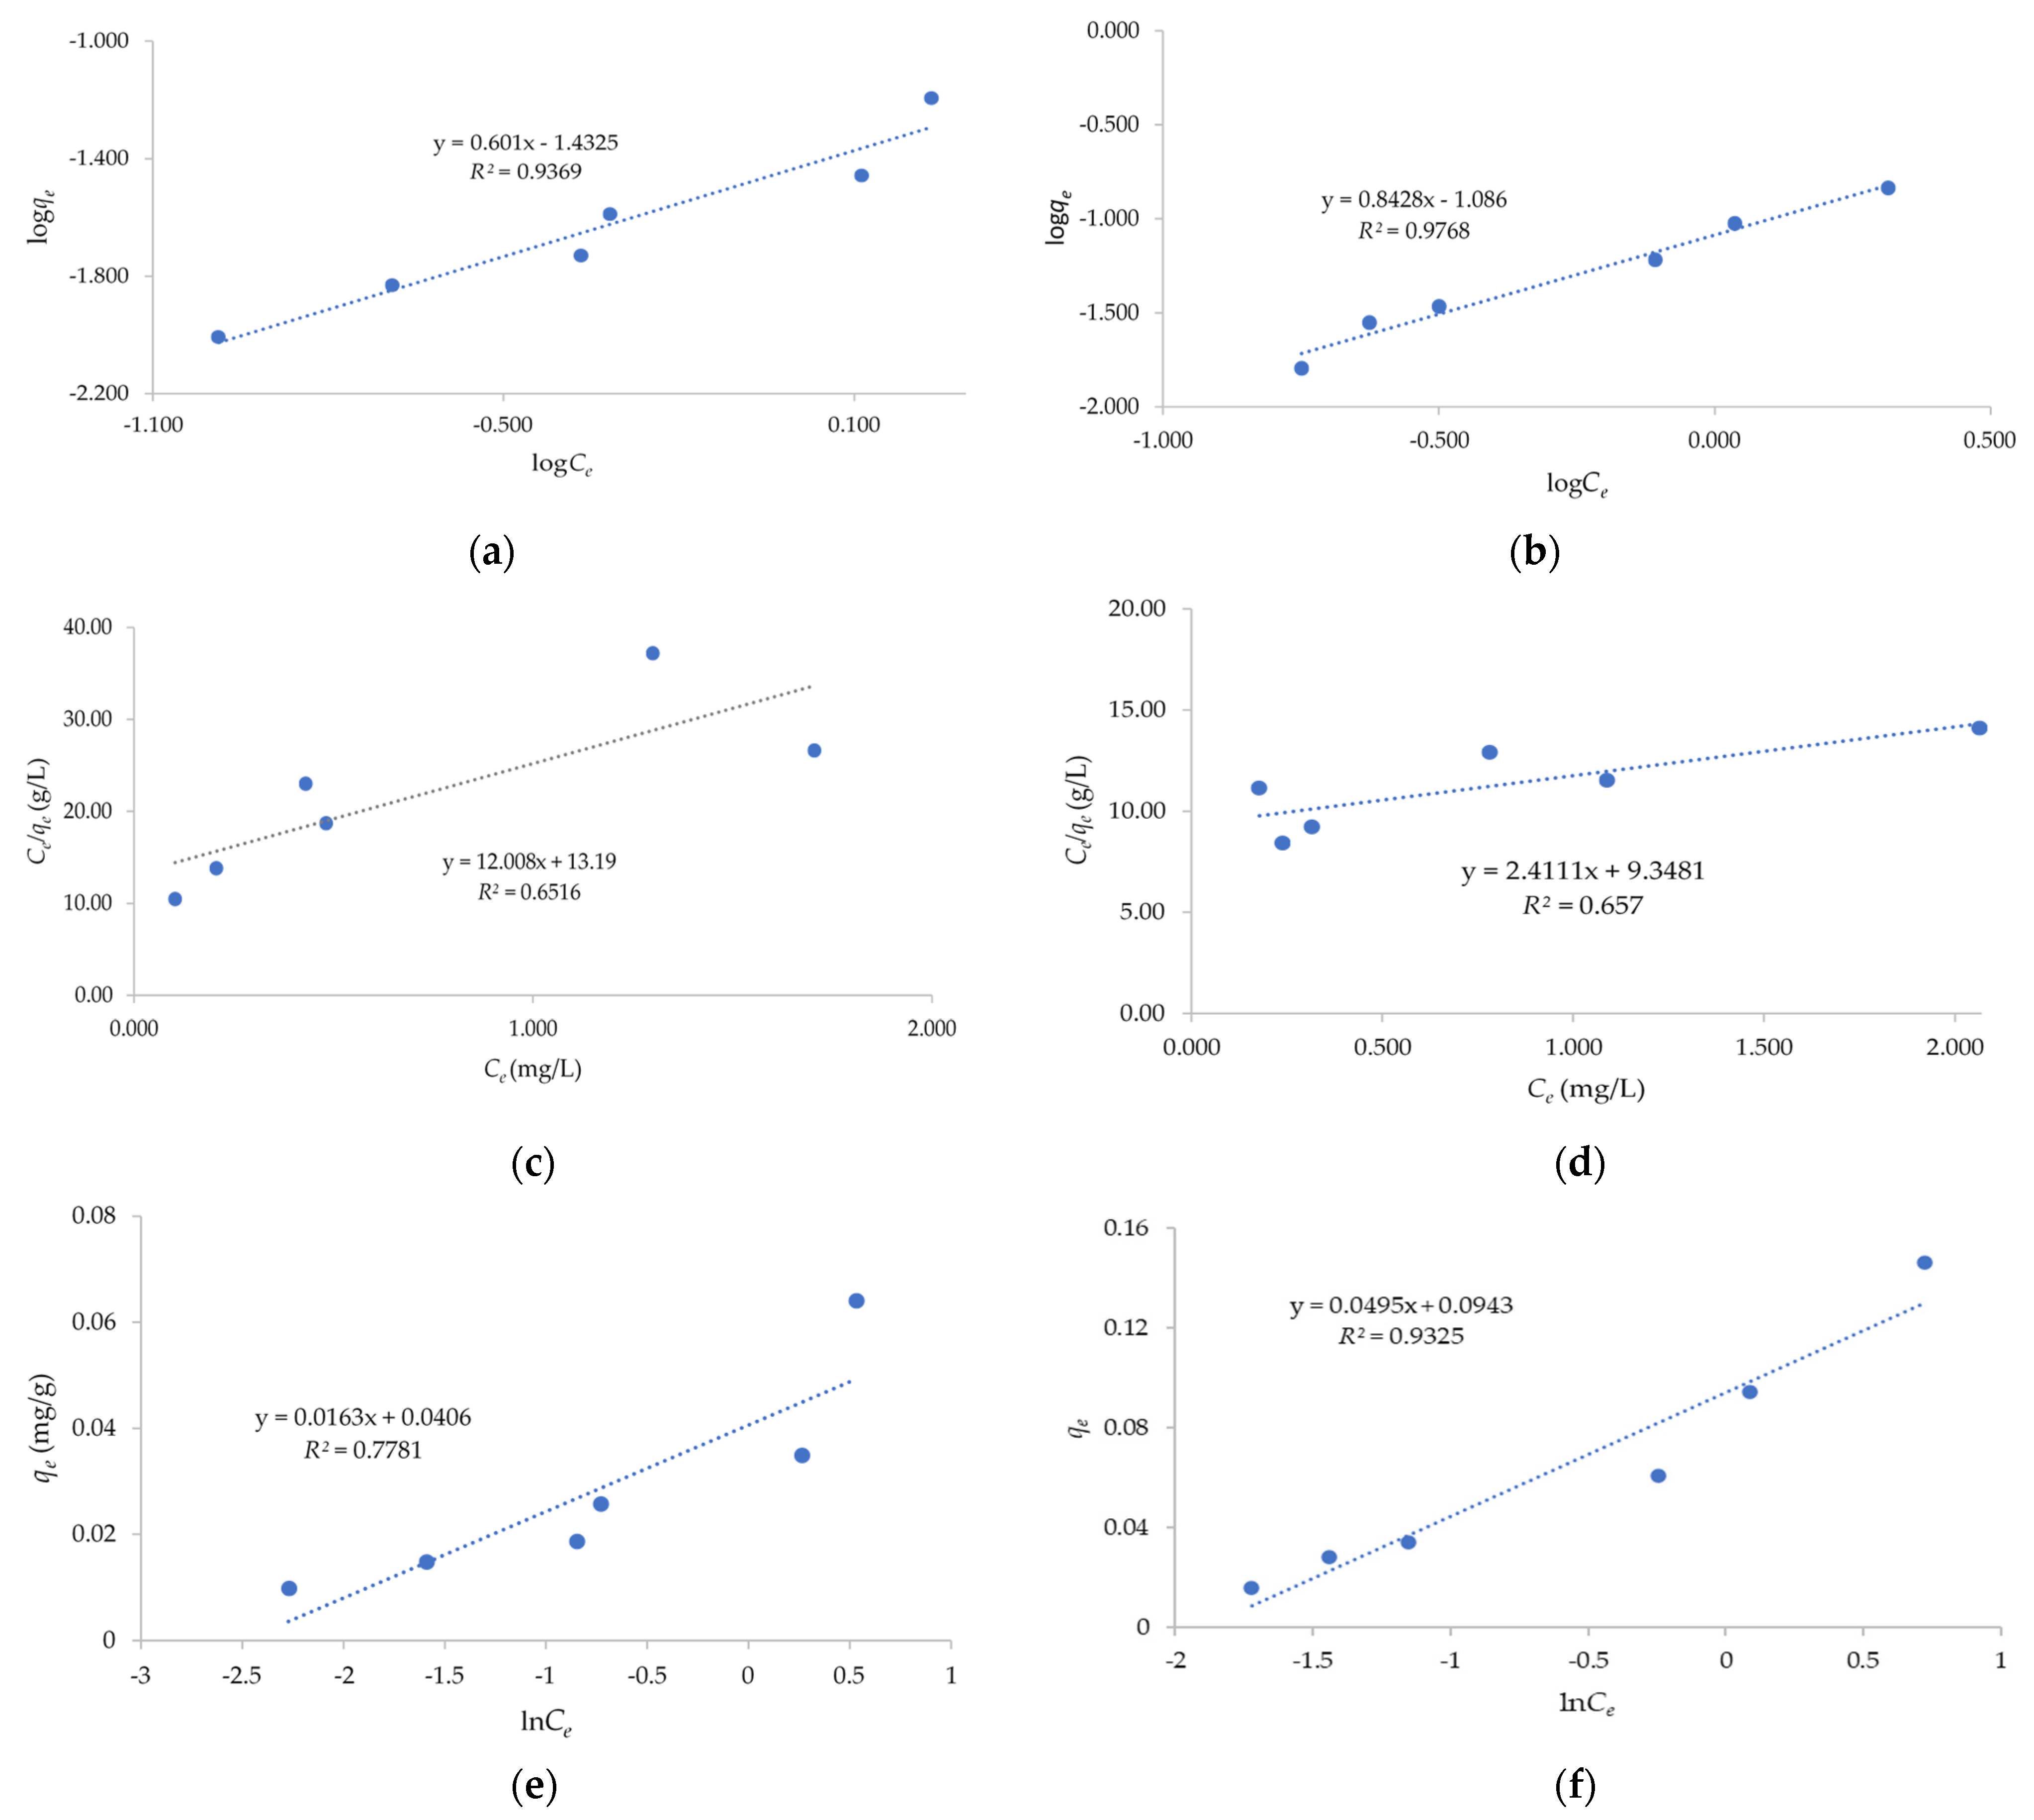
2.6. Equilibrium Adsorption Isotherm

The effect of Fe(III) concentration on batch adsorption was investigated in a single system by placing a fixed amount of the fibre of palmyra palm fruit (2.0 g) in a series of flasks, each containing 100 mL of Fe(III) solutions of various concentrations ranging 0.1–5 mg/L (0.10, 0.30, 0.50, 0.80, 1.00, 2.00, 3.00, and 5.00 mg/L) at a constant (temperature 30 °C, pH 4) and contact time (5 h). Following the adsorption experiment, the quantity of adsorbed Fe(III) ions was estimated using the equilibrium equation, qe (mg/g).

2.7. Adsorption Kinetic Study

The kinetics of adsorption were investigated at an initial Fe(III) concentration of 4 mg/L at a constant temperature 30 °C and pH 4. The solution was collected at various intervals ranging from 15 to 720 min to measure the residual Fe(III) ion content. The adsorption kinetic data were evaluated to derive the adsorption kinetic parameters.

3. Results

3.1. Physical Characteristics of the Biosorbents

The pore volume and pore size of the N–PPF and C–PPF samples were determined using the BET method. As shown in Table 1, the pore volumes of N–PPF and C–PPF were 0.00314 and 0.01069 cm3/g, respectively. The pore sizes of N–PPF and C–PPF were 30.1640 and 450.2094 Å, respectively. Figure 2 depicts images for comparison of untreated and chemically treated (KOH) materials analysed by SEM. Figure 2a shows the fibres in the presence of lignin and hemicellulose components. KOH treatment created many pores and increased the pore size of the C–PPF sample. The increase in pore volume and pore size after chemical treatment are consistent with the results of previous studies. This shows that KOH can be used in the modification process to provide a developed pore structure and more active adsorption sites, as shown in Figure 2b [5,6,14,15,16,22,23,24].
The functional groups of cellulose, hemicellulose and lignin were studied in the literature and are shown in Table 2 [25].
The comparison of FT–IR spectra between N–PPF before adsorption and C–PPF before adsorption were analyzed by the PerkinElmer FT–IR (model Spectrum 2), operating in attenuated total reflection (ATR) mode used to recorded the FT–IR spectra at wavenumbers 4000–400 cm−1, which are shown in Figure 3.
In Figure 3, it was found that the FT–IR spectra of the adsorbent shown at 1636–1640 cm−1 corresponded to the peak of –C–OH group stretching [14,15], 1270–1232 cm−1 may be attributed to the C–O–C stretching of lignin [15], and 1000–1100 cm−1 corresponded to the peak of the –C–OH group of hemicellulose [21].
The treated fibres showed a reduction in the amount of hemicellulose and lignin, as can be seen from Figure 2, when comparing the fibre spectra before treatment (Figure 3a) and after treatment (Figure 3b).

3.2. Adsorption Behaviours of the Biosorbents

The influence of adsorbent dose, pH value, contact time, adsorption kinetics and adsorption isotherms were studied. The effects of these factors on the adsorption capacity of the biosorbents were also investigated.

3.2.1. Effect of Adsorbent Dosages
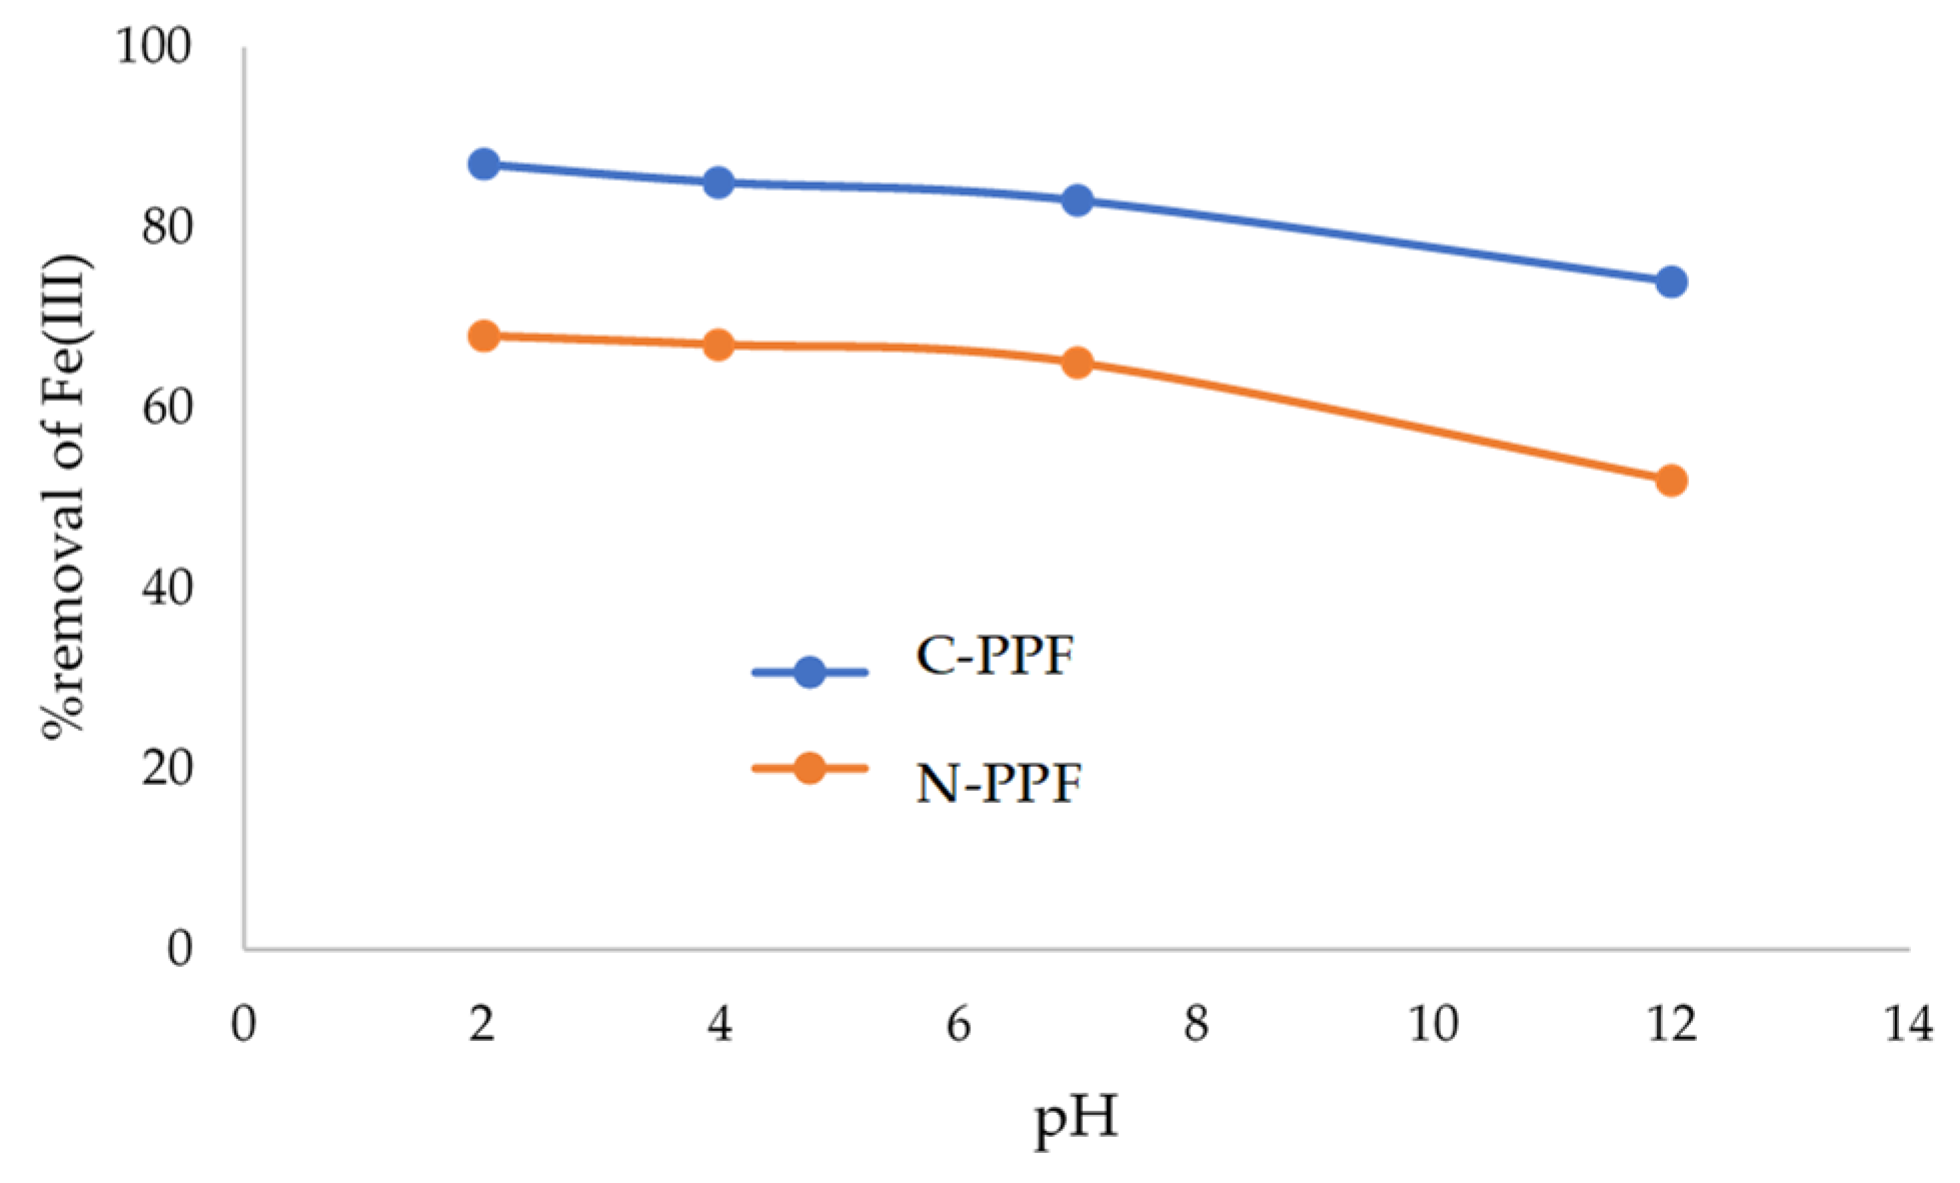
The mass of the adsorbent is a parameter of the adsorption study in which the Fe(III) contact time and concentration were fixed. Equation (1) was used to estimate the efficiency of the adsorbent dosage on Fe(III) removal (%) over a range of 0.5–5.0 g [3,16]:
  R e m o v a l   o f   I r o n ( I I I ) ( % R ) = C 0 C e C 0 × 100
where the initial Fe(III) concentration (mg/L) and the equilibrium concentration of Fe(III) are C0 and Ce, respectively.
Figure 4 shows that the removal % increases as the adsorbent mass increases. Because the adsorbent increases the number of active sites on the surface area, Fe(III) may readily travel to an adsorption site [10,13,16,17]. It is obvious that raising the adsorbent amount increases the fraction of metal recovered from the aqueous phase. This trend implies that adsorbent metal adsorption capabilities improve with adsorbent dosage due to an increase in the number of active sites available for metal absorption [9,26,27]. This impact is caused by a rise in the adsorbents’ surface areas, pore volumes, and pore diameters, a phenomenon that has been validated in previous research [5,6,10,16]. As a consequence, 2.0 g of each adsorbent was chosen to explore the influence of contact time and solute concentration in the following stage, owing to the rate of percentage removal of the 2.0 g adsorbent was maximized as compared to the rate of percentage removal of other adsorbents (0.5, 1.0 and 3.0) [5].

3.2.2. Effect of pH

The solution pH is the most essential component in the adsorption process. It can be influenced by adsorbate species dissociation and adsorbent surface chemistry. The influence of pH on the adsorption of Fe(III) onto N–PPF and C–PPF was studied at pH 2, 4, 7, and 12. The two adsorbents showed similar characteristics of adsorption behaviour. The highest percentages of Fe(III) removal for C–PPF and N–PPF were observed at pH 2, at 92.00% and 91.20%, respectively (Figure 5). Because the adsorbent is a fibre with a negative surface charge, the efficiency of Fe(III) removal decreased as the pH of the solution increased. This could be due to hydrogen bonding between Fe(III) and the surface of the adsorbent. However, pH 4 was chosen for subsequent experiments because the removal efficiency of Fe(III) at this pH was comparable to that at pH 2. At a pH greater than 4, however, Fe3+ ions reacted with OH and formed the sediment Fe(OH)3, resulting in decreased adsorption of Fe3+. Therefore, pH values of 2–4 are the most suitable for adsorption as there is no conflict with OH, yet Fe3+ ions have sufficient opportunity to completely bind to the active site of adsorbents [4,10,28].

3.2.3. Effect of Contact Time

Regarding the minimum time needed to attain equilibrium in optimisation of the batch adsorption experiment, the effect of time on the adsorption of Fe(III) on both biosorbents was investigated throughout a time range of 15–720 min. Adsorption was examined at fixed conditions of pH 4, 30 °C, starting concentration of 4 mg/L, and constant shaking speed. Equation (2) was used to compute the quantity of Fe(III) adsorbed on the adsorbent. Figure 6 shows that the adsorption of Fe(III) on N–PPF and C–PPF increased during the first 15 min of contact time, and then steadily increased with time until the adsorption equilibrium time was reached at 300 min (0.376 mg/g for C–PPF and 0.249 mg/g for N–PPF). This might mean that the adsorbents’ surfaces have a higher affinity for metal ions. Normally, the monomolecular layer that covers the surface exhausts the adsorbents’ capacity. In addition, after 300 min, the Fe(III) adsorption rates slowly increased to 720 min. The fast adsorption rate in the initial stage is probably attributable to the large vacant area with many unoccupied active sites on the surface at the beginning [5,14,16,18], while the slower adsorption rate in the second stage can be explained by adsorption site saturation [29]:
q t = ( C 0 C t ) V w
where qt is the quantity of Fe(III) adsorbed onto the adsorbent over time, C0 denotes the starting Fe(III) concentration (mg/L), Ct denotes the Fe(III) concentration at a certain time, w is the weight of the adsorbent (g), and V is the volume of the Fe(III) solution (L).

3.2.4. Effect of Initial Concentration of Fe(III)

The removal of Fe(III) on N–PPF and C–PPF at initial concentrations varying from 0.1–5 mg/L are shown in Figure 7. The percentage removal of Fe(III) decreases gradually as the initial concentration of Fe(III) increases. It can be observed that the percentage removal limit of the adsorption process is at high concentrations [27]. At a high concentration, the position of the adsorption sites will be decreased. This behaviour is connected to competitive diffusion Fe(III) ions processing through pores in both biosorbents. This is because it will prevent the metal ions from passing inside the pores of the adsorbent, which is the adsorption that occurs on the surface of both biosorbents [19].

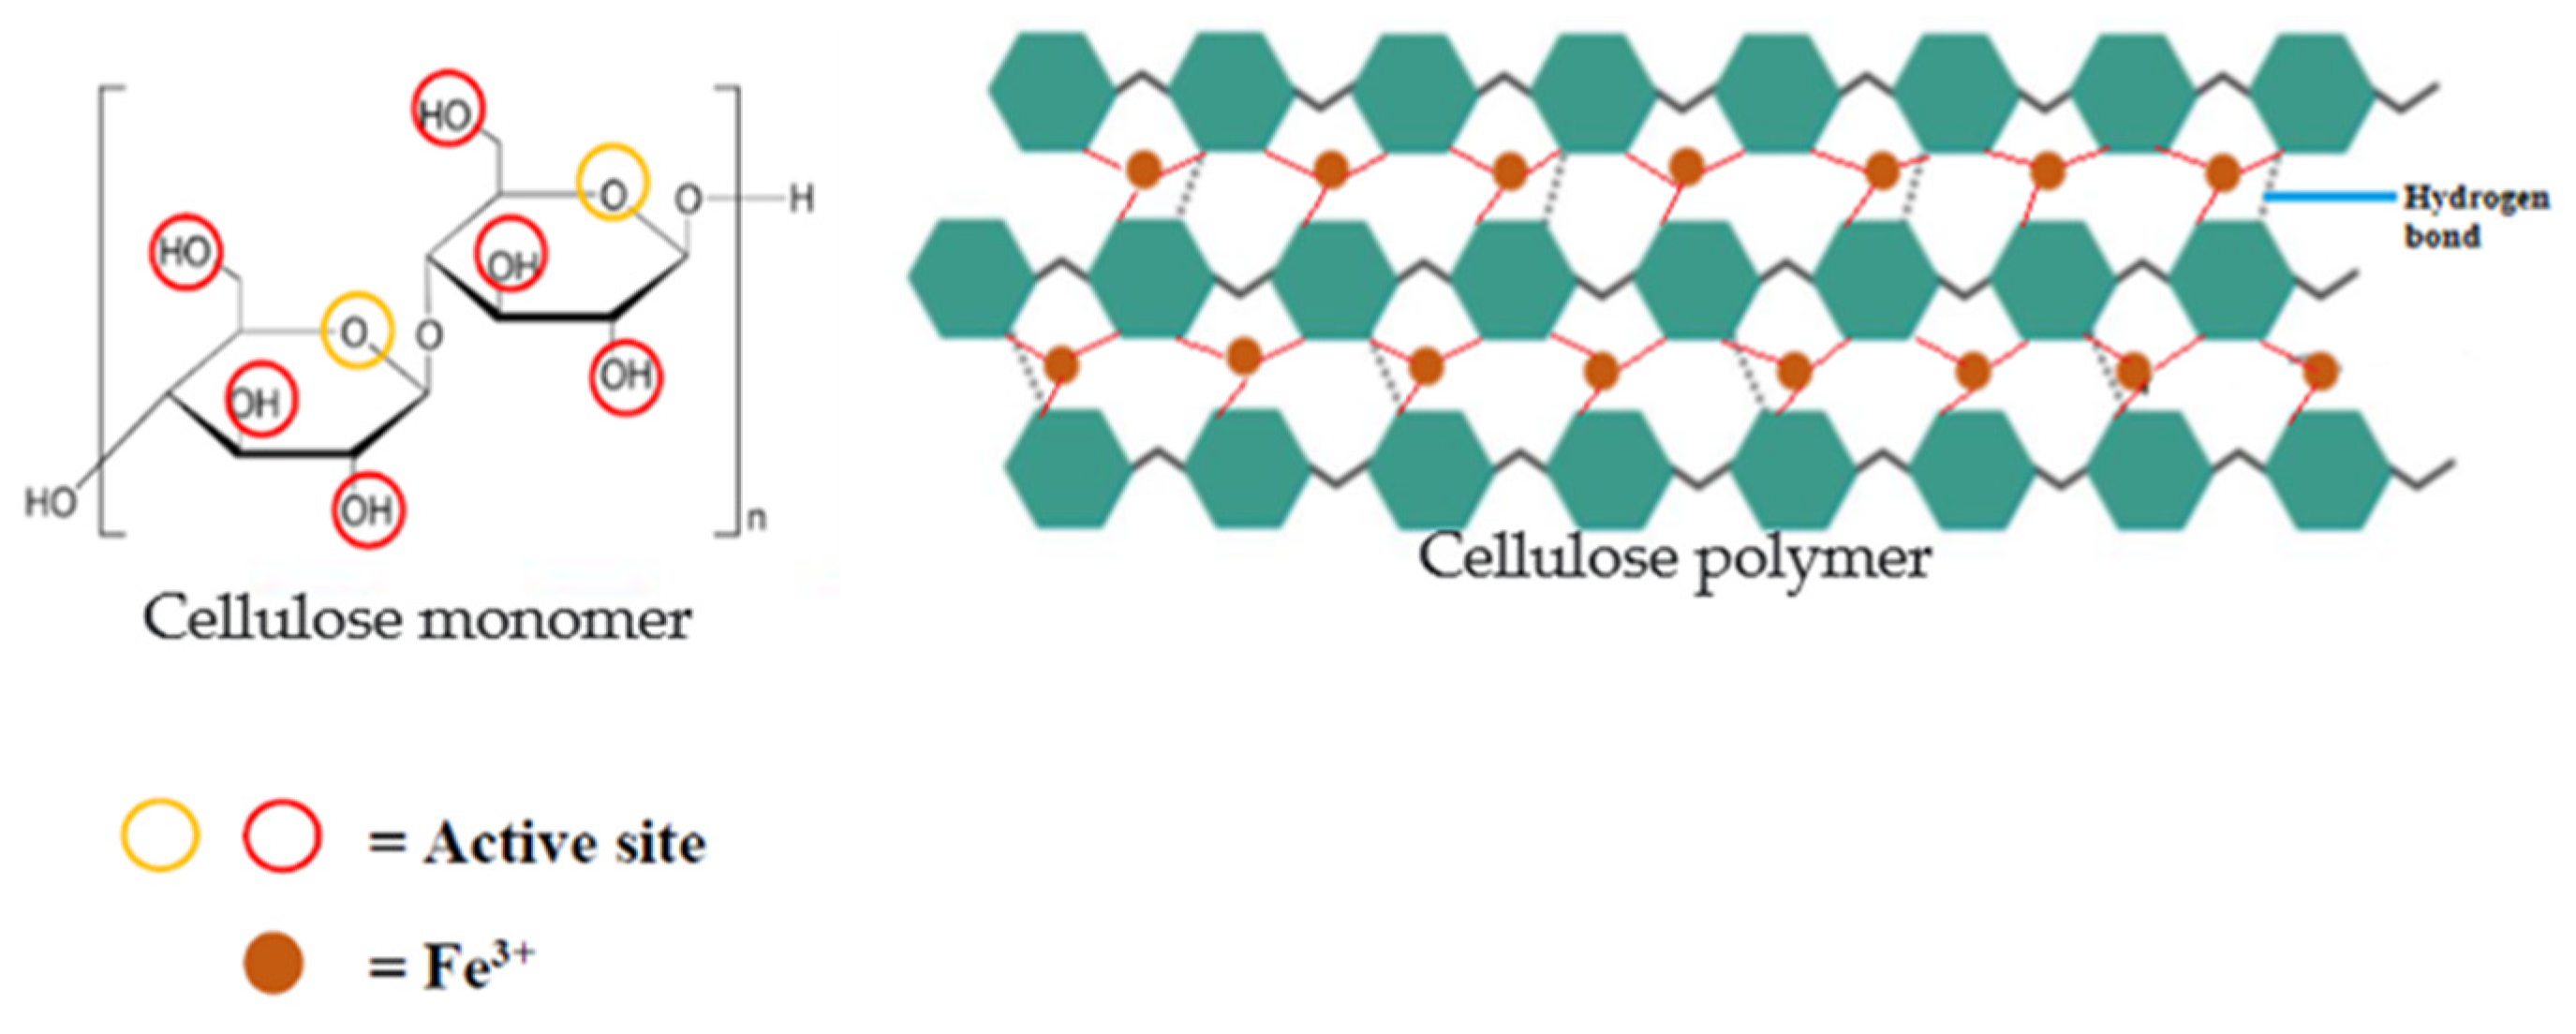
3.3. Adsorption Mechanism

The mechanism of adsorption can be divided into physisorption and chemisorption [28]. The physisorption mechanism is adsorption between the surface and adsorbate, which involves diffusion, van der Waals interactions, hydrogen bonding, electrostatic interactions and exothermal phenomenon. The chemisorption mechanism involves electronics, valence forces between absorbent and adsorbate, a chemical bond to the surface of the adsorbent, complex formation, chelation, proton displacement, redox reaction, and covalent bonding [29,30].
Researchers previously verified an ion-exchange process utilizing low-cost adsorbents for heavy metal ion removal [31]. However, as shown in Figure 8, the current study proposes a mechanism based on ion exchange between celluloses, hydroxyl and ether functional groups and positively charged Fe(III) ions [32]. The FT–IR spectra of both biosorbents, before and after adsorption, were compared to determine the effect of Fe(III) adsorption on these functional groups, which confirmed the results in Figure 9 and Figure 10, showing that the spectra have similar characteristics that are shifted. The wavenumber of –C–OH was shifted from 1640 cm−1 to 1628 cm−1, 1640 cm−1 to 1649.5 cm−1 for N–PPF and C–PPF, respectively, related to the bending modes of hydroxyl groups to confirm the presence of the lignin structure. The band at 1242 cm−1 and 1020 cm−1 shifted to 1235 cm−1 and 1038 cm−1 for N–PPF and C–PPF, respectively, can be assigned to stretching vibration of the C–O-C group. The band at 1263.7 cm−1 and 1021.7 cm−1 shifted to 1271.3 cm−1 and 1035.9 cm−1 for N–PPF and C–PPF, respectively, related to bending modes of hydroxyl groups, confirming the presence of hemicellulose. This discovery implies that ion exchange between the hydroxyl and ether functional groups of cellulose and positively charged ions of Fe(III) is a chemisorption mechanism [18,21,22]. In particular, the hydroxyl groups at the active sites may efficiently adsorb Fe(III) ions. As a consequence, the adsorbents have more metal-binding active sites and negative surfaces, which improves Fe(III) retention on surfaces and the percentage of Fe(III) removal. The hydrogen bond is formed during this physisorption adsorption process.
The mechanism between Fe(III) and adsorbent can be chemisorption and physisorption [30]. As a result of this research, the kinetic analysis findings indicate the validity of the hypothesized mechanism of interaction between the metal ions and adsorbents. Adsorption of metal ions is generally performed by ion exchange, complex formation, and electrostatic interaction [33,34].

3.4. SEM-EDX Analysis

The morphology and elemental analysis on the samples were investigated by a scanning electron microscope (SEM, Helios NanoLab G3 CX, FEI) coupled with energy dispersive X-ray (EDX) elemental mapping images of C, O and Fe elements. Figure 11 depicts SEM–EDX images of N–PPF and C–PPF. The SEM–EDX micrographs of untreated adsorbent (Figure 11a) and chemical-treated adsorbent (Figure 11e) before adsorption showed that the fibres contain the presence of lignin and hemicellulose components. On the other hand, the used adsorbents had a surface partially covered by heavy metals, indicating that the matrix layers of their surfaces shrunk after metal ions were adsorbed, as shown in Figure 11b–d for N–PPF and Figure 11f–h for C–PPF.

3.5. Adsorption Isotherms

The equilibrium adsorption data were analysed in linear form using Equations (3)–(6), which correspond to three different isotherm models of Langmuir, Freundlich, and Temkin. The mass balance relationship was used to calculate the amount of adsorbed Fe(III) (qe) [10,18,19,35]:
q e = ( C 0 C e ) V w
where C0 represents the initial Fe(III) concentration (mg/L), Ce represents the equilibrium Fe(III) concentration, V represents the volume of the Fe(III) solution (L), and w represents the quantity of adsorbent (g).
As seen in Figure 12 depicting the findings, the isotherm is connected to the quantity of adsorption per weight at equilibrium (qe) and the equilibrium concentration in the bulk fluid phase (Ce). As the concentration of Fe(III) grew, so did its adsorption.
C e q e = 1 q m b + C e q m
The slope and intercept for the plot of Ce versus C e q e are parameters qm and b, respectively, where qm (mg/g) is the maximum adsorption capacity of the adsorbent, and b (L/mg) is the Langmuir constant:
l o g q e = l g K f + 1 n l o g C e
The Kf and 1 n values can be calculated from the intercept and slope for the plot of logqe versus logCe, where qe (mg/g) and Kf (mg/L) are the equilibrium adsorbed amount and the Freundlich constant, respectively:
q e = B l n A T + B l n C e
where:
B = R T b T
The slope and intercept were used to calculate the B and A constants and display qe against lnCe. The Temkin isotherm equilibrium binding constant (L/g) is denoted by AT. The Temkin isotherm constant is denoted by bT. R (8.314 J/(mol/K)) is the universal gas constant. B is a constant that is proportional to the heat of sorption (J/mol).
The results of the adsorption data are given in Table 3 and Figure 13. The best-fit adsorption linear square model was determined according to the coefficient (R2). The Fe(III) adsorption data are consistent with the Freundlich model. In addition, the Freundlich models of N–PPF and C–PPF have higher R2 values (0.9369 and 0.9768, respectively) than the Langmuir model, and may be used for heterogeneous systems where there is an interaction between the molecules adsorbed and the occurrence of multilayer coverage of Fe(III) on the adsorbent surface [23,24]. As a result, on the biosorption surface, the adsorbed Fe(III) ions formed a monolayer. The N–PPF and C–PPF had qmax values of 0.0833 and 0.4147 mg/g, respectively [36]. The Temkin model has an R2 of 0.9325 and assumes that the sorption heat of all molecules reduces as the layer is covered, taking into account the influence of indirect contact between adsorbate molecules for C–PPF. Furthermore, the adsorption has the greatest energy distribution of a uniform bond due to the interactions between the adsorbent and the adsorbate [20,27]. The B is +0.0163 and +0.0495 J/mol for N–PPF and C–PPF, respectively, implying that the heat of sorption, which is an indication of the heat of sorption, specifies a physisorption process of N–PPF and C–PPF [20,36,37,38]. The values of n are measures of either adsorption intensity or surface heterogeneity, and they reflect the favourability of sorption, where n < 1, 1 < n < 2, and 2 < n < 10 represent poor, moderate, and favourable adsorption, respectively, and grow more heterogeneous as they approach 10 [39]. When the adsorbent surface is fairly heterogeneous, the value of n is 1.19 for C–PPF.

3.6. Kinetic Models of the Fe(III) Adsorption Process

The kinetics of the Fe(III) adsorption process on N–PPF and C–PPF were studied using three kinetic models. Time-dependent experimental data on Fe(III) included pseudo-first order, pseudo–second–order, and intra-particle diffusion. Equations (8)–(10) are used to present them and integrate them into a linear form.
l o g ( q e q t ) = l o g q e k 1 2.303 t
The k1 values can be calculated from the slope for the plot of log(qe − qt) versus t.
t q t = 1 k 2 q e 2 + t q e
qe and k2 can be determined from the slope and intercept for the plot of t q t against t. The initial sorption rate is k 2 q e 2 , represented as h [29,31].
Adsorbate molecules or ions were transferred through the boundary layer from the bulk of the solution to the solid surface, allowing for diffusion within the porous particle and adsorption on the surface. The intra-particle diffusion process is a rate-limiting phase in many adsorption processes, and it was predicted by the model shown below [39]:
q t = k i d t 1 / 2 + C
The slope and intercept for the plot of qt vs. t1/2 may be used to calculate kid and c, where k1 (1/min) and k2 (mg/(g·min−1)) represent the pseudo–first–order rate constant and the pseudo–second–order rate constant, respectively. The kid (mg/(g·min1/2)) represents the intra-particle diffusion rate constant. The equilibrium adsorbed quantities and adsorbed amounts at any moment are represented by the qe (mg/g) and qt (mg/g) values, respectively. The thickness of the boundary layer is represented by parameter c (mg/g). The border is effective if the intercept value exceeds c.
The experimental data are shown in Table 4 and Figure 14 and Figure 15. Both the pseudo–first–order and pseudo–second–order reaction models agree well with the kinetic data of Fe(III) sorption. The initial Fe(III) sorption rate from C–PPF was determined to be 0.0090 mg/(g·min). The Fe(III) removal from C–PPF was discovered to be sluggish. On the other hand, the adsorption of Fe(III) onto C-PPF is better suited to the pseudo–first–order model (R2 = 0.9870) and the pseudo–second–order model (R2 = 0.9890). Both models exhibit a good match, but N–PPF is more suited to the pseudo–first–order model (R2 = 0.9616). Based on the experimental data for C–PPF and the pseudo–first–order model for N–PPF, the adsorption capacities were computed using the pseudo–first–order and pseudo–second–order models. The physisorption process was demonstrated by fitting the adsorption process using a pseudo–first–order model. The adsorption process was ideally suited to the pseudo–second–order model, proving chemisorption [40]. Similar behaviour has been observed for Fe(III) adsorption on other natural adsorbent materials [26,27,28]. The initial sorption rates of N–PPF and C–PPF were 0.0025 and 0.0090 mg/(g·min), respectively, indicating that the initial sorption rate of C–PPF is faster than that of N–PPF.
The results of the intra-particle diffusion parameters are shown in Table 5 and Figure 16. The internal diffusion model was utilised to investigate the adsorption rate determination technique. The internal diffusion model parameters may be utilised to visualise the data between qt and t(1/2). The fact that the plot from this model is a straight line that passes through the origin indicates that the adsorption process is controlled by intra-particle diffusion. However, the presence of two or more linear zones in the plot shows that the adsorption process occurs in stages [26,27]. The intra-particle adsorption plots were found to be nonlinear and may be divided into three linear stages where the plots do not pass through the origin (c ≠ 0). This illustrates that, in addition to intra-particle diffusion being a rate-controlling step, the rate of adsorption may be regulated by other kinetic models, such as boundary layer diffusion or other processes with some control over the border layer [25,26,41]. The initial stage is characterised by a high diffusion rate (kid1) due to the bulk diffusion or external diffusion, where ions are carried to the exterior surface of the adsorbent. Subsequently, the rate of diffusion lowers in the second stage (kid2), which is the gradual diffusion of ions within the porous particle of adsorbent throughout the interparticle diffusion. Following that, the lowest rate of diffusion (kid3) in the third stage indicates an equilibrium state, whereas the first stage is the high diffusion rate (kid1), which is the transfer of ions to the exterior surface of the adsorbent. The rate of diffusion lowers in the third stage (kid3), which is diffusion within the porous particle and is due to the reduced concentration of ions and the saturation of all active sites on the adsorbent surface [29,32]. The R2 and kid values indicate that intra-particle diffusion of Fe(III) on N–PPF and C–PPF, which might be related to adsorbed on the surface of the adsorbent and within its pore structure [26,30,31].

3.7. Comparison of Adsorption Capacities with Other Biosorbents

Interestingly, it was found that the physical characteristics such as shades and surface characteristics of cocoon adsorbents still remained after the repeated experiment process three times. It is found that the effect of all parameters can still maintain the adsorbent material very well. For this reason, they can be used to remove heavy metals in wastewater repeatedly. Therefore, it is a material that is suitable for application and is considered as the most efficient use of natural adsorbent materials. The adsorption capacities of the C–PPF and N–PPF adsorbents were compared to those of other similar natural materials under various experimental conditions are in Table 6. It should be emphasized that adsorption capabilities vary depending on the features of the adsorbent, the level of surface alteration, and the analytical method employed for decontamination. Additionally, the heat treatment temperature, pH, adsorbent particle size, and starting concentration of the employed adsorbate are all critical. With the exception of rice straw charcoal, many researchers are interested in investigating the adsorption capacities of various heavy metals by employing natural adsorbents such as fruit peels and agricultural wastes [3], as well as sugar cane [18]. Both the adsorbents in this study have reasonable adsorption capacities for Fe(III) ions. The qmax value is somewhat lower than in other natural adsorbents. Rice straw charcoal is an amorphous substance mostly comprised of carbon. It is graphite with a porous structure and a large surface area [11]. In a previous investigation, the adsorbent was cut into small pieces and then ground into a powder which had a high surface area with porosity. However, this study used adsorbents in original form (fibres). Therefore, the adsorption capacity of this study was lower than the previous research.

4. Conclusions

Natural fibres from palmyra palm fruits were studied as a biosorbent in this work. The untreated and chemically treated samples are referred to as N–PPF and C–PPF, respectively. In this work, the starting concentration, an adsorbent dose of 2.0 g, pH 4, and a contact period of 300 min were used. The adsorption capacity values correlated to the Langmuir, Freundlich, and Temkin models, with the Freundlich model providing the greatest fit. The N–PPF and C–PPF Langmuir adsorption capacities were determined to be 0.0833 and 0.4147 mg/g, respectively. Iron ions absorbed in C–PPF were greater than in N-PPF due to their pore size and greater pore volume than in N–PPF. The Temkin model was used to calculate the sorption heat of all the molecules on the surface, which were +0.0163, +0.0495 J/mol, which is an indication of the physisorption process of N–PPF and C-PPF, respectively, and n = 1.19 showed that the adsorbent surface is fairly heterogeneous. Adsorption occurred according to the pseudo–first–order kinetic model, which suited the adsorption process perfectly. It represents the physisorption of N–PPF. The pseudo–first–order and pseudo–second–order kinetic models completely fit the adsorption process, verifying the C–PPF physisorption and chemisorption processes. As a result, it can be inferred that these adsorbents can be used as inexpensive, easily accessible, and efficient biosorbents for iron removal from wastewater.

Author Contributions

Conceptualization, S.S.; data curation, S.S.; formal analysis, S.S.; investigation, S.S.; methodology, S.S. and A.R.; project administration, S.S.; supervision, N.M.; validation, S.S., P.P. and A.R.; writing—original draft, S.S.; writing—review & editing, P.P. and N.M. All authors have read and agreed to the published version of the manuscript.

Funding

This work was supported by the Institute of Research and Development at Chandrakasem Rajabhat University.

Acknowledgments

The authors gratefully acknowledge the funding provided by the Institute of Research and Development at Chandrakasem Rajabhat University (Grants No. CRU18/2019). The authors are also thankful to the board of the Faculty of Science, as well as the board and technical staff of the Department of Chemistry, Faculty of Science, Chandrakasem Rajabhat University, for supporting the use of the liveable laboratory.

Conflicts of Interest

No potential conflict of interest were reported by the authors.

References

  1. Xu, J.; Cao, Z.; Zhang, Y.; Yuan, Z.; Lou, Z.; Xu, X.; Wang, X. A review of functionalized carbon nanotubes and graphene for heavy metal adsorption from water: Preparation, application, and mechanism. Chemosphere 2018, 195, 351–364. [Google Scholar] [CrossRef] [PubMed]
  2. Sierra-Marquez, L.; Espinosa-Araujo, J.; Atencio-Garcia, V.; Olivero-Verbel, J. Effects of cadmium exposure on sperm and larvae of the neotropical fish Prochilodus magdalenae. Comp. Biochem. Physiol. Part C Toxicol. Pharmacol. 2019, 225, 108577. [Google Scholar] [CrossRef] [PubMed]
  3. Nawar, N.; Ebrahim, M.; Sami, E. Removal of Heavy Metals Fe3+, Mn2+, Zn2+, Pb2+ and Cd2+ from Wastewater by Using Rice Straw as Low Cost Adsorbent. Acad. J. Interdiscip. Stud. 2013, 2, 85–96. [Google Scholar] [CrossRef] [Green Version]
  4. Al-Anber, M.A. Removal of high-level Fe3+ from aqueous solution using natural inorganic materials: Bentonite (NB) and quartz (NQ). Desalination 2010, 250, 885–891. [Google Scholar] [CrossRef]
  5. He, W.-L.; Feng, Y.; Li, X.-L.; Wei, Y.-Y.; Yang, X.-E. Availability and toxicity of Fe(II) and Fe(III) in Caco-2 cells. J. Zhejiang Univ. Sci. B 2008, 9, 707–712. [Google Scholar] [CrossRef]
  6. Karthikeyan, G.; Andal, N.M.; Anbalagan, K. Adsorption studies of iron(III) on chitin. J. Chem. Sci. 2005, 117, 663–672. [Google Scholar] [CrossRef]
  7. Alomar, T.S.; Habila, M.A.; AlMasoud, N.; Alothman, Z.A.; Sheikh, M.; Soylak, M. Biomass-Derived Adsorbent for Dispersive Solid-Phase Extraction of Cr(III), Fe(III), Co(II) and Ni(II) from Food Samples Prior to ICP-MS Detection. Appl. Sci. 2021, 11, 7792. [Google Scholar] [CrossRef]
  8. Das, B.; Hazarika, P.; Saikia, G.; Kalita, H.; Goswami, D.C.; Das, H.B.; Dube, S.N.; Dutta, R.K. Removal of iron from groundwater by ash: A systematic study of a traditional method. J. Hazard. Mater. 2007, 141, 834–841. [Google Scholar] [CrossRef]
  9. Altameemi, I.A.; Alasadi, T. A new sample method for the treatment of waste water containing Cu(II) and Zn(II) ions using adsorption on dried conocarpus erectus leaves. J. Basrah Res. 2013, 39, 125–135. [Google Scholar]
  10. Mosa, A.A.; El-Ghamry, A.; Trüby, P. Chemically Modified Crop Residues as a Low-Cost Technique for the Removal of Heavy Metal Ions from Wastewater. Water Air Soil Pollut. 2010, 217, 637–647. [Google Scholar] [CrossRef]
  11. Rojas, J.; Suarez, D.; Moreno, A.; Silva-Agredo, J.; Torres-Palma, R.A. Kinetics, Isotherms and Thermodynamic Modeling of Liquid Phase Adsorption of Crystal Violet Dye onto Shrimp-Waste in Its Raw, Pyrolyzed Material and Activated Charcoals. Appl. Sci. 2019, 9, 5337. [Google Scholar] [CrossRef]
  12. Phuengphai, P.; Singjanusong, T.; Kheangkhun, N.; Wattanakornsiri, A. Removal of copper(II) from aqueous solution using chemically modified fruit peels as efficient low-cost biosorbents. Water Sci. Eng. 2021, 14, 286–294. [Google Scholar] [CrossRef]
  13. Wattanakornsiri, A.; Rattanawan, P.; Sanmueng, T.; Satchawan, S.; Jamnongkan, T.; Phuengphai, P. Local fruit peel biosorbents for lead(II) and cadmium(II) ion removal from waste aqueous solution: A kinetic and equilibrium study. South Afr. J. Chem. Eng. 2022, 42, 306–317. [Google Scholar] [CrossRef]
  14. Wattanakornsiri, A.; Pasada, S.; Kornram, S.; Satchawan, S.; Kheangkhun, N.; Phuengphai, P. Removal of Lead(II) from Aqueous Solution Using Fibroin from Cocoon Waste as a Potential Biosorbent. Sci. Technol. Asia 2022, 27, 84–97. [Google Scholar]
  15. Ghorbel-Abid, I.; Trabelsi-Ayadi, M. Competitive adsorption of heavy metals on local landfill clay. Arab. J. Chem. 2015, 8, 25–31. [Google Scholar] [CrossRef] [Green Version]
  16. Lim, S.-F.; Lee, A.Y.W. Kinetic study on removal of heavy metal ions from aqueous solution by using soil. Environ. Sci. Pollut. Res. 2015, 22, 10144–10158. [Google Scholar] [CrossRef]
  17. Rao, R.A.K.; Uddin, M.K. Adsorption studies of Cd(II) on ball clay: Comparison with other natural clays. Arab. J. Chem. 2016, 9, S1233–S1241. [Google Scholar] [CrossRef] [Green Version]
  18. Soliman, E.M.; Ahmed, S.A.; Fadl, A.A. Reactivity of sugar cane bagasse as a natural solid phase extractor for selective removal of Fe(III) and heavy-metal ions from natural water samples. Arab. J. Chem. 2011, 4, 63–70. [Google Scholar] [CrossRef] [Green Version]
  19. Abdulrasaq, O.O.; Basiru, O.G. Removal of Copper (II), Iron (III) and Lead (II) Ions from Mono-Component Simulated Waste Effluent by Adsorption on Coconut Husk. African J. Environ. Sci. Technol. 2010, 4, 382–387. [Google Scholar]
  20. Artnarong, S.; Masniyom, P.; Maneesri, J. Isolation of yeast and acetic acid bacteria from palmyra palm fruit pulp (Borassus flabellifer Linn.). Int. Food Res. J. 2016, 23, 1308–1314. [Google Scholar]
  21. Muthuvelammais. Processing of Palmyra Palm Fruit Fiber. IRE J. 2017, 1, 56–63. [Google Scholar]
  22. Abe, S.; Saito, T.; Suda, M. Simultaneous determination of iron(II) and iron(III) in aqueous solution by kinetic spectrophotometry with tiron. Anal. Chim. Acta 1986, 181, 203–209. [Google Scholar] [CrossRef]
  23. Feng, N.-C.; Guo, X.-Y.; Liang, S. Enhanced Cu(II) adsorption by orange peel modified with sodium hydroxide. Trans. Nonferrous Met. Soc. China 2010, 20, s146–s152. [Google Scholar] [CrossRef]
  24. Pan, R.; Bu, J.; Ren, G.; Zhang, Z.; Li, K.; Ding, A. Mechanism of Removal of Hexavalent Chromium from Aqueous Solution by Fe-Modified Biochar and Its Application. Appl. Sci. 2022, 12, 1238. [Google Scholar] [CrossRef]
  25. Morán, J.I.; Álvarez, V.; Cyras, V.P.; Vázquez, A. Extraction of cellulose and preparation of nanocellulose from sisal fibers. Cellulose 2007, 15, 149–159. [Google Scholar] [CrossRef]
  26. Al-Anber, M.; Al-Anber, Z.A. Utilization of natural zeolite as ion-exchange and sorbent material in the removal of iron. Desalination 2008, 225, 70–81. [Google Scholar] [CrossRef]
  27. Deng, Z.; Gu, S.; Cheng, H.; Xing, D.; Twagirayezu, G.; Wang, X.; Ning, W.; Mao, M. Removal of Phosphate from Aqueous Solution by Zeolite-Biochar Composite: Adsorption Performance and Regulation Mechanism. Appl. Sci. 2022, 12, 5334. [Google Scholar] [CrossRef]
  28. Kukret, H.; Amuthavalli, K. MicroRNA-34a causes ceramide accumulation and effects insulin signaling pathway by targeting ceramide kinase (CERK) in aging skeletal muscle. J. Cell Biochem. 2020, 121, 3070–3089. [Google Scholar] [CrossRef] [PubMed]
  29. Tandorn, S.; Arqueropanyo, O.-A.; Naksata, W.; Sooksamiti, P.; Chaisri, I. Adsorption of arsenate from aqueous solution by ferric oxide-impregnated Dowex Marathon MSA anion exchange resin: Application of non-linear isotherm modeling and thermodynamic studies. Environ. Earth Sci. 2019, 78, 136. [Google Scholar] [CrossRef]
  30. Márquez, C.O.; García, V.J.; Guaypatin, J.R.; Fernández-Martínez, F.; Ríos, A.C. Cationic and Anionic Dye Adsorption on a Natural Clayey Composite. Appl. Sci. 2021, 11, 5127. [Google Scholar] [CrossRef]
  31. Bartczak, P.; Norman, M.; Klapiszewski, Ł.; Karwańska, N.; Kawalec, M.; Baczyńska, M.; Wysokowski, M.; Zdarta, J.; Ciesielczyk, F.; Jesionowski, T. Removal of nickel(II) and lead(II) ions from aqueous solution using peat as a low-cost adsorbent: A kinetic and equilibrium study. Arab. J. Chem. 2018, 11, 1209–1222. [Google Scholar] [CrossRef] [Green Version]
  32. O’Connell, D.W.; Birkinshaw, C.; O’Dwyer, T.F. Heavy metal adsorbents prepared from the modification of cellulose: A review. Bioresour. Technol. 2008, 99, 6709–6724. [Google Scholar] [CrossRef] [PubMed]
  33. Litefti, K.; Freire, M.S.; Stitou, M.; González-Álvarez, J. Adsorption of an anionic dye (Congo red) from aqueous solutions by pine bark. Sci. Rep. 2019, 9, 16530. [Google Scholar] [CrossRef] [PubMed] [Green Version]
  34. Aguilar-Rosero, J.; Urbina-López, M.E.; Rodríguez-González, B.E.; León-Villegas, S.X.; Luna-Cruz, I.E.; Cárdenas-Chávez, D.L. Development and Characterization of Bioadsorbents Derived from Different Agricultural Wastes for Water Reclamation: A Review. Appl. Sci. 2022, 12, 2740. [Google Scholar] [CrossRef]
  35. Abualnaja, K.; Alprol, A.; Ashour, M.; Mansour, A. Influencing Multi-Walled Carbon Nanotubes for the Removal of Ismate Violet 2R Dye from Wastewater: Isotherm, Kinetics, and Thermodynamic Studies. Appl. Sci. 2021, 11, 4786. [Google Scholar] [CrossRef]
  36. Ho, Y.S.; McKay, G. Comparative sorption kinetic studies of dye and aromatic compounds onto fly ash. J. Environ. Sci. Health Part A 1999, 34, 1179–1204. [Google Scholar] [CrossRef] [Green Version]
  37. Freundlich, H.M.F. Over the adsorption in solution. J. Phys. Chem. 1996, 57, 1100–1107. [Google Scholar]
  38. Johnson, R.D.; Arnold, F.H. The temkin isotherm describes heterogeneous protein adsorption. Biochim. et Biophys. Acta (BBA)-Protein Struct. Mol. Enzym. 1995, 1247, 293–297. [Google Scholar] [CrossRef]
  39. Ghasemi, M.; Zahedi, G.; Alwi, S.R.W.; Goodarzi, M.; Javadian, H. Kinetic and equilibrium study of Ni(II) sorption from aqueous solutions onto Peganum harmala-L. Int. J. Environ. Sci. Technol. 2014, 11, 1835–1844. [Google Scholar] [CrossRef]
  40. Al-Harby, N.F.; Albahly, E.F.; Mohamed, N.A. Synthesis and Characterization of Novel Uracil-Modified Chitosan as a Promising Adsorbent for Efficient Removal of Congo Red Dye. Polymers 2022, 14, 271. [Google Scholar] [CrossRef]
  41. Shavandi, M.; Haddadian, Z.; Ismail, M.; Abdullah, N.; Abidin, Z. Removal of Fe(III), Mn(II) and Zn(II) from palm oil mill effluent (POME) by natural zeolite. J. Taiwan Inst. Chem. Eng. 2012, 43, 750–759. [Google Scholar] [CrossRef]
Figure 1. Physical appearance of biosorbents during the preparation and adsorption processes.
Applsci 12 10540 g001
Figure 2. The SEM images show the surface morphology of N–PPF (a) and C–PPF (b).
Applsci 12 10540 g002
Figure 3. The functional group characteristic of FT–IR spectra between (a) N–PPF before adsorption and (b) C–PPF before adsorption.
Applsci 12 10540 g003
Figure 4. Variation in percentages of Fe(III) removal with adsorbent dosages (at concentration of Fe(III) is 4 mg/L, pH4, 30 °C and 300 min).
Applsci 12 10540 g004
Figure 5. Variation in percentages of Fe(III) removal with pH values (at concentration of Fe(III) is 1 mg/L, 30 °C, 300 min and 2 g of adsorbent).
Applsci 12 10540 g005
Figure 6. Variation in percentages of Fe(III) removal with contact time.
Applsci 12 10540 g006
Figure 7. Impact of initial concentration of Fe(III) on adsorption onto both biosorbents.
Applsci 12 10540 g007
Figure 8. Schematic mechanism of interaction between Fe(III) ions and cellulose of C–PPF.
Applsci 12 10540 g008
Figure 9. The comparison of FT–IR spectra between (a) N–PPF before adsorption and (b) N–PPF after adsorption.
Applsci 12 10540 g009
Figure 10. The comparison of FT–IR spectra between (a) C–PPF before adsorption and (b) C–PPF after adsorption.
Applsci 12 10540 g010
Figure 11. The SEM, elemental mapping analysis and EDX images of N–PPF (ad) and C–PPF after adsorption (eh).
Applsci 12 10540 g011aApplsci 12 10540 g011b
Figure 12. Adsorption isotherms of Fe(III) for adsorbents (a) N–PPF adsorbent; (b) C–PPF adsorbent.
Applsci 12 10540 g012
Figure 13. Adsorption isotherms of Freundlich, Langmuir, and Temkin for N–PPF and C–PPF. Freundlich isotherm for (a) N–PPF and (b) C–PPF; Langmuir isotherm for (c) N–PPF and (d) C–PPF; Temkin isotherm for (e) N–PPF and (f) C–PPF.
Applsci 12 10540 g013
Figure 14. Pseudo–first–order model for Fe(III) adsorption of C–PPF and N–PPF.
Applsci 12 10540 g014
Figure 15. Pseudo–second–order model for Fe(III) adsorption of C–PPF and N–PPF.
Applsci 12 10540 g015
Figure 16. Intra-particle diffusion model for Fe(III) adsorption of C–PPF and N–PPF.
Applsci 12 10540 g016
Table 1. Specific surface area, pore volume, and pore size of the biosorbents.
BiosorbentPore Volume (cm3/g)Pore Size (Å)
N–PPF0.0031430.1640
C–PPF0.01069450.2094
Table 2. The FT-IR bands for functional groups of cellulose, hemicellulose and lignin.
Fibre
Component
Wave
Number (cm−1)
Functional
Group
Compounds
Cellulose4000–2995OHAcid, methanol
2890H–C–HAlkyl, aliphatic
1640Fibre–OHAdsorbed water
1270–1232C–O–CAryl–alkyl ether
1170–1082C–O–CPyranose ring skeletal
C–OH
1108OH
Hemicellulose4000–2995OHAcid, methanol alkyl, aliphatic
2890H–C–HKetone and carbonyl
1765–1715C=OC–OH
1108OH
Lignin4000–29,995 Acid, methanol
2890H–C–HAlkyl, aliphatic
1730–1700 Aromatic
1632C=CBenzene
stretching
ring
1613–1450C=CAromatic
stretching mode
1430O–CH3Methyl–O–CH3
1270–1232C–O–CAryl–alkyl ether
1215C–OPhenol
1108OHC–OH
900–700C–HAromatic
Hydrogen
Table 3. Comparison of isotherm parameters for Fe(III) adsorption on C–PPF and N–PPF sorbents.
BiosorbentLangmuir IsothermFreundlich IsothermTemkin Isotherm
qm
(mg/g)
b
(L/mg)
R2Kf (mg/g)/(mg/L)1/nNR2ATBR2
N–PPF0.08330.91030.651636.91.660.936912.07090.01630.7781
C–PPF0.41470.25790.657082.01.190.97686.71970.04950.9325
Table 4. Kinetic parameters of Fe(III) adsorption on C–PPF and N–PPF at 303 K.
BiosorbentPseudo-First OrderPseudo-Second Order
qe (mg/g)
experimental
qe (mg/g)
calculated
k1
(1/min)
R2qe (mg/g)
calculated
k2
(g/(mg·min−1))
h
(mg/(g·min))
R2
N–PPF0.2490.1972−0.00370.96160.26550.03480.00250.8157
C–PPF0.37600.29970.01220.98700.43110.04840.00900.9890
Table 5. Intra-particle diffusion constants of Fe(III) adsorption on different biosorbents at 303 K.
BiosorbentIntra-Particle Diffusion
kid1
mg/(g·min1/2)
kid2
mg/(g·min1/2)
kid3
mg/(g·min1/2)
C1C2C3R12R22R32
N–PPF0.03900.00940.00240.05570.02280.22290.97190.93390.9832
C–PPF0.02220.00930.00120.05700.21630.35290.94130.96740.7745
Table 6. Adsorption capacities of Fe(III) ions in aqueous solutions using different natural adsorbents.
BiosorbentspHqmax (mg/g)References
Natural palmyra palm fruit (N–PPF)40.0833This study
Palmyra palm fruit (C–PPF)40.4147This study
Coconut husk
Sugar cane bagasse
2
2
0.712
18.54
[19]
[18,34]
Rice straw(untreated)
Rice straw
Rice straw
Rice straw
7
7
7
7
0.75
0.81
0.86
0.59
[10]
[17]
[17]
[17]
Rice straw158.82[3]
Publisher’s Note: MDPI stays neutral with regard to jurisdictional claims in published maps and institutional affiliations.

