1. Introduction
Recently, the fields of biotechnology, genetic engineering, artificial intelligence, and big data are emerging as the core of the Fourth Industrial Revolution. The safe storage of life resources and related data is essential to ensure quality-of-life science research. Therefore, biobanks that secure the safety of biomass and bioresources are becoming increasingly important [
1]. In the case of a biobanking system, it is not easy to continuously maintain the ability to detect and correct a dangerous situation as soon as it occurs. The bioresources and data used in the life sciences are the basic infrastructure to support research capability and research indicators [
2]. Collecting, storing, and managing bioresources and data have emerged as the new competitive edge of bioresearch to guarantee life-science research quality [
3]. Therefore, for the reliable management of bioresources, biobanks have become more important than ever before. In particular, bioresources stored in the biobank have academic and economic potential and contain the inherent characteristics of living things; hence, damage to biomass will cause enormous ethical, academic, and economic losses. As biomedical research is rapidly progressing, collecting biomass in both types and quantities is increasing; however, accidents that damage biomass frequently occur because of managers’ lack of awareness of the appropriate storage and management of biomass, and inadequate technology [
4].
Recently, the importance of biobank management has attracted attention owing to incidents such as blood storage accidents due to the breakdown of freezers in blood banks. To prevent damage to bioresources and to store them in the long term with high quality, biobank operation and management procedures should be standardized [
5]. The International Society for Biological and Environmental Repositories (ISBER) is the only international standard forum for solving academic, technical, legal, and ethical problems in life sciences. The ISBER forum proposed the ISBER biobank best practices for repositories, which systematically establishes the most stable biomass repository management procedures [
5]. According to the ISBER biobank standard operating guidelines, the performance of all storage equipment must be continuously monitored [
1]. The temperature of the storage equipment is visually checked by the manager and recorded at least thrice per week to detect potential degradation or failure. It is recommended to use an automatic temperature monitoring system that can record the temperatures of all the storage equipment monitored by both humans and the system and send alert notifications during emergencies.
The most stable way to manage biobanks is to follow the ISBER standard guidelines for resource history management, cryogenic freezer maintenance, and emergency corrective action in the event of resource risk [
1]. However, small-scale biobanks with financial constraints are unable to secure manpower and build systems to comply with the “best practices.” The continuous maintenance of small-scale biobanks to reduce the possibility of risk situations of bioresources is difficult. Sometimes, it is not possible to manage risk situations and maintain a history of resource status that must be tracked according to each resource [
4]. Therefore, the reliable quality of stored biomass is not guaranteed.
In order to solve these problems and ensure the reliability of the biobank, an IoT-based monitoring system was adopted. Internet of Things (IoT) technology has attracted considerable interest in recent years owing to its applicability across various domains [
6]. Several studies on intelligent IoT service systems have received attention owing to convergence in information and communication technology (ICT) [
7]. An IoT-based intelligent service system is defined as a system that acquires data from various resources, recognizes the current status using the acquired data, and interacts with the user according to the domain knowledge of the applications [
8]. IoT technology is applied in various domains such as intelligent CCTV and intelligent robots, and users can connect to the server with a smartphone and manage real-time monitoring and immediate response [
9,
10].
By applying technologies such as machine learning and deep learning, anomalies can be detected automatically and monitored intelligently [
11]. In particular, an abnormal state may be monitored through the pattern recognition or image recognition of sensing data and context information obtained from various resources [
12]. Many studies have been conducted on intelligent monitoring that detects abnormal patterns by applying machine learning or deep learning [
13,
14]. Machine learning based on Recurrent Neural Networks (RNNs) is optimized for time series data or predictive maintenance and can mainly be used for stock and economic data [
15,
16]. In biobanks, temperature sensor data are time series data, and RNN is useful as a predictive learning model.
Here, we propose an IoT-based intelligent monitoring system that applies RNN to support the predictive maintenance of biobanks for the safe use of biomass. The proposed system can be used to measure not only the internal temperature of the cryogenic freezer, but also the temperature of each component (compressor, condenser, heat exchanger, evaporator, etc.) through which the refrigerant circulates. Then, the temperature change can be monitored in real time. To guarantee predictive maintenance we apply RNN deep learning techniques to the IoT-based monitoring of biobanks.
The remainder of this paper is organized as follows.
Section 2 explains the research background and related work on intelligent monitoring based on IoT.
Section 3 presents the design of an IoT-based intelligent monitoring system and RNN model.
Section 4 describes the experimental results. Finally,
Section 5 presents a brief conclusion.
2. Related Works
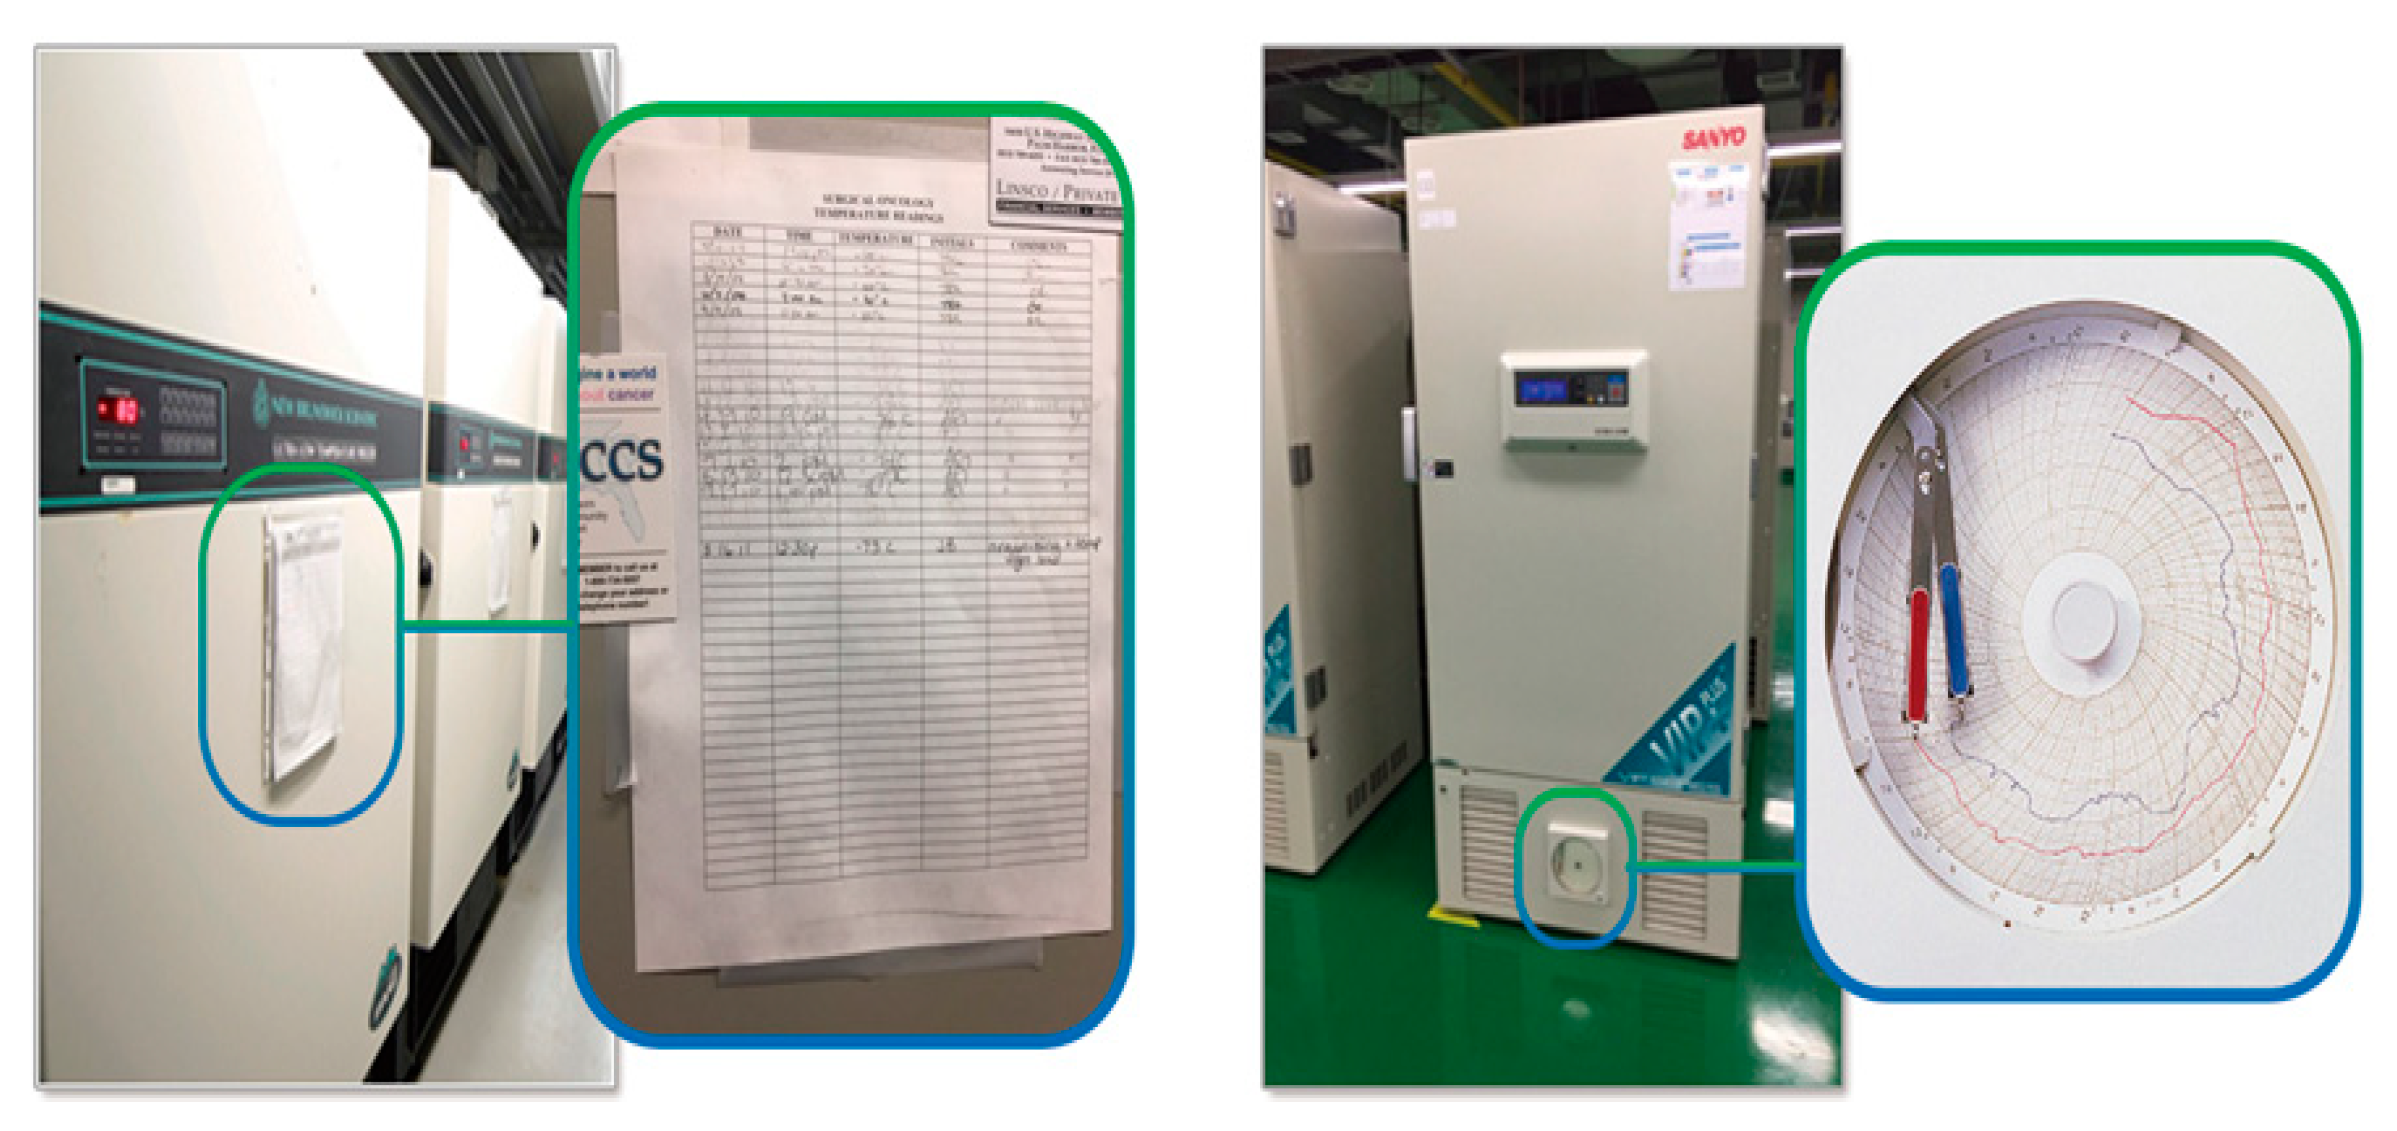
Hospitals and laboratories use cryogenic freezers that maintain cold temperatures below −4 °C to store human resources such as blood, serum, plasma, and DNA, as well as experimental resources such as plants, animals, and microorganisms. In general, to manage biobanks, the internal temperature of the cryogenic freezer is monitored. Currently, most small-scale biobank managers manage the temperature-monitoring data on a document-based basis by recording the temperature inside the cryogenic freezer, at regular intervals, on paper by hand or by using a circular time chart, as shown in
Figure 1.
Figure 1 shows the monitoring status in the case of small-scale biobanks. As shown in
Figure 1, the manager checks the temperature at regular intervals and records the status of the machine manually.
According to the international standard operating guidelines for biobanks, the method of monitoring the internal temperature of cryogenic freezers has been applied as a way to minimize the possibility of damaging the stored biomass [
1]. The temperature of different internal locations can vary within a single storehouse because of the size, age, and other factors of the device, and the monitoring of the internal temperature of cryogenic freezers depends only on the temperature of the sensor location. It is not possible to determine whether the temperature is within the appropriate range. As the inside of the cryogenic freezer is sealed, even after the occurrence of a resource-risk situation, the internal temperature of the reservoir remains unchanged for approximately 8 h, and the biomass is damaged only when the internal temperature of the reservoir changes. Therefore, it is difficult to manage the risk of resources stably. For the reliable management of biomass, it is necessary to attach sensors to each component of the refrigerant, such as compressors, condensers, heat exchangers, and evaporators, and monitor all sensors in real time.
In this study, we apply ICT convergence technology to monitor cryogenic freezers to manage the risk status and long-term maintenance of bioresources. To automate the monitoring of the biobank, temperature sensors and controllers are composed using IoT, and one or more temperature sensors are installed in the refrigerant pipe of the biobank. The temperature data are then collected and sent to the server by the controller and used to detect abnormal conditions. RNN was used to determine the context awareness of the cryogenic freezer. RNN is a type of deep learning model for effectively learning time series data and is appropriate for obtaining meaningful information from the time-dependent data changes of digital sensor data [
17]. Gated Recurrent Unit Network (GRU) is a variant of RNN [
18]. RNN takes sequence data as input, recursively in the evolution direction of the sequence, and all recurrent units are connected in a chain [
19]. It is also an iterative model that can continuously predict data [
20].
In Simple RNN, longer input data cause a longer-term dependency problem, which reduces learning performance [
21,
22]. The longer the input data, the greater the distance between the input and output; thus, the correlation decreases. To solve this problem, the LSTM (Long Short-Term Memory) technique can be used. GRU (Gated Recurrent Unit) technique has a similar performance to LSTM; however, it has a computational advantage because of its simple structure [
23,
24].
Figure 2 shows a simple RNN architecture using three layers. The rounded rectangles represent network layers, solid lines represent weighted connections, and dashed lines represent predictions. LSTM and GRU are variant RNN architectures designed to store and access information better than standard RNNs [
25].
It is possible to predict temperatures in advance by receiving temperature data for each location from the temperature sensor attached to each device in the cryogenic freezer, storing it in the database, and learning the stored temperature data with the variant RNN model such as LSTM and GRU. If the difference between the actual sensed temperature and the predicted temperature exceeds the threshold value, it is determined that the biobank is in an abnormal state. Furthermore, sensor data for each part are learned by RNN individually so that the cause of failure of each part can be determined.
Here, we propose a smart monitoring framework based on IoT by applying deep RNN to support the predictive maintenance of the biobank.
Figure 3 shows the framework of the proposed IoT-based intelligent monitoring system. As shown in
Figure 3, the framework consists of three parts: a cloud server, client part, and embedded devices such as the main controller, LCD, and sensors, which are attached to the biobank. The main controller including the built-in IoT can receive temperature data from sensors and send them to the cloud server. The cloud server stores the sensing data received from the main controller, runs the RNN learning model, derives the next predicted value, and compares it with the actual sensed value to determine the abnormal state of the biobank. Communication between the three components occurs over the Wi-Fi network.
Temperature sensors are attached inside the cryogenic freezer and to various components to monitor, transmit, and store the temperature data and define trigger rules to alert the manager’s mobile device when the temperature deviates from a certain range. We proposed an IoT based smart monitoring system for biobank system, which needs status check periodically. Furthermore, temperature sensing data are sent to the server and predictive maintenance can be carried out using the RNN predictive learning model.
For the intelligent predictive maintenance of the biobank, both LSTM and GRU models were designed for temperature sensor data, and comparative experiments were performed.
Section 3 presents details of the proposed system.
3. Design of an IoT-Based Intelligent Monitoring System and RNN Model
In the international standard operating guidelines for biobanks, the method of monitoring the internal temperature of cryogenic freezers has been applied as a way to minimize the possibility of damage to stored bioresources, but it depends on the various parts of cryogenic freezers. In addition, the following problem may occur in the method of monitoring only the internal temperature of the cryogenic freezer. The internal temperature of the reservoir remains unchanged for 8 h, even in cases of a sudden temperature rise of the storage facility, power shutdown, aging internal parts, over-load, and failure. Therefore, when the internal temperature of the reservoir actually changes, it causes immediate damage to bioresources. Hence, no biobank fully guarantees the maintenance of bioresources. We designed and implemented an IoT-based monitoring system for the cryogenic freezer to monitor the exact storage condition in real time before the temperature inside the storage changes. The proposed system can measure the front and rear temperatures of each component, such as the compressor, condenser, heat exchanger, and evaporator through which the refrigerant circulates, as well as the internal temperature of the cryogenic freezer. The temperature sensor data are sent to the cloud server and analyzed using an RNN-based predictive learning model so that the abnormal status of each part can be monitored in real time.
Figure 4 shows the architecture of the IoT-based integrated monitoring system applying RNN for the predictive maintenance of a biobank. It was designed as client–server architecture, as shown in
Figure 4. There are three main parts: embedded hardware, a cloud server, and a client, as shown in
Figure 4. It consists of various components: sensors and main controller attached to a cryogenic freezer, sensor data manager, anomaly detector, RNN-based predictive learning model, maintenance manager in a cloud server, real time monitoring, and client. The IoT-based main controller, which is attached to the biobank system, transmits temperature data from the sensors to the cloud server over the Wi-Fi network. The cloud server consists of four component modules and databases. The maintenance manager connects and manages cryogenic freezers and clients. The sensor data manager receives the temperature data sent from each sensor, stores the sensing data in the database, and provides data to the RNN predictive learning model that runs the RNN learning and derives the next predicted value. The anomaly detector compares the predicted value with the actual sensed value to determine the abnormal state of the biobank. According to the results of the anomaly detector module, the maintenance manager module notifies the biobank manager of the biobank. The biobank manager in the client part can monitor the biobank in real time through the web or app, and check the biobank status information and other information. The sensors are placed at various locations in the biobank, and the main controller is also attached. The RNN predictive learning model performs prediction learning with the stored temperature data, which are time series data, and compares them with actual measured temperature data values. The anomaly detector sends the status information to the maintenance manager when the difference between the predicted value and the actual value is greater than the threshold value for each sensor. Through the web/app UI/UX, the biobank manager can monitor the status of the biobank with smart devices in real time and respond immediately to abnormal conditions of the cryogenic freezer. An intelligent monitoring and integrated management system to support biobanks can provide an entire management process for biobank managers to guarantee biomass safety.
The RNN models for the intelligent monitoring system are shown in
Figure 5 and
Figure 6. During the RNN process, the information in the foreground data may be lost. To solve this problem, an LSTM cell has been proposed, which is shown in
Figure 5. The LSTM cell can be represented using two vectors
h(t) and
c(t). Vector
h(t) denotes the short-term state and vector
c(t) denotes the long-term state. RNNs control which data to store in the long-term state or which data to discard.
C(t−1), long-term memory, passes through the forgetting gate, losing some of its contents and adding a new memory
i(t). The generated
c(t) is sent to the output. The long-term state is copied and passed to the tanh function to produce the short-term state
h(t). Eventually, the LSTM cell recognizes the important input, stores it in a long-term state for some time, and then extracts it whenever needed. This guarantees a good performance when training long time series data.
The expressions below show how to calculate the cell state for each time step for one sample. The formula for LSTM is as follows:
where the meaning of the parameters are as follows:
Figure 6 shows the GRU model, which has been implemented more simply than the LSTM model. The two state vectors are expressed as one vector
h(t), and one gate controller
z(t) controls both the erase and input gates. When the gate controller outputs 1, the erase gate opens and the input gate closes.
The following expressions show the calculation of the cell state for each time step for one sample. The GRU formula is as follows:
The input dataset used in the LSTM model comprises 525,000 temperature data, and each X_train datum consists of a temperature vector from time t − 9 to time t, and the Y_train data are temperature data at time t + 1. The part of the train dataset, 0.2 * training dataset, was used as a validation data. The hidden layer uses two LSTM Layers, each node consists of 10, and the output layer is a fully connected layer and has one output value. The main parameters used in the training are as follows:
batch size: 1
loss function: mean squared error
optimizer: ADAM (Adaptive Moment Estimation)
Input layer:
X_train Dim: (525,000, 10)
Y_train Dim: (525,000, )
Length: 525,000
Normalization: 0 ~ 1 (Min Max Scaler)
In the case of the GRU model, the basic neural network is the same as the LSTM model, but only the hidden layer part uses the GRU layer. The number of nodes in each hidden layer of the LSTM model is shown in
Table 1, while
Table 2 shows the case of the GRU model. It is possible to use regulation rate or dropout in case of overfitting, but they were not used in our model because overfitting did not occur.
Figure 7 shows the designed structure, which has outputs of Y, 10 sequences, and two hidden layers. If the difference between the Y
pred1 output as the predicted value and the actual data Y
1 is greater than the threshold, it is counted as an error. Thus, the accuracy of the predictive model can be calculated by examining how accurate it is relative to the threshold. It is used to check the learning accuracy of the prediction model with accuracy within the range considering the same temperature within a certain threshold.
The implementation environments are as follows: Python and Google Colab were used to construct and evaluate the RNN learning model for predictive maintenance. MySQL and MongoDB were used to store the metadata of the bioresources and the temperature sensing data, respectively. The app client will be developed using Android Studio, and APM is used for the web server and database server.
The cryogenic freezer consists of a compressor, condenser, gas–liquid separator, heat exchanger, and refrigerant recovery flow path. The compressor compresses the refrigerant at high temperatures and pressures, and then the condenser condenses it. In the first stage, the gas–liquid separator separates the condensed mixed refrigerant into gas-phase refrigerant and liquid–liquid refrigerant. The liquid–liquid refrigerant is expanded and sprayed to be supplied at low temperature and pressure. The heat exchanger exchanges gaseous and liquid refrigerants. After condensation, they are fed to the second-stage gas–liquid separator. It comprises an evaporator to obtain cryogenic cold air by expanding the refrigerant that is condensed through the final heat exchanger and the refrigerant passing through the evaporator and the refrigerant recovery flow path to be recovered to the compressor.
The cryogenic freezer, configured as described above, is likely to deteriorate the sample of the subject when there is a problem in performance due to an abnormal power supply or aging of the accessory equipment. Hence, to continuously monitor and manage the condition of the cryogenic freezer with high accuracy, it is necessary to closely attach the temperature sensor to the refrigerant tube. To automate monitoring, a temperature sensor and an IoT controller are produced, one or more temperature sensors are installed in the refrigerant pipe of the biobank, and the temperature data are collected and sent to the server to detect abnormal conditions.
Figure 8 shows the temperature sensors attached to the components near the freezer. In order to monitor the state of the cryogenic freezer, a sensor for detecting the temperature of the refrigerant pipe is used. To increase the precision of the condition monitoring, a device for attaching the temperature sensor to the refrigerant pipe is required.
For gathering temperature data from multiple parts, sensors were installed at different locations in the refrigerant pipe to measure the temperature of each location within it. Six temperature sensors were installed; the temperature sensor is a pt100-type temperature sensor. The temperature sensors located in the internal part of the cryogenic freezer are shown in
Figure 8.
In the proposed system, a temperature sensor is attached to the components near the freezer, and the temperature of the refrigerant tube is sensed at regular intervals by the temperature sensor, which then stores the average temperature.
4. Experiments
Experiments were conducted to verify the functions of intelligent monitoring in the proposed system. Temperature data were gathered every 1 min. The six sensors were attached to various parts that included the temperature in the cryogenic freezer.
Figure 9 shows the temperature data from the sensors. Sensor 1 is attached to the end of the condenser and Sensor 2 is located inside the freezer. Sensor 3 is placed on the high-stage compressor pipe, Sensor 4 is used for the outside temperature measurement, Sensor 5 is placed on the head of the low-stage compressor, and Sensor 6 is attached to the low-stage high-pressure part of the compressor. The temperature is measured in degrees Celsius.
Figure 10 shows the temperature data collected from a normally operating cryogenic freezer for 3 h. According to the location of the sensor, it can be observed that the temperature data exhibit a pattern over time within a certain range, as shown in
Figure 10. From the data collected from each of the six sensors, 0.8 random data are extracted and used as a training dataset. The remaining data are used as a test dataset to evaluate prediction accuracy.
We constructed both LSTM and GRU in order to implement applied RNN for predictive learning. The comparison results of LSTM and GRU (loss function graph and prediction results graph of each sensor) are shown in
Figure 11. The graphs on the left side of
Figure 11 show the loss function graph for the results of training with the LSTM and GRU methods using the data collected by each sensor. Overfitting did not occur until 20 epochs, and the loss value was less than 0.05, indicating convergence within 20 epochs. The graphs on the right side show the comparative analysis of the predicted temperature using the LSTM and GRU for the data collected from each sensor. Blue represents the training data up to 120 times, orange represents the actual data used for verification, and green represents the data predicted by inputting the verification data. This shows that there is little difference between the actual and predicted data after 120 iterations. The prediction results for each sensor’s data show almost no difference from the actual data, which means that the built RNN prediction model is effective for intelligent monitoring and predictive maintenance.
Experiments were performed on two models each applied to six types of sensor data. Experimental results confirmed that both models can be applied to predictive maintenance. The accuracy of the predictive model can be assessed based on how closely it falls within the threshold. However, the accuracy was within the range considering the same temperature within a certain threshold, and the accuracy value depended on the threshold value.
Figure 12 shows a comparison of the accuracy of the LSTM and GRU results from the experiments. In the case of sensor 3, the threshold value is 5.0, which is larger than the others; therefore, the accuracy is lower than in other cases. In most cases, it can be noted that there is no significant difference between LSTM and GRU. However, GRU is known to be efficient in consuming computational resources.


