
Life Cycle Assessment for Environmental Impact Reduction and Evaluation of the Energy Indices in Lettuce Production
 ,
,  , , ,
, , , 
Abstract
:1. Introduction
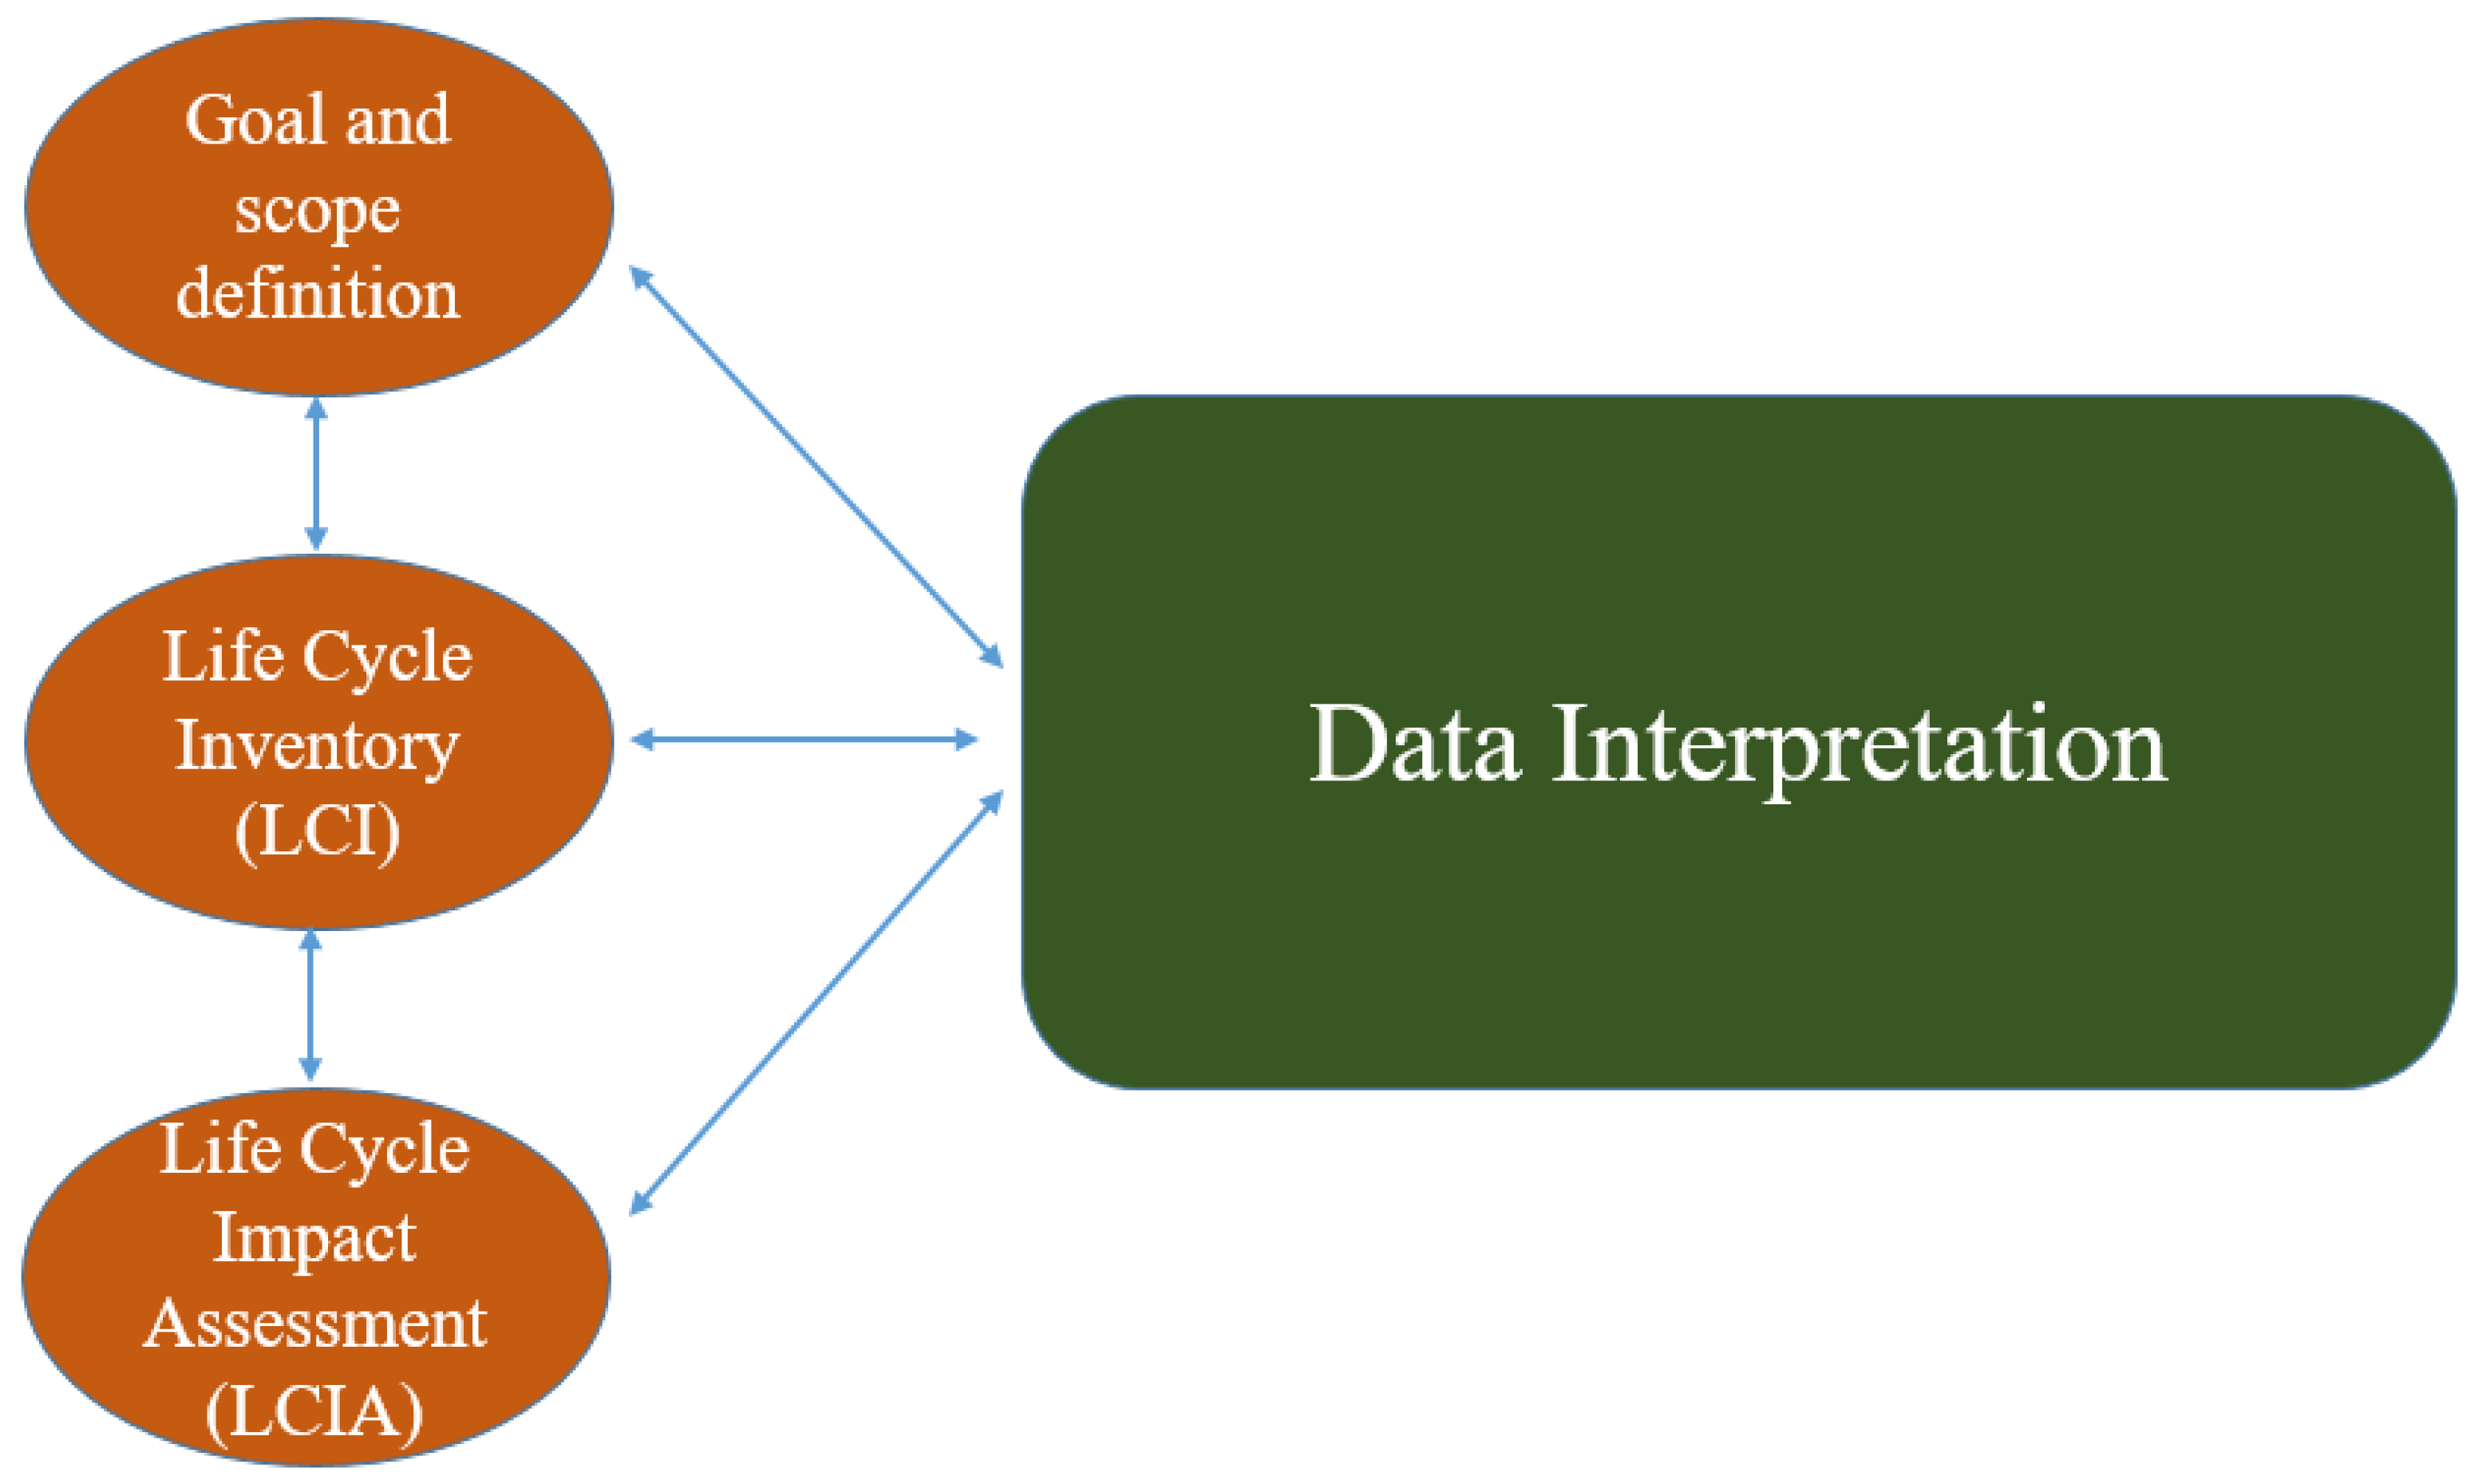
- Goal and scope definition: This step defines the boundaries of the system and functional unit and establishes some of the assumptions made.
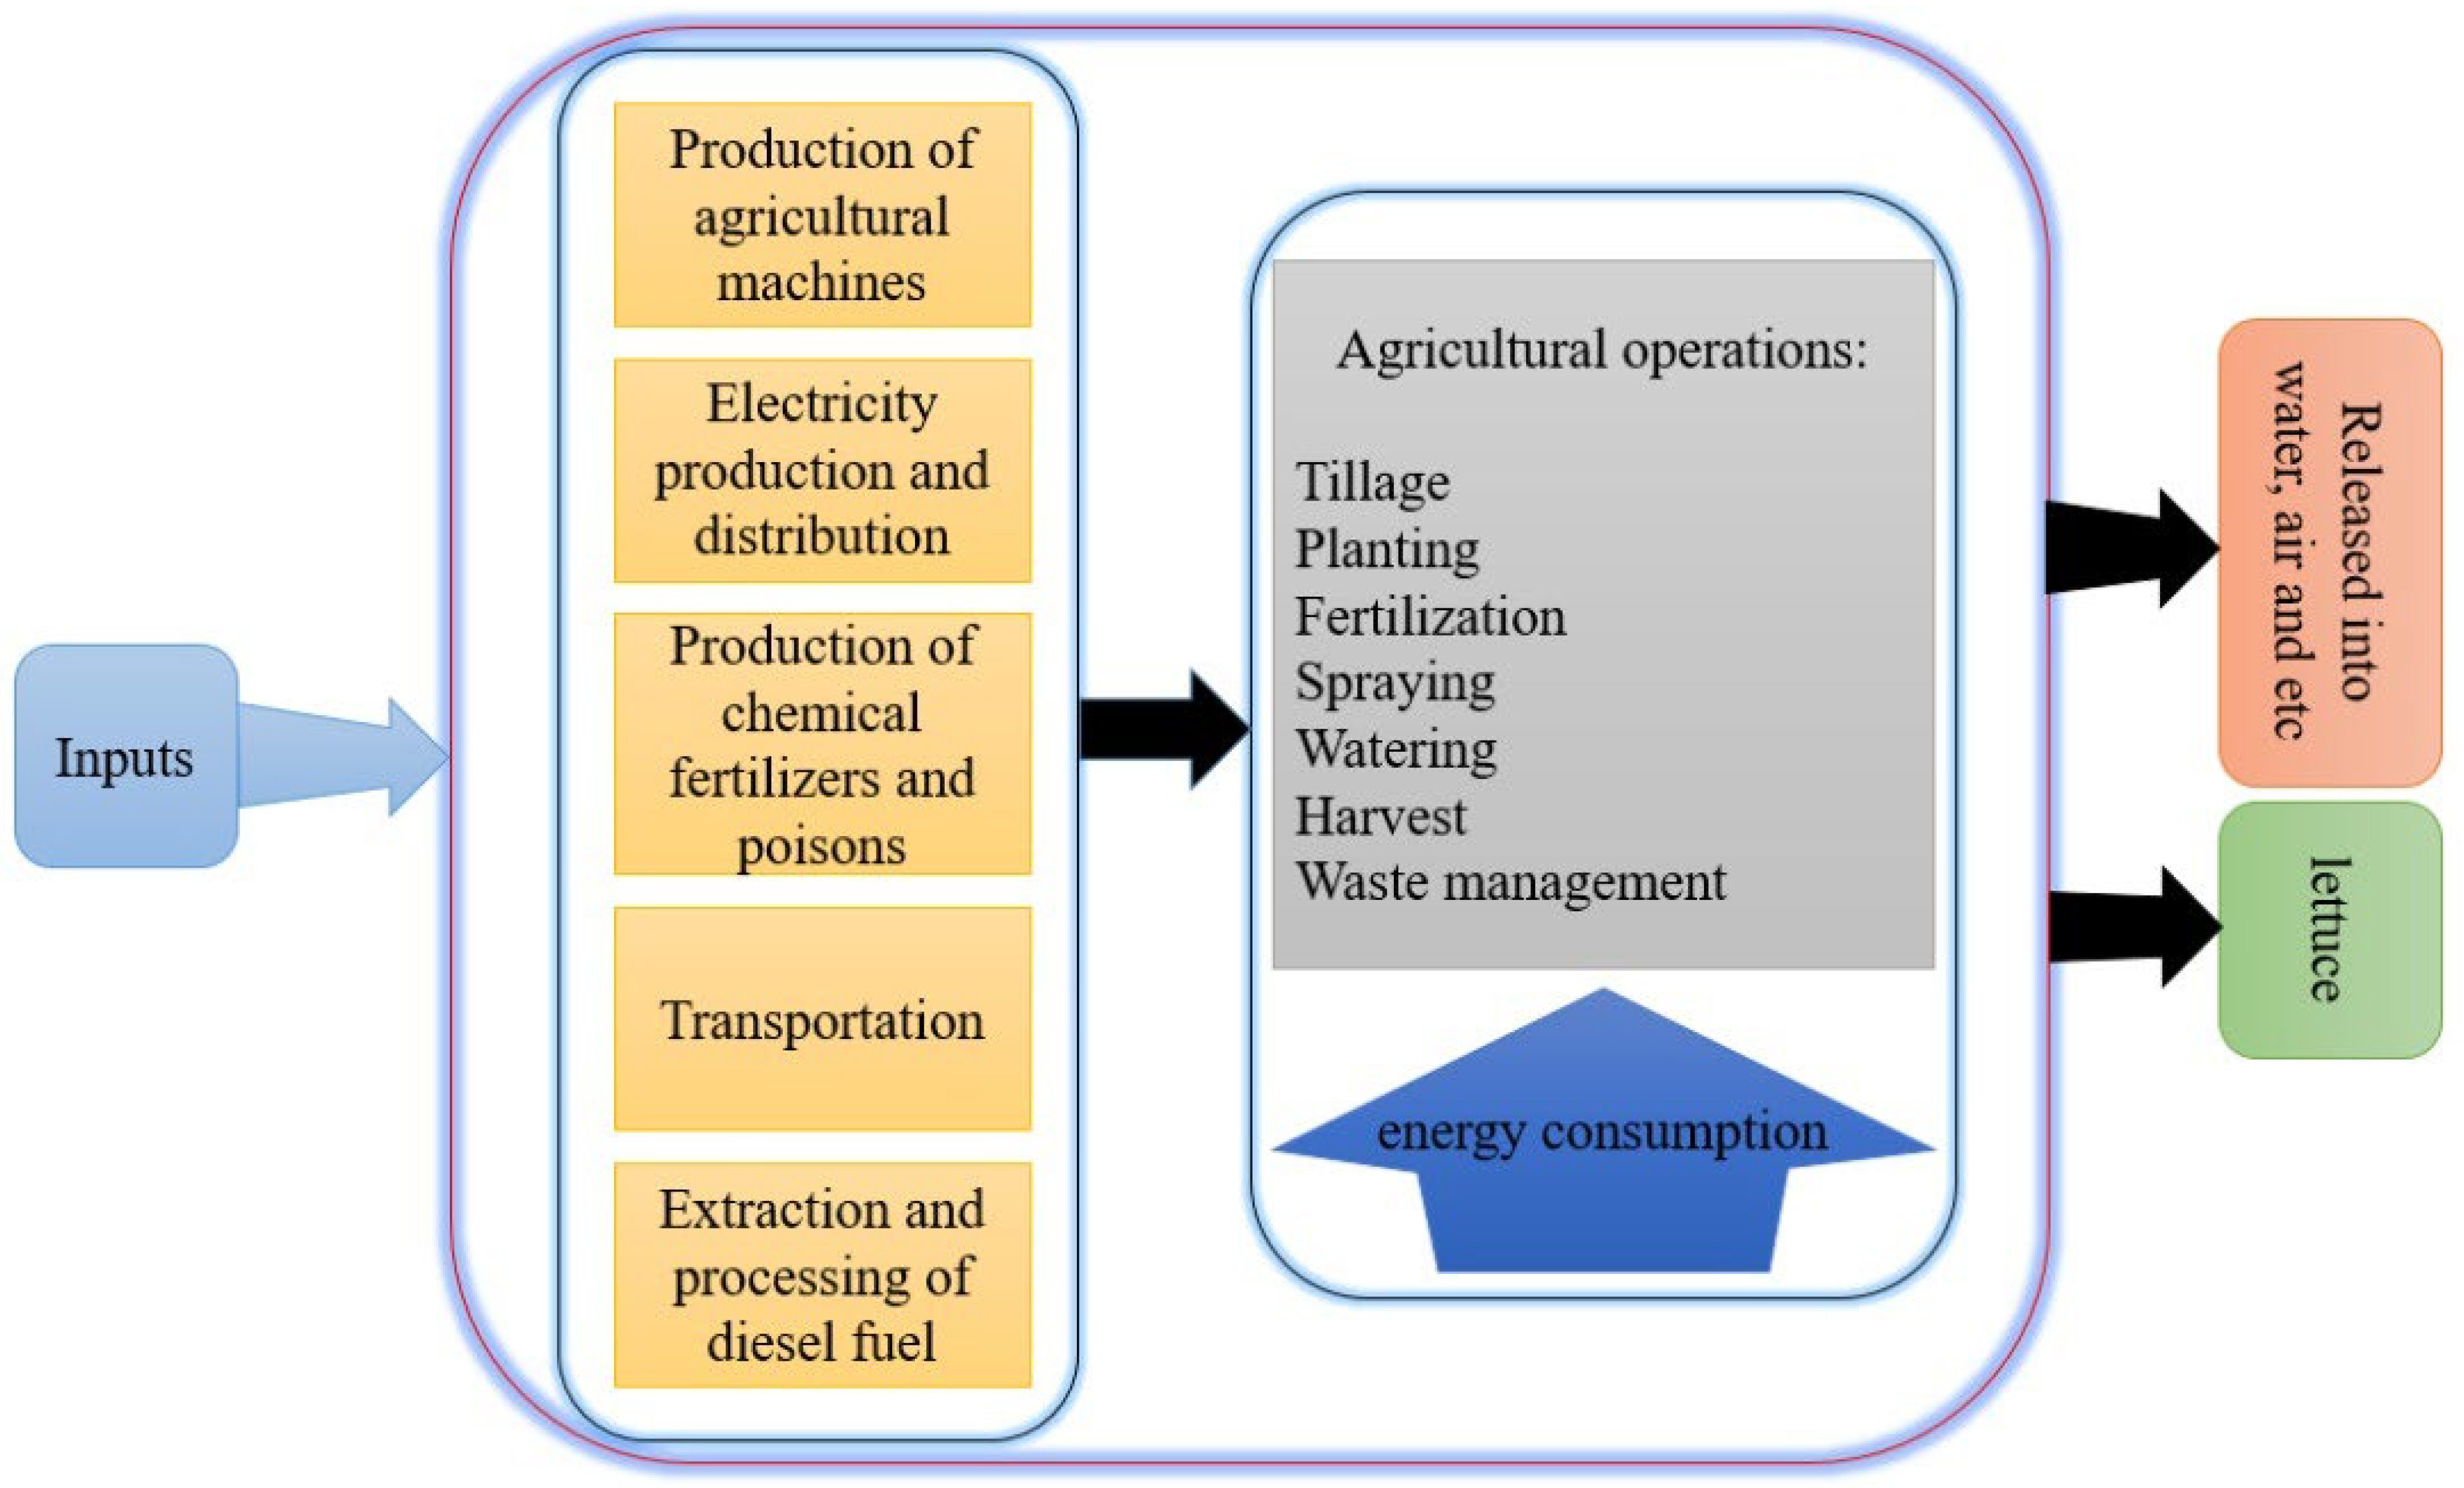
- Life cycle inventory (LCI): This step includes data collection (inputs, intermediate processes, and outputs).
- Life cycle impact assessment (LCIA): This step interprets the potential environmental effects such as acidification, global warming, ozone layer destruction, and ecotoxicity.
- Interpretation: LCI and LCIA results are summarized in this step. The critical points are identified and analyzed. Conclusions and recommendations are also presented for the future.
2. Materials and Methods
2.1. Evaluation of Energy Indices
2.2. Life Cycle Assessment
3. Results
4. Discussion
5. Conclusions
Author Contributions
Funding
Institutional Review Board Statement
Informed Consent Statement
Data Availability Statement
Conflicts of Interest
References
- Khorramifar, A.; Rasekh, M.; Karami, H.; Malaga-Toboła, U.; Gancarz, M. A machine learning method for classification and identification of potato cultivars based on the reaction of MOS type sensor-array. Sensors 2021, 21, 5836. [Google Scholar] [CrossRef] [PubMed]
- Khorramifar, A.; Rasekh, M.; Karami, H.; Mardani Korani, A. Classification of potato cultivars based on Toughness coupled with ANN and LDA methods. J. Environ. Sci. Stud. 2021, 6, 4230–4237. [Google Scholar]
- Rasekh, M.; Karami, H.; Wilson, A.D.; Gancarz, M. Classification and identification of essential oils from herbs and fruits based on a MOS electronic-nose technology. Chemosensors 2021, 9, 142. [Google Scholar] [CrossRef]
- Rasekh, M.; Karami, H.; Fuentes, S.; Kaveh, M.; Rusinek, R.; Gancarz, M. Preliminary study non-destructive sorting techniques for pepper (Capsicum annuum L.) using odor parameter. LWT 2022, 164, 113667. [Google Scholar] [CrossRef]
- Karami, H.; Kaveh, M.; Mirzaee-Ghaleh, E.; Taghinezhad, E. Using PSO and GWO techniques for prediction some drying properties of tarragon (Artemisia dracunculus L.). J. Food Process Eng. 2018, 41, e12921. [Google Scholar] [CrossRef]
- Karami, H.; Kaveh, M.; Golpour, I.; Khalife, E.; Rusinek, R.; Dobrzański, B.; Gancarz, M. Thermodynamic evaluation of the forced convective hybrid-solar dryer during drying process of rosemary (Rosmarinus officinalis L.) leaves. Energies 2021, 14, 5835. [Google Scholar] [CrossRef]
- Parhizi, Z.; Karami, H.; Golpour, I.; Kaveh, M.; Szymanek, M.; Blanco-Marigorta, A.M.; Marcos, J.D.; Khalife, E.; Skowron, S.; Adnan Othman, N.; et al. Modeling and optimization of energy and exergy parameters of a hybrid-solar dryer for basil leaf drying using RSM. Sustainability 2022, 14, 8839. [Google Scholar] [CrossRef]
- Kaveh, M.; Karami, H.; Jahanbakhshi, A. Investigation of mass transfer, thermodynamics, and greenhouse gases properties in pennyroyal drying. J. Food Process Eng. 2020, 43, e13446. [Google Scholar] [CrossRef]
- Khorramifar, A. Using a single wheel tester in the soilbin to syudy the contact pressure between wheel and soil. J. Environ. Sci. Stud. 2021, 6, 4248–4255. [Google Scholar]
- Karami, H.; Lorestani, A.N.; Tahvilian, R. Assessment of kinetics, effective moisture diffusivity, specific energy consumption, and percentage of thyme oil extracted in a hybrid solar-electric dryer. J. Food Process Eng. 2021, 44, e13588. [Google Scholar] [CrossRef]
- Karami, H.; Rasekh, M.; Darvishi, Y. Effect of temperature and air velocity on drying kinetics and organo essential oil extraction efficiency in a hybrid dryer. Innov. Food Technol. 2017, 5, 65–75. [Google Scholar] [CrossRef]
- Karami, H.; Rasekh, M.; Darvishi, Y.; Khaledi, R. Effect of drying temperature and air velocity on the essential oil content of Mentha aquatica L. J. Essent. Oil Bear. Plants 2017, 20, 1131–1136. [Google Scholar] [CrossRef]
- Karami, H.; Rasekh, M. Kinetics mass transfer and modeling of tarragon drying (Artemisia dracunculus L.). Iran. J. Med. Aromat. Plants Res. 2018, 34, 734–747. [Google Scholar] [CrossRef]
- Tatli, S.; Mirzaee-Ghaleh, E.; Rabbani, H.; Karami, H.; Wilson, A.D. Rapid detection of urea fertilizer effects on VOC emissions from cucumber fruits using a MOS E-nose sensor array. Agronomy 2022, 12, 35. [Google Scholar] [CrossRef]
- Moraditochaee, M. Study energy indices of tobacco production in north of Iran. J. Agric. Biol. Sci. 2012, 7, 462–465. [Google Scholar]
- Abeliotis, K.; Detsis, V.; Pappia, C. Life cycle assessment of bean production in the Prespa National Park, Greece. J. Clean. Prod. 2013, 41, 89–96. [Google Scholar] [CrossRef]
- Bartzas, G.; Zaharaki, D.; Komnitsas, K. Life cycle assessment of open field and greenhouse cultivation of lettuce and barley. Inf. Process. Agric. 2015, 2, 191–207. [Google Scholar] [CrossRef] [Green Version]
- Willett, W.; Rockström, J.; Loken, B.; Springmann, M.; Lang, T.; Vermeulen, S.; Garnett, T.; Tilman, D.; DeClerck, F.; Wood, A. Food in the Anthropocene: The EAT—Lancet Commission on healthy diets from sustainable food systems. Lancet 2019, 393, 447–492. [Google Scholar] [CrossRef]
- Eyhorn, F.; Muller, A.; Reganold, J.P.; Frison, E.; Herren, H.R.; Luttikholt, L.; Mueller, A.; Sanders, J.; Scialabba, N.E.-H.; Seufert, V. Sustainability in global agriculture driven by organic farming. Nat. Sustain. 2019, 2, 253–255. [Google Scholar] [CrossRef] [Green Version]
- Tsalidis, G.A. Human health and ecosystem quality benefits with life cycle assessment due to fungicides elimination in agriculture. Sustainability 2022, 14, 846. [Google Scholar] [CrossRef]
- Gancarz, M.; Dobrzański, B.; Malaga-Toboła, U.; Tabor, S.; Combrzyński, M.; Ćwikła, D.; Strobel, W.R.; Oniszczuk, A.; Karami, H.; Darvishi, Y.; et al. Impact of coffee bean roasting on the content of pyridines determined by analysis of volatile organic compounds. Molecules 2022, 27, 1559. [Google Scholar] [CrossRef]
- D’Adamo, I.; Gastaldi, M.; Morone, P.; Rosa, P.; Sassanelli, C.; Settembre-Blundo, D.; Shen, Y. Bioeconomy of sustainability: Drivers, opportunities and policy implications. Sustainability 2021, 14, 200. [Google Scholar] [CrossRef]
- ISO 14040:2006; Environmental Management—Life Cycle Assessment—Principles and Framework. International Organization for Standardization: Geneva, Switzerland, 2006.
- ISO 14044:2006; Environmental Management—Life Cycle Assessment—Requirements and Guidelines. International Organization for Standardization: Geneva, Switzerland, 2006.
- Hanafiah, M.M. Quantifying Effects of Physical, Chemical and Biological Stressors in Life Cycle Assessment. Ph.D. Thesis, Radboud University, Nijmegen, The Netherlands, 2013. [Google Scholar]
- van der Werf, H.M.; Knudsen, M.T.; Cederberg, C. Towards better representation of organic agriculture in life cycle assessment. Nat. Sustain. 2020, 3, 419–425. [Google Scholar] [CrossRef]
- Ludin, N.A.; Mustafa, N.I.; Hanafiah, M.M.; Ibrahim, M.A.; Teridi, M.A.M.; Sepeai, S.; Zaharim, A.; Sopian, K. Prospects of life cycle assessment of renewable energy from solar photovoltaic technologies: A review. Renew. Sustain. Energy Rev. 2018, 96, 11–28. [Google Scholar] [CrossRef]
- Romero-Gámez, M.; Suárez-Rey, E.; Antón, A.; Castilla, N.; Soriano, T. Environmental impact of screenhouse and open-field cultivation using a life cycle analysis: The case study of green bean production. J. Clean. Prod. 2012, 28, 63–69. [Google Scholar] [CrossRef]
- Samavatean, N.; Rafiee, S.; Mobli, H.; Mohammadi, A. An analysis of energy use and relation between energy inputs and yield, costs and income of garlic production in Iran. Renew. Energy 2011, 36, 1808–1813. [Google Scholar] [CrossRef]
- Mobtaker, H.G.; Akram, A.; Keyhani, A. Energy use and sensitivity analysis of energy inputs for alfalfa production in Iran. Energy Sustain. Dev. 2012, 16, 84–89. [Google Scholar] [CrossRef]
- Pimentel, D.; Hurd, L.; Bellotti, A.; Forster, M.; Oka, I.; Sholes, O.; Whitman, R. Food production and the energy crisis. Science 1973, 182, 443–449. [Google Scholar] [CrossRef] [PubMed]
- Nabavi-Pelesaraei, A.; Abdi, R.; Rafiee, S. Energy use pattern and sensitivity analysis of energy inputs and economical models for peanut production in Iran. Int. J. Agric. Crop Sci. 2013, 5, 2193. [Google Scholar]
- Albright, L.; de Villiers, D. Energy investments and CO2 emissions for fresh produce imported into New York State compared to the same crops grown locally. In Final Report Prepared for the New York State Energy Research and Development Authority; Cornell University: New York, NY, USA, 2008. [Google Scholar]
- Mousavi-Avval, S.H.; Rafiee, S.; Jafari, A.; Mohammadi, A. Optimization of energy consumption for soybean production using Data Envelopment Analysis (DEA) approach. Appl. Energy 2011, 88, 3765–3772. [Google Scholar] [CrossRef]
- Unakitan, G.; Hurma, H.; Yilmaz, F. An analysis of energy use efficiency of canola production in Turkey. Energy 2010, 35, 3623–3627. [Google Scholar] [CrossRef]
- Pahlavan, R.; Omid, M.; Akram, A. Modeling and sensitivity analysis of energy inputs for greenhouse cucumber production. J. Agric. Technol. 2011, 7, 1509–1521. [Google Scholar]
- Kitani, O. CIGR Handbook of Agricultural Engineering; Chapter 1 natural energy and biomass, part 1.3 biomass resources; CIGR: Liège, Belgium, 1999; Volume 5 Energy and Biomass Engineering. [Google Scholar]
- Razavinia, B.; Fallah, H.; Niknejad, Y. Energy efficiency and economic analysis of winter cultivation (lettuce, bersim clover, broad bean) in Mazandaran province of Iran. Biol. Forum 2015, 7, 1452–1460. [Google Scholar]
- Khoshnevisan, B.; Rafiee, S.; Mousazadeh, H. Environmental impact assessment of open field and greenhouse strawberry production. Eur. J. Agron. 2013, 50, 29–37. [Google Scholar] [CrossRef]
- Suh, S.; Lenzen, M.; Treloar, G.J.; Hondo, H.; Horvath, A.; Huppes, G.; Jolliet, O.; Klann, U.; Krewitt, W.; Moriguchi, Y. System boundary selection in life-cycle inventories using hybrid approaches. Environ. Sci. Technol. 2004, 38, 657–664. [Google Scholar] [CrossRef]
- Recanati, F.; Arrigoni, A.; Scaccabarozzi, G.; Marveggio, D.; Melià, P.; Dotelli, G. LCA towards sustainable agriculture: The case study of Cupuaçu Jam from agroforestry. Procedia CIRP 2018, 69, 557–561. [Google Scholar] [CrossRef]
- Rouault, A.; Perrin, A.; Renaud-Gentié, C.; Julien, S.; Jourjon, F. Using LCA in a participatory eco-design approach in agriculture: The example of vineyard management. Int. J. Life Cycle Assess. 2020, 25, 1368–1383. [Google Scholar] [CrossRef]
- Khorramifar, A.; Karami, H.; Wilson, A.D.; Sayyah, A.H.A.; Shuba, A.; Lozano, J. Grape cultivar identification and classification by machine olfaction analysis of leaf volatiles. Chemosensors 2022, 10, 125. [Google Scholar] [CrossRef]
- Afkari-Sayyah, A.H.; Khorramifar, A.; Karami, H. Identification and classification of different grape cultivars using cultivar leaves by electroni nose. J. Environ. Sci. Stud. 2021, 6, 4382–4389. [Google Scholar]
- Kheiralipour, K.; Sheikhi, N. Material and energy flow in different bread baking types. Environ. Dev. Sustain. 2021, 23, 10512–10527. [Google Scholar] [CrossRef]
- Dekamin, M.; Kheiralipour, K.; Afshar, R.K. Energy, economic, and environmental assessment of coriander seed production using material flow cost accounting and life cycle assessment. Environ. Sci. Pollut. Res. 2022. [Google Scholar] [CrossRef]
- Pourmehdi, K.; Kheiralipour, K. Assessing the effects of wheat flour production on the environment. Adv. Environ. Technol. 2020, 6, 111–117. [Google Scholar]


| Input and Output | Unit | Energy Equivalent (Megajoules per Unit) | Source |
|---|---|---|---|
| Inputs | |||
| Labor | H | 1.96 | Mobtaker, et al. [30] |
| Machines | Kg | 142.7 | Pimentel, et al. [31] |
| Diesel | L | 56.31 | Nabavi-Pelesaraei, et al. [32] |
| Electricity | kWh | 12 | Albright and de Villiers [33] |
| Nitrogen | Kg | 66.14 | Mousavi-Avval, et al. [34] |
| Phosphorous | Kg | 12.44 | Unakitan, et al. [35] |
| Potassium | Kg | 11.15 | Pahlavan, et al. [36] |
| Pesticide | Kg | 120 | Kitani [37] |
| Seeds | Kg | 16.7 | Albright and de Villiers [33] |
| Output | |||
| Lettuce | Kg | 0.7 | Razavinia, et al. [38] |
| Impact Categories | Symbol | Unit of Measurement |
|---|---|---|
| Reduction of inorganic substance | AD | kg Sb eq |
| Acidification | AC | kg SO2 eq |
| Eutrophication | EU | kg PO43− eq |
| Global warming | GW | kg CO2 eq a |
| Ozone layer defect | OD | kg CFC-11 eq |
| Human toxicity | HT | kg 1,4-DCB eq b |
| Surface water toxicity | FAET | kg 1,4-DCB eq b |
| Free water toxicity | MAET | kg 1,4-DCB eq b |
| Soil toxicity | TE | kg 1,4-DCB eq b |
| Phytochemical oxidation | PhO | kg C2H4 eq |
| Input and Output | Energy | Percentage |
|---|---|---|
| Labor force | 452.76 | 0.9 |
| Agricultural machines | 5708 | 11.37 |
| Diesel | 19,145.4 | 38.14 |
| Electricity | 8400 | 16.74 |
| Nitrogen | 11,905.2 | 23.72 |
| Phosphorous | 1007.64 | 2.01 |
| Potassium | 903.15 | 1.8 |
| Chemical pesticides | 2664 | 5.31 |
| Seeds | 5.01 | 0.01 |
| Lettuce | 20,269.2 | 100 |
| Index or Type of Energy | Unit | Average Value | Percent |
|---|---|---|---|
| Energy ratio | - | 0.4 | - |
| Energy productivity | kg/MJ | 17.28 | - |
| Specific energy | MJ/kg | 0.06 | - |
| NEG | MJ/ha | −29,922 | - |
| Direct energy | MJ/ha | 27,998.16 | 55.78 |
| Indirect energy | MJ/ha | 22,193 | 44.22 |
| Renewable energy | MJ/ha | 457.77 | 0.91 |
| Nonrenewable energy | MJ/ha | 49,733.39 | 99.09 |
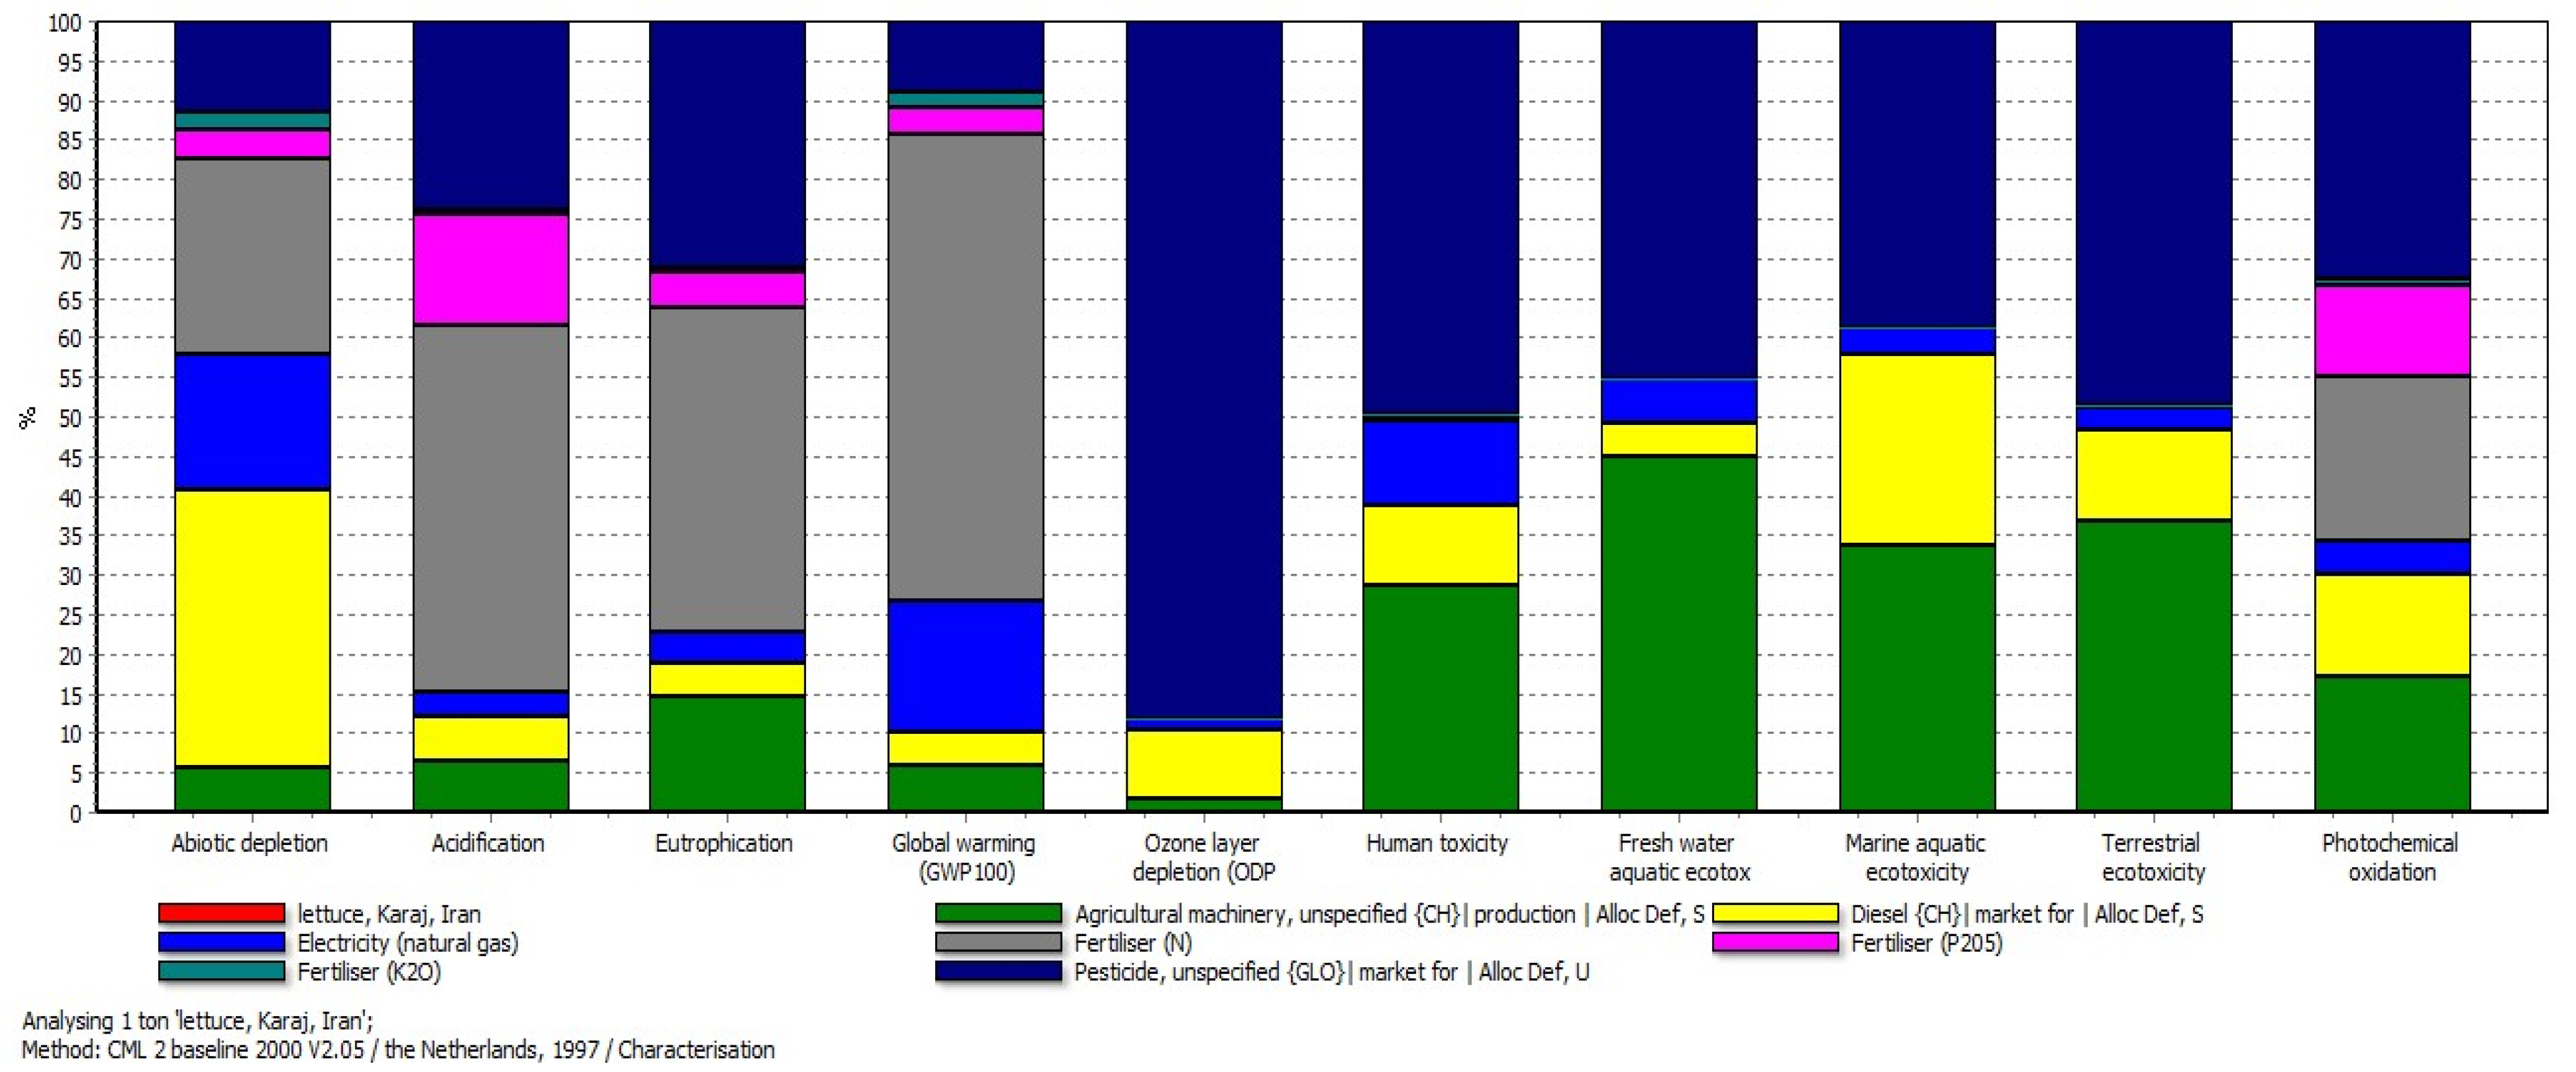
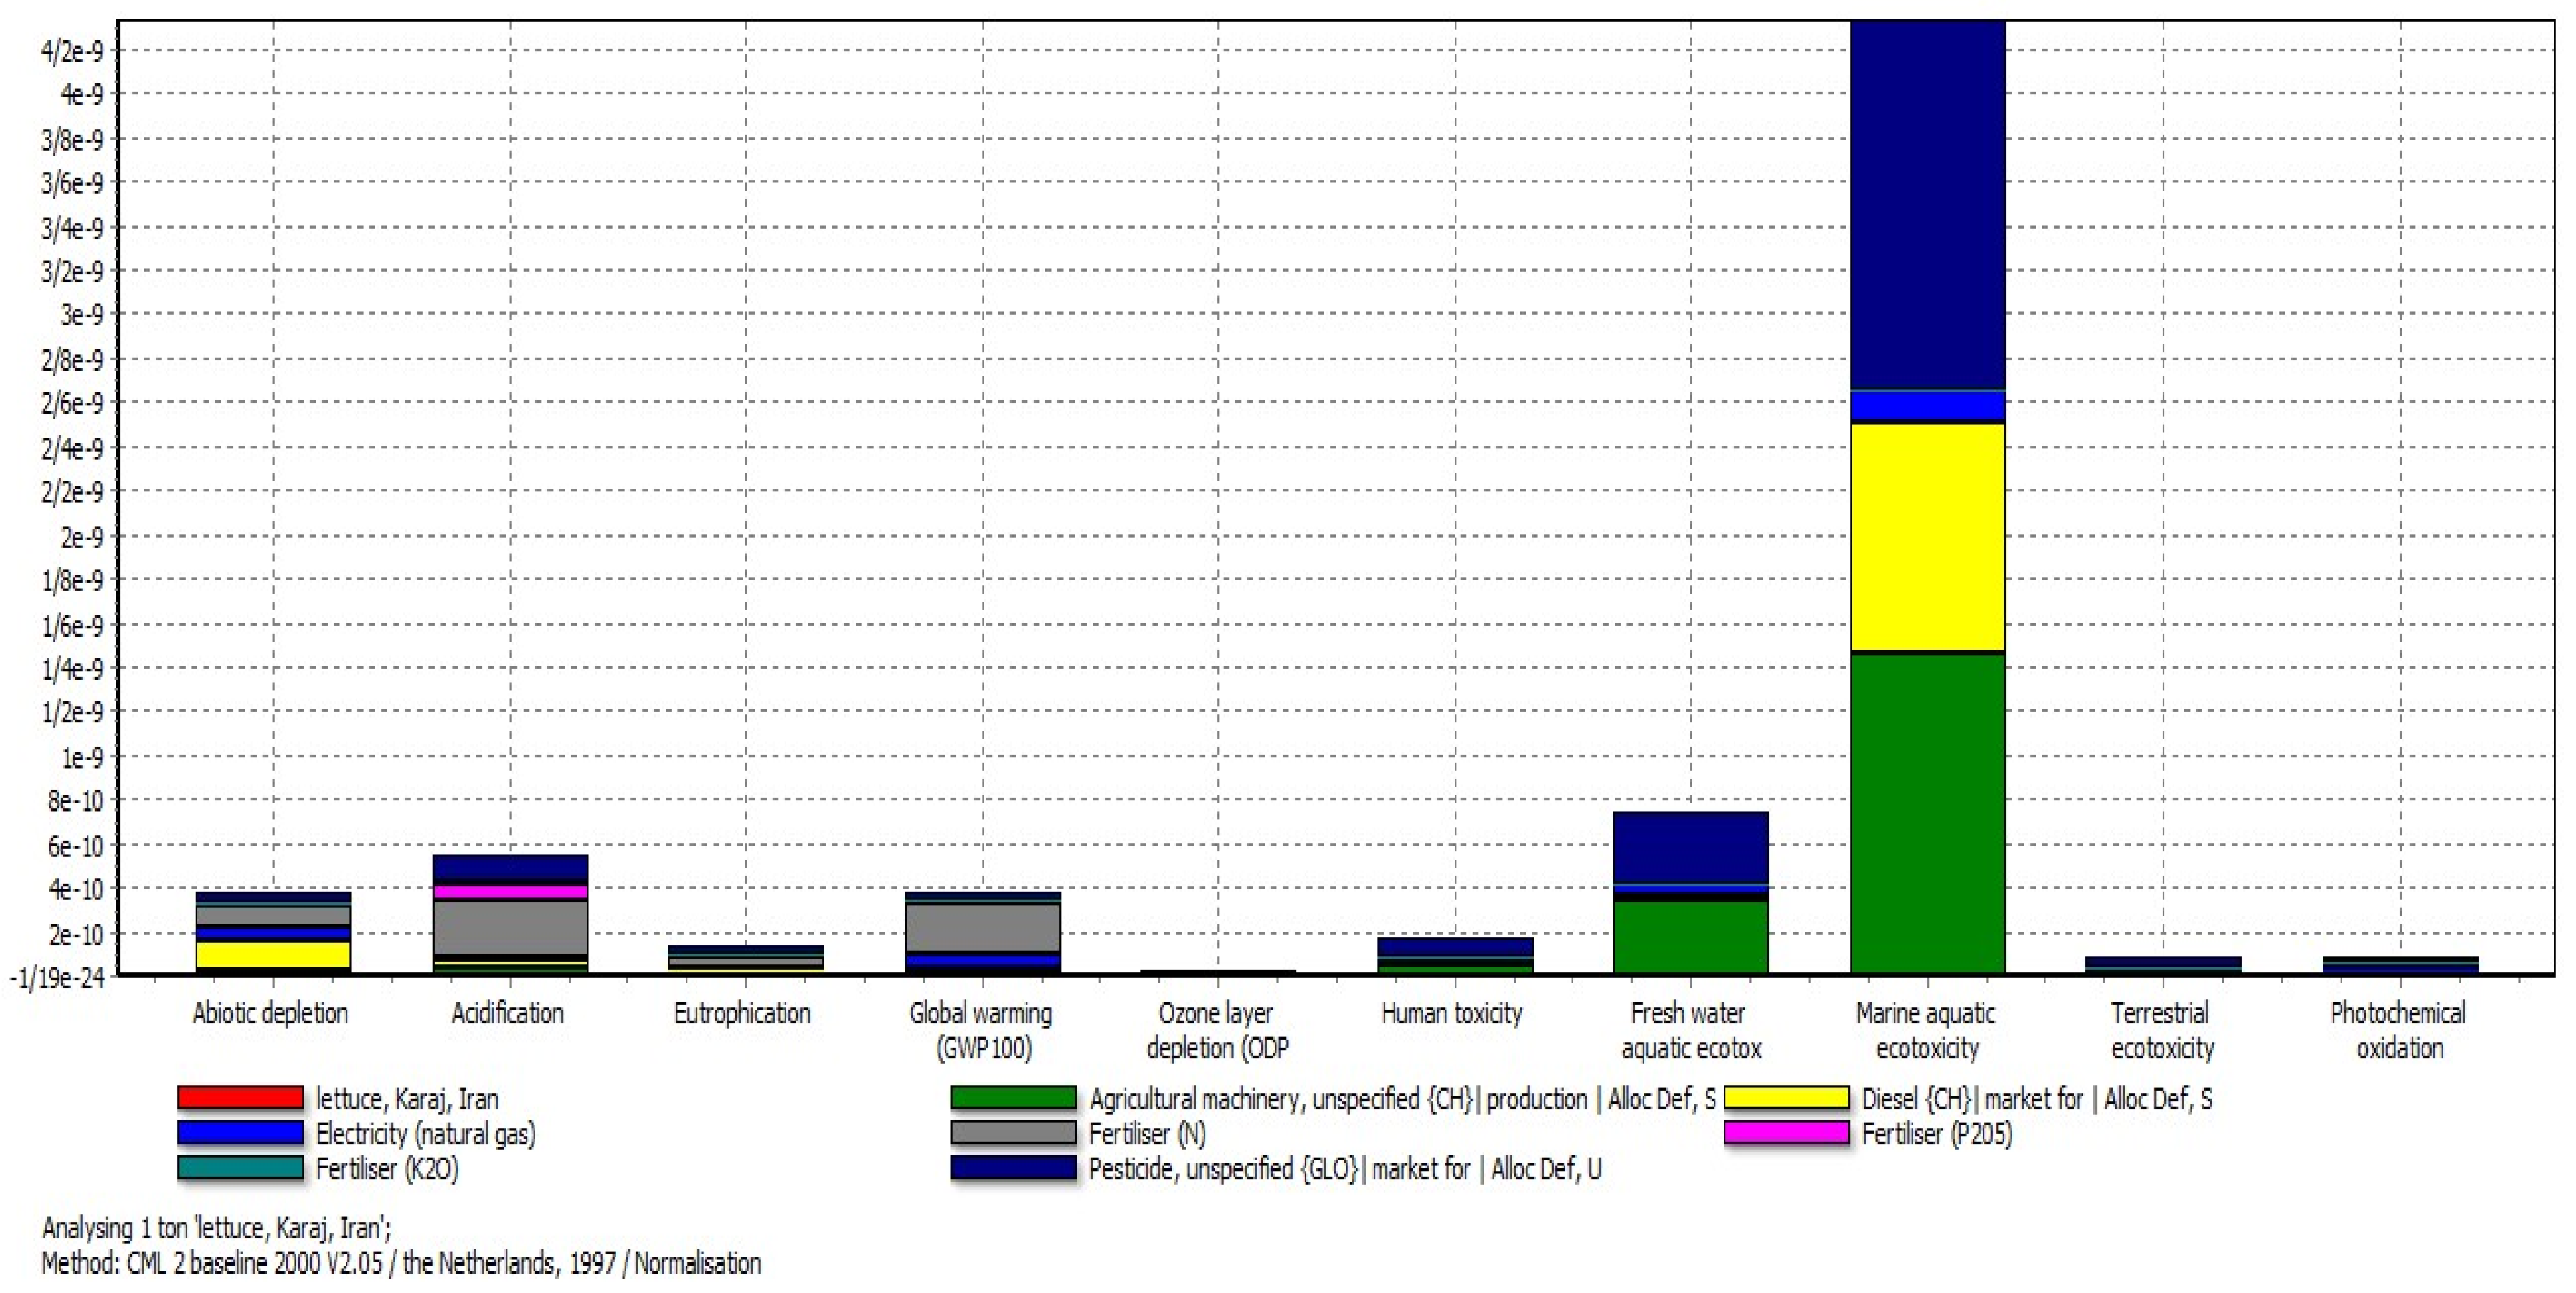
| Impact Categories | Unit | Estimated Value |
|---|---|---|
| Reduction of inorganic substances | kg Sb eq | 0.64 |
| Acidification | kg SO2 eq | 0.37 |
| Eutrophication | kg PO43− eq | 0.07 |
| Global warming | kg CO2 eq | 96.01 |
| Ozone layer defect | kg CFC-11 eq | 2.47 × 10⁻⁵ |
| Human toxicity | kg 1,4-DCB eq | 31.51 |
| Surface water toxicity | kg 1,4-DCB eq | 5.6 |
| Free water toxicity | kg 1,4-DCB eq | 13,795.21 |
| Soil toxicity | kg 1,4-DCB eq | 0.08 |
| Phytochemical oxidation | kg C2H4 eq | 0.02 |
Publisher’s Note: MDPI stays neutral with regard to jurisdictional claims in published maps and institutional affiliations. |
© 2022 by the authors. Licensee MDPI, Basel, Switzerland. This article is an open access article distributed under the terms and conditions of the Creative Commons Attribution (CC BY) license (https://creativecommons.org/licenses/by/4.0/).
Share and Cite
Mousavi, A.; Aghbolaghi, E.A.; Khorramifar, A.; Gancarz, M.; Darvishi, Y.; Stasiak, M.; Miernik, A.; Karami, H. Life Cycle Assessment for Environmental Impact Reduction and Evaluation of the Energy Indices in Lettuce Production. Appl. Sci. 2022, 12, 10348. https://doi.org/10.3390/app122010348
Mousavi A, Aghbolaghi EA, Khorramifar A, Gancarz M, Darvishi Y, Stasiak M, Miernik A, Karami H. Life Cycle Assessment for Environmental Impact Reduction and Evaluation of the Energy Indices in Lettuce Production. Applied Sciences. 2022; 12(20):10348. https://doi.org/10.3390/app122010348
Chicago/Turabian StyleMousavi, Ali, Ebrahim Asadi Aghbolaghi, Ali Khorramifar, Marek Gancarz, Yousef Darvishi, Mateusz Stasiak, Anna Miernik, and Hamed Karami. 2022. "Life Cycle Assessment for Environmental Impact Reduction and Evaluation of the Energy Indices in Lettuce Production" Applied Sciences 12, no. 20: 10348. https://doi.org/10.3390/app122010348