
Analysis of Fault Conditions in the Production of Prestressed Concrete Sleepers

 ,
,  ,
,  ,
,  , , and
Abstract
:1. Introduction
2. Characteristics of the Manufacturing Process of Prestressed Railway Concrete Sleepers in the Context of the Failure Causes
Sleeper Production Process
- The sleeper mold is loaded on a rail conveyor, cleaned of any dirt and concrete residues, and a separation emulsion is applied to its walls. In 1 mold, 4–5 sleepers are produced, depending on the length of the sleeper;
- Steel wires, stirrups, dowels, separating faces, and other equipment elements are placed in the mold. The longitudinal reinforcement consists of 40 wires with a diameter of 3 mm, which are separated and held by the jaws. The 8 × 5 matrix consists of 8 wires in each row. The jaws are tightened with two flanges, using two bolts. The bolts are tightened using a pneumatic tightener with a prescribed torque of 23 Nm. In the first step, the bolts on one side of the mold are tightened and after tensioning the reinforcement, the bolts on the other side of the mold are tightened. The range of tests for prestressing reinforcement is specified in the standard PrEN 10138-2 [34];
- The reinforcement is prestressed by a tension line to the prescribed value. The magnitude of the tensile force is recorded. Prestressed steel reinforcement must comply with the requirements of PrEN 10138-2, steel for other reinforcements must comply with EN 10 080 [35];
- The produced concrete mix is dosed into the mold and then compacted vibrating the whole mold for the prescribed time. The concrete must meet the requirements of EN 206-01 [36] and EN 13230-1 [32], it must also meet the requirements for frost resistance T 200 according to STN 73 1322 [37]. The temperature of the cement when dosing into the mixer must not exceed 60 °C. The quality of the aggregate must comply with the requirements of EN 12 620 + A1: 2008-12 [38];
- At the workstation for accelerating the hardening (hydration) of sleepers, the molds are transferred by crane from a rail conveyor into a steaming chamber with a capacity of 100 molds. The steaming process takes about 12 h. The tests must show the actual temperatures inside and around the sleeper. The temperature profile is recorded and should not exceed 45 °C.
3. Methods
4. The Results
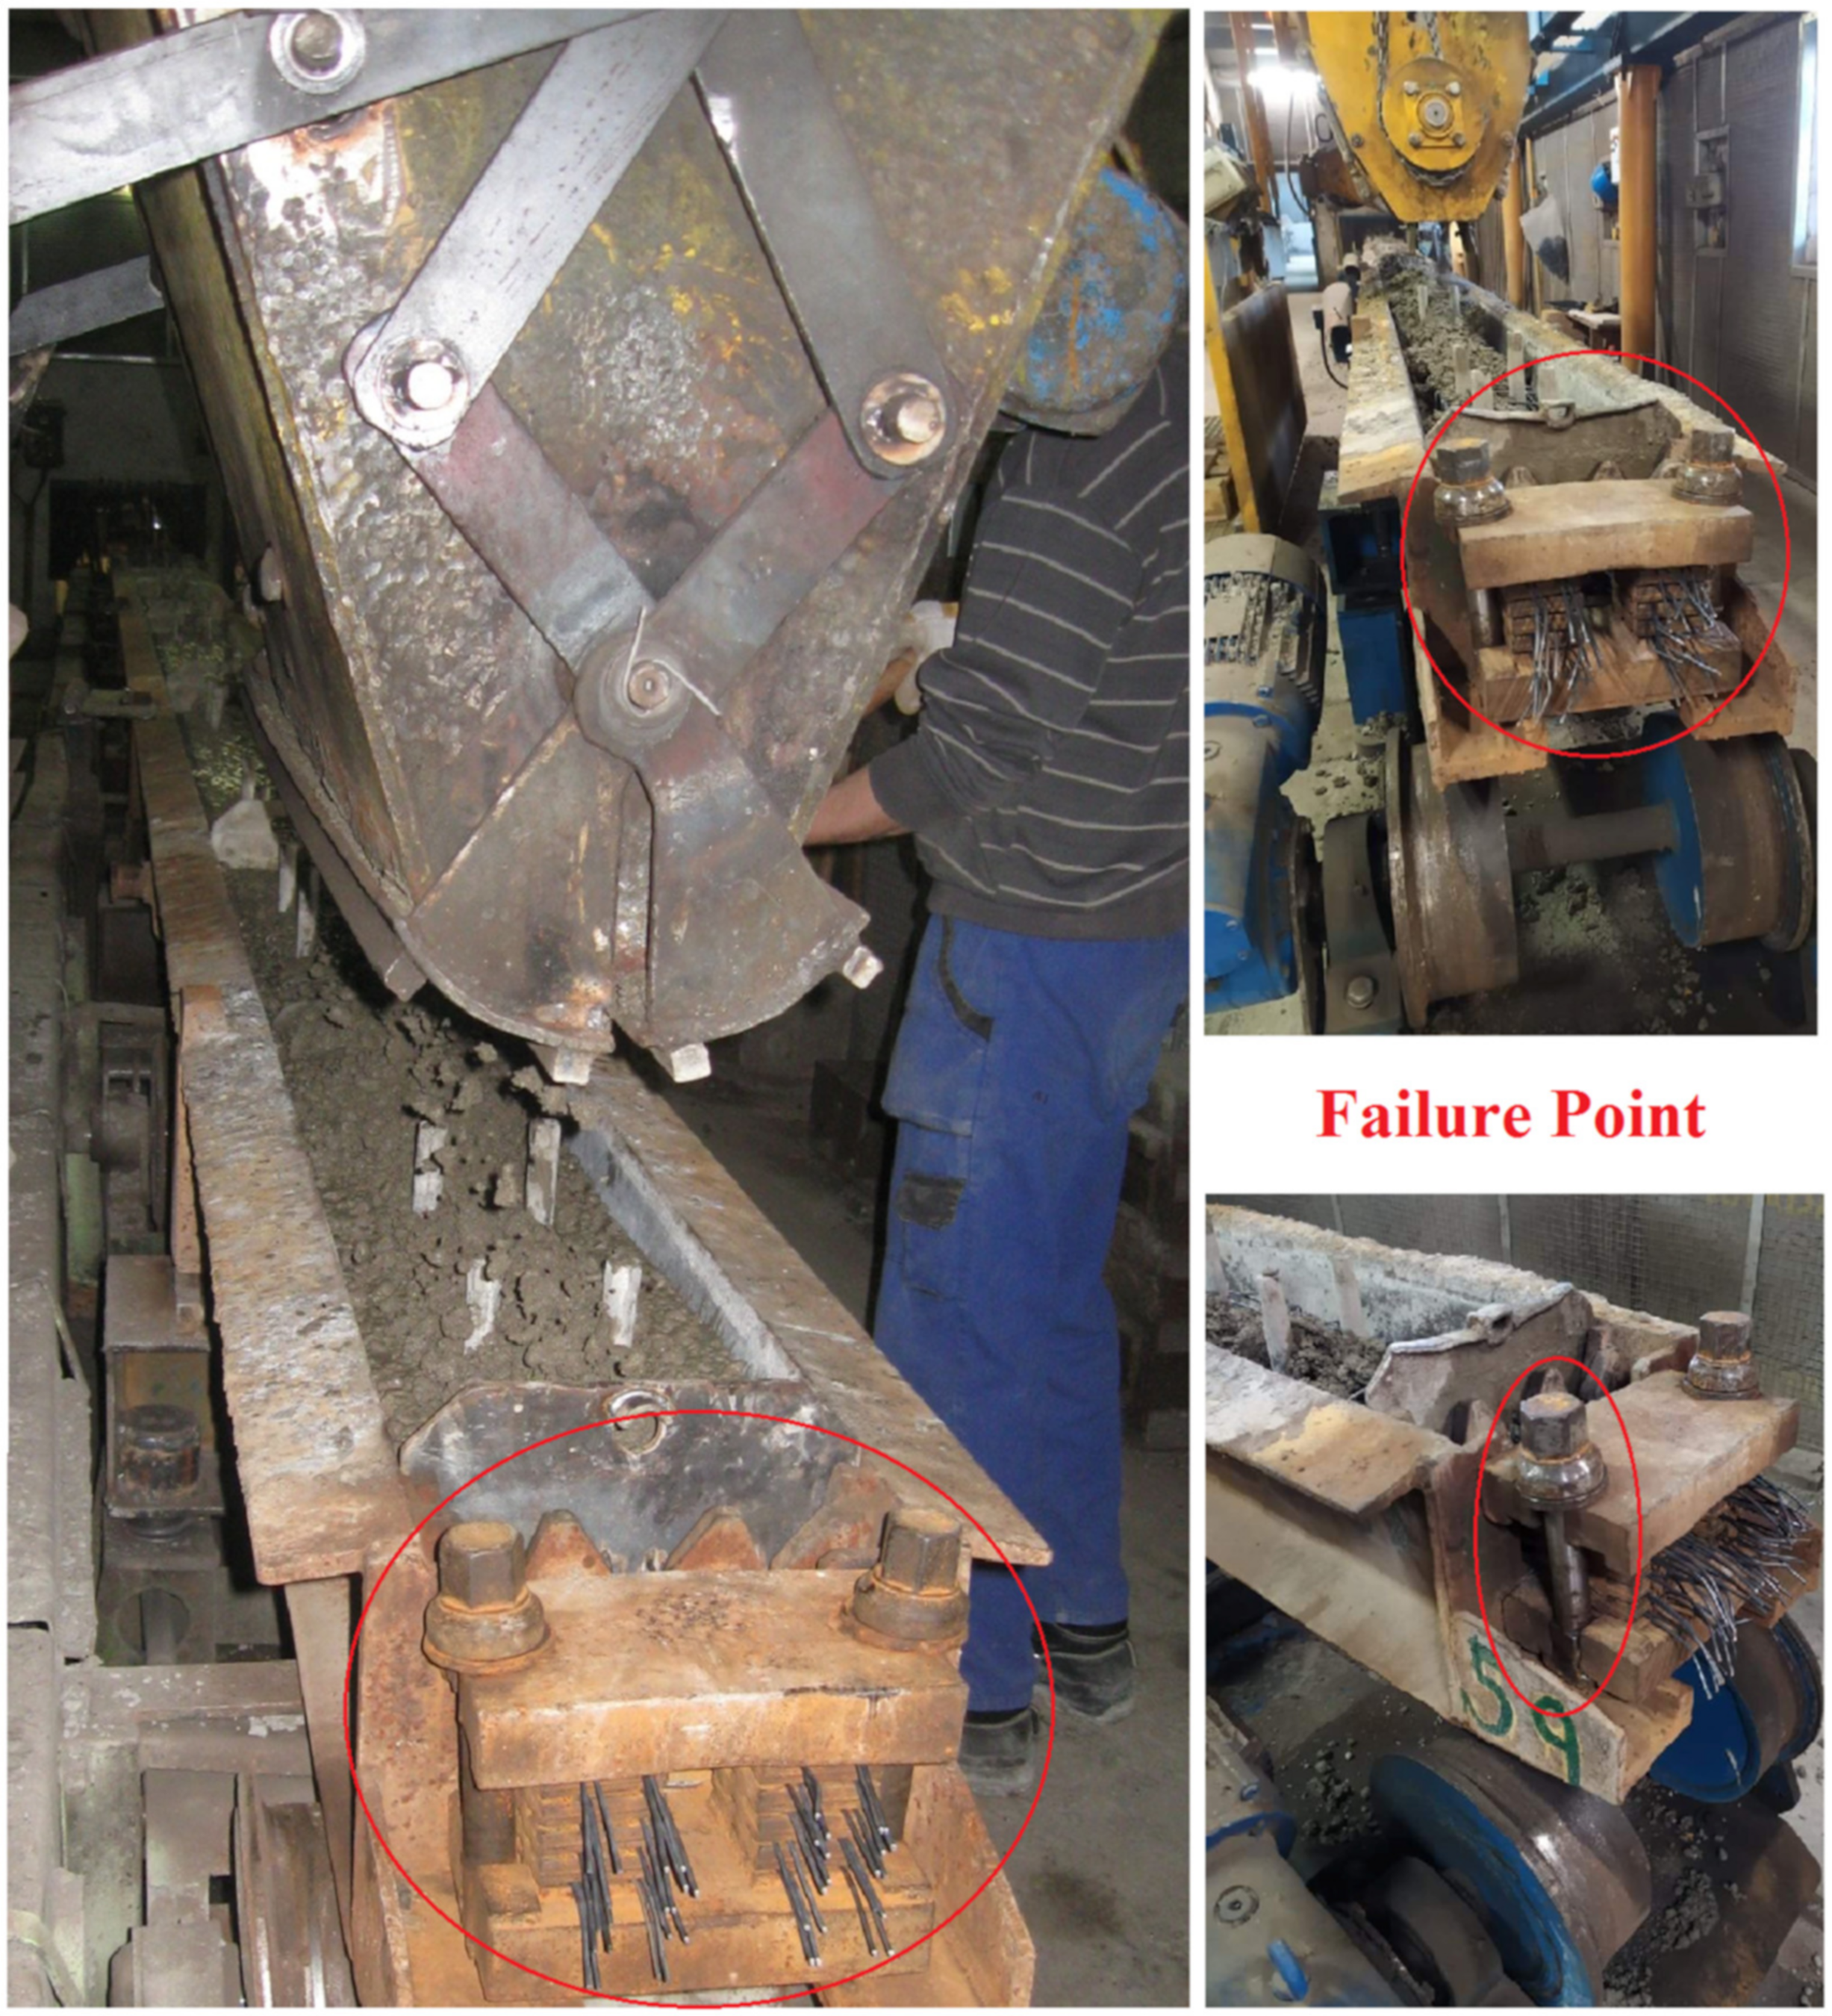
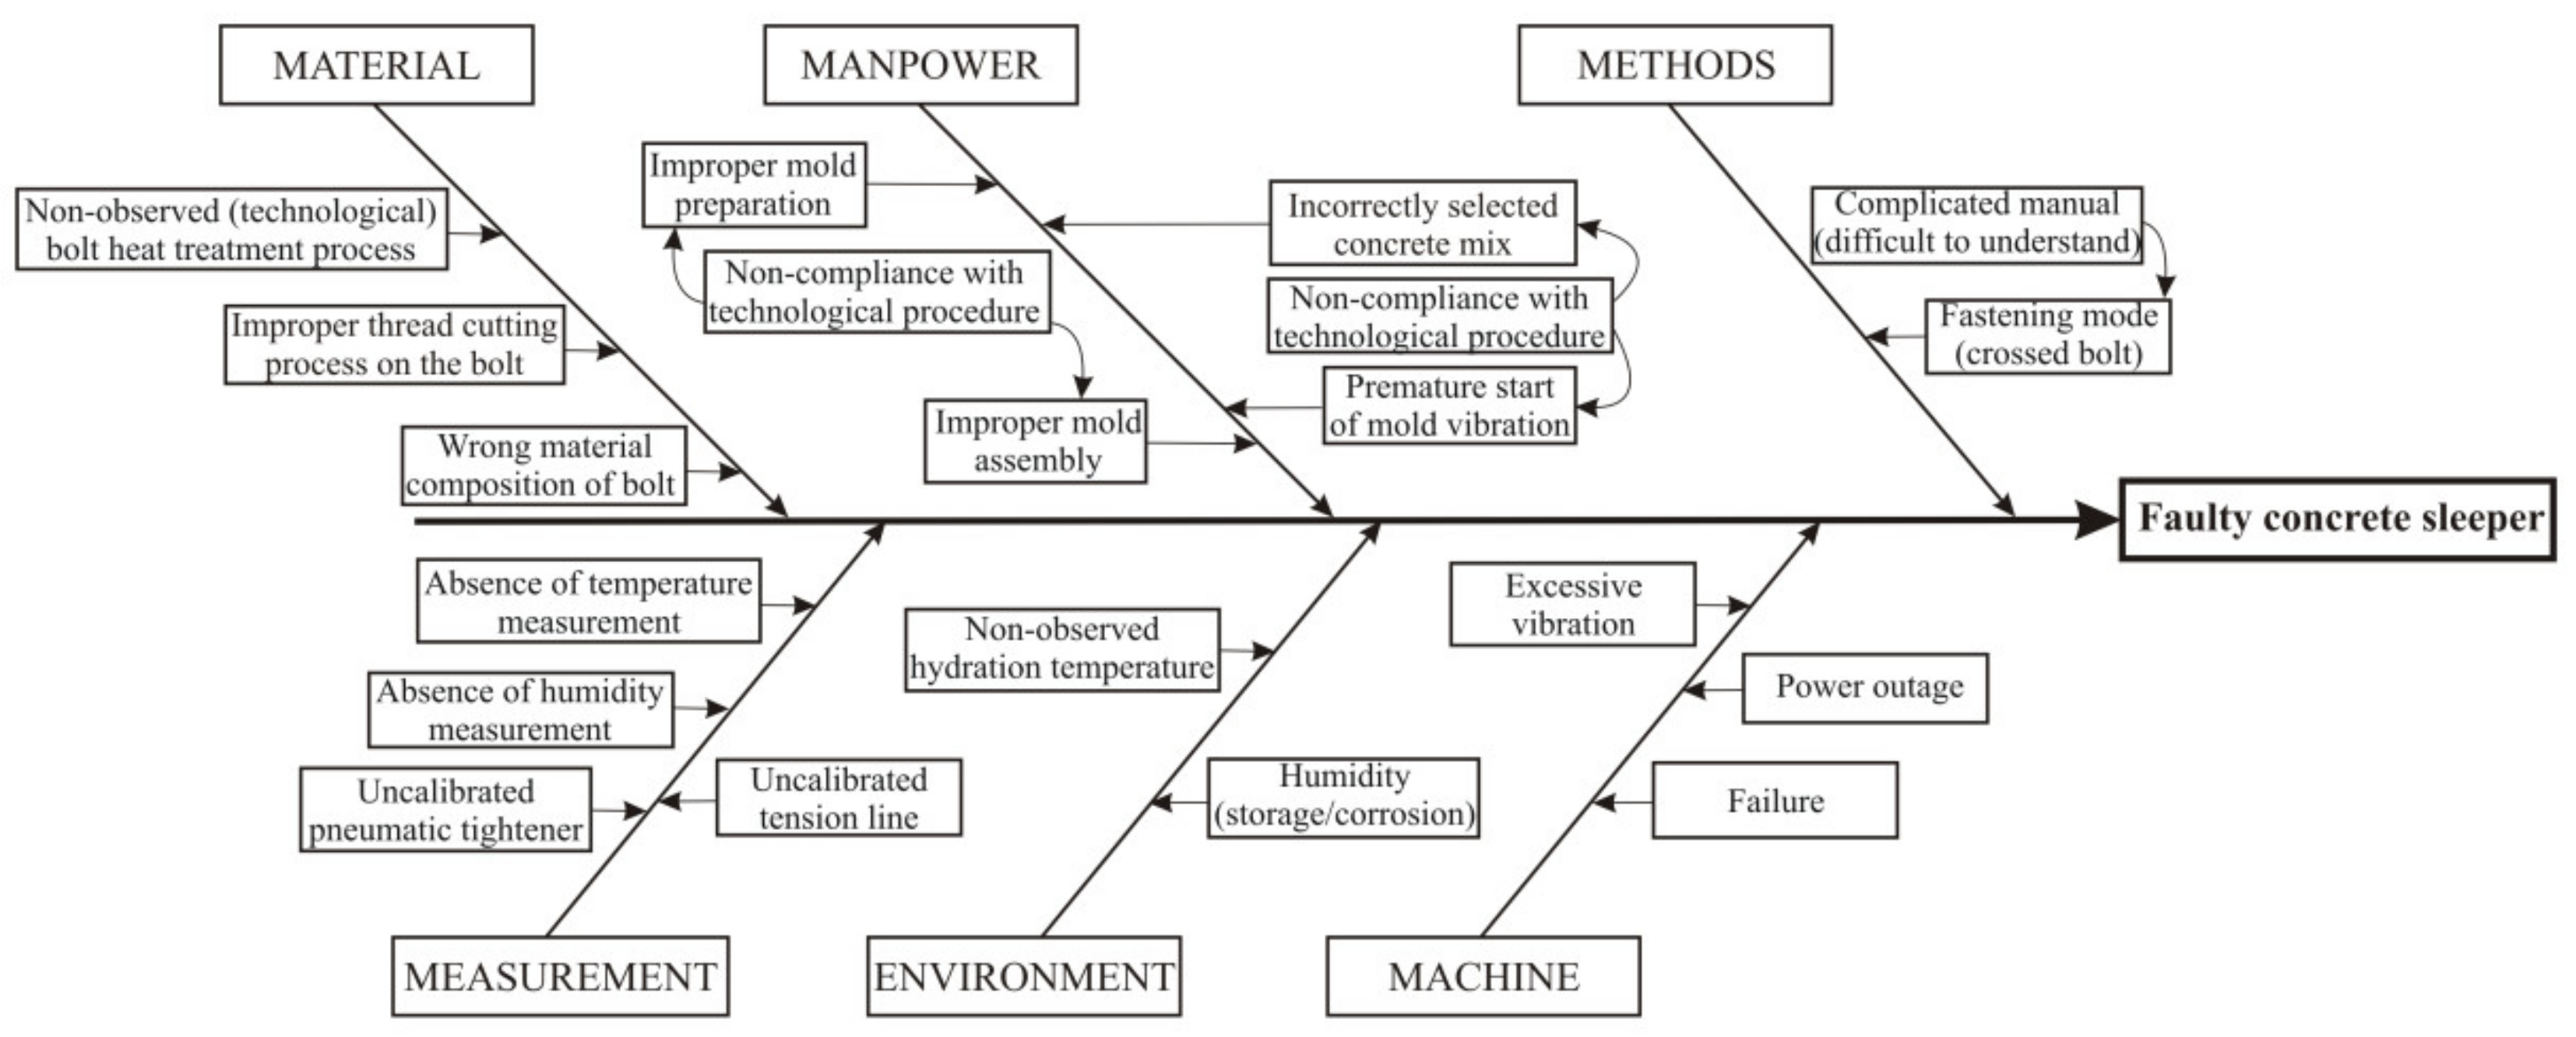
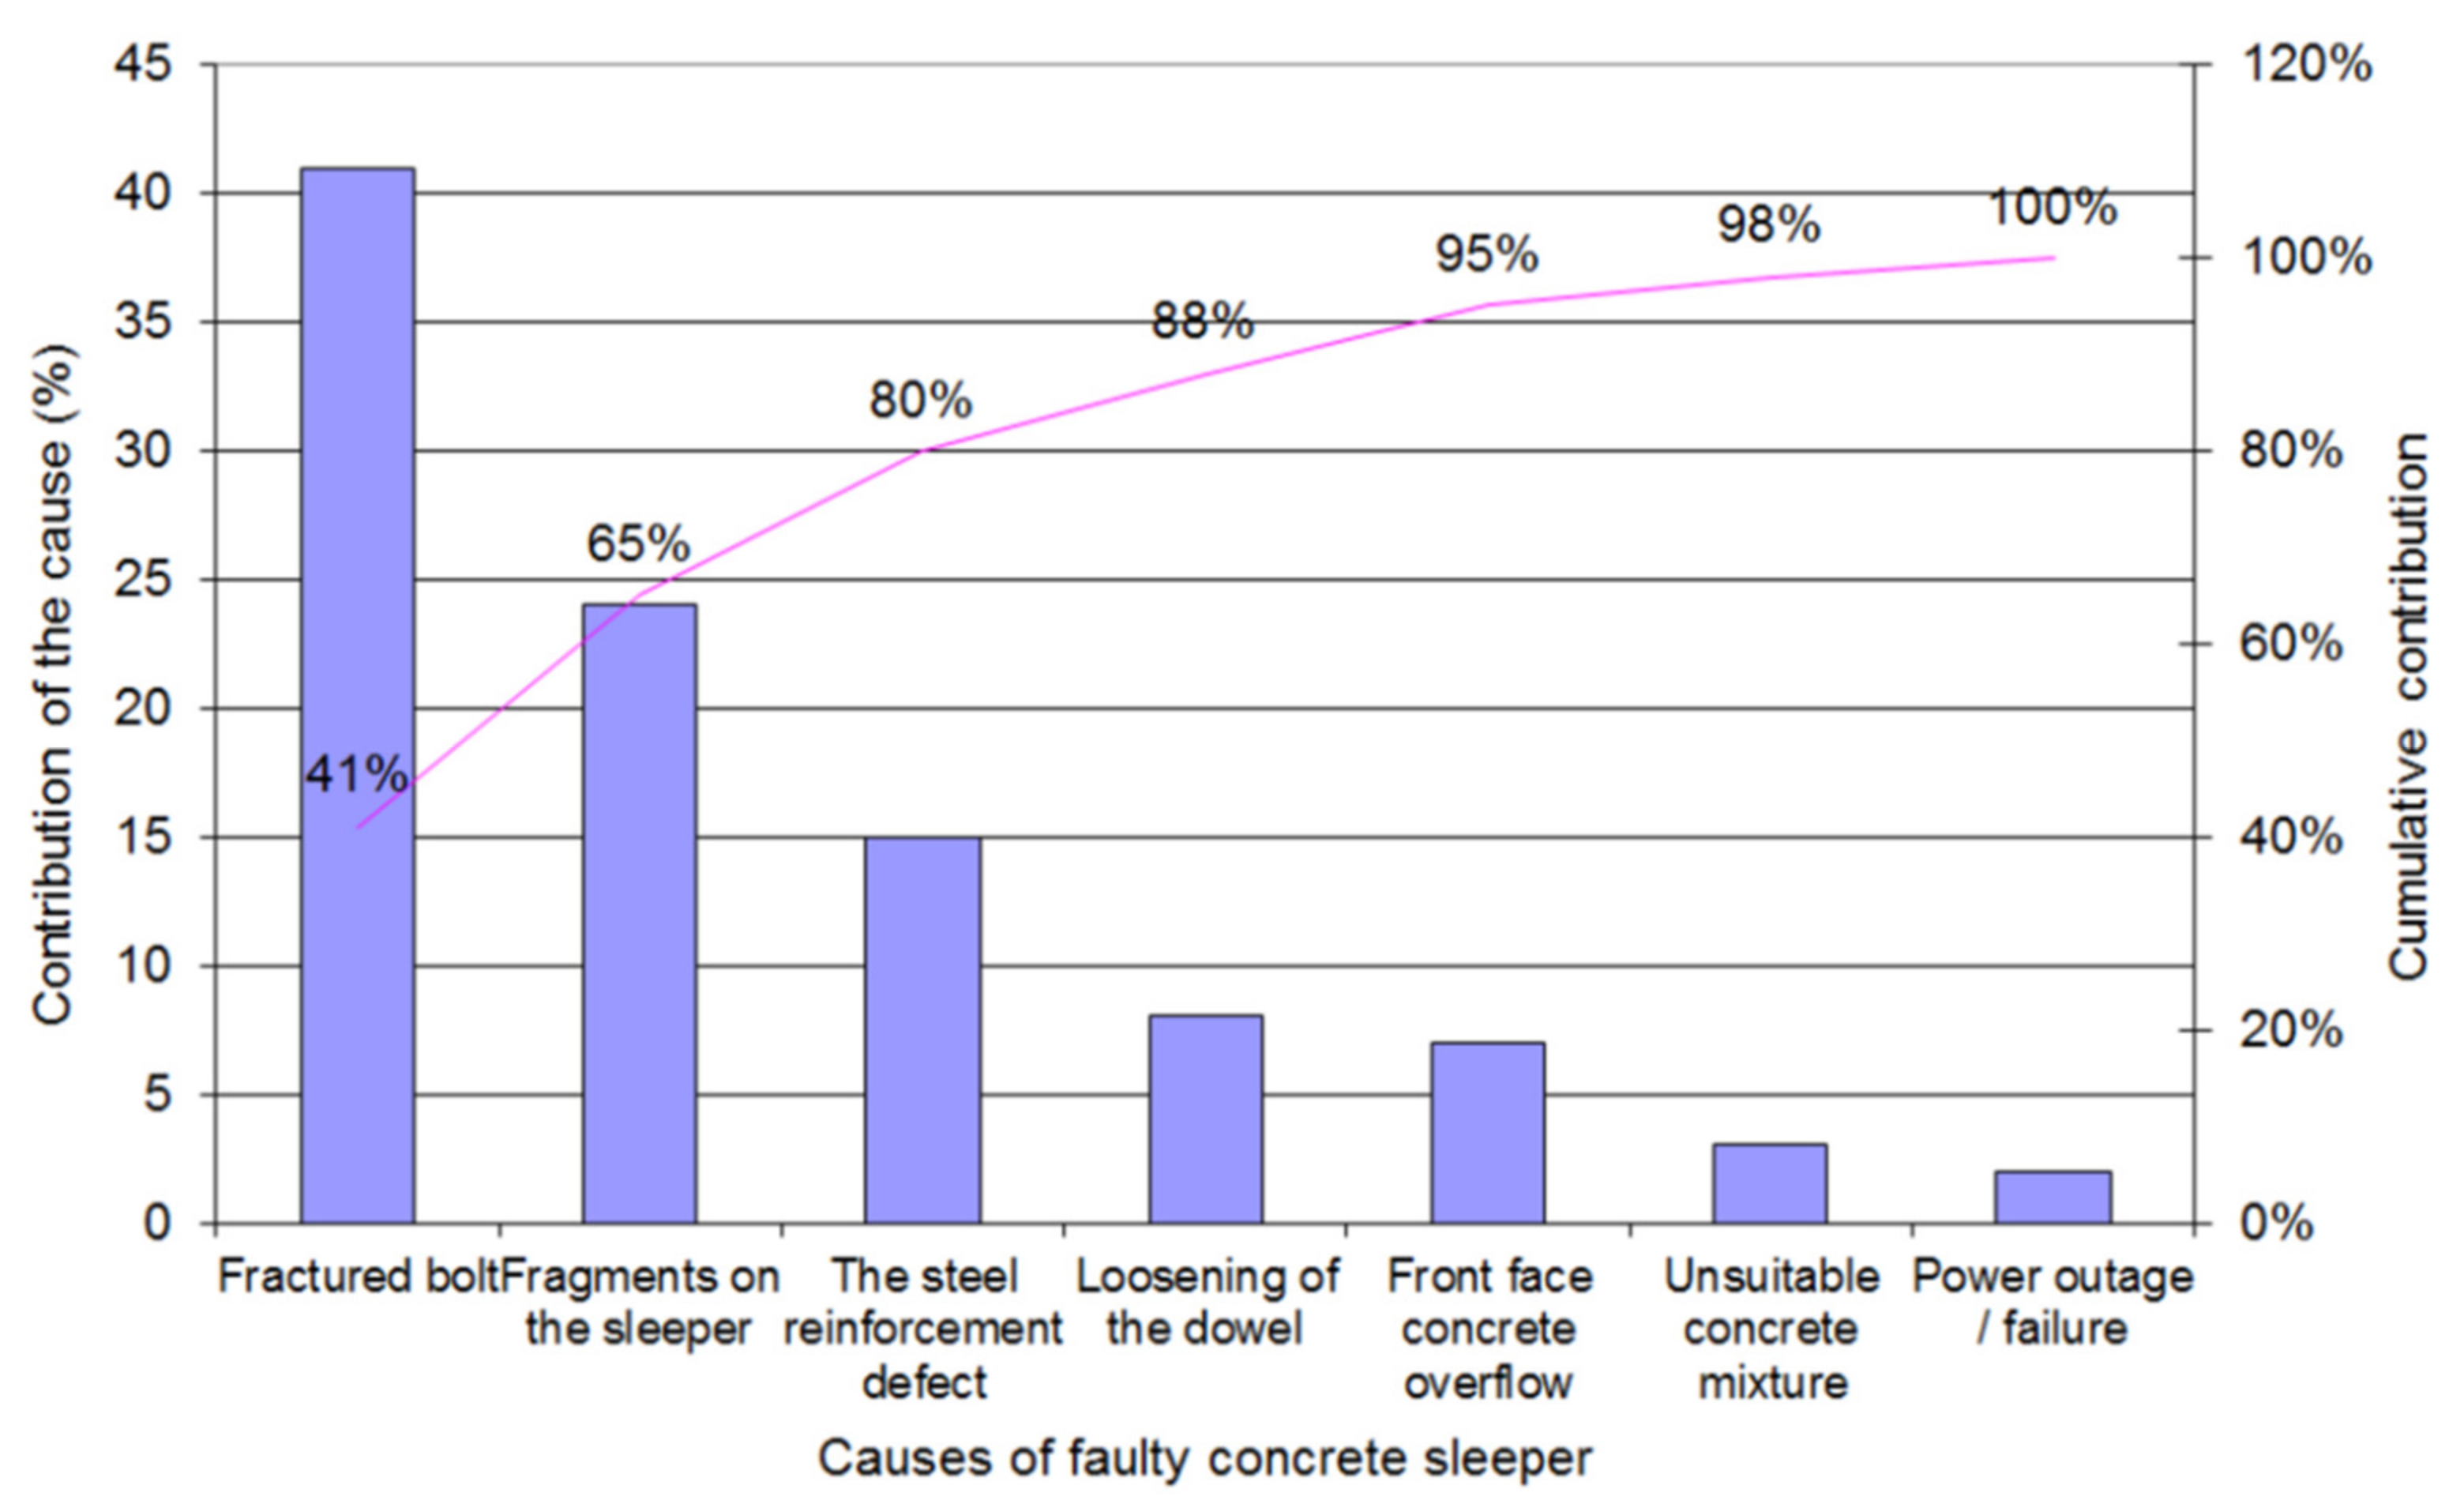
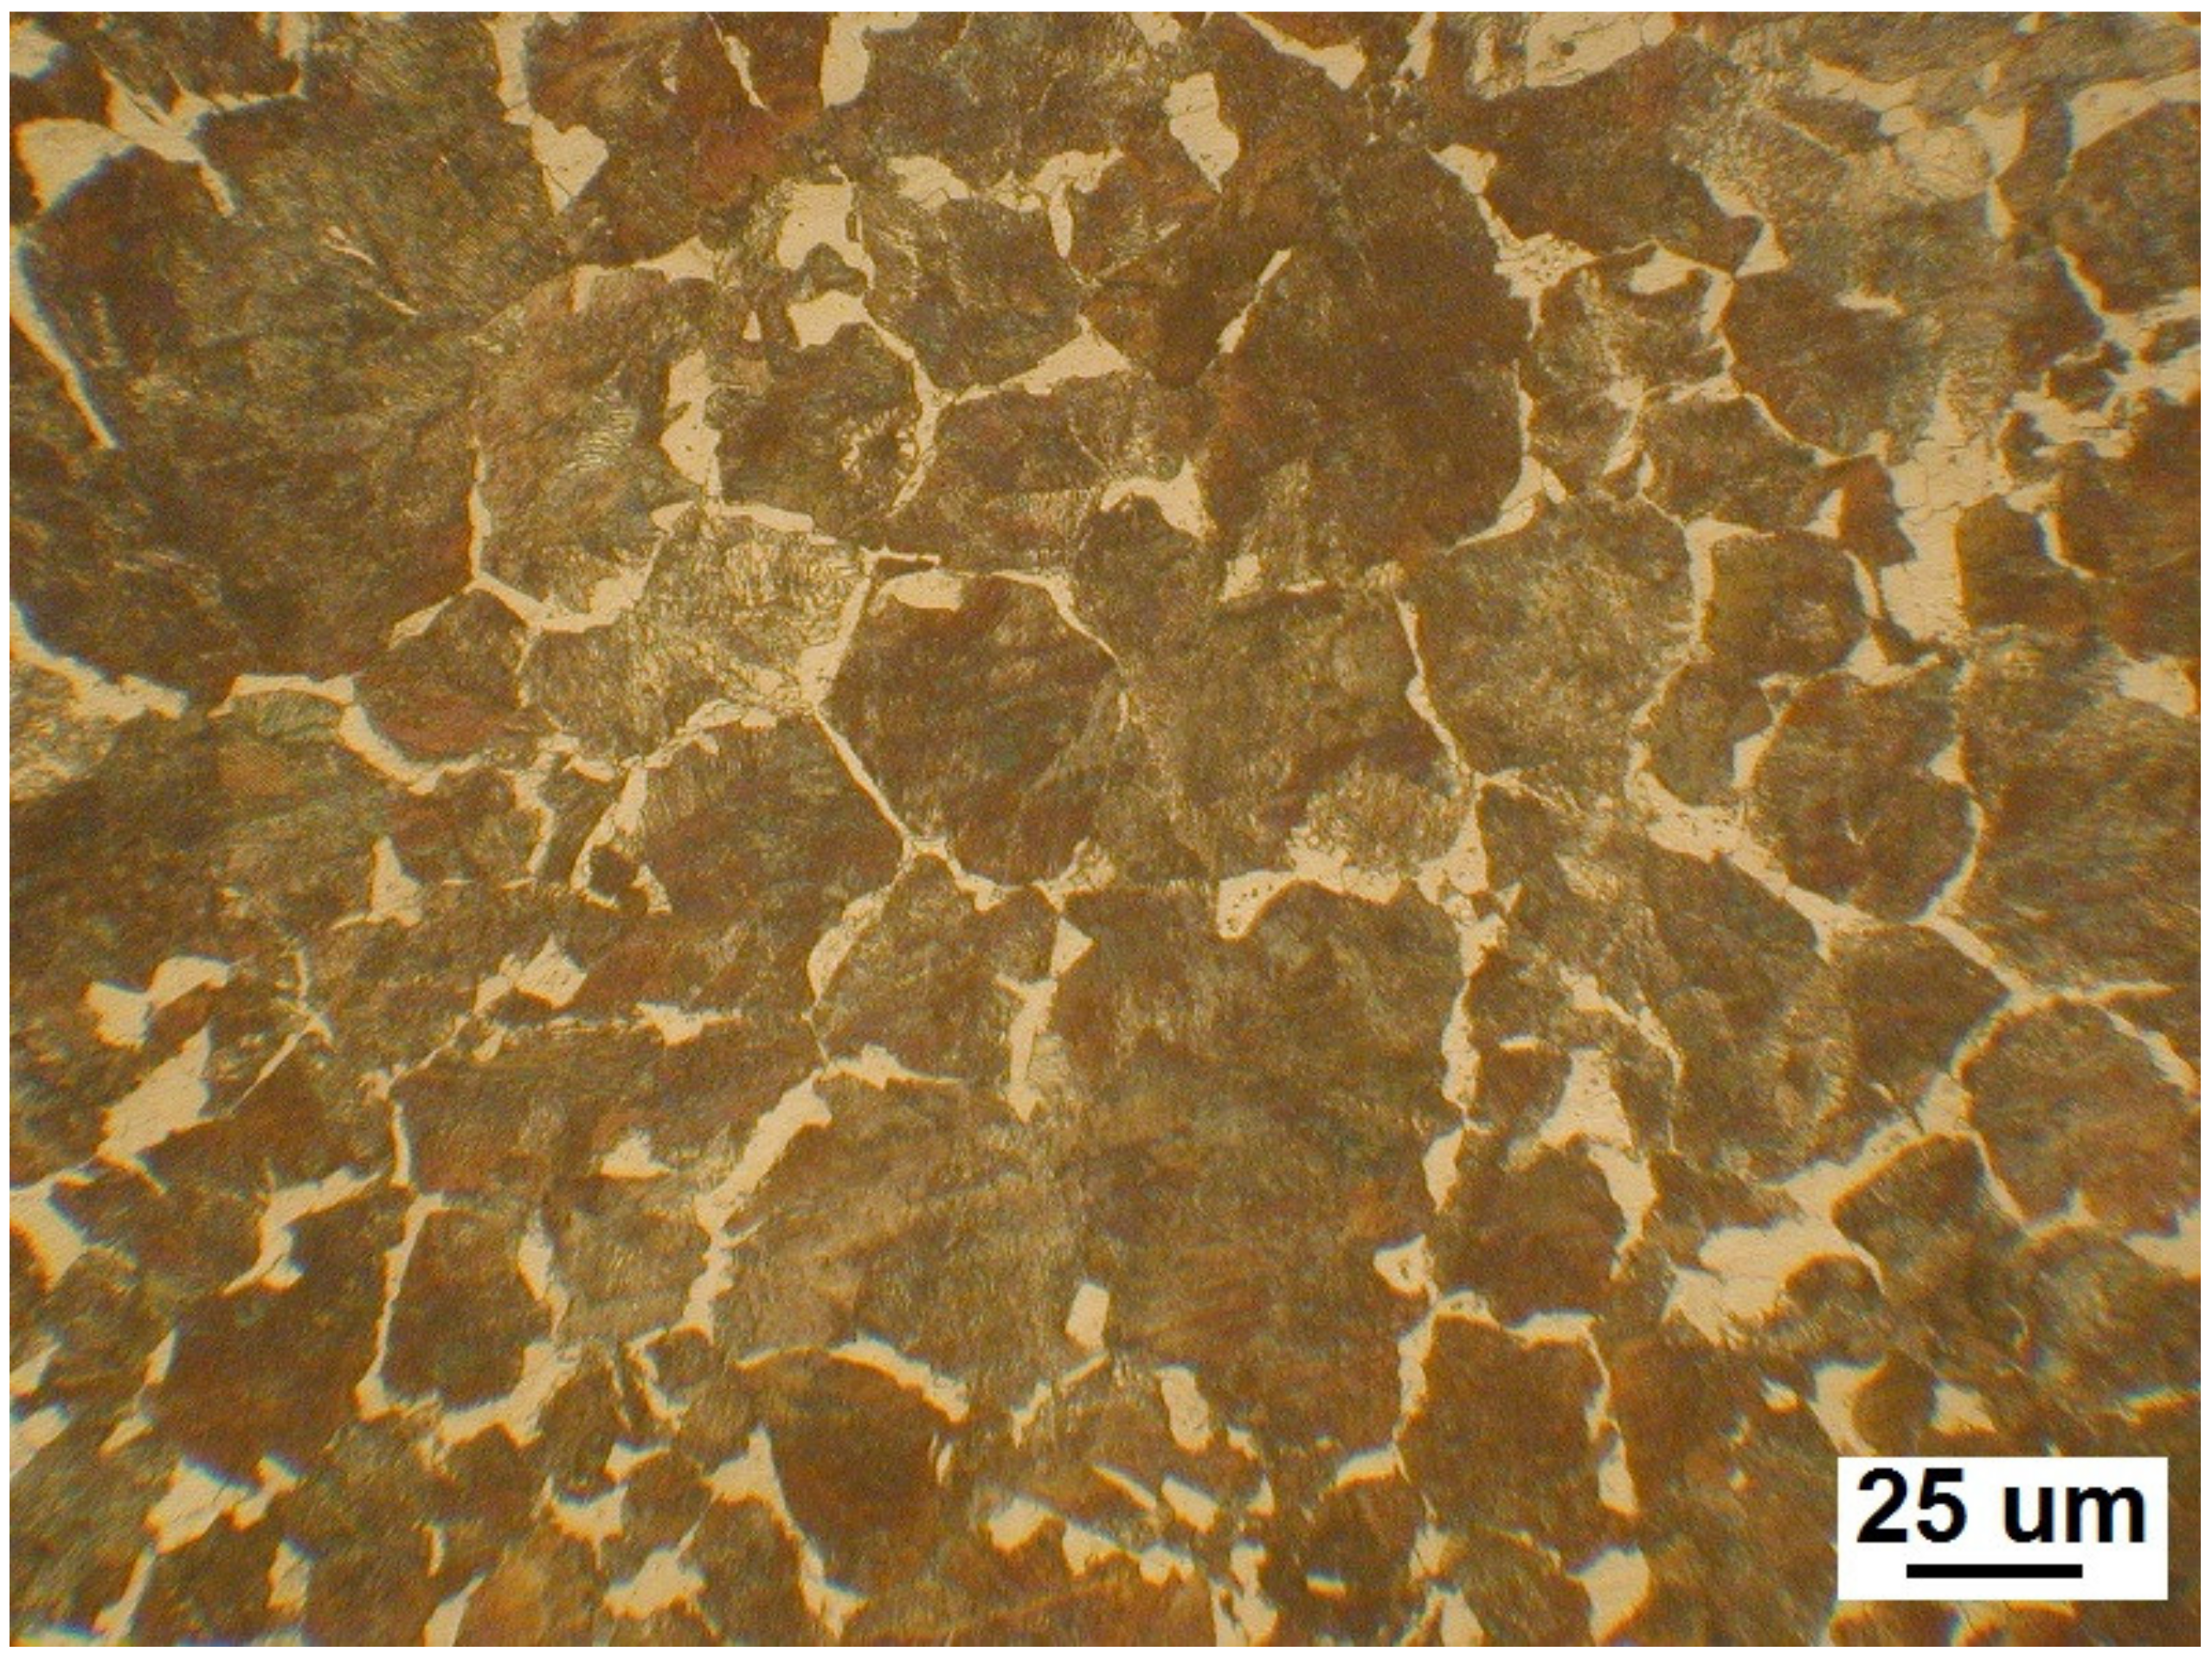
Problem Statement: Faulty Concrete Sleeper
5. Discussion
6. Conclusions
Author Contributions
Funding
Institutional Review Board Statement
Informed Consent Statement
Data Availability Statement
Conflicts of Interest
References
- Camarillo, A.; Ríos, J.; Althoff, K.D. CBR and PLM Applied to Diagnosis and Technical Support during Problem Solving in the Continuous Improvement Process of Manufacturing Plants. Procedia Manuf. 2017, 13, 987–994. [Google Scholar] [CrossRef]
- Mikos, W.L.; Ferreira, J.C.E.; Botura, P.E.A.; Freitas, L.S. A System for Distributed Sharing and Reuse of Design and Manufacturing Knowledge in the PFMEA Domain Using a Description Logics-Based Ontology. J. Manuf. Syst. 2011, 30, 133–143. [Google Scholar] [CrossRef]
- ISO 9000; Quality Management System–Fundamentals and Vocabulary. International Organization for Standardization ISO: Geneva, Switzerland, 2015.
- Vykydal, D.; Folta, M.; Nenadál, J. A Study of Quality Assessment in Higher Education within the Context of Sustainable Development: A Case Study from Czech Republic. Sustainability 2020, 12, 4769. [Google Scholar] [CrossRef]
- European Parliament and European Council. Regulation (EU) No. 305/2011 Laying Down Harmonised Conditions for the Marketing of Construction Products and Repealing the Council Directive 89/106/EEC; European Parliament and European Council: Brussels, Belgium, 2011. [Google Scholar]
- Teplická, K.; Hurná, S. New Approach of Costs of Quality According Their Trend of During Long Period in Industrial Enterprises in SMEs. Manag. Syst. Prod. Eng. 2021, 29, 20–26. [Google Scholar] [CrossRef]
- Slimák, I.; Zgodavova, K. Focus on Succes. QIP J. 2011, 15, 1–4. [Google Scholar] [CrossRef]
- Monkova, K.; Hric, S.; Knapčikova, L.; Vagaska, A.; Matiskova, D. Application of simulation for product quality en-hancement. In Proceedings of the International Conference on Informatics, Management Engineering and Industrial Ap-plication (IMEIA), Phuket, Thailand, 24–25 April 2016; pp. 216–220. [Google Scholar]
- Lovska, A.; Fomin, O.; Píštěk, V.; Kučera, P. Dynamic load modelling within combined transport trains during transportation on a railway ferry. Appl. Sci. 2020, 10, 5710. [Google Scholar] [CrossRef]
- ASQ. ASQ Excellence through quality. 2020. Available online: https://asq.org/quality-resources/supplier-quality (accessed on 14 November 2021).
- Foster, S.T. Towards an Understanding of Supply Chain Quality Management. J. Oper. Manag. 2008, 26, 461–467. [Google Scholar] [CrossRef]
- ISO 9001; Quality Management System–Requirements. ISO: Geneva, Switzerland, 2015.
- Onkal, D. (Ed.) Supply Chain Management—Pathways for Research and Practice; InTech: London, UK, 2011; ISBN 978-953-307-294-4. [Google Scholar]
- Fan, J.; Ni, D.; Fang, X. Liability Cost Sharing, Product Quality Choice, and Coordination in Two-Echelon Supply Chains. Eur. J. Oper. Res. 2020, 284, 514–537. [Google Scholar] [CrossRef]
- Bambura, R.; Šolc, M.; Dado, M.; Kotek, L. Implementation of Digital Twin for Engine Block Manufacturing Processes. Appl. Sci. 2020, 10, 6578. [Google Scholar] [CrossRef]
- Nováková, R.; Šujanová, J.; Pauliková, A. Use of 8D Method in Nonconformity Resolution–A Case Study of Production of Spliced Veeners in Slovakia. Drv. Ind. 2017, 68, 249–260. [Google Scholar] [CrossRef] [Green Version]
- Tomić, B.; Spasojević Brkić, V. Effective Root Cause Analysis and Corrective Action Process. JEMC 2011, 1, 5. [Google Scholar]
- Meister, M.; Beßle, J.; Cviko, A.; Böing, T.; Metternich, J. Manufacturing Analytics for Problem-Solving Processes in Production. Procedia CIRP 2019, 81, 1–6. [Google Scholar] [CrossRef]
- Kučera, P.; Píštěk, V. Automatic and Manual Differential Lock Control in a Truck—Cornering. In Proceedings of the 20th International Conference Transport Means, Juodkranté, Lithuania, 5–7 October 2016; pp. 98–101. [Google Scholar]
- Markulik, S.; Nagyova, A.; Turisova, R.; Villinsky, T. Improving Quality in the Process of Hot Rolling of Steel Sheets. Appl. Sci. 2021, 11, 5451. [Google Scholar] [CrossRef]
- Andersen, B.; Fagerhaug, T. Root Cause Analysis: Simplified Tools and Techniques, 2nd ed.; ASQ Quality Press: Milwaukee, WI, USA, 2006; ISBN 978-0-87389-692-4. [Google Scholar]
- Burggräf, P.; Weißer, T.; Wagner, J. Data on the Current State of Problem Solving and Improvement during Physical Product Development within Complex (Manufacturing) Systems. Data Brief. 2019, 23, 103851. [Google Scholar] [CrossRef]
- Pačaiová, H.; Sinay, J.; Turisová, R.; Hajduová, Z.; Markulik, Š. Measuring the Qualitative Factors on Copper Wire Surface. Measurement 2017, 109, 359–365. [Google Scholar] [CrossRef]
- Nagyová, A.; Pačaiová, H.; Gobanová, A.; Turisová, R. An Empirical Study of Root-Cause Analysis in Automotive Supplier Organisation. Qual. Innov. Prosperity 2019, 23, 34–45. [Google Scholar] [CrossRef] [Green Version]
- Zhao, L.H.; Xing, Q.K.; Wang, J.Y.; Li, S.L.; Zheng, S.L. Failure and root cause analysis of vehicle drive shaft. Eng. Fail. Analysis 2019, 99, 225–234. [Google Scholar] [CrossRef]
- Ghatorha, K.S.; Sharma, R.; Singh, G. Application of root cause analysis to increase material removal rate for productivity improvement: A case study of the press manufacturing industry. Mater. Today Proc. 2020, 26, 1780–1783. [Google Scholar] [CrossRef]
- Kumar, T.S.M.; Adaveesh, B. Application of “8D Methodology” for the Root Cause Analysis and Reduction of Valve Spring Rejection in a Valve Spring Manufacturing Company: A Case Study. Indian J. Sci. Technol. 2017, 10, 1–11. [Google Scholar] [CrossRef] [Green Version]
- Mendez-Tores, B.A.; Cano-Olivos, P. Proposed Algorithm to Digitize the Root-Cause Analysis and 8Ds of the Automotive Industry; Verlag Springer International Publishing: Berlin/Heidelberg, Germany, 2021. [Google Scholar]
- Hall, M.A. Root cause analysis: A tool for closer supply chain integration in construction. In Proceedings of the 17th Annual ARCOM Conference, University of Salford, Salford, UK, 5–7 September 2001; Association of Researchers in Construction Management: Salford, UK, 2021; Volume 1, pp. 929–938. [Google Scholar]
- Al-Zwainy, F.M.S.; Mohammed, I.A.; Varouqa, I.F. Diagnosing the Causes of Failure in the Construction Sector Using Root Cause Analysis Technique. J. Eng. 2018, 2018, 1–12. [Google Scholar] [CrossRef] [Green Version]
- Nidal, A. Diagnosing the Causes of Poor Quality Management in Iraqi Construction Projects Using Technique of Root Cause Analysis. IOP Conf. Ser. Mater. Sci. Eng. 2021, 1076, 10–1088. [Google Scholar]
- EN 13230-1; Railway Applications-Track-Concrete Sleepers and Bearers-General Requirements. European Committee for Standardization CEN: Brussels, Belgium, 2016.
- EN 13230-2; Railway Applications-Track-Concrete Sleepers and Bearers- Prestressed Monoblock Sleepers. European Committee for Standardization CEN: Brussels, Belgium, 2016.
- PrEN 10138; Prestressing Steels–Wire. European Committee for Standardization CEN: Brussels, Belgium, 2000.
- EN 10080; Steel for the Reinforcement of Concrete-Weldable reinforcing steel–General. European Committee for Standardization CEN: Brussels, Belgium, 2005.
- EN 206; Concrete-Specification, Performance, Production and Conformity. European Committee for Standardization CEN: Brussels, Belgium, 2002.
- STN 73 1322; Determination of Frost Resistance of Concrete. Slovak Office of Standards, Metrology and Testing, Slovak technical standard STN: Bratislava, Slovakia, 2016.
- EN 12620+A1; Aggregates for Concrete. European Committee for Standardization CEN: Brussels, Belgium, 2002.
- Girmanová, L.; Mikloš, V.; Palfy, P.; Petrík, J.; Sütőová, A.; Šolc, M. Nástroje a Metódy Manažérstva Kvality; ELFA, s.r.o.: Košice, Slovakia, 2009; (In Slovak). ISBN 978-80-553-0144-0. [Google Scholar]
- Kučera, P.; Píštěk, V.; Prokop, A.; Řehák, K. Measurement of the powertrain torque. In Proceedings of the Engineering Mechanics, Svratka, Czech Republic, 14–17 May 2018; pp. 449–452. [Google Scholar]
- Teplická, K.; Khouri, S.; Beer, M.; Rybárová, J. Evaluation of the Performance of Mining Processes after the Strategic Innovation for Sustainable Development. Processes 2021, 9, 1374. [Google Scholar] [CrossRef]
- Bunkley, N. “Joseph Juran, 103, Pioneer in Quality Control, Dies”. The New York Times. Available online: https://www.nytimes.com/2008/03/03/business/03juran.html (accessed on 13 November 2021).
- ISO 6506-2; Metallic Materials-Brinell Hardness test-Verification and Calibration of Testing Machines. 3rd ed. International Organization for Standardization ISO: Geneva, Switzerland, 2017.
- ISO 6506-1; Metallic Materials-Brinell Hardness test-Test Method. 3rd ed. International Organization for Standardization ISO: Geneva, Switzerland, 2014.
- ISO 6507-2; Metallic Materials-Vickers Hardness Test-Verification and Calibration of Testing Machines. 3rd ed. International Organization for Standardization ISO: Geneva, Switzerland, 2018.
- ISO 6507-1; Metallic Materials-Vickers Hardness Test-Test Method. 3rd ed. International Organization for Standardization ISO: Geneva, Switzerland, 2018.


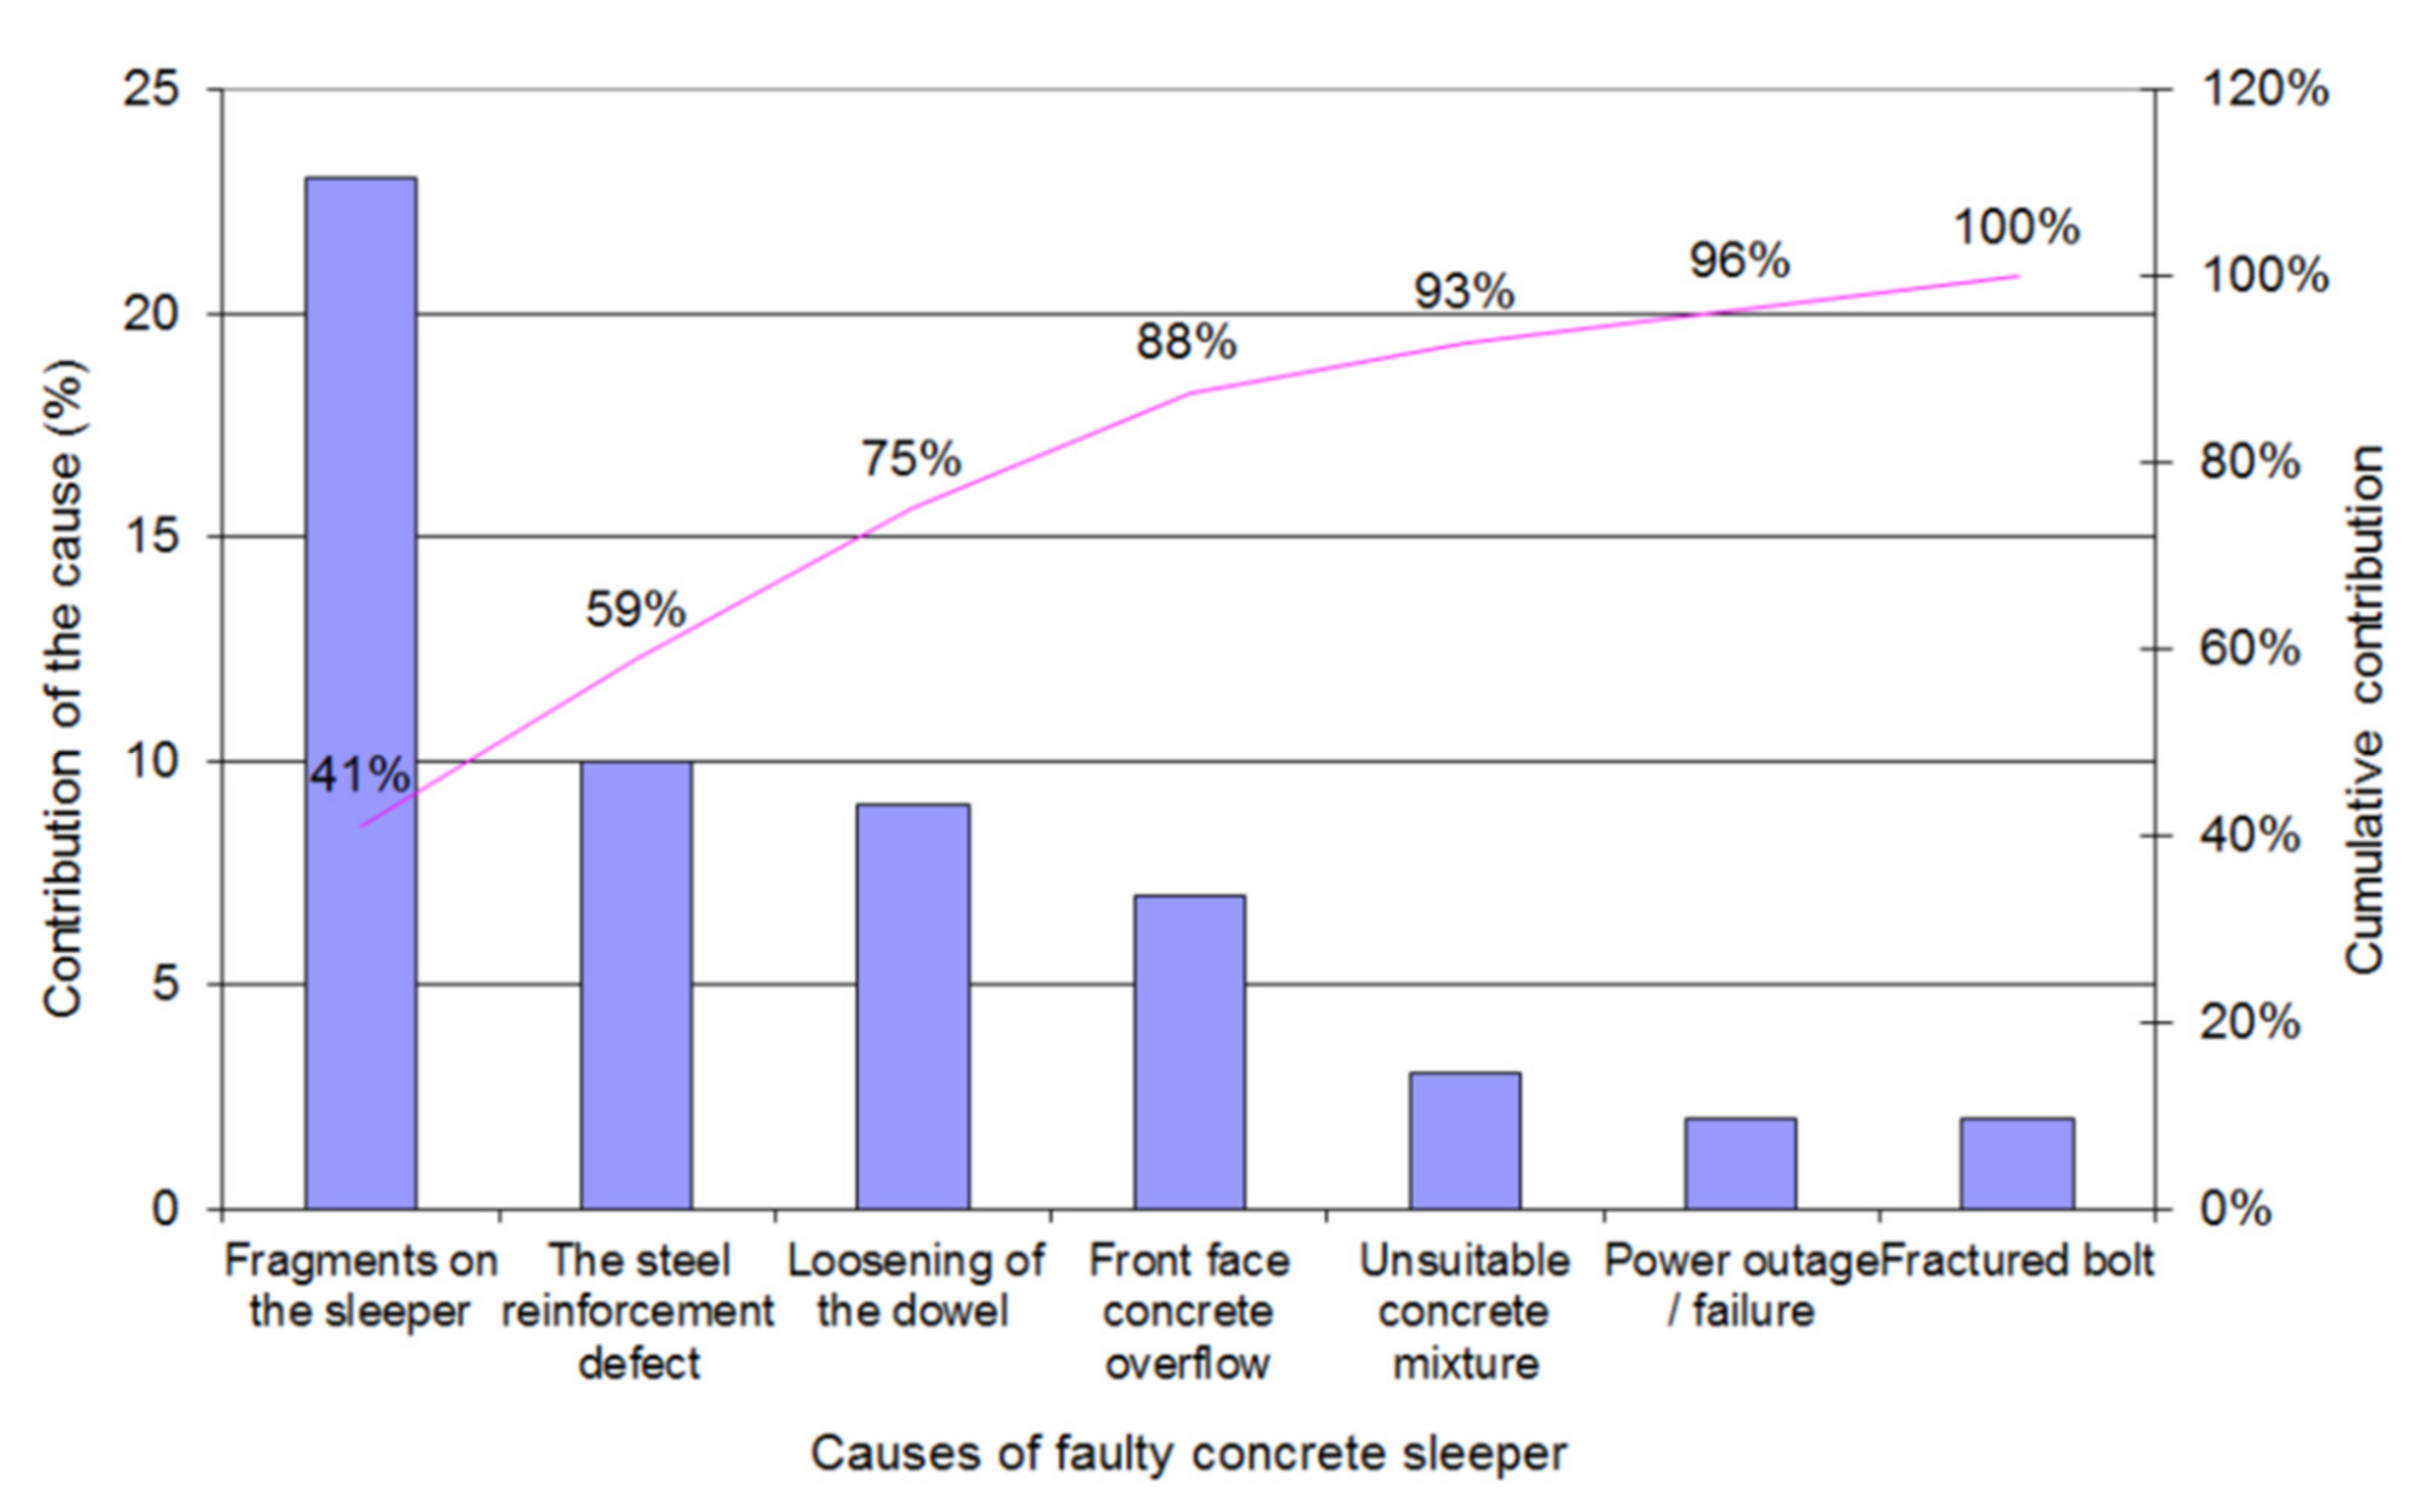
| Causes of Faulty Concrete Sleeper | Total (%) |
|---|---|
| Fractured bolt | 41 |
| Fragments on the sleeper | 24 |
| The steel reinforcement defect | 15 |
| Loosening of the dowel | 8 |
| Front face concrete overflow | 7 |
| Unsuitable concrete mixture | 3 |
| Power outage/failure | 2 |
| C (%wt) | Mn (%wt) | Si (%wt) | Cr (%wt) | Mo (%wt) | Ni (%wt) | Cu (%wt) | |
|---|---|---|---|---|---|---|---|
| STN 12 061 | 0.57–0.65 | 0.5–0.8 | 0.17–0.37 | 0.25 | 0.3 | 0.3 | |
| EN ISO: C60E | 0.57–0.65 | 0.6–0.9 | <0.4 | <0.4 | <0.1 | <0.4 |
| Sample | Fe | Si | Mn | Cr | Mo | Ni | Sn | Cu | S | P |
|---|---|---|---|---|---|---|---|---|---|---|
| 1 | 97.414 | 0.283 | 0.908 | 0.069 | 0.017 | 0.108 | 0.016 | 0.229 | <LOD | 0.043 |
| 1 | 97.597 | 0.269 | 0.921 | 0.064 | 0.018 | 0.103 | 0.018 | 0.242 | <LOD | 0.056 |
| 2 | 97.455 | 0.345 | 0.807 | 0.079 | 0.019 | 0.128 | 0.017 | 0.215 | <LOD | 0.041 |
| 2 | 97.49 | 0.351 | 0.809 | 0.072 | 0.019 | 0.125 | 0.016 | 0.232 | <LOD | 0.047 |
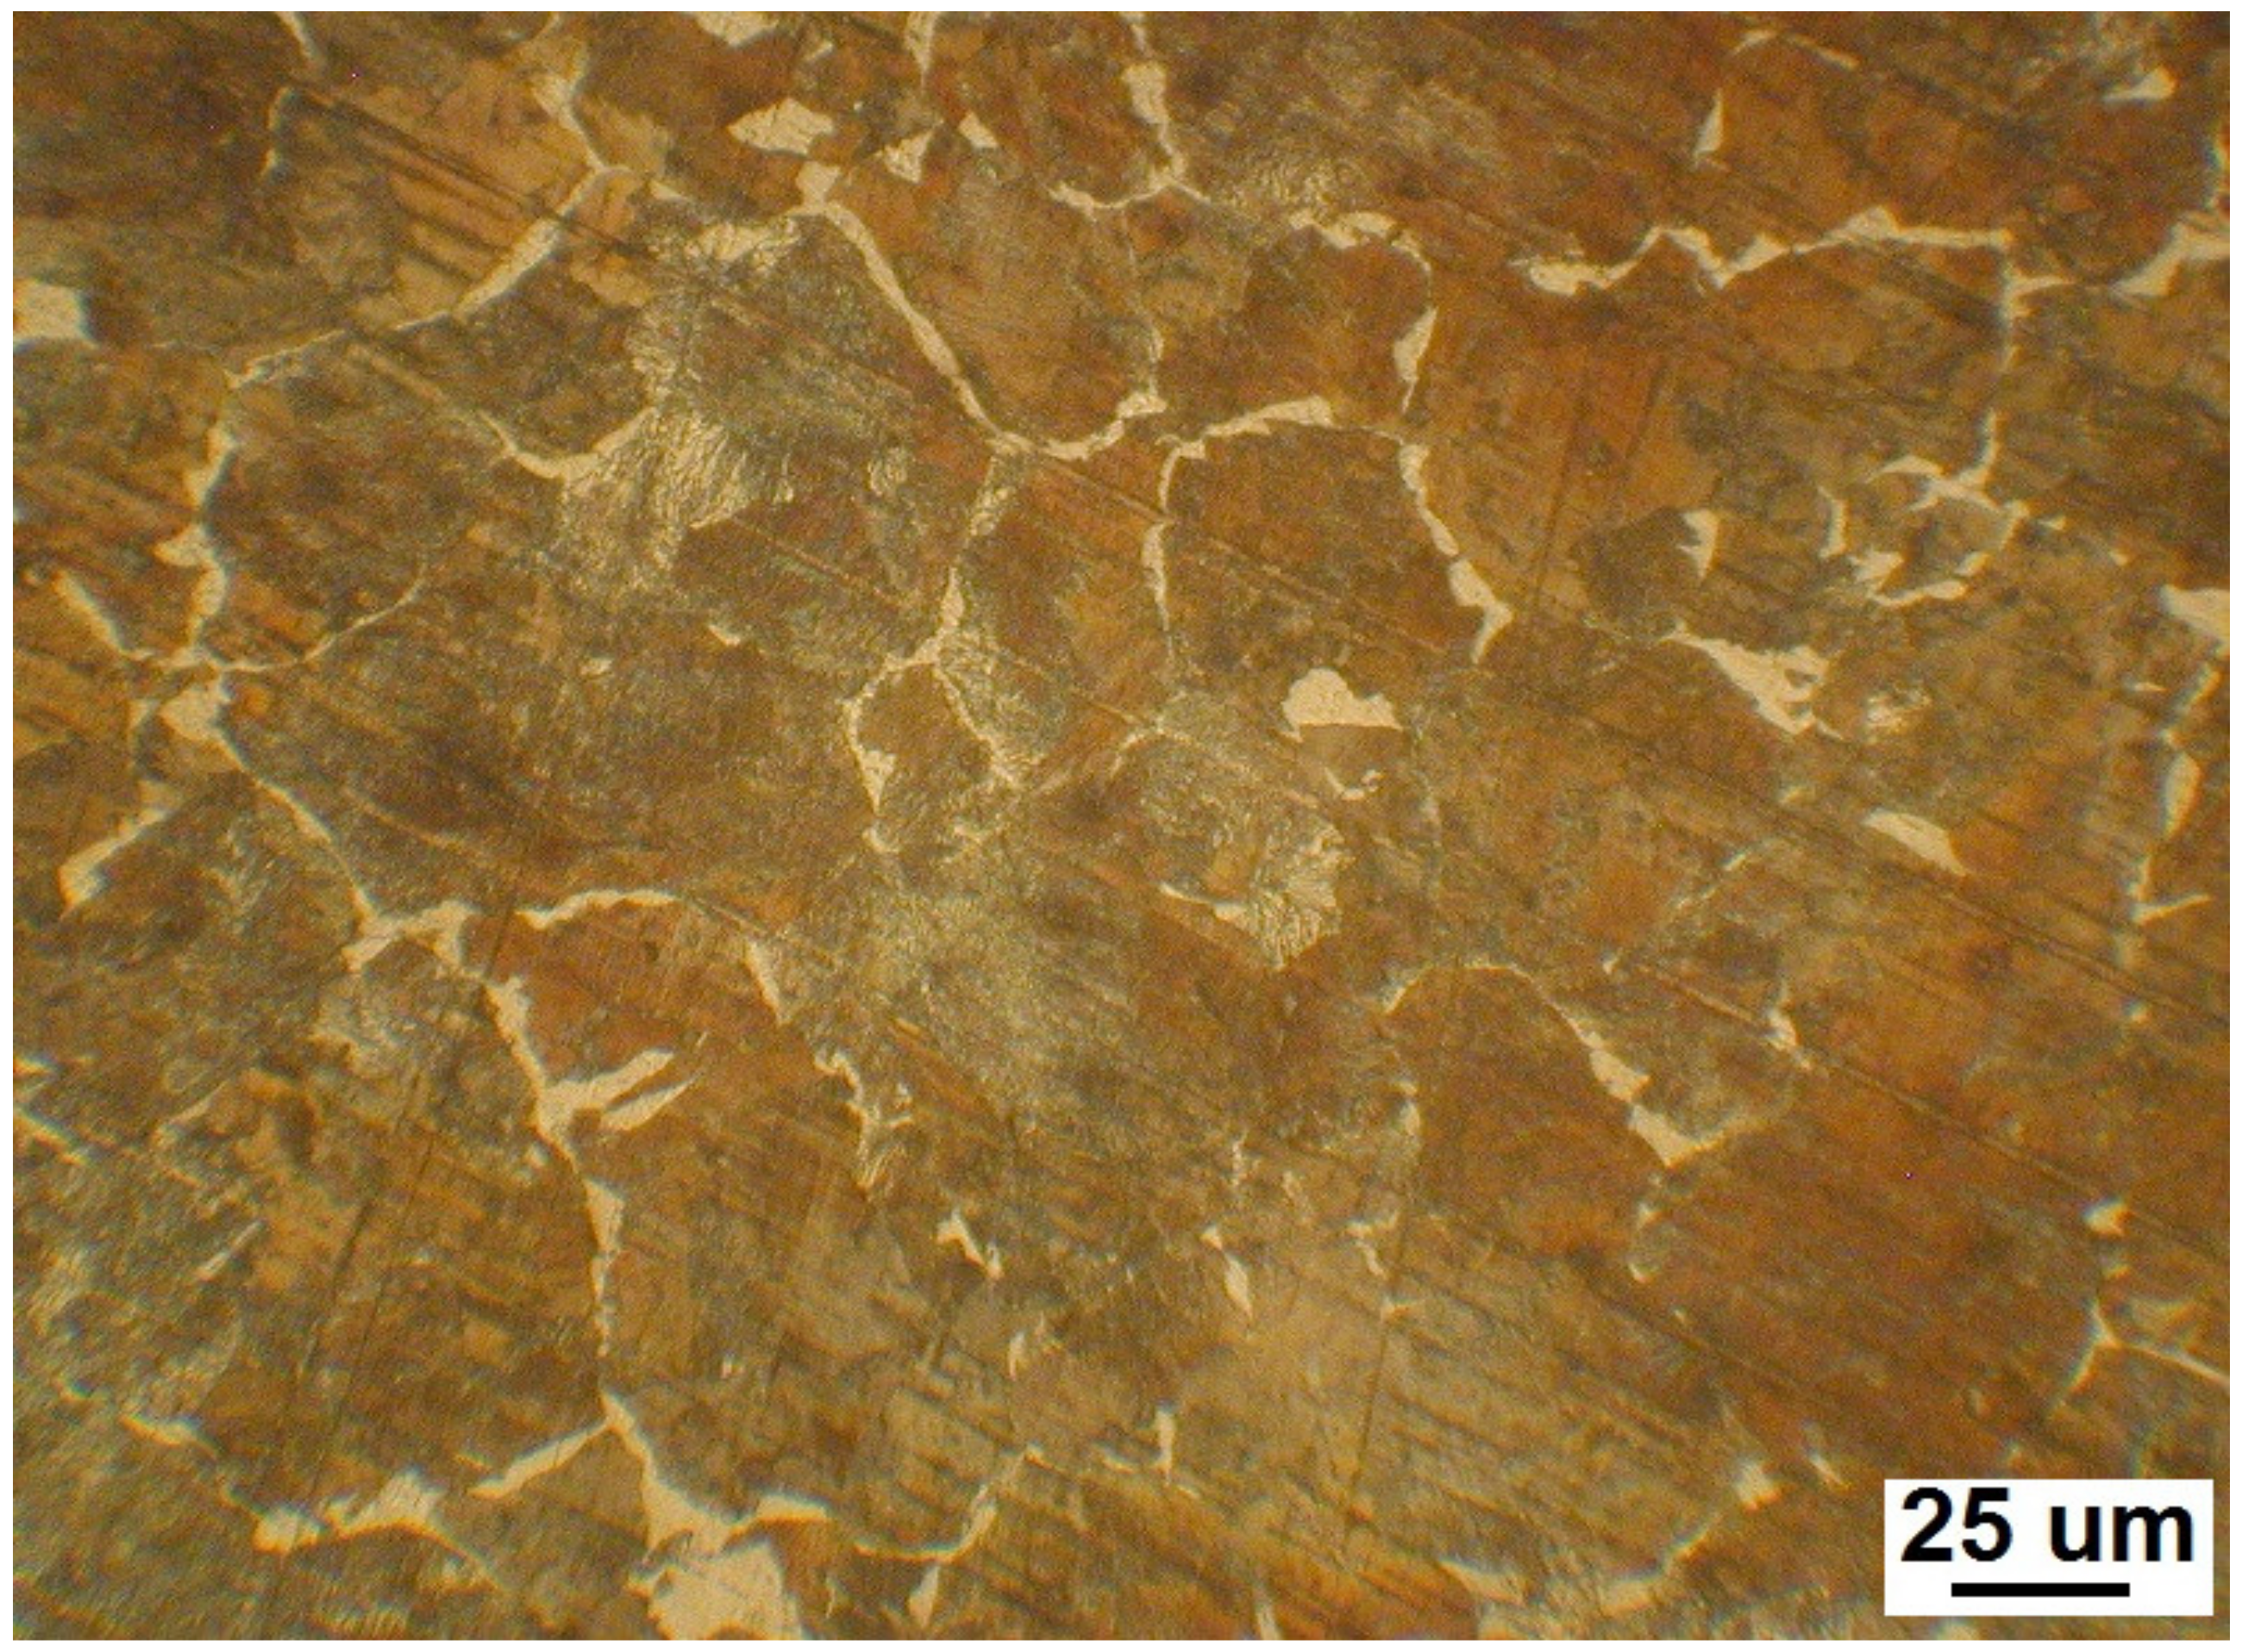
| Sample No. | Hardness Metallografic Surface | Hardness, Bottom Part of the Bolt | Microhardness of the Grains, Metallografic Surface | Microhardness of Ferrite Metallografic Surface | ||||||
|---|---|---|---|---|---|---|---|---|---|---|
| HBW | Urel (%) | HBW | Urel (%) | HV0.01 | HV0.025 | HV0.05 | HV0.1 | HV | HV0.01 | |
| 1 | 243 | 3.47 | 250 | 4.29 | 203 | 231 | 200 | 228 | 216 | 193 |
| 2 | 256 | 3.08 | - | - | 160 | 256 | 236 | 247 | 245 | 149 |
Publisher’s Note: MDPI stays neutral with regard to jurisdictional claims in published maps and institutional affiliations. |
© 2022 by the authors. Licensee MDPI, Basel, Switzerland. This article is an open access article distributed under the terms and conditions of the Creative Commons Attribution (CC BY) license (https://creativecommons.org/licenses/by/4.0/).
Share and Cite
Markulik, Š.; Petrík, J.; Šolc, M.; Blaško, P.; Palfy, P.; Sütőová, A.; Girmanová, L. Analysis of Fault Conditions in the Production of Prestressed Concrete Sleepers. Appl. Sci. 2022, 12, 928. https://doi.org/10.3390/app12020928
Markulik Š, Petrík J, Šolc M, Blaško P, Palfy P, Sütőová A, Girmanová L. Analysis of Fault Conditions in the Production of Prestressed Concrete Sleepers. Applied Sciences. 2022; 12(2):928. https://doi.org/10.3390/app12020928
Chicago/Turabian StyleMarkulik, Štefan, Jozef Petrík, Marek Šolc, Peter Blaško, Pavol Palfy, Andrea Sütőová, and Lenka Girmanová. 2022. "Analysis of Fault Conditions in the Production of Prestressed Concrete Sleepers" Applied Sciences 12, no. 2: 928. https://doi.org/10.3390/app12020928