Article

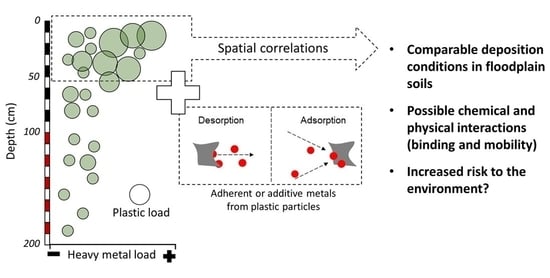
Spatial Connections between Microplastics and Heavy Metal Pollution within Floodplain Soils

1
Department of Geography, Philipps-Universität Marburg, 35037 Marburg, Germany
2
Federal Institute of Hydrology, 56068 Koblenz, Germany
*
Author to whom correspondence should be addressed.
Appl. Sci. 2022, 12(2), 595; https://doi.org/10.3390/app12020595
Submission received: 30 November 2021 / Revised: 3 January 2022 / Accepted: 6 January 2022 / Published: 8 January 2022
(This article belongs to the Special Issue Floodplains and Reservoirs as Sinks and Sources for Pollutants)

Abstract

:
Soils contain an increasing number of different pollutants, which are often released into the environment by human activity. Among the “new” potential pollutants are plastics and microplastics. “Recognized” pollutants such as heavy metals, of geogenic and anthropogenic origin, now meet purely anthropogenic contaminants such as plastic particles. Those can meet especially in floodplain landscapes and floodplain soils, because of their function as a temporary sink for sediments, nutrients, and pollutants. Based on a geospatial sampling approach, we analyzed the soil properties and heavy metal contents (ICP-MS) in soil material and macroplastic particles, and calculated total plastic concentrations (Ptot) from preliminary studies. Those data were used to investigate spatial connections between both groups of pollutants. Our results from the example of the Lahn river catchment show a low-to-moderate contamination of the floodplain soils with heavy metals and a wide distribution of plastic contents up to a depth of two meters. Furthermore, we were able to document heavy metal contents in macroplastic particles. Spatial and statistical correlations between both pollutants were found. Those correlations are mainly expressed by a comparable variability in concentrations across the catchment and in a common accumulation in topsoil and upper soil or sediment layers (0–50 cm). The results indicate comparable deposition conditions of both pollutants in the floodplain system.

Graphical Abstract

1. Introduction

Nature is exposed to a variety of human influences. Part of these influences is the input of foreign substances and or pollutants into a wide variety of ecosystems worldwide. Similar to all other ecosystems, soils are particularly affected by such human impacts. Soils form the basis of human life, with 95% of global food being produced directly or indirectly on soils [1]. In addition, soils are important ecological systems, integrated into all global material cycles (e.g., C-cycle), water filters (groundwater treatment), and much more [2,3]. The intensive use of soils worldwide makes them vulnerable towards human utilization and the input of pollutants [4].
Soils are intensively researched concerning the enrichment, mobility, and fate of heavy metals and metalloids. These naturally occurring metals and metal compounds—in the case of heavy metals, defined as metals with a density > 5.0 g/cm³—show geogenic background levels in all soils, as they are released into the environment through rock weathering [4]. However, human activity during the industrial revolution (e.g., construction and transport), mining for ores, and the resource use of modern society have led to heavy metals contamination through anthropogenic inputs [4,5,6]. However, through intensive research, the ecotoxicological consequences of heavy metals are well studied, which has led to national legislation in many countries, as well as monitoring of contaminated sites and measures to reduce or improve this soil pollution [2,4].
Conversely, a new foreign substance and potential pollutant has been detected in a wide variety of ecosystems for a few years now. Plastics, and in particular microplastics with a size below <5 mm, occurring in the environment as particles consisting of man-made polymers, now pose a new environmental challenge [7,8,9,10]. In addition to the worldwide detection of microplastics in all ecosystems [8], it is now possible to detect microplastics in compost [11], garden [12], agricultural [13,14,15,16,17], and floodplain soils [18,19,20]. Furthermore, it has also been shown that plastic can be transported in soils [21,22], and can have an impact on soil structure (aggregates) [15], plants, and organisms [23,24,25]. Even if it has not yet been conclusively clarified whether there is an extensive risk to soils, soil organisms, or humans (uptake into the food chain), plastic is fundamentally a foreign substance in soils and, thus, corresponds to a contamination whose pollution status is still discussed [26,27,28].
The simultaneous occurrence of metals and plastic in soils raises the question of whether there are connections and interactions between these two groups of pollutants. In the case of heavy metals and plastic particles, studies from marine and aquatic environments demonstrated that interactions between heavy metals and microplastics take place in an aqueous environment [29]. Thereby, it was shown that, in marine environments, microplastics can desorb (e.g., Cd, Zn) and adsorb (e.g., Cu, Pb) heavy metals [30]. The sorption of heavy metals was demonstrated in laboratory experiments for Cu and Zn to polystyrene (PS) and polyvinyl chloride (PVC) fragments in seawater [31]. Plastics can, therefore, be seen as a transport vehicle of metals in aquatic environments [29]. In addition to the adsorption of heavy metals from the surrounding medium, further studies indicate the release of heavy metals into the environment through particle degradation [32,33]. Significantly, metals and heavy metals can enter into polymer products and, thus, into microplastic particles through additives. In this context, the number of potential additives is extremely diverse. Examples are flame retardants (Al and Zn), heat stabilizers (mostly Cd, Pb, Ba, and Sn in PVC), slip agents (Zn), inorganic pigments (Cr, Co, and Pb), or fillers (clay minerals and metal powders) [34]. Although the main focus has been on the interrelationships between heavy metals and plastic particles in aquatic environments, since 2019, a limited number of studies have also been conducted on these interrelationships in soils (Figure 1).
For soils in which heavy metals and plastic particles are embedded in a mineral-organic matrix, partly with water (pore water), ad- and desorption processes comparable to those in aquatic environments have been obtained so far. Verla et al. (2019) reviewed the attachment of heavy metals to microplastics via adsorption considering the influence of polymer type and shape of the plastic particle [35]. The assumption is that metal ions can adsorb on microplastic surfaces and that the adsorption rate increases over time due to the presence of biofilms and a larger surface area resulting from degradation of the plastic particles [35]. Other studies suggest an adsorption or desorption of heavy metals depending on the specific metal and the concentration of both pollutants in the soil [36]. In addition, the influence of the presence of microplastics on heavy metals has been investigated: The presence of microplastics seems to reduce the exchangeable, carbonate-bound, and Fe-Mn-oxide-bound fraction of the metals, while it increases the organic-bound fraction [37]. Furthermore, the bioavailability of Cu, Cr, and Ci seems to be affected by the presence of microplastics, whose presence also affects critical factors (e.g., DOC and pH) of the chemical behavior of heavy metals in soils [38]. From the research to date, it can be concluded that relationships and interactions exist between heavy metals and microplastics in soils, as well as in the aquatic environment. However, the question arises as to whether these findings also apply to other types of soils and what role spatial factors play in the connection?
One suitable category of environmental space and landscape to study those interactions is floodplains and their soils. Both substances are present within floodplain soils, due to the sink function of floodplains [19,20,39]. Rivers and their floodplains interact with each other through flood water dynamics, material flows, and their context as a part of a semi-terrestrial ecosystem [40]. Sediments and sediment-bound substances from the entire catchment of a river system can temporally be deposited in floodplains, which are, therefore, an important part of global material flows [40,41]. Similar dynamics can also be assumed for plastic particles within the environment [41,42,43,44]. Assuming that this is the main source (besides direct sources, e.g., agriculture) of pollutants in floodplain soils, both pollutants can be studied under comparable input conditions in floodplain soils. Previous research has documented levels of mass-based microplastics concentrations from 0 to 55.5 mg kg−1 for Swiss floodplain soils [18], or particle-based concentrations ranging from 0 to 186.3 p kg−1 in different floodplain soils of the Lahn and Inde River (Germany) [19,20,45]. Furthermore, a wide-ranging, heterogeneous spatial distribution down to depths of two meters and associated in-situ vertical displacement has been demonstrated [19,20]. Morphological factors, land use, and flood dynamics (sedimentation dynamics) appear to influence the spatial distribution of microplastics in floodplain soils [19,20].
Despite this knowledge, many questions about the spatial distribution of microplastics in soils in general, and especially in floodplain soils, remain unanswered, which is not least due to the few studies with a representative spatial contexts [46]. Considering the few studies conducted so far on the relationships and interactions between heavy metals and microplastics in soils, even more questions remain about interrelationships, processes, and potential environmental risks. This study aims to combine geospatial research with data from a case study floodplain on meso- and microplastic levels published in the work of Weber and Opp (2020) and Weber et al. (2021) to identify possible spatial and chemical connections between both pollutants in floodplain soils. This overall objective will be achieved through the following objectives:
(1) Provide a spatial representative overview of the spatial distribution of heavy metal and plastic concentrations in floodplain soils. (2) Identify where spatial relationships between the two pollutants occur and which natural environmental drivers could be responsible for these relationships. (3) Perform a coherent pollution assessment based on the interrelationships of heavy metals and plastics and provide an outlook for further research within this young field of research.

2. Materials and Methods

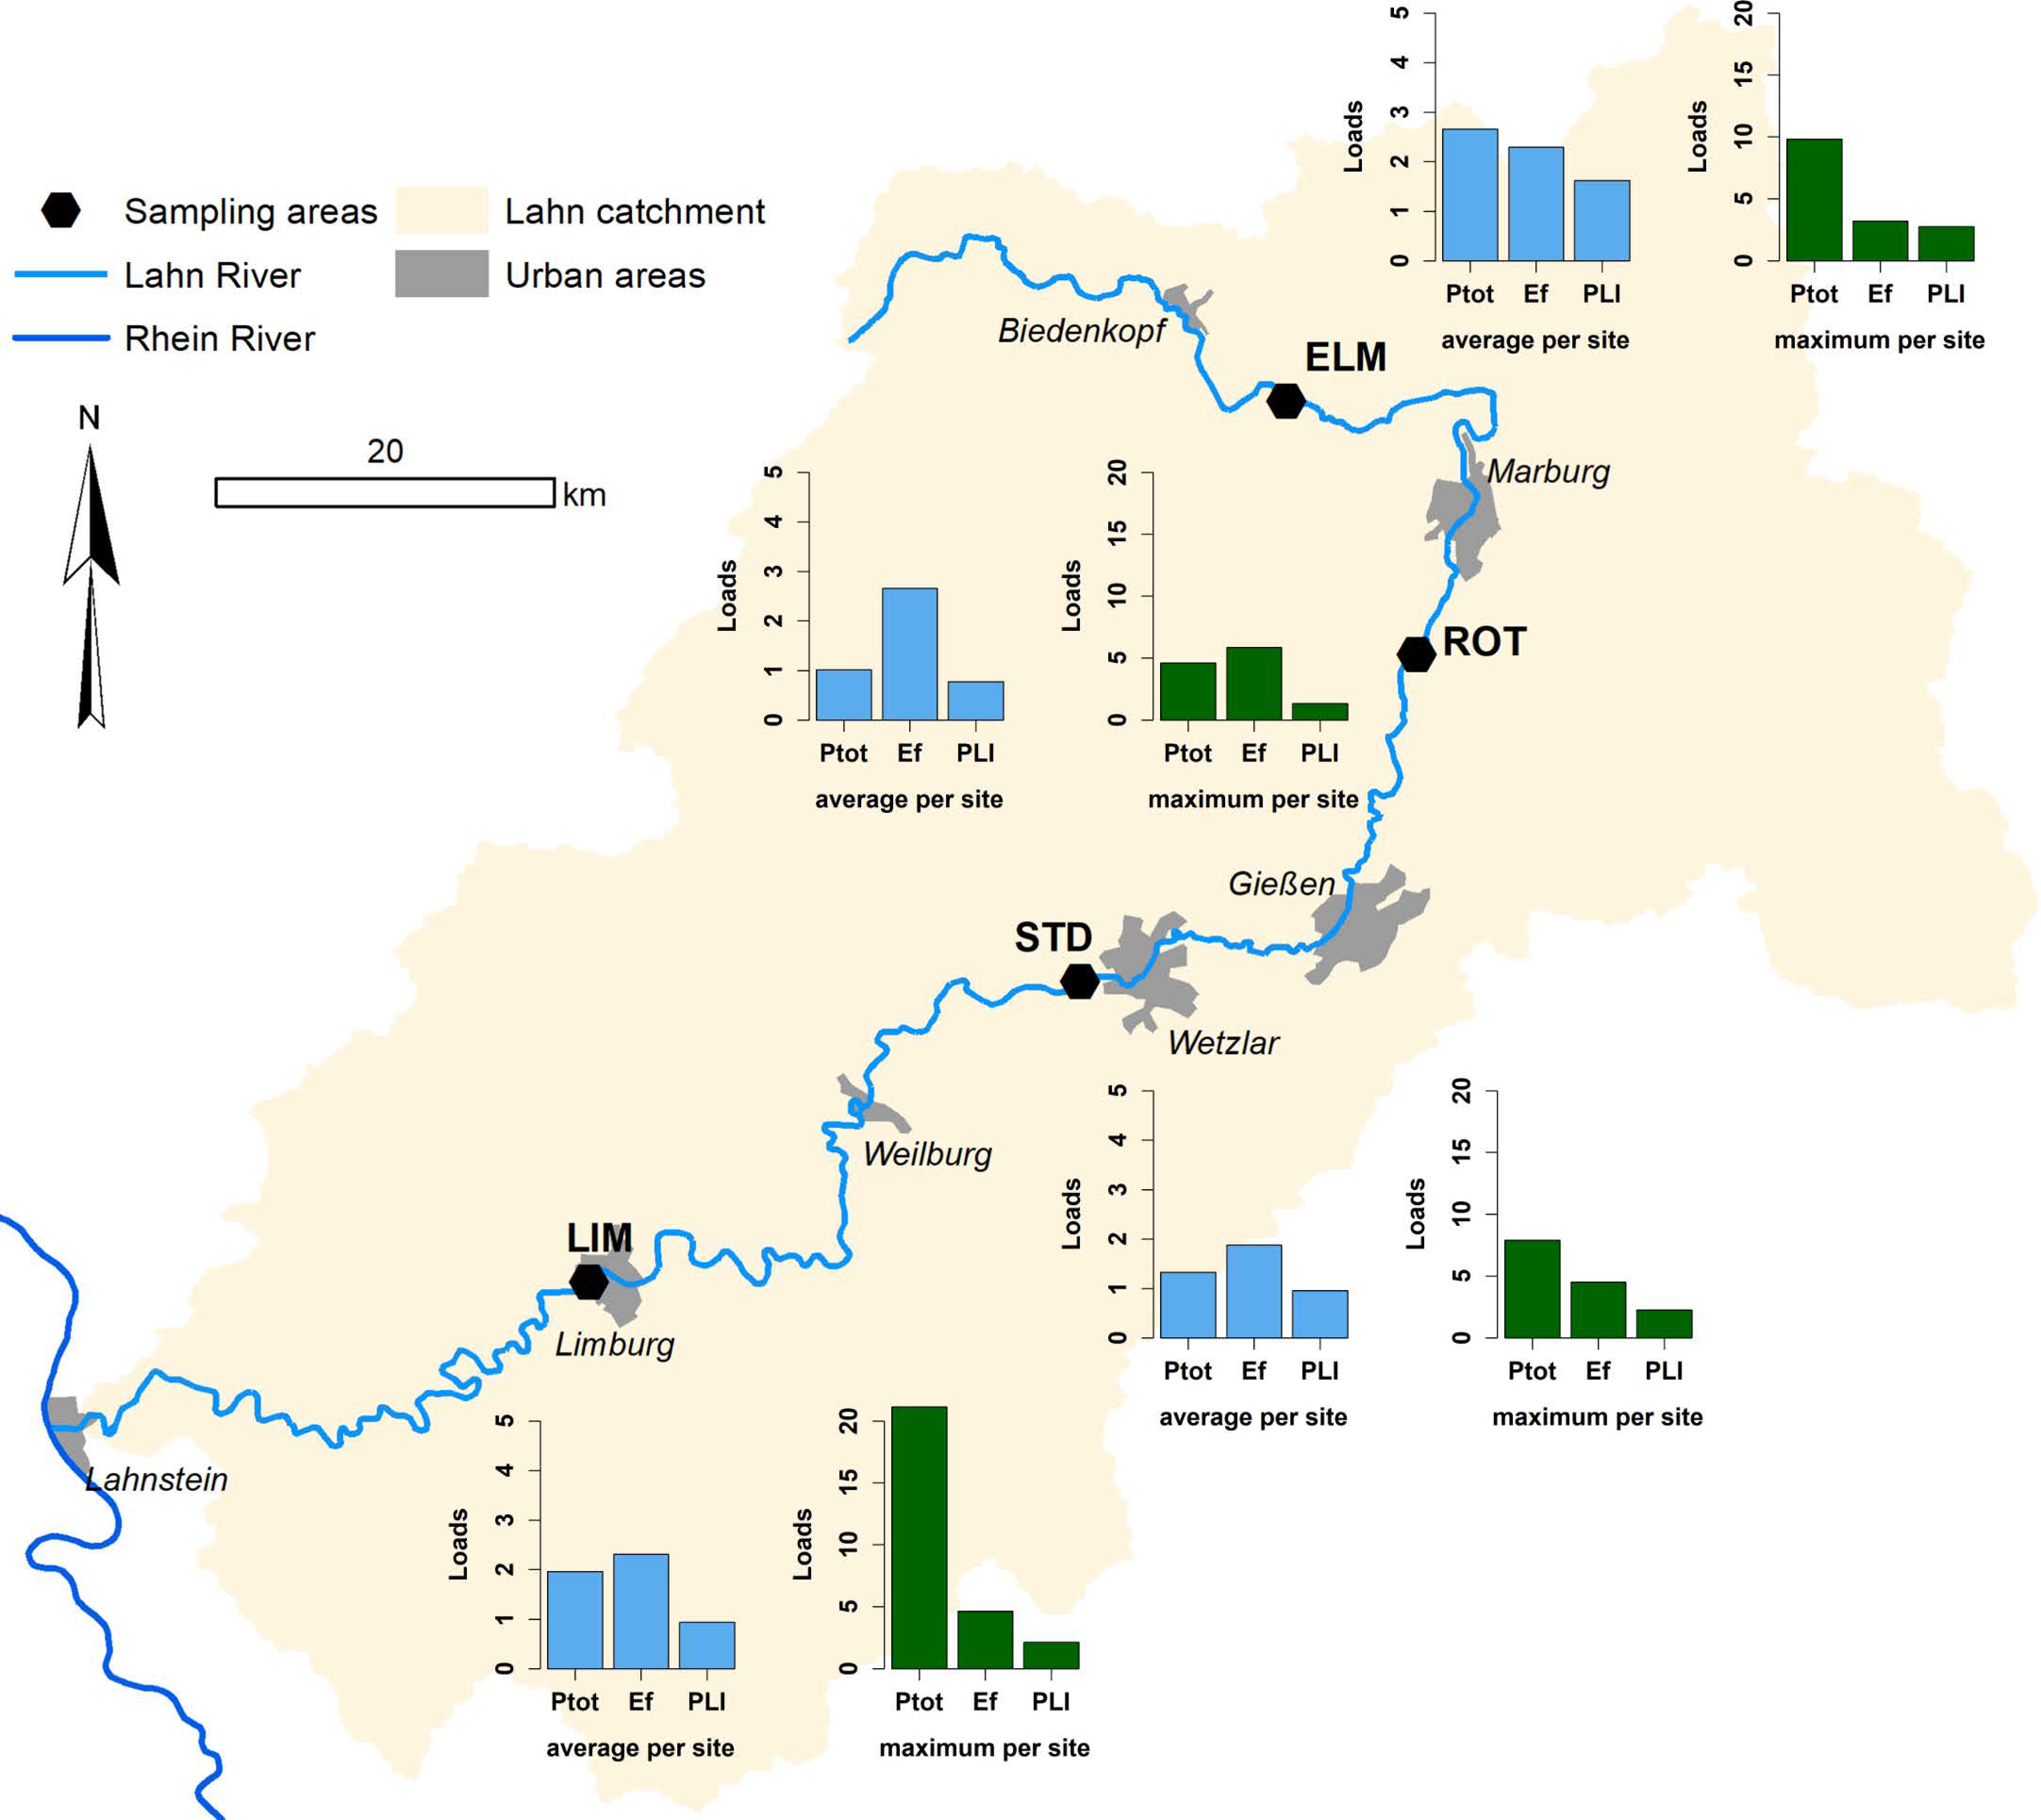
2.1. Study Area and Geospatial Sampling

Field work and sampling was conducted within the floodplains of the Lahn River located in central Germany. Profound details about sampling sites and geospatial sampling approach were made available in Weber and Opp (2020) and Weber et al. (2021). The Lahn drains an area of approx. 5924 km2 with a river length of 245.6 km and an approximate floodplain area of 88.9 km2 in the Federal State of Hesse, Germany [47]. The floodplain soils are mostly formed by organic-rich silt and loam, which was deposited by frequent historical and recent floods in the floodplain area. As with other floodplain landscapes, especially in central Europe, the Lahn catchment is affected by historical mining, subsequent industry, and general human use (smaller urban spaces and infrastructure: 7.0% of total land use) [47,48]. Previous studies within the Lahn catchment area show that heavy metals (Cu, Pb, and Zn) are frequently deposited in floodplain soils as consequence of historical mining and related industry [49,50]. The current land use of the catchment area (housing, infrastructure, and agriculture) favors the release of plastics and microplastics into the Lahn River, resulting in historical and recent depositions of (micro-)plastics within the Lahn floodplain. Based on these circumstances, the Lahn floodplain offers the opportunity to investigate the interrelationships between both the deposition of (micro-) plastics and the enrichment of metal(oid)s in floodplain soils.
The geospatial sampling approach was applied at four floodplain cross-section transects, representative of different floodplain soilscapes (floodplain soils and floodplain landscapes) of the Lahn River [45]. Each transect site is located within regularly flooded areas (yearly flooding to 5.5 years) and shows no anthropogenic interruptions (Weber et al., 2021).
At each transect, two (upper catchment) or four (lower catchment) sampling plots containing two soil profiles (distance: 5 m) were drilled via pile core driving (100 mm and 80 mm core diameter; maximum depth: 2 m) and sampled according the following depth sections: 10 cm sections (for upper 0.5 m), 25 cm sections (for 0.5–1.5 m), and 50 cm sections (for 1.5–2.0 m) [45]. Sampling plots represent the floodplain cross-section with its diverse morphological forms, showing surface altitude changes of ±0.5 m with interruptions from flood channels and a general slope from higher natural levees to the lower floodplain edge with the partwise occurrence of back swamps (further information on floodplain morphology can be found in Weber et al., 2021).
Root density was estimated in the field according to the German guidelines of soil mapping [51]. Stratigraphy and pedogenesis of each soil profile were documented according to the German soil classification [51] and the FAO Guidelines for soil description [52], as well as the WRB 2015 [53].

2.2. Laboratory Analysis

Soil samples were transported within corn starch bags (Mater-Bi bags, Bio Futura B.V., Rotterdam, Netherlands) and dried at 45 °C in a drying chamber for a maximum of four days. Subsequently, the samples were carefully mortared and dry sieved according to size classes >5 mm, >2 mm, and <2 mm through stainless-steel sieves (Retsch, Haan, Germany). Afterwards, sample material < 2 mm was homogenized and divided by means of a rotary sampler (Retsch, Haan, Germany) to obtain representative sub-samples.
We measured the organic matter content (OM; via loss on ignition at 550 °C; DIN 19684–3:2000–08) and pH (with 0.01 M CaCl2; m:V = 1:2.5) within the subsample material. Additionally, we determined soil texture with the Integral Suspension Pressure Method [54] after the samples had been prepared according to DIN ISO 11277:2002–08. The carbonate content of each sample was determined after reaction with a few drops of 3.23 M hydrochloric acid (HCl) according to AG Boden (2005).

2.2.1. Metal Analysis

An analysis of metal concentration was performed for (1) soil samples and (2) macroplastic and coarse microplastic particles obtained from microplastic analysis (see Section 2.2.2). For soil samples (1), analysis of the pseudo-total concentrations of the metals (Al and Fe), heavy metals (V, Cr, Co, Ni, Cu, Sn, Cd and Pb), and the metalloid As was performed after the digestion of 1 g prepared subsample with 20 mL aqua regia (12.1 M HCl and 14.4 M HNO3; ratio 1:3; DIN ISO 11466:2006-12). Metal content was quantified with an inductively coupled plasma–mass spectrometry (ICP–MS; XSERIES 2; Thermo Fisher Scientific, Bremen, Germany). The ICP–MS system was calibrated with a certified multi-element standard solution (ROTI®STAR; Carl Roth GmbH, Karlsruhe, Germany). Each digest of a soil sample was measured three times and averaged. The resulting mean metal concentrations were converted into units (mg kg−1). Relative standard deviation (RSD) was quantified for all single measurements after threefold measurements to account for data reproduction and the effects of heterogeneous matrixes [55]. Data with an RSD ≥ 20 % were excluded from further evaluation [56]. Detection limits were calculated by multiplying the mean standard deviation of 10 repeated blank measurements by a factor of 3, but no measurement results were below the respective detection limit.
To analyze the metal(oid) concentrations of macro- and coarse microplastic particles, 32 particles (from 9 soil samples) were analyzed (Table S1). All plastic samples had a weight of >10 mg. The plastic particles were crushed using stainless steel tongs, except for one sample, which had to be ground using a CryoMill (CryoMill, Retsch, Haan, Germany) due to an extraordinary hardness. Subsequently, the comminuted particles were digested with 6 mL purified HNO3 (65%) at 260 °C and 120 bar for 20 min within acid-cleaned Teflon tubes (Turbowave; MLS-MWS, Leutkirch, Germany). The acid digestion protocol dissolves nearly all adsorbed and additive metals in the dissolved phase [57].
Concentrations of the metals Al and Fe, the heavy metals V, Cr, Co, Ni, Cu, Sn, Cd, and Pb, as well as the metalloids As, Sb, and Se within digests were quantified with ICP-MS (Triple-Quadrupol ICP-MS 8800; Agilent, Santa Clara, CA, USA). Since no reference samples for plastics were available, certified water samples (SPS-W1, SPS-W2: Spectrapure Standards AS, Oslo/Norway; TMDA_64.3: CCRMP Canadian Certified Reference Materials Project, Ottawa (Ontario)/Canada) were used. The deviation of the recovery was consistently <10%. Metal concentrations were reported in ppm.

2.2.2. Microplastic Analysis

Details of microplastic analyses, special sample preparation, contamination prevention, and methodological limitations are documented in Weber and Opp (2020) and Weber et al. (2021). In general, mesoplastics (MEP, >5 mm) and coarse microplastics (CMP, >2 mm) were visually identified from sieving fractions using a stainless-steel bowl with an imprinted grid (1 × 1 cm grid size) and inspected under stereomicroscope (SMZ 161 TL, Motic, Hong Kong) [20]. Large microplastics (L-MP, >1 mm) and medium microplastics (M-MP, >0.3 mm) were analyzed after density separation (NaCl solution, density adjusted to 1.2 g/mL) performed within the MicroPlastic Sediment Separator (MPSS) (Hydro-Bios Apparatebau GmbH, Kiel-Altenholz, Germany). After density separation, sieving, and filtration (cellulose filters; LLG-Labware, Meckenheim, Germany) of floating sample material, a Nile Red staining procedure (20 µg/mL Nile Red solution, Sigma-Aldrich, Taufkirchen, Germany) was applied [58,59]. Stained filters were afterwards visually detected under a stereomicroscope (SMZ 161 TL, Motic, Hong Kong). Final identification of each potential plastic particle within the MEP, CMP, L-MP, and M-MP size class was performed by a Tensor 37 FTIR spectrometer (Bruker Optics, Ettlingen, Germany) combined with a Platinum-ATR-unit (Bruker Optics, Ettlingen, Germany). Data processing of FTIR spectra was performed in OPUS 7.0 (Bruker Optics, Ettlingen, Germany) and Spectragryph (Version 1.2.14; Menges, 2020; Oberstdorf, Germany). Final spectra identification and polymer type assignment was carried out according to Weber et al. (2021).

2.3. Statsitics and Data Evaluation

Basic statistical operations were performed in Microsoft Excel 2013 (Microsoft; Redmond, WA, USA), in R (R Core Team, 2020), and in RStudio (Version 3.4.1; RStudio Inc.; Boston, MA, USA). Statistical tests were applied to examine relationships and differences between the collected datasets based on regression and correlation analyses, as well as to identify significant differences between concentrations and sampling locations or depths. Data visualization, tests for normal distribution (Shapiro–Wilk), linear regression analyses, Spearman correlation analyses, and variance analyses (ANOVA) were conducted with the standard R-packages as well as “graphics”, “stats”, “vioplot”, “ggplot2”, “ggridges”, and “scatterplot3d”. Significances were tested on different levels. We interpreted the results of statistical analysis to be significant when reaching a p-value < 0.05. Basic geoinformatics evaluations were carried out in ArcMap (Version 10.3, Esri Deutschland GmbH, Kranzberg, Germany).
For the spatial and absolute comparison of plastic and heavy metal contents in floodplain soils, the total amount of plastic (Ptot) was calculated (Equation (1)) and documented as unit particles per kg soil dry mass (p kg−1).
P t o t = M E P + C M P + L M P + M M P .
In order to provide an effective risk assessment—and ascertain the pollution characteristics—of heavy metals, as well as conducting a spatial comparison with plastic contamination, we calculated different pollution indices according to Kowalska et al. (2018). Each of the applied indices shows an effective assessment of contamination and the spatial contamination differences [60]. To measure the potential impact of anthropogenic heavy metal pollution, we calculated the “Enrichment factor” (EF) (Equation (2)),
E F = [ H M L V ] s a m p l e [ H M L V ] g e o c h e m i c a l   b a c k g r o u n d .
where HM is the concentration of individual heavy metals and LV is the reference concentration of Fe. Geochemical background (GB) concentrations for the calculation of EF and PLI, as well as comparative values, were calculated based on the average values for Hesse floodplain soils provided in Friedrich and Lügger (2011) [61]. A total of 341 samples (64 floodplain silt substrates and 277 floodplain sand substrates) were averaged. Additionally, the “Pollution Load Index” (PLI) (Equation (3)), based on the “Single Pollution Index” (PI) for each heavy metal, was calculated,
P L I = P I 1 x   P I 2 x P I 3 x P I n n .
where PI is the single pollution index of each heavy metal calculated as P I = H M G B .
To assess the potential toxicity a of heavy metal contamination, the “Contamination Security Index” (CSI) (Equation (4)) was calculated
C S I = n = 1 n w ( ( H M E R L ) 1 2 + ( H M E R M ) 2 ) .
with W (the weight of each heavy metal) computed according to Pejman et al. (2015) [62], and HM (the individual concentration of each heavy metal), ERM (median value of the effect range), and ERL (lowest value of the effect range) calculated according to Long et al. (1995) [63]. Finally, the “Potential Ecological Risk Index” (RI) (Equation (5)) was calculated according to Hakanson (1980) [64] to assess potential ecological risks of heavy metal concentrations in floodplain soils
R I = i = 1 n E r i
with n (the number of heavy metals) and Er (the single index of the ecological risk factor) calculated by E r i = T r i   x   P I with T r i (toxic response coefficient) and PI (the Single Pollution Index).
Heavy metal concentrations were also compared to legal standards for soils (German national legislation) [65,66].

2.4. Limitations

The presented work combines and adapts different methodological approaches from microplastic research and soil sciences. With regard to the well-recognized and—so far—intensively studied heavy metals, the methods used are subject to standardized applications. Heavy metal analysis from soil samples was controlled by standards guided by the geogenic background values of Hessian floodplain soils [61]. Measurement of heavy metals in plastic particles was controlled by certified water samples. In both cases, the detection limits of the ICP-MS measurement were not reached.
With regard to (micro-)plastic analyses, limitations and insecurities were intensively discussed within the work of Weber and Opp (2020) and Weber et al. (2021). Based on the (micro-)plastic analysis conducted, only plastic particles with a density < 1.2 g mL−1 in a size range between 0.5 and >5 mm were separated. The density separation unit used in this study showed recovery rates of up to 95% [58], whereas the Nile Red staining exhibited recovery rates of up to 96.6 for marine sediments [59]. To prevent overestimation of plastic concentrations, samples were systematically examined and all collected particles subsequently analyzed via ATR-FTIR [45]. Therefore, there may only have been an underestimation of the plastic concentrations, as plastics with a density > 1.2 g mL−1 (e.g., PET) could only be recorded semi-quantitatively. Moreover, numerous studies have shown an increase in plastic content with decreasing particle size [20]. Here, however, the particle size limit was clearly 500 µm.
Finally, there are also uncertainties in the assessment of plastic concentrations in soils. Unlike other pollutants, there are no legal limits. The comparison with other studies is often limited due to differences between methodologies, and the consequences and impacts of (micro-)plastic on soils are still under investigation.

3. Results

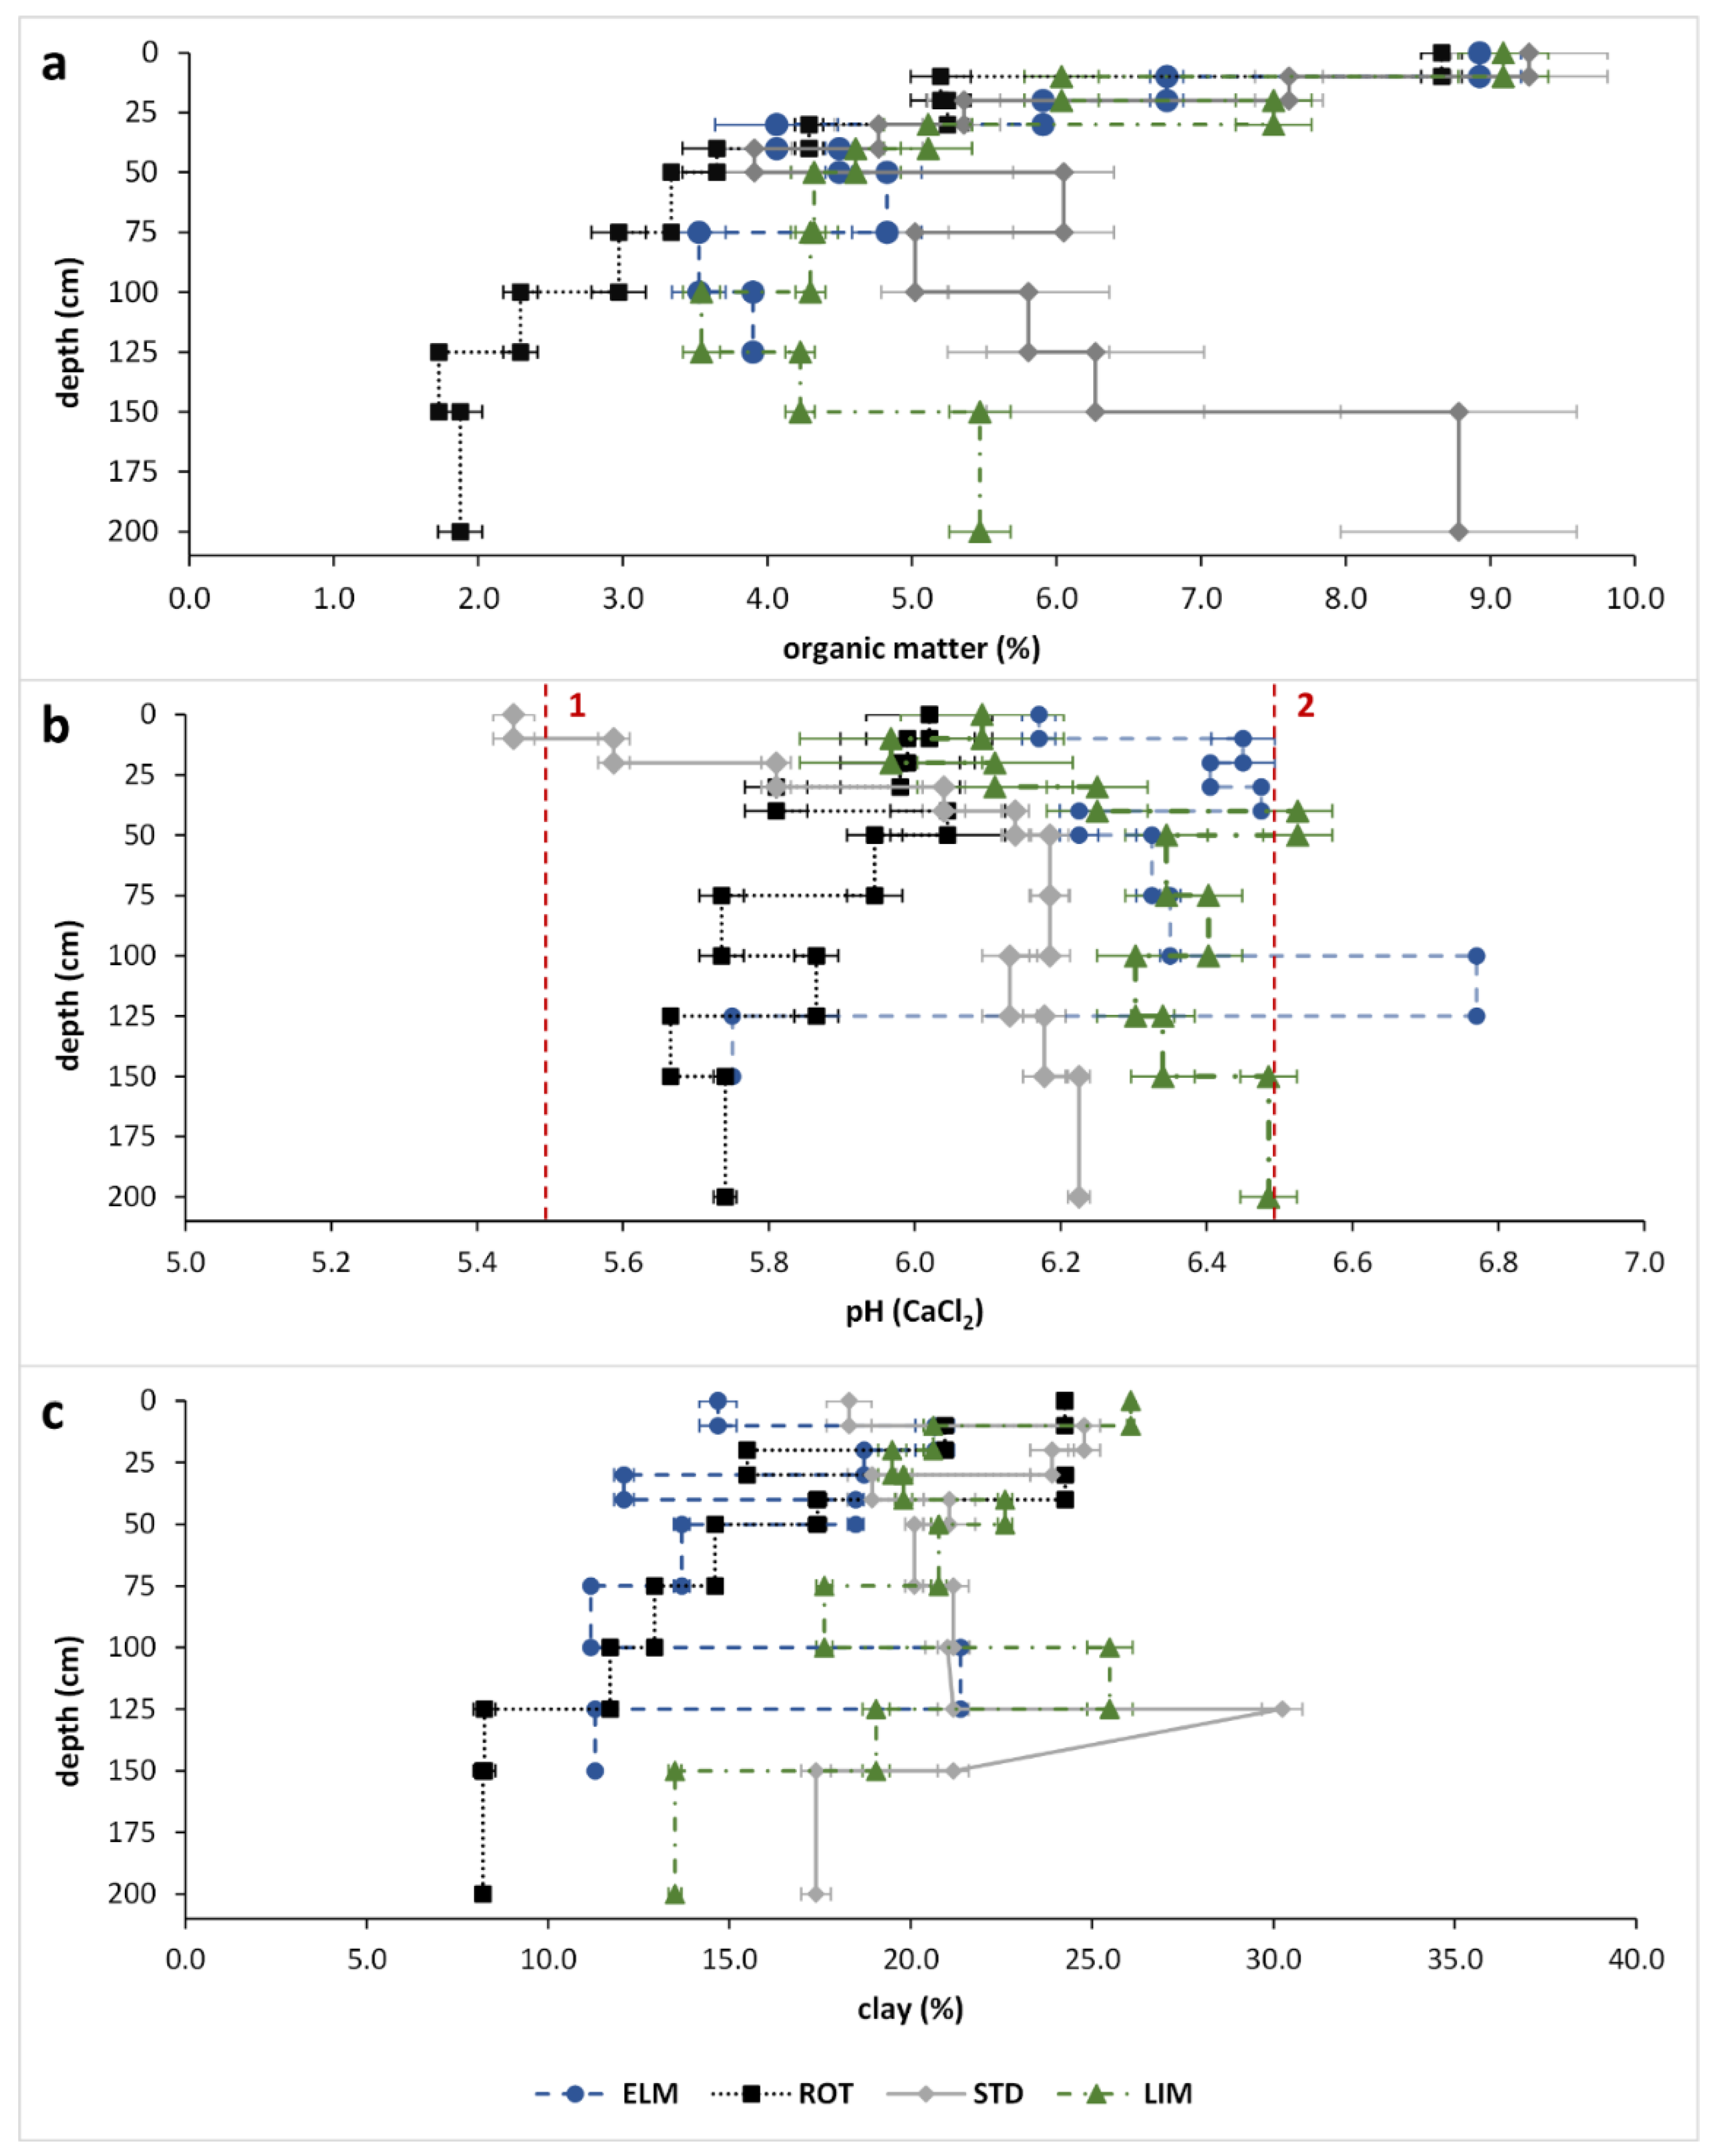
3.1. Floodplain Soil Properties

According to the FAO (2006) grain size classification, the studied floodplain soils of the Lahn River catchment consist mainly of floodplain silt loams with average composition of silt (48.03%) > sand (32.33%) > clay (19.64%). We found that the sand content decreases from the upper reaches (site ELM) to the lower reaches (site LIM), whereby it increases from an average depth of 100–150 cm to >60 cm in some cases, depending on the position within the floodplain (embankment or former flow channels) (Figures S1–S4). Maximum clay contents (>25%) are only reached within single clay layers (e.g., floodplain edge depression) (Figure 2c). The organic matter content ranges between 1.59 and 21.07% with a total average of 5.49%. Topsoils (0–30 cm) show significantly higher organic matter content (average: 7.35%) in contrast to subsoils (average: 4.66%). Absolute maximum values (>20.0%) occur within single organic clay-rich layers (clay mud). On average, the amount of organic material decreases with depth (in line with root density) (Figure 2a). The floodplain soils studied can, therefore, be classified as silty, organic-rich fluvial deposits, which is typical for fluvial deposits [40,67]. Within the fluvial deposits, deposited during the Holocene, Fluvisols and Gleysols have developed [45]. From the preliminary study, it can also be deduced that for sediments close to the river (river bank and proximal floodplain), the upper 40–50 cm of the floodplain sediments are very young (deposition since the 1960s) [45]. The soil properties differ mainly in terms of land use, groundwater levels (hydromorphic conditions), and portions of coarse soil fragments (gravel). Horizon sequences contain Ah or Ap (Abp) above combinations of B, Bl, Bgl, Bgr, or Br horizons. Within the Fluvisols and Gleysols, the soil pH ranges between 5.11 (moderately acid) and 6.94 (neutral) with a total average of 6.12 (very weak acid) (Figure 2b). Regarding the dependence of heavy metal mobilization on the pH value, only the mobilization limit value of Cd (at 6.5) falls below this level (Figure 2b [2]).
In summary, floodplain soil properties have the potential for an accumulation of heavy metals and (micro-)plastics. Whereas, on the one hand, the comparatively small amounts of clay and fine silt indicate reduced heavy metal adsorption (clay minerals), the proportion of organic matter and the only slightly acidic pH value show tendencies for low heavy metal mobility and adsorption of organic constituents [4].

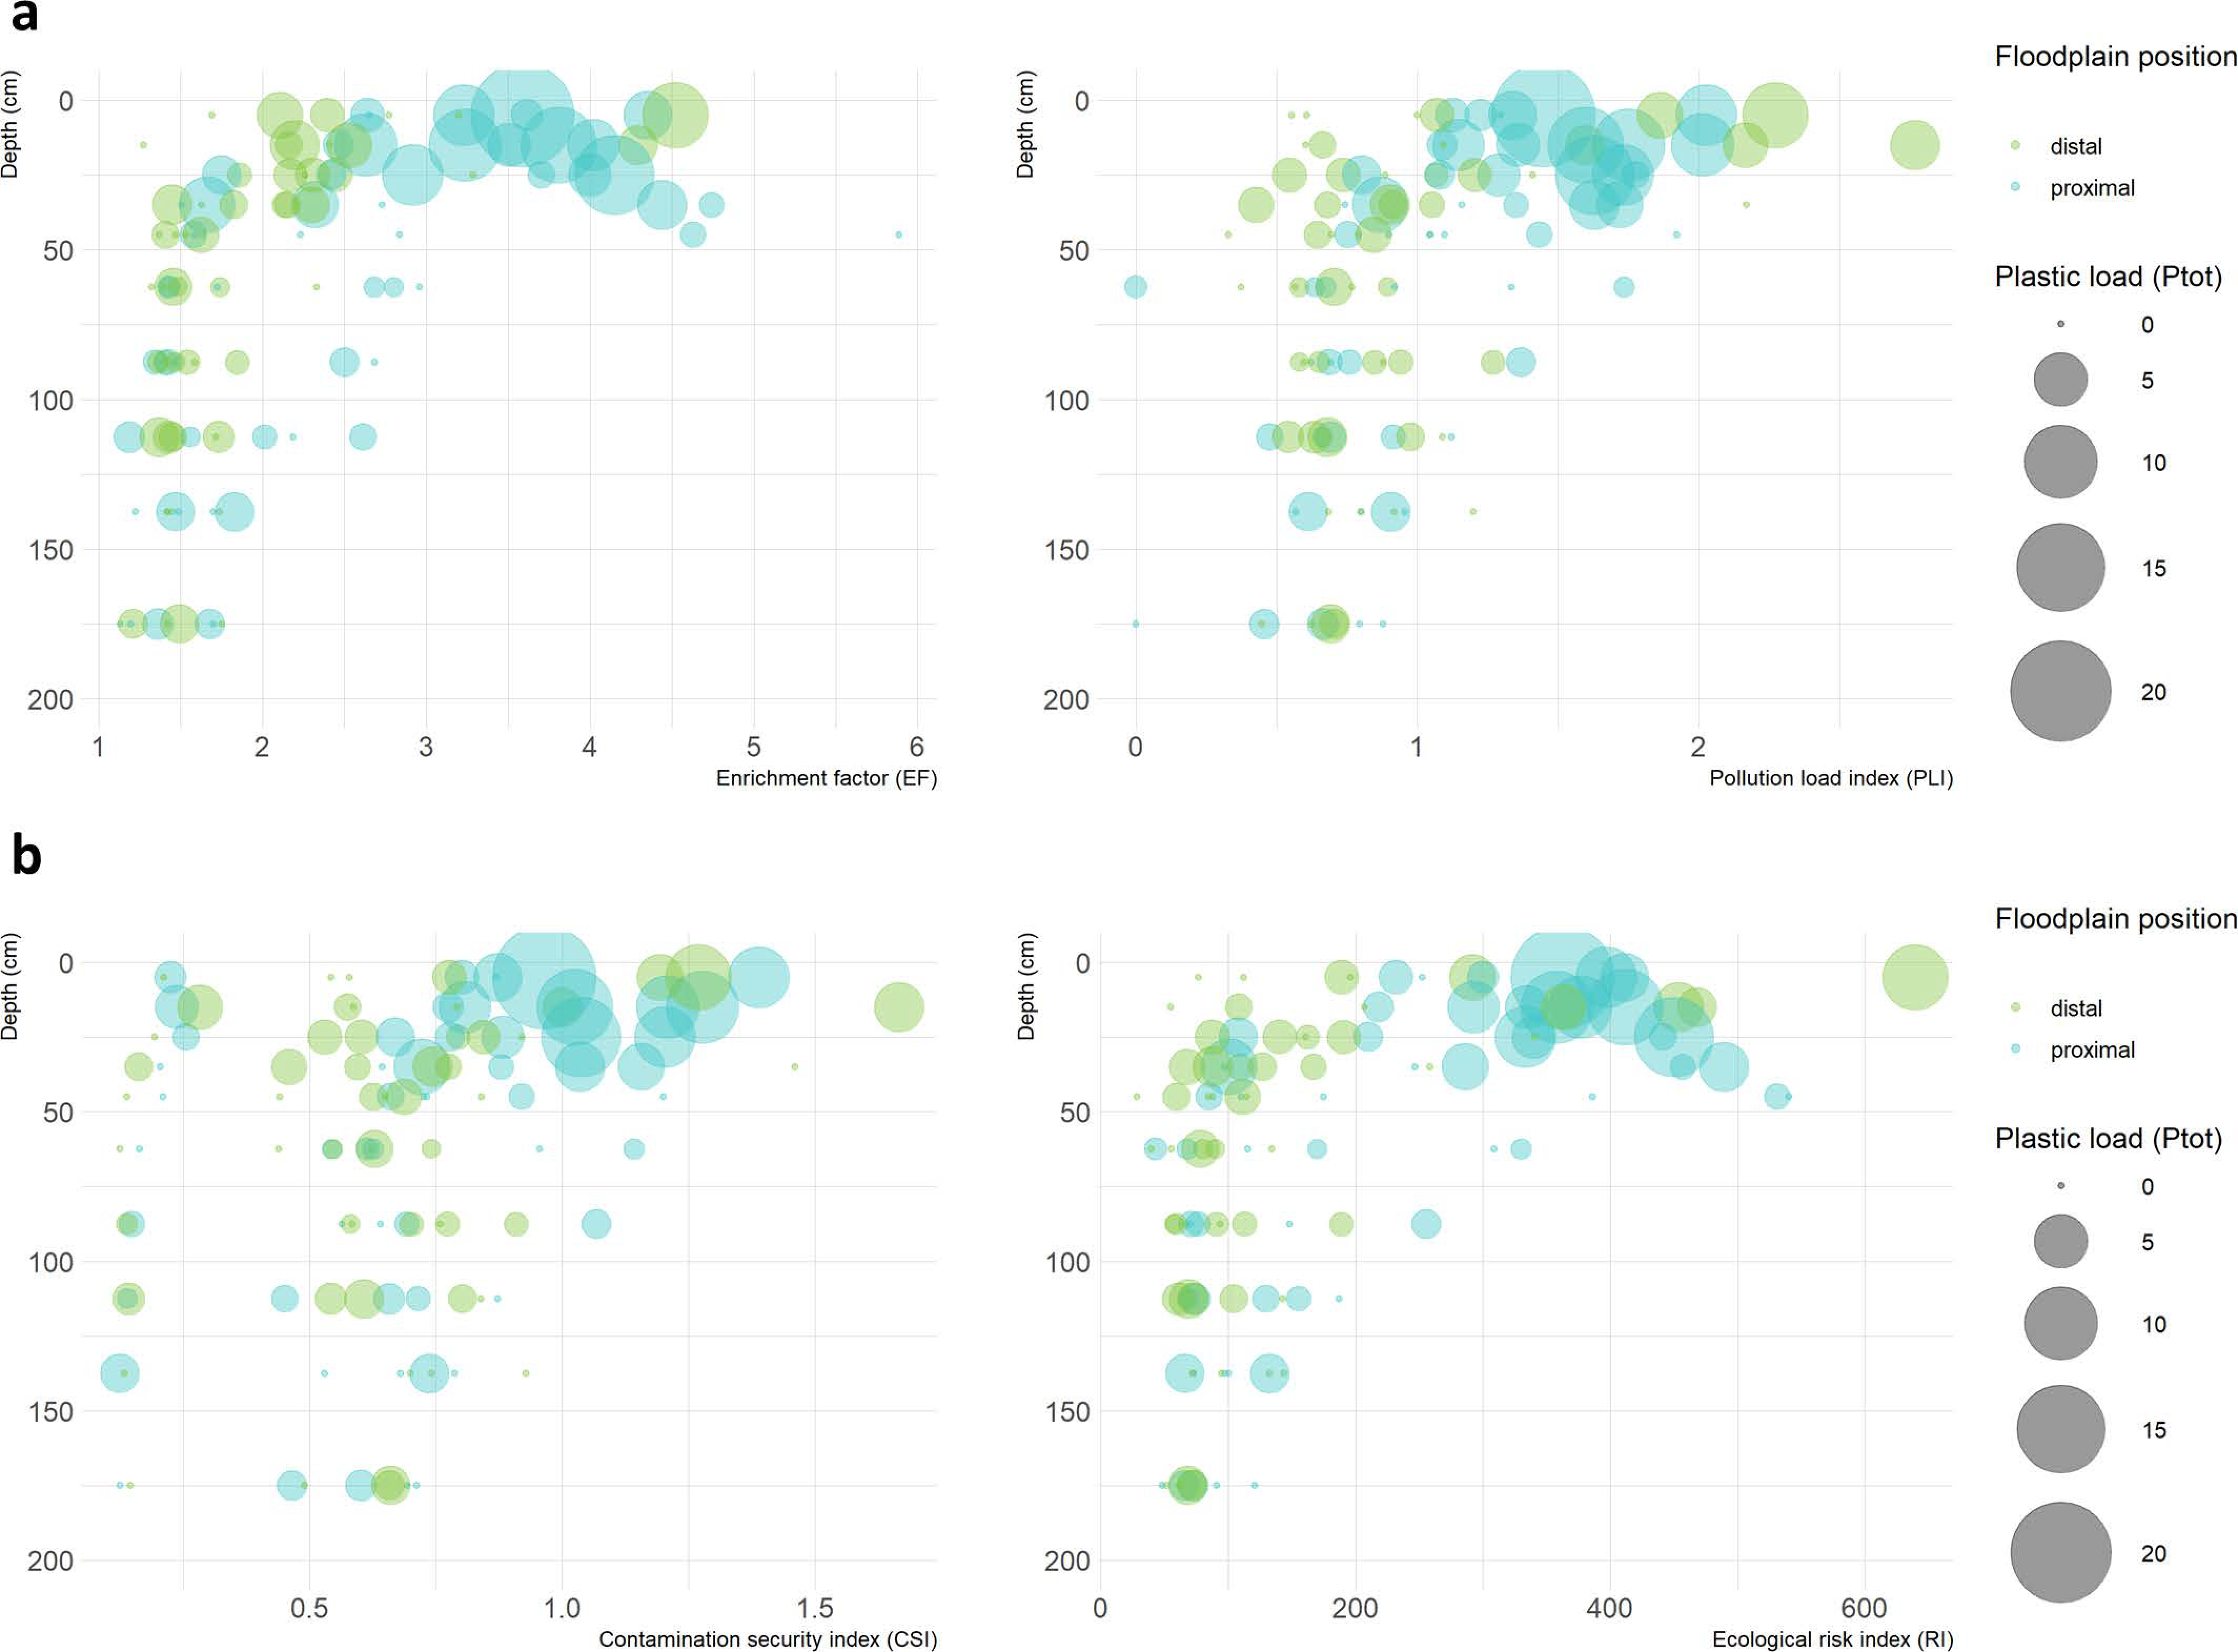
3.2. Spatial Relationships between Plastic and Metal Concentrations

3.2.1. Total Plastic Concentration

Total plastic concentrations (Ptot, calculation presented in Section 2.3) range from 0 to 21.12 p kg−1 with an overall average concentration of 1.66 p kg−1. Detailed descriptions of plastic particles’ characteristics, polymer types, and additional information can be found in Weber and Opp (2020) for MEP (mesoplastic, >5 mm) and CMP (coarse microplastic, >2 mm) as well as in Weber et al. (2021) for LMP (large microplastic, >1 mm) and MMP (medium microplastic, >0.5 mm) size classes.
Considering the Ptot concentrations at the catchment level, it is clear that the mean values per sampling site of 2.65 p kg−1 in the upper reaches (site ELM) decrease in the middle reaches (site ROT: 1.01 p kg−1, site STD: 1.33 p kg−1) and increase again up to 1.96 p kg−1 in the lower reaches (site LIM) (Figure 3). The mean differences in Ptot concentrations between the sampling sites are significant (ANOVA p < 0.01). Despite this finding, the maximum Ptot concentrations increase with increasing flow length. At the sampling site level, the highest average Ptot concentrations are always reached near channel sites (proximal floodplain) and decrease with increasing distance to the river (distal floodplain), except for point STD-3 (inactive flow channel) (Table A1). The site LIM with the sampling point LIM-1 (river bank) shows the absolute maximum average Ptot concentration (5.26 p kg−1) of all investigated floodplain soils. The vertical distribution is clearly divided into two sections: Higher concentrations of Ptot always occur in surface soils (Ah or Ap horizons) or in the upper 40–50 cm of the soils. Below this depth, the contents decrease clearly and zero values occur more frequently (Figure 4). As also documented in one of the former studies, the main amount of Ptot and the highest concentrations are thus present in the young upper soil layers of the fluvial floodplain sediment (Weber et al., 2021).
Comparing the summed Ptot contents with those of other studies in floodplain soils, it is apparent that the general level of plastic pollution within the Lahn River catchment seems to be lower than in other studied catchments [18,19,39] or than the often studied agricultural topsoils [12,14,15,16,17,68]. Nevertheless, the wide spatial distribution indicates a general accumulation of plastic particles in floodplain soils, as is already known for other pollutants such as heavy metals [69].

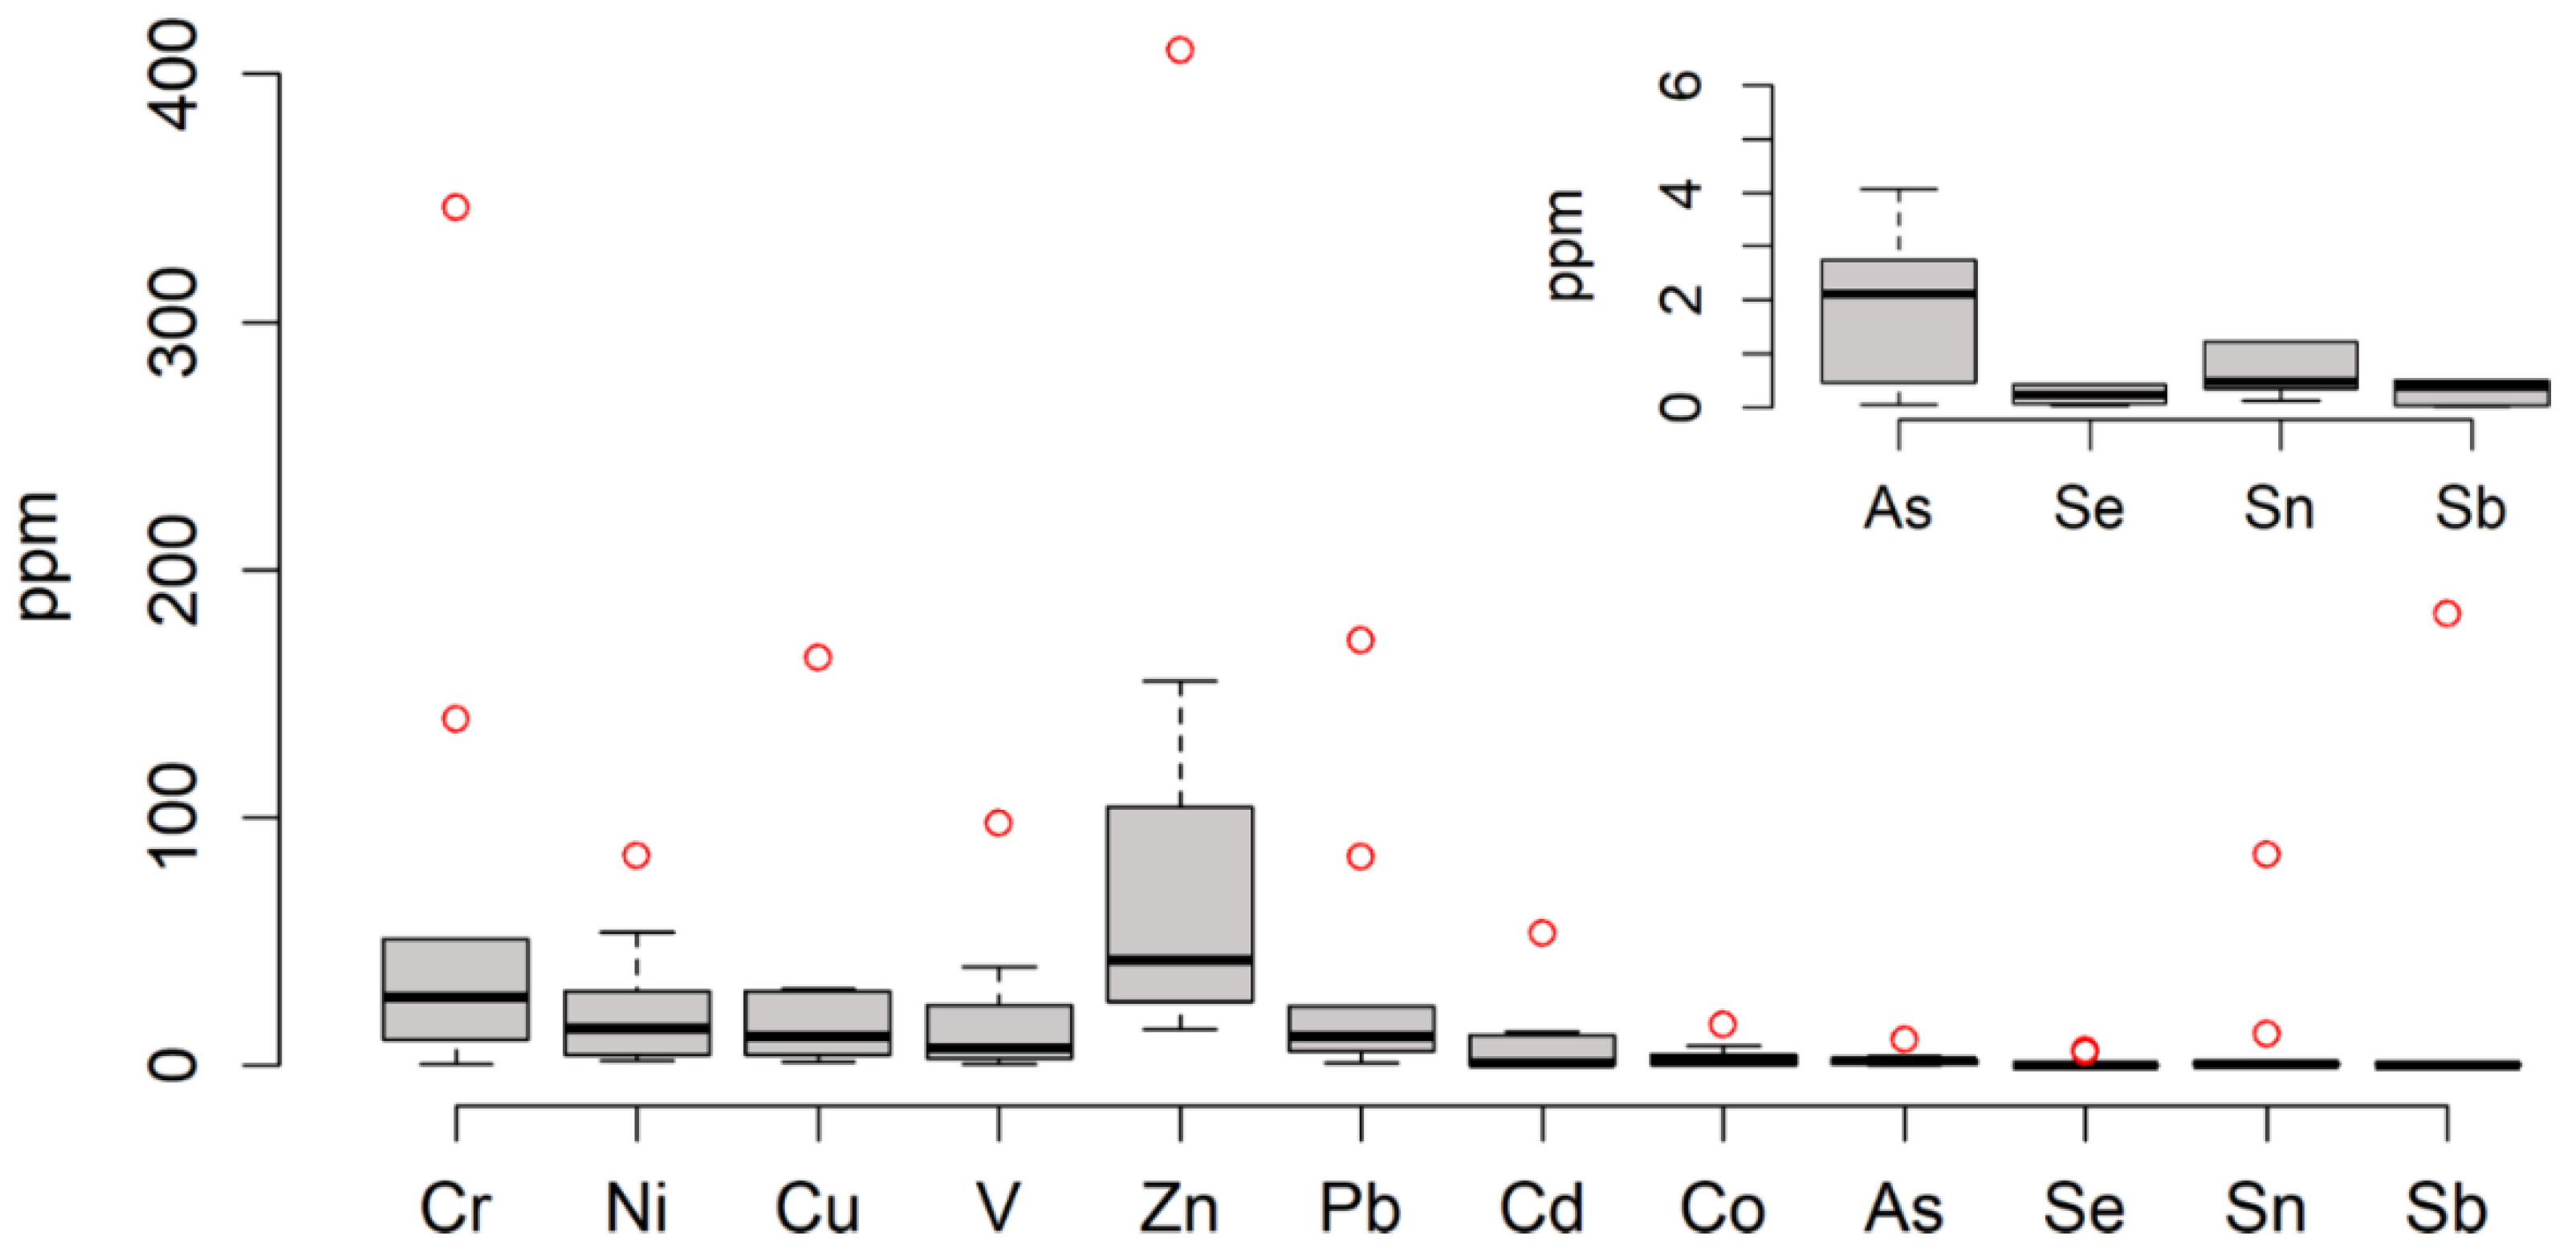
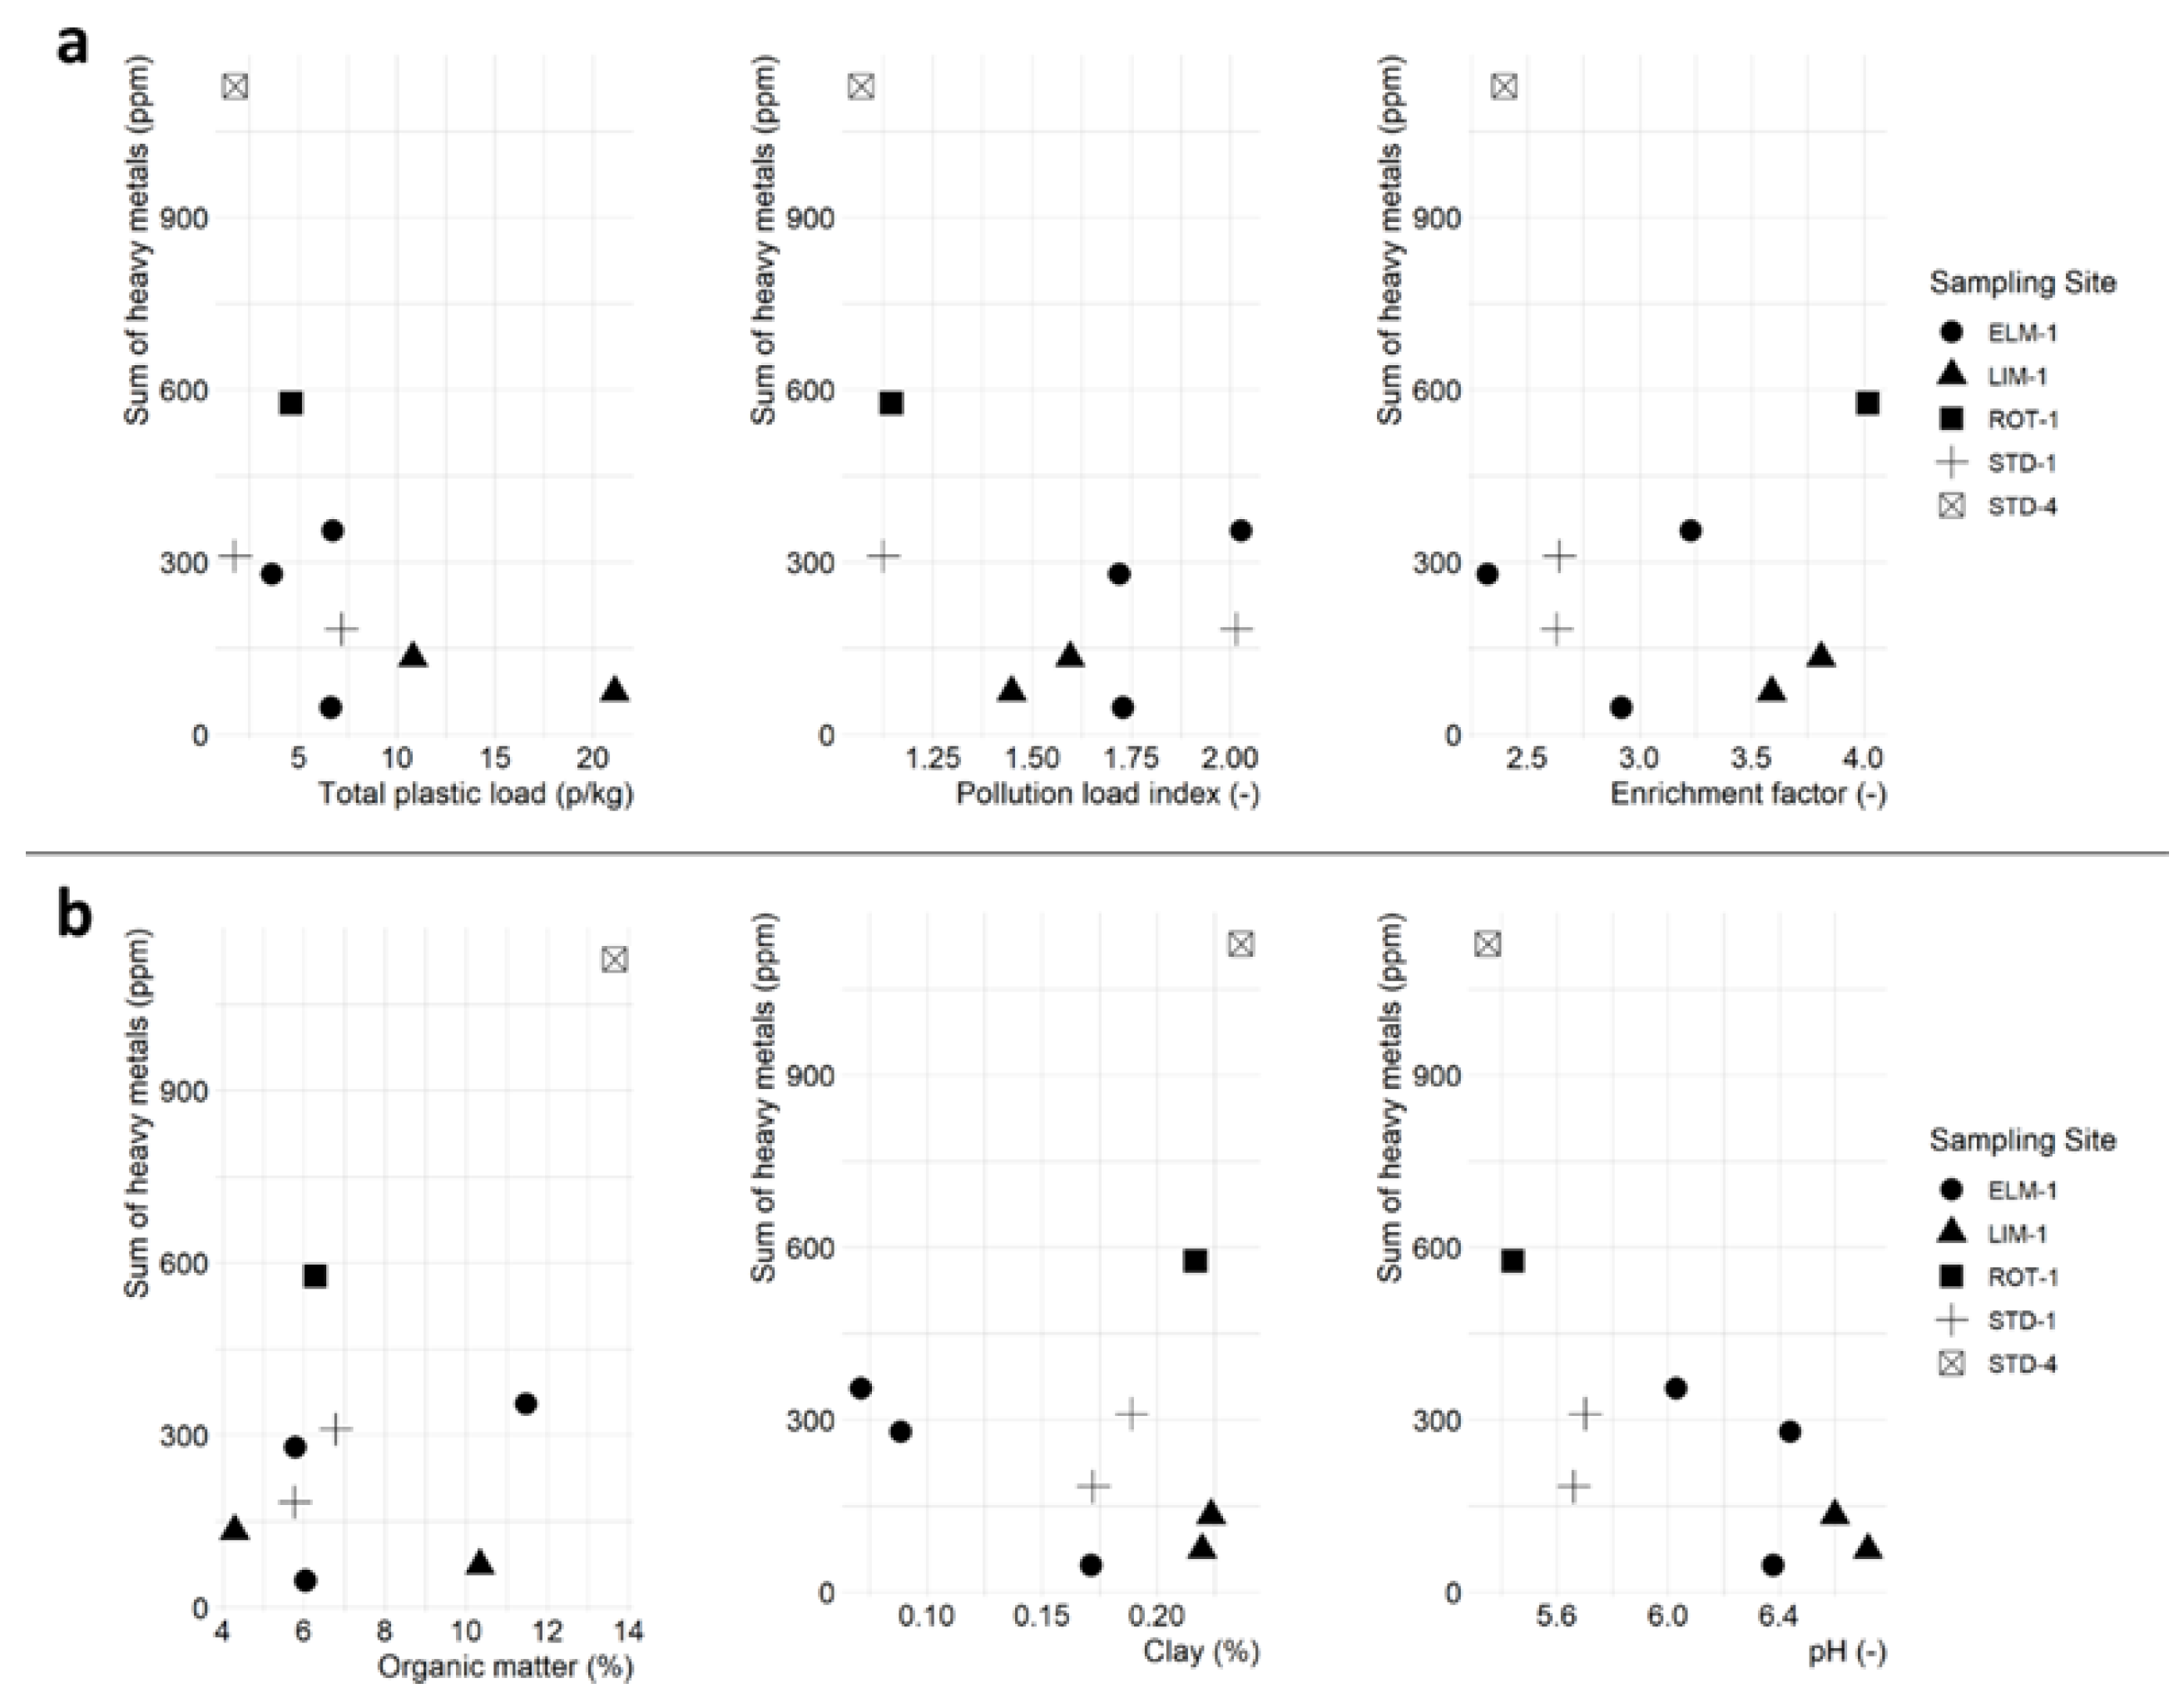
3.2.2. Heavy Metal Concentrations

The presence of heavy metals in soils, and especially floodplain soils, due to the delivery and sedimentation of eroded soil material from the entire catchment is widely recognized. The analyzed heavy metals as well as the metalloid As were detected in all samples, regardless of site position or sampling depth. In general, the following metals are present, in decreasing order based on their average values: Zn (51.39 mg/kg) > Ni (29.05 mg/kg) > Cr (28.00 mg/kg) > Pb (22.20 mg/kg) > Cu (15.56 mg/kg) > V (15.40 mg/kg) > Co (10.18 mg/kg) > As (6.24 mg/kg) > Cd (0.25 mg/kg) (Figure S5). Those concentrations are comparable to the concentrations of Cu, Pb, and Zn in previous studies conducted by Martin (2012; 2015; 2019). The spatial differences in the contents of the individual metals are very heterogeneous (Table A1). Compared to mean global concentrations in topsoil [70], the maximum values of Cr, Ni, Cu, As, Cd, and Pb as well as the top 25% of the concentrations (third quartile) from Ni, As, Cd, and Pb exceed the comparison values (Table A1). All maximum values as well as the mean values of Cr, Co, Ni, Cu, and Cd also exceed the geogenic background levels [61]. The legal precautionary levels for loamy soil, according to the German Federal Soil Protection Ordinance (BBodSchV, 1998), are only exceeded by eight samples for Cr, Ni, Cu, and Cd (Table A1) [66].
Whereas the Enrichment factor (Ef) and the Contamination security index (CSI) indicate a moderate enrichment of heavy metals with low-to-moderate severity of contamination, the Pollution load index (PLI) and the Ecological risk index (RI) show a deteriorate-ion of soil quality as well as a strong ecological risk for 38.1% and 33.9%, respectively, of all samples (Table A1).
Regarding the spatial distribution of heavy metal contamination on the catchment scale and based on the indices that are calculated with geogenic background contents (Ef and PLI), the average and maximum loads show only minor differences with the course of the river (Figure 3). Sampling sites or points with clear outliers do not appear. Against this background, it is possible to assume that the Lahn floodplains are contaminated with heavy metals across the catchment area, with these being of partly geogenic and partly anthropogenic origin.
At the sampling site level, for both the location within the floodplain cross transect and the vertical distribution, a division comparable to the spatial distribution of the Ptot content is detectable. The highest average as well as maximum values of all calculated indices are always reached at the near channel sites (proximal floodplain), except site STD (Table A1). Regarding the vertical distribution, a clear decrease in the indices’ values, most clearly for Ef and RI, and for proximal as well as distal floodplain locations, can be observed for the upper 50 cm of floodplain soils (Figure 4). In addition, the values of CSI and PLI show a decrease over depth, but this is less explicit than the other calculated pollution indices. Even if there are outliers in deeper soil layers depending on the location, the content of heavy metals decreases significantly (p ≤ 0.01) for all pollution indices in the lower (>50 cm) soil layers.

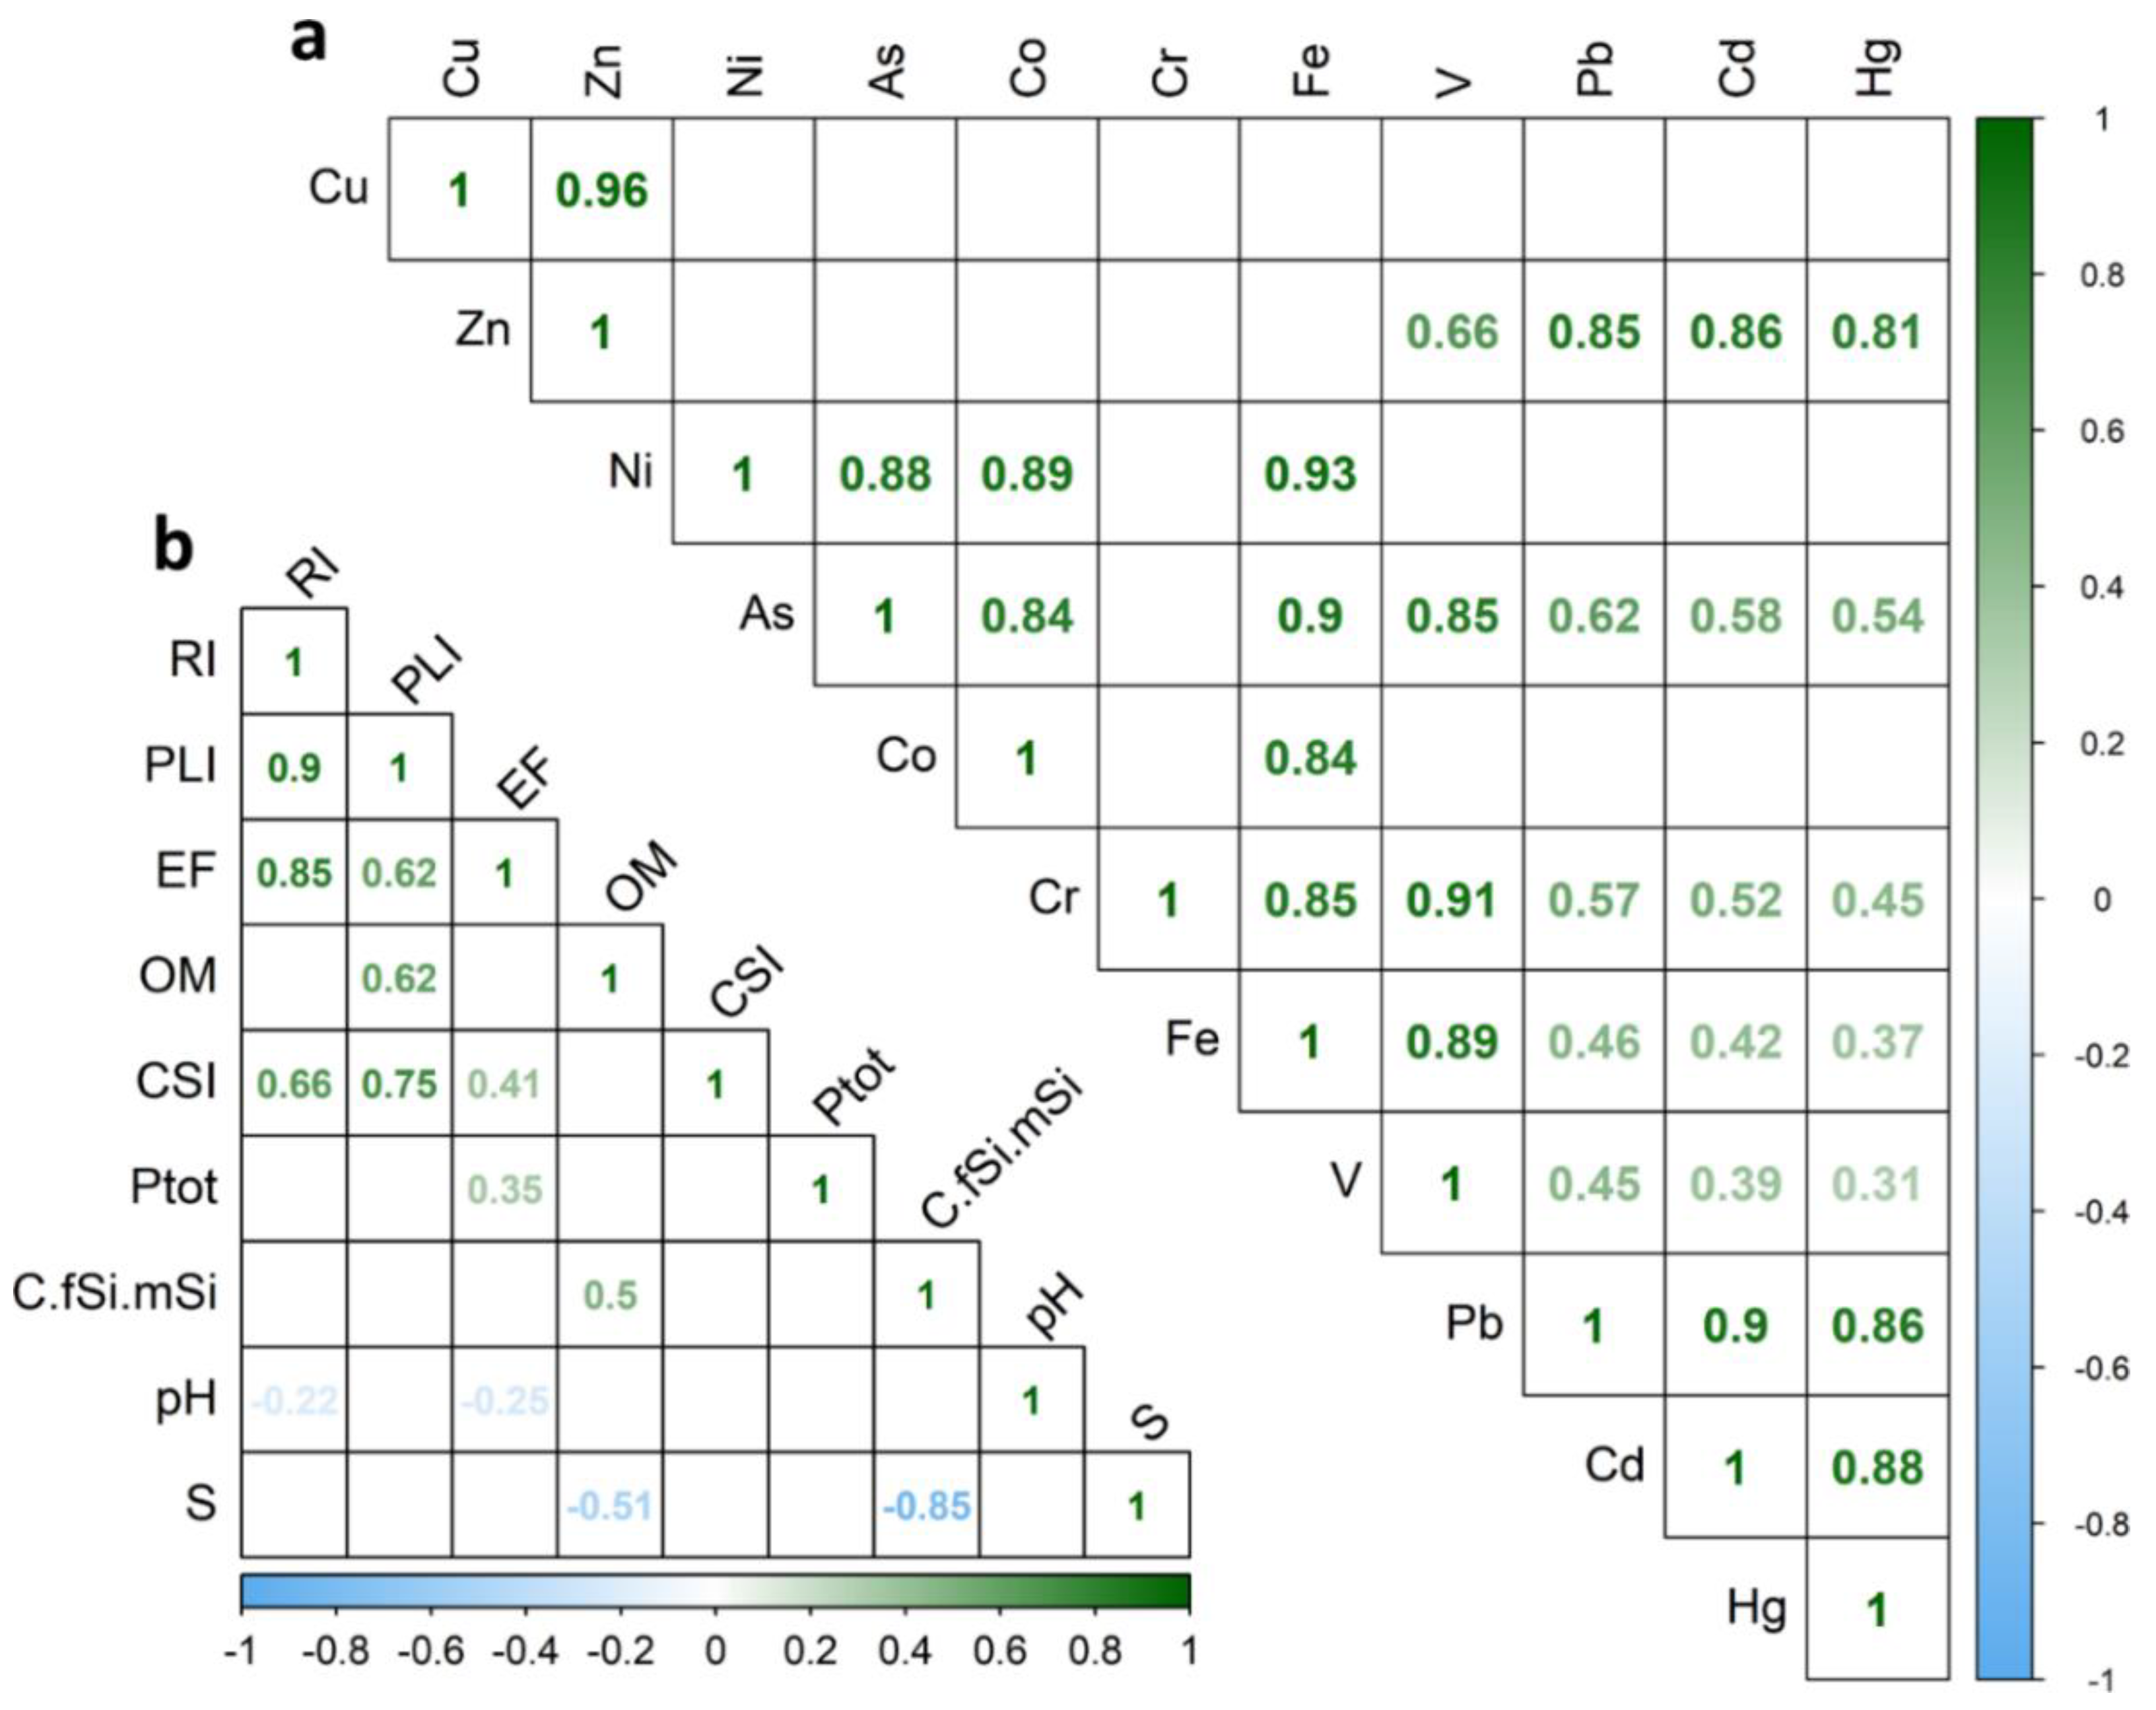
3.2.3. Correlations between Plastics and Heavy Metals

A general spatial connection based on the spatial distribution patterns of plastics and heavy metals was found in the studied floodplain soils. Both contaminants show a comparable distribution on the catchment level, with higher contents in the upper reaches (site ELM), decreasing contents in the middle reaches (site ROT and STD), and a renewed increase in the lower reaches (site LIM), especially in their maximum values (Figure 3). Spatial correlations also occur in the depth distribution. Both the levels of heavy metals, expressed by pollution indices, and the levels of total plastic concentrations differ in the upper and lower soil layers. An accumulation of both contaminants can, therefore, be observed in the upper 40–50 cm of the floodplain soil, for both the proximal and the distal floodplain sites (Figure 4).
The spatial correlations found provide an opportunity to also examine the possible correlations statistically. Spearman rank correlation coefficients (RSP) of Ptot data with individual heavy metals show significant (p ≤ 0.05) weak (rSP < 0.3) positive correlations with the concentrations of Cr, Co, Ni, Cu, Zn, Cd, and Pb for the entire soil profiles (Table 1). With regard to the examined division of the accumulation into upper 50 cm and lower soil areas, the corresponding division of the dataset shows more significant (added V and Fe) and stronger (weak to clear, RSP > 0.5) correlations in the upper soil layers and no significant correlations in the lower soil layers. The same can be observed for correlations with the pollution indices, where significant weak correlations exist in the upper soil layers. No significant correlations can be observed for the relationship between Ptot and soil properties, except for organic matter content (RSP 0.31–0.36) and root density (RSP 0.30–0.33). Therefore, it can be assumed that in the upper soil layers, the heavy metal contents increase (positive correlations) with increasing plastic content and likewise with increasing content of organic material. This can be an indication of chemical relationships, such as comparable adsorption conditions (organic-bound) or an indication of identical deposition conditions (flood water delivery).
Within the context of possible chemical relationships, weak-to-strong, but always positive, inter-element correlations were found for individual heavy metals (Figure 5a), indicating a combined metal pollution from similar long-term sources [71]. Correlations between heavy metal contamination (pollution indices) and environmental drivers of heavy metal behavior (fine soil fraction, sand fraction, organic matter content, and pH) could not be found. Only PLI correlates strongly positively with organic matter content and RI and Ef correlate very weakly negatively with pH (Figure 5b).

3.3. Heavy Metals in Macroplastics and Coarse Microplastics

The macroplastics and coarse microplastic particles used for analyses of heavy metal content comprise fragments, films, and plates with sizes > 2 mm from nine soil samples with mainly white or transparent colors and an average particle mass of 42.13 mg plastic per soil sample (Table S1). The analyzed plastic particles comprise low-density polyethylene (PE-LD), polypropylene (PP), chlorosulfonated polyethylene (CSM), polyamide (PA), and poly(methyl methacrylate) (PMMA) (Table S1). The heavy metal concentrations quantified for these particles can include both adsorbed metals and metals added to the plastic as additives [57].
With regard to the average concentrations, the order of metal concentrations is as follows: Zn (94.63 ppm) > Cr (67.56 ppm) > Pb (34.23 ppm) > Cu (28.13 ppm) > Ni (23.52 ppm) > V (20.28 ppm) > Sb (18.43 ppm) > Sn (10.21 ppm) > Cd (8.43 ppm) > Co (3.82 ppm) > As (2.55 ppm) > Se (1.30 ppm) (Figure 6). The highest sums (>300 ppm) of heavy metal concentrations were found in samples STD-4-1 (PP, film), ROT-1-2 (PE-LD, massive fragment), and STD-1-2 (CSM, fragment and film). The maximum values (outliers in Figure 6) can also be traced back element-specifically to these three samples. Since comparative and reference values (by law) for the evaluation of the metal contents are missing, the focus here can only be on the presentation of the concentrations and the connection with the sample matrix.
From the entire dataset, total plastic loads, pollution indices, and soil properties can be used for comparison with the sum of heavy metals from the particles (Figure A1). Whereas the comparison with PLI and Ef shows no clear trend, the comparison with Ptot suggests a decrease in the sum of heavy metals with increasing Ptot content (Figure A1a). The same decrease is observable in comparison to pH values (Figure A1b). In contrast, heavy metal content appears to decrease with decreasing OM or clay content. Due to the limited number of samples (n = 10) and the heterogeneous data distribution, correlation analyses lead to insignificant results.

4. Discussion

4.1. Spatial Correlations

Macroplastics and microplastics, as well as heavy metals, are present in floodplain soils of the entire Lahn River catchment. Furthermore, based on the conducted geospatial sampling approach, the results indicate spatial relationships between both contaminants. Various studies have determined the presence of partwise increased metal concentrations in the floodplain soils, pore water, and water, as well as suspended particulate matter of the Lahn River [72,73]. In general, heavy metal loads and their spatial distribution are comparable to the results of previous studies conducted in the Lahn River catchment [48,49]. In the case of the metals Cu, Pb, and Zn evaluated by Martin (2008, 2012) for near-channel positions, the concentration ranges correspond to the data presented here for those three metals [49]. The increase in concentrations described in these studies for the course of the river could not be traced here, neither for proximal sites (near-channel) nor for the entire transects.
Regarding the total plastic concentrations, a regional comparison was not possible due to the lack of case studies to date. In comparison to microplastic concentrations in soils, documented for topsoils under agricultural usage, the contents found here are comparatively low [14,15,17,68]. For example, Lu et al. (2018) reported average concentrations of 70.0 p kg−1 (>0.02 mm plastics) and Corradini et al. (2019) documented a range of 0.6–10.4 p g−1. The microplastic concentrations reported for Swiss floodplain topsoils (average: 5 mg kg−1) are hard to compare with our results due to the different units applied [18]. The average concentrations of microplastics documented for the Inde River catchment (North Rhine-Westphalia, Germany), ranging from 25.4 p kg−1 up to 47.9 p kg−1, are comparable to the results of Weber et al. (2021) and show that the mean contents in the floodplains of the Lahn are significantly lower and only maximum contents reach the mean range in the Inde river [19]. However, it is important to note that due to the different sampling and analysis methods, only limited comparability can be ensured here. This also applies to the investigated (micro-)plastic size classes, as many studies, unlike ours, also examine particles < 300 μm, which can explain the increased concentrations.
In contrast to the problems for the comparison of plastic concentrations, the spatial distribution of plastic concentrations in floodplain soils is comparable to the studies of Scheurer and Bigalke (2018) and Lechthaler et al. (2021). Both studies documented an increase in plastic concentrations with stream length or, rather, a correlation between plastic concentrations and population density within the catchments. With reference to this lateral distribution over the catchment, the Ptot concentrations also show an increase along the length of the river, with the exception that higher contents (mean and maximum) were already present in the upper reaches (Figure 3). No direct impact of the urban centers along the Lahn River (the cities of Marburg, Gießen, Wetzlar, and Limburg) was found. However, a general increase in Ptot levels may suggest an increased occurrence of potential sources along the river. The same applies to heavy metal contents, even if these show a higher variability at the catchment level, probably caused by the different environmental sources (e.g., geogenic activity, mining) [5].
In addition to the correlations in variability at the lateral catchment level, spatial correlations occur primarily at the vertical level (depth distribution in the floodplain soils). The clear separation with higher contents in the upper soil layers (0–50 cm) and significant correlations between Ptot and metal contents illustrate these spatial relationships. Following the indications from previous research, indicating flood water delivery as the main source of plastic particles in floodplain soils, this shared source and the comparable transport behavior could also explain the spatial connections [19,45].

4.2. Pollution Sources and Interactions

Assuming the same sources and deposition conditions for both contaminants in floodplain soils, the question arises as to whether this only applies to the river and floodplain area, or also to the wider catchment area, and whether and how these contaminants interact. In contrast to plastics, heavy metals are a natural component of river and floodplain sediments, expressed by the natural and thus geogenic background contents [40,70]. In case of the Lahn River catchment, the regional geology, which includes rocks of the Rhenish Slate Mountains (Devonian and Carboniferous), Triassic sandstones, and Tertiary volcanic rocks, provides a high spatial variation of geogenic metal contents [61,74]. Both contaminants, metals and plastic, have the characteristic that they can be introduced anywhere within the catchment area. In contrast to heavy metals, which have been entering the environment for a long time mainly through human use, whether through mining or industry, the situation is different for plastics [75].
Plastics, as polymers, were first developed by humans in the last 100 to 120 years, whereby global plastic production first began in the 1950s [7,75]. Thus, plastic particles, regardless of their input pathway, have only been able to enter the environment and, thus, river systems and floodplains for about 70 years. The steady and exponential growth of global plastic production makes it likely that large quantities of plastic have only recently been released into the environment [76]. The short time span in which plastic can enter the environment is also expressed in the accumulation of plastic particles in the upper floodplain soil layers and has already been discussed by Weber et al. (2021). Since the findings demonstrate that this accumulation also partially applies to heavy metals, it may suggest that the current sources of metals and plastics could be identical. With respect to the environmental and landscape properties of the Lahn River catchment sources, such as urban areas (and especially urban wastewater) [77], traffic (e.g., tire abrasion: plastic; brake abrasion: heavy metals) [71] or agriculture [37,38] are able to release both groups of contaminants into the environment and the fluvial system of the Lahn River.
In addition to the environmental sources described in Section 2, heavy metals can also originate from the plastic particles themselves [34,57]. The results show that all metals analyzed were present in the investigated macroplastic and coarse microplastic particles. Previous research in the aquatic as well as in the terrestrial environment has shown both phenomena—the adsorption of metals from the surrounding environmental medium and the release of additive metals [29,33,37,57]. Despite the unmanageable number of additives in plastic production, some of the notable concentrations from the results could perhaps originate from such additives. The comparatively high contents of Zn can be attributed to inorganic flame retardants or slip agents, for example [34]. In addition, the highest total contents of metal load within plastic particles was detectable within two CSM (chlorosulfonated polyethylene) particles, a polymer type that obtains its special properties through vulcanization with metal oxides (e.g., lead(II) oxide or zinc oxide) [78]. A statement about the adsorption on plastic particles is not possible due to the given methodological limitations based on digestion method. The presence of heavy metals in the surrounding soil matrix from which the plastic particles were isolated would make adsorption processes possible. Previous studies have shown that adsorption is metal-specific, concentration-dependent, and promoted by degraded particle surfaces [35,38]. The accumulation of plastic held in the upper soil layers in combination with mostly degraded or highly weathered plastic particles would thus promote adsorption of the metals, but also promote their release through degradation of the particles [35]. Significant correlations between Ptot and organic matter in the upper soil layer (rsp 0.32) and between the pollution load index and the organic matter content (rsp 0.62) could furthermore indicate the influence of the presence of plastic, resulting in an increase within the organic-bound metal fraction [38].

4.3. Risk Assessment

The main difference between plastic particles and heavy metals in terms of their environmental risk is that comparatively little is known about the actual risk posed by plastic contamination. In general, it should be clear that plastics, in contrast to metals, do not have any benefit or use within the environment, as they are anthropogenic foreign objects in soils, sediments, or water. Metals, on the other hand, are partly essential (e.g., Fe, Co, Cu, Ni) for all organisms [4]. However, excessive concentrations in combination with toxic metals (e.g., As, Cd) lead to a wide variety of potential risks for ecosystems, organisms, soil functions, and ultimately human health [4]. Common practices for risk assessments of heavy metal pollution in soils are based on different exposure pathways, exposure times, and potential doses as well as on national legislation values considering those factors [4,65,66]. The early state of plastic research, especially in soils, has so far not resulted in limit values or other legislation on maximum levels of plastic in soils [66,70]. Likewise, long-term monitoring of heavy metals in soils often provides geochemical background values for comparison [70]. These cannot be determined in the case of plastic contamination, as the geogenic background content of plastic in soils must be zero due to its purely anthropogenic origin.
Against this background, the results of the present study show that in floodplain soils, a low-to-moderate risk can be expected solely by heavy metal enrichment. Legal precautionary levels are exceeded only very singularly by contents of Cr, Cu, Ni, and Cd, whereby no spatial hot spots can be identified (Table A1). The calculated pollution indices demonstrate a low-to-moderate enrichment or severity (Ef, CSI), but a general deterioration of soil quality (PLI) and a strong ecological risk (RI). Even if the calculated indices are limited by the introduced comparative values, the data basis (341 samples) of the regional background values in floodplain soils can be assessed as comparatively good.
Furthermore, floodplain soil properties indicate a rather low mobility, since both the high contents of organic material and the widespread hydromorphic conditions (groundwater influence) promote the binding of the metals to humus complexes as well as to Fe-Mn oxides [2]. As the floodplains are mostly used for agriculture, these risks exist for the soil–crop impact pathways, but also for the soil–groundwater pathway due to heavy metal enrichment up to a depth of 2 m [65,66]. However, as the levels are low in contrast to the excessive contamination found in the direct surroundings of industrial plants and military sites, or in anthropogenic and urban soils in general, the basic environmental risk from metals alone can be assessed to be low [4,60].
Remembering the restrictions on assessing the risk of plastic contamination, it can only be argued that the widespread presence of plastic particles in floodplain soils down to a depth of two meters and the accumulation in upper soil layers form the potential for possible risks. The variety of possible risks was discussed in a wide range of reviews [7,26,60]. However, for the area of floodplain soils, the following contamination pathways should be pointed out in particular: As in the case of heavy metals, microplastics, especially those of small particle size, can be taken up by plants and organisms, which can ultimately lead to their uptake into the human food chain [24,25,79]. Evidence of microplastics in human excrement or even in placentas suggests that consequential risks from plastic itself (foreign bodies) or additives are possible [79]. Furthermore, floodplains are important ecosystems and, in some cases, important agricultural areas due to their fertile soils. Therefore, all risks that affect soil fertility or soil functions (e.g., influence on soil aggregates, C-dynamics) should not be neglected, even if they cannot yet be conclusively assessed [26,27,28]. Finally, floodplains assume important functions as flood retention areas but also as filters for groundwater, and they play an important role in global water cycles. The indication of a mobile microplastic fraction in floodplain soils [45] and the general mobility of heavy metals in soils [80] can, therefore, also pose a risk for groundwater and, thus, for drinking water. If both contaminants are now combined in a joint risk assessment, it can be stated that both pollutants alone can represent environmental risks, especially in soils, along different pathways. As already indicated by other studies, both contaminants seem to lead to combined effects through mutual influence (adsorption and desorption processes) or the influence on critical environmental drivers that control the degree of contamination (e.g., OM, DOC, and pH as factors for the chemical behavior of metals) [35,38]. The spatial correlation of both pollutants in floodplain soils with the same sources, transport, and deposition conditions, as shown by the results presented here, could further enhance such a tandem interaction of the pollutants.
Although Martin (2012) observed a decrease in heavy metal concentrations at riverine sites of the Lahn [49], the enrichment of upper soil layers could also lead to further endangerment in the future. Under climate change, an increase in heavy rainfall events followed by more severe floods is predicted for Central Europe [81]. Stronger floods with increased side or bank erosion could lead to the remobilization of both contaminants, as well as further transport and effects in other ecosystems.

5. Conclusions

Based on our geospatial research approach and with regard to the study objectives, we were able to demonstrate the presence and spatial distribution of heavy metals and plastic particles in floodplain soils. Furthermore, we were able to detect spatial correlations between both contaminants in the studied floodplain soilscapes. Those spatial correlations can be expressed by a comparable variability in concentrations across the catchment and in an accumulation in upper soils (0–50 cm). Furthermore, macro- and coarse microplastic particles were also found to contain heavy metals of adsorbed or additive origins. The spatial correlations are indicative of similar pathways of release, transport, and deposition of both contaminants in floodplain depositional systems. In terms of the evaluation and assessment of the spatial relationships found, however, there is a lack of comparative data. Therefore, more quantitative studies considering plastic concentrations in soils and floodplain systems should be conducted using comparable and standardized methods.
In particular, improvements can be made in the analysis of heavy metals or plastic particles from the environment. In contrast to the method used here with a nearly complete digestion of the particles, different digestion protocols should be used in the future. These offer the advantage that, depending on the strength of the digest used, a distinction between adsorbed and additive metals in plastic particles and, if necessary, different adsorption rates can be documented in order to establish a better correlation with metal contents in the surrounding soil matrix. More research is needed to understand the chemical and physical relationships between plastic particles and heavy metals, as well as to assess the environmental impacts and hazard potential of plastics and microplastics. As with “recognised” pollutants, only a scientific basis can provide a foundation for the introduction of limit values based on laws and management strategies.
Finally, we encourage further and deeper research at this interface between terrestrial and aquatic ecosystems, whose soil landscape is subject to dynamic processes. In particular, with regard to the presence and spatial relationships of plastics and heavy metals, these could also be present for other pollutants (e.g., organic pollutants). Further research should, therefore, initially focus on the following points:
  • Quantitative spatial assessment of plastic and heavy metal contaminations in different floodplains and river systems.
  • Consideration of heavy metals in different chemical bonds and analysis of adsorbed and additive metals in order to draw conclusions about the sources and interactions.
  • Examination of contaminants in both soil water (pore water) and groundwater in order to better understand their mobility and possible associated risks.

Supplementary Materials

The following are available online at www.mdpi.com/article/10.3390/app12020595/s1, Supplementary Material: Connections between microplastics and heavy metal pollution within floodplain soils, Table S1: Mesoplastic and coarse microplastic particles for metal detection, Figure S1: Grain size distribution for soil profiles of site ELM. a: Profile ELM-1; b: Profile ELM-2, Figure S2: Grain size distribution for soil profiles of site ROT. a: Profile ROT-1; b: Profile ROT-2, Figure S3: Grain size distribution for soil profiles of site STD. a: Profile STD-1; b: Profile STD-2; c: Profile STD-3; d: Profile STD-4, Figure S4: Grain size distribution for soil profiles of site LIM. a: Profile LIM-1; b: Profile LIM-2; c: Profile LIM-3; d: Profile LIM-4, Figure S5: Heavy metal and metalloid As concentrations (mg kg-1) from floodplain soils samples (n = 112) ordered by descending mean concentration.

Author Contributions

Conceptualization, C.J.W.; methodology, C.J.W. and J.H.; validation, C.J.W.; formal analysis, C.J.W.; investigation, C.J.W.; resources, C.J.W., J.H. and C.O.; data curation, C.J.W. and J.H.; writing—original draft preparation, C.J.W.; writing—review and editing, C.J.W., J.H. and C.O.; visualization, C.J.W.; supervision, C.O.; project administration, C.J.W.; funding acquisition, C.J.W. and C.O. All authors have read and agreed to the published version of the manuscript.

Funding

This research was funded by Hessian State Agency for Nature Conservation, Environment and Geology (Funding number: 61906346) and the Marburg University Research Academy (MARA) through a PhD scholarship.

Institutional Review Board Statement

Not applicable.

Informed Consent Statement

Not applicable.

Data Availability Statement

Data can be freely accessed under Weber, Collin; Hahn, Jens (2021), “Spatial connections between microplastics and heavy metal pollution within floodplain soils”, Mendeley Data, V2, doi: 10.17632/t8ytwfgdz9.2.

Acknowledgments

The authors gratefully acknowledge the support of Alexander Santwoski during fieldwork and the support of our laboratory assistants during ICP-MS analyses. Furthermore, the authors acknowledge the permission granted by the landowners to access their land.

Conflicts of Interest

The authors declare no conflict of interest.

Appendix A

Figure A1. Comparison of sum of heavy metals (ppm) extracted from macroplastic particles with (a) total plastic concentrations and pollution indices (PLI and EF) of the respective soil sample and (b) floodplain soil properties of the respective soil sample per sampling site.
Applsci 12 00595 g0a1
Table A1. Overview of average plastic and heavy metal loads with calculated pollution indices.
Sampling SiteSoil ProfilePtot
(p kg–1) a
Heavy Metal Concentrations (mg kg–1) Pollution Indices
VCrCoNiCuZnAsCdPbEf bPLI cCSI dRI e
ELMELM-14.0018.4038.0114.4049.4133.23105.257.930.5144.632.721.741.18325.5
ELM-21.3123.1237.3614.7441.8121.7161.669.740.2321.721.811.320.95187.4
ROTROT-11.4910.4319.276.9720.4913.5050.244.810.2520.053.450.950.67262.5
ROT-20.5411.6020.127.6919.878.8829.734.480.1212.641.860.680.5992.6
STDSTD-12.0416.7029.7511.1529.4014.7244.326.010.2015.741.800.900.74134.0
STD-20.5114.9426.429.2727.9414.0543.536.180.1616.401.700.890.71129.6
STD-31.8318.0533.2610.6531.4417.6658.377.200.3525.442.281.170.81216.7
STD-40.9616.8331.659.7029.4214.7144.926.700.1720.791.741.000.77127.3
LIMLIM-15.2614.1528.7313.4335.1017.7172.816.360.4831.893.181.390.93325.0
LIM-20.9114.4926.6710.3527.6813.9051.095.660.3025.372.321.050.18186.7
LIM-30.6415.5527.829.3925.4413.7340.726.150.1822.071.790.910.17124.1
LIM-40.8111.4819.265.9215.776.8024.924.210.1013.461.770.520.5464.1
SHW f -60.0-29.038.9-0.70.427.0Specific limit values g>5.0>1.01.0–2.0180–360
GBH h38.325.08.824.013.358.58.00.127.0Interpre-tation of limit valuemoderate enrich-mentdeteriorate-ion of soil qualitylow to moderate severityStrong ecological risk
LPL i-60.0-50.040.0150.0-1.070.0
Samples (n) exceed LPL or limit values (total n = 118) 2 930 10 145140
a Average total plastic load (particle per kg soil dry weight), b Enrichment factor, c Pollution load index, d Contamination security index, e Ecological risk index, f Average content surface horizons worldwide (Kabata-Pendias, 2011), g Specific limit values for pollution indices (Kowalska et al., 2018), h Geochemical background in Hessian floodplain soils (Friedrich and Lügger, 2011), i Legal precautionary level for loamy soil according to German Federal Soil Protection Ordinance-BBodSchV (1998).

References

  1. Food and Agriculture Organization of the United Nations (FAO). Healthy Soils are the Basis for Healthy Food Production. Fact Sheet; FAO: Rome, Italy, 2015. [Google Scholar]
  2. Blume, H.-P.; Brümmer, G.W.; Fleige, H.; Horn, R.; Kandeler, E.; Kögel-Knabner, I.; Kretzschmar, R.; Stahr, K.; Wilke, B.-M. Scheffer/Schachtschabel Soil Science, 1st ed.; Springer: Berlin/Heidelberg, Germany, 2016; ISBN 9783642309410. [Google Scholar]
  3. Willgoose, G. Principles of Soilscape and Landscape Evolution; Cambridge University Press: Cambridge, UK, 2018. [Google Scholar]
  4. Alloway, B.J. Heavy Metals in Soils; Springer: Dordrecht, The Netherlands, 2013. [Google Scholar]
  5. Dudka, S.; Adriano, D.C. Environmental impacts of metal ore mining and processing: A review. J. Environ. Qual. 1997, 1997, 590–602. [Google Scholar] [CrossRef]
  6. Gałuszka, A.; Migaszewski, Z.M.; Zalasiewicz, J. Assessing the Anthropocene with geochemical methods. Geol. Soc. Lond. Spec. Publ. 2014, 395, 221–238. [Google Scholar] [CrossRef]
  7. Andrady, A.L. The plastic in microplastics: A review. Mar. Pollut. Bull. 2017, 119, 12–22. [Google Scholar] [CrossRef] [PubMed]
  8. Barnes, D.K.A.; Galgani, F.; Thompson, R.C.; Barlaz, M. Accumulation and fragmentation of plastic debris in global environments. Philos. Trans. R. Soc. Lond. B Biol. Sci. 2009, 364, 1985–1998. [Google Scholar] [CrossRef] [PubMed] [Green Version]
  9. Karbalaei, S.; Hanachi, P.; Walker, T.R.; Cole, M. Occurence, sources, human health impacts and mitigation of microplastic pollution. Environ. Sci. Pollut. Res. 2018, 25, 36046–36063. [Google Scholar] [CrossRef] [PubMed]
  10. De Souza Machado, A.A.; Kloas, W.; Zarfl, C.; Hempel, S.; Rillig, M.C. Microplastics as an emerging threat to terrestrial ecosystems. Glob. Chang. Biol. 2018, 24, 1405–1416. [Google Scholar] [CrossRef] [PubMed] [Green Version]
  11. Braun, M.; Mail, M.; Heyse, R.; Amelung, W. Plastic in compost: Prevalence and potential input into agricultural and horticultural soils. Sci. Total Environ. 2021, 760, 143335. [Google Scholar] [CrossRef]
  12. Huerta Lwanga, E.; Mendoza Vega, J.; Ku Quej, V.; Chi, J.d.L.A.; Sanchez Del Cid, L.; Chi, C.; Escalona Segura, G.; Gertsen, H.; Salánki, T.; van der Ploeg, M.; et al. Field evidence for transfer of plastic debris along a terrestrial food chain. Sci. Rep. 2017, 7, 14071. [Google Scholar] [CrossRef]
  13. Corradini, F.; Bartholomeus, H.; Huerta Lwanga, E.; Gertsen, H.; Geissen, V. Predicting soil microplastic concentration using vis-NIR spectroscopy. Sci. Total Environ. 2019, 650, 922–932. [Google Scholar] [CrossRef] [PubMed]
  14. Liu, M.; Lu, S.; Song, Y.; Lei, L.; Hu, J.; Lv, W.; Zhou, W.; Cao, C.; Shi, H.; Yang, X.; et al. Microplastic and mesoplastic pollution in farmland soils in suburbs of Shanghai, China. Environ. Pollut. 2018, 242, 855–862. [Google Scholar] [CrossRef] [PubMed]
  15. Zhang, G.S.; Liu, Y.F. The distribution of microplastics in soil aggregate fractions in southwestern China. Sci. Total Environ. 2018, 642, 12–20. [Google Scholar] [CrossRef] [PubMed]
  16. Zhang, G.S.; Zhang, F.X.; Li, X.T. Effects of polyester microfibers on soil physical properties: Perception from a field and a pot experiment. Sci. Total Environ. 2019, 670, 1–7. [Google Scholar] [CrossRef] [PubMed]
  17. Piehl, S.; Leibner, A.; Löder, M.G.J.; Dris, R.; Bogner, C.; Laforsch, C. Identification and quantification of macro- and microplastics on an agricultural farmland. Sci. Rep. 2018, 8, 17950. [Google Scholar] [CrossRef] [PubMed] [Green Version]
  18. Scheurer, M.; Bigalke, M. Microplastics in Swiss Floodplain Soils. Environ. Sci. Technol. 2018, 52, 3591–3598. [Google Scholar] [CrossRef]
  19. Lechthaler, S.; Esser, V.; Schüttrumpf, H.; Stauch, G. Why analysing microplastics in floodplains matters: Application in a sedimentary context. Environ. Sci. Processes Impacts 2021, 71, 299. [Google Scholar] [CrossRef]
  20. Weber, C.J.; Opp, C. Spatial patterns of mesoplastics and coarse microplastics in floodplain soils as resulting from land use and fluvial processes. Environ. Pollut. 2020, 267, 115390. [Google Scholar] [CrossRef]
  21. Hüffer, T.; Metzelder, F.; Sigmund, G.; Slawek, S.; Schmidt, T.C.; Hofmann, T. Polyethylene microplastics influence the transport of organic contaminants in soil. Sci. Total Environ. 2019, 657, 242–247. [Google Scholar] [CrossRef]
  22. Rillig, M.C.; Ziersch, L.; Hempel, S. Microplastic transport in soil by earthworms. Sci. Rep. 2017, 7, 1362. [Google Scholar] [CrossRef]
  23. Yu, M.; van der Ploeg, M.; Lwanga, E.H.; Yang, X.; Zhang, S.; Ma, X.; Ritsema, C.J.; Geissen, V. Leaching of microplastics by preferential flow in earthworm (Lumbricus terrestris) burrows. Environ. Chem. 2019, 16, 31. [Google Scholar] [CrossRef]
  24. Rillig, M.C.; Ingraffia, R.; Souza Machado, A.A.de. Microplastic Incorporation into Soil in Agroecosystems. Front. Plant Sci. 2017, 8, 1805. [Google Scholar] [CrossRef] [Green Version]
  25. Rillig, M.C.; Lehmann, A.; Souza Machado, A.A.de.; Yang, G. Microplastic effects on plants. New Phytol. 2019, 223, 1066–1070. [Google Scholar] [CrossRef] [PubMed] [Green Version]
  26. Xu, B.; Liu, F.; Cryder, Z.; Huang, D.; Lu, Z.; He, Y.; Wang, H.; Lu, Z.; Brookes, P.C.; Tang, C.; et al. Microplastics in the soil environment: Occurrence, risks, interactions and fate—A review. Crit. Rev. Environ. Sci. Technol. 2019, 26, 1–48. [Google Scholar] [CrossRef]
  27. He, D.; Luo, Y.; Lu, S.; Liu, M.; Song, Y.; Lei, L. Microplastics in soils: Analytical methods, pollution characteristics and ecological risks. TrAC Trends Anal. Chem. 2018, 109, 163–172. [Google Scholar] [CrossRef]
  28. Hurley, R.R.; Nizzetto, L. Fate and occurrence of micro(nano)plastics in soils: Knowledge gaps and possible risks. Curr. Opin. Environ. Sci. Health 2018, 1, 6–11. [Google Scholar] [CrossRef]
  29. Holmes, L.A.; Turner, A.; Thompson, R.C. Adsorption of trace metals to plastic resin pellets in the marine environment. Environ. Pollut. 2012, 160, 42–48. [Google Scholar] [CrossRef]
  30. Munier, B.; Bendell, L.I. Macro and micro plastics sorb and desorb metals and act as a point source of trace metals to coastal ecosystems. PLoS ONE 2018, 13, e0191759. [Google Scholar] [CrossRef]
  31. Brennecke, D.; Duarte, B.; Paiva, F.; Cacador, I.; Canning-Clode, J. Microplastics as vector for heavy metal contamination from the marine environment. Estuar. Coast. Shelf Sci. 2016, 178, 189–195. [Google Scholar] [CrossRef]
  32. Wang, J.; Peng, J.; Tan, Z.; Gao, Y.; Zhan, Z.; Chen, Q.; Cai, L. Microplastics in the surface sediments from the Beijiang River littoral zone: Composition, abundance, surface textures and interaction with heavy metals. Chemosphere 2017, 171, 248–258. [Google Scholar] [CrossRef]
  33. Imhof, H.K.; Laforsch, C.; Wiesheu, A.C.; Schmid, J.; Anger, P.M.; Niessner, R.; Ivleva, N.P. Pigments and plastic in limnetic ecosystems: A qualitative and quantitative study on microparticles of different size classes. Water Res. 2016, 98, 64–74. [Google Scholar] [CrossRef]
  34. Hahladakis, J.N.; Velis, C.A.; Weber, R.; Iacovidou, E.; Purnell, P. An overview of chemical additives present in plastics: Migration, release, fate and environmental impact during their use, disposal and recycling. J. Hazard. Mater. 2018, 344, 179–199. [Google Scholar] [CrossRef]
  35. Verla, A.W.; Enyoh, C.E.; Verla, E.N.; Nwarnorh, K.O. Microplastic–toxic chemical interaction: A review study on quantified levels, mechanism and implication. SN Appl. Sci. 2019, 1, 339. [Google Scholar] [CrossRef] [Green Version]
  36. Li, R.; Liu, Y.; Sheng, Y.; Xiang, Q.; Zhou, Y.; Cizdziel, J.V. Effect of prothioconazole on the degradation of microplastics derived from mulching plastic film: Apparent change and interaction with heavy metals in soil. Environ. Pollut. 2020, 260, 113988. [Google Scholar] [CrossRef] [PubMed]
  37. Yu, H.; Zhang, Z.; Zhang, Y.; Fan, P.; Xi, B.; Tan, W. Metal type and aggregate microenvironment govern the response sequence of speciation transformation of different heavy metals to microplastics in soil. Sci. Total Environ. 2021, 752, 141956. [Google Scholar] [CrossRef] [PubMed]
  38. Yu, H.; Hou, J.; Dang, Q.; Cui, D.; Xi, B.; Tan, W. Decrease in bioavailability of soil heavy metals caused by the presence of microplastics varies across aggregate levels. J. Hazard. Mater. 2020, 395, 122690. [Google Scholar] [CrossRef] [PubMed]
  39. Blettler, M.C.M.; Ulla, M.A.; Rabuffetti, A.P.; Garello, N. Plastic pollution in freshwater ecosystems: Macro-, meso-, and microplastic debris in a floodplain lake. Environ. Monit. Assess. 2017, 189, 581. [Google Scholar] [CrossRef]
  40. Bridge, J.S. Rivers and Floodplains: Forms, Processes, and Sedimentary Record, 1st ed.; Blackwell: Malden, MA, USA, 2003. [Google Scholar]
  41. Siegfried, M.; Koelmans, A.A.; Besseling, E.; Kroeze, C. Export of microplastics from land to sea. A modelling approach. Water Res. 2017, 127, 249–257. [Google Scholar] [CrossRef]
  42. Lechthaler, S.; Waldschläger, K.; Stauch, G.; Schüttrumpf, H. The Way of Macroplastic through the Environment. Environments 2020, 7, 73. [Google Scholar] [CrossRef]
  43. Liu, H.; Tang, L.; Liu, Y.; Zeng, G.; Lu, Y.; Wang, J.; Yu, J.; Yu, M. Wetland-a hub for microplastic transmission in the global ecosystem. Resour. Conserv. Recycl. 2019, 142, 153–154. [Google Scholar] [CrossRef]
  44. Xiong, X.; Wu, C.; Elser, J.J.; Mei, Z.; Hao, Y. Occurrence and fate of microplastic debris in middle and lower reaches of the Yangtze River—From inland to the sea. Sci. Total Environ. 2018, 659, 66–73. [Google Scholar] [CrossRef]
  45. Weber, C.J.; Opp, C.; Prume, J.A.; Koch, M.; Andersen, T.J.; Chifflard, P. Deposition and in-situ translocation of microplastics in floodplain soils. Sci. Total Environ. 2021, 152039. [Google Scholar] [CrossRef]
  46. Weber, C.J.; Weihrauch, C.; Opp, C.; Chifflard, P. Investigating microplastic dynamics in soils: Orientation for sampling strategies and sample pre-procession. Land Degrad. Devel. 2020, 32, 270–284. [Google Scholar] [CrossRef]
  47. Regional Council Giessen. Hochwasserrisikomanagementplan für das Hessische Einzugsgebiet der Lahn (Flood Risk Management Plan); Regional Council Giessen: Giessen, Germany, 2015. [Google Scholar]
  48. Martin, C.W. Trace metal concentrations along tributary streams of historically mined areas, Lower Lahn and Dill River basins, central Germany. Catena 2019, 174, 174–183. [Google Scholar] [CrossRef]
  49. Martin, C.W. Recent changes in heavy metal contamination at near-channel positions of the Lahn River, central Germany. Geomorphology 2012, 139–140, 452–459. [Google Scholar] [CrossRef]
  50. Martin, C.W. Trace metal storage in recent floodplain sediments along the Dill River, central Germany. Geomorphology 2015, 235, 52–62. [Google Scholar] [CrossRef]
  51. Ad-hoc AG Boden. Bodenkundliche Kartieranleitung, 5th ed.; Schweizerbart: Stuttgart, Germany, 2005; ISBN 3510959205. [Google Scholar]
  52. FAO. Guidelines for Soil Description, 4th ed.; Food and Agriculture Organization of the United Nations: Rome, Italy, 2006. [Google Scholar]
  53. IUSS Working Group. World reference base for soil resources 2014, update 2015. International soil classification system for naming soils and creating legends for soil maps. In World Soil Resources Reports; FAO: Rome, Italy, 2015. [Google Scholar]
  54. Durner, W.; Iden, S.C.; von Unold, G. The integral suspension pressure method (ISP) for precise particle-size analysis by gravitational sedimentation. Water Resour. Res. 2017, 53, 33–48. [Google Scholar] [CrossRef]
  55. Voica, C.; Dehelean, A.; Iordache, A.; Geana, I. Method validation for determination of metals in soils by ICP-MS. Rom. Rep. Phys. 2012, 64, 221–231. [Google Scholar]
  56. Thomas, R. A Beginner’s Guide to ICP-MS. Spectroscopy 2001, 16–17, 22–36. [Google Scholar]
  57. Catrouillet, C.; Davranche, M.; Khatib, I.; Fauny, C.; Wahl, A.; Gigault, J. Metals in microplastics: Determining which are additive, adsorbed, and bioavailable. Environ. Sci. Processes Impacts 2021, 23, 553–558. [Google Scholar] [CrossRef]
  58. Konde, S.; Ornik, J.; Prume, J.A.; Taiber, J.; Koch, M. Exploring the potential of photoluminescence spectroscopy in combination with Nile Red staining for microplastic detection. Mar. Pollut. Bull. 2020, 159, 111475. [Google Scholar] [CrossRef]
  59. Maes, T.; Jessop, R.; Wellner, N.; Haupt, K.; Mayes, A.G. A rapid-screening approach to detect and quantify microplastics based in fluorescent tagging with Nile Red. Sci. Rep. 2017, 7, srep44501. [Google Scholar] [CrossRef] [Green Version]
  60. Kowalska, J.B.; Mazurek, R.; Gąsiorek, M.; Zaleski, T. Pollution indices as useful tools for the comprehensive evaluation of the degree of soil contamination—A review. Environ. Geochem. Health 2018, 40, 2395–2420. [Google Scholar] [CrossRef] [PubMed] [Green Version]
  61. Friedrich, K.; Lügger, K. Hintergrundwerte von Spurenstoffen in Hessischen Böden; Hessian Agency of Nature Conservation, Environment and Geology (HLNUG): Wiesbaden, Germany, 2011. [Google Scholar]
  62. Pejman, A.; Nabi Bidhendi, G.; Ardestani, M.; Saeedi, M.; Baghvand, A. A new index for assessing heavy metals contamination in sediments: A case study. Ecol. Indic. 2015, 58, 365–373. [Google Scholar] [CrossRef]
  63. Long, E.R.; Macdonald, D.D.; Smith, S.L.; Calder, F.D. Incidence of adverse biological effects within ranges of chemical concentrations in marine and estuarine sediments. Environ. Manag. 1995, 19, 81–97. [Google Scholar] [CrossRef]
  64. Hakanson, L. An ecological risk index for aquatic pollution control: A sedimentological approach. Water Res. 1980, 14, 975–1001. [Google Scholar] [CrossRef]
  65. Bund-/Länderarbeitsgemeinschaft Bodenschutz. Hintergrundwerte Für Anorganische und Organische Stoffe in Böden, 3rd ed.; Bund-/Länderarbeitsgemeinschaft Bodenschutz: Magdeburg, Germany, 2003. [Google Scholar]
  66. Bundes-Bodenschutz- und Altlastenverordnung: BbodSchV; Bundesgesetzblatt: Bonn, Germany, 1999; pp. 1554–1582, Teil I (36).
  67. Rittweger, H. The ‘‘Black Floodplain Soil’’ in the Amöneburger Becken, Germany: A lower Holocene marker horizon and indicator of an upper Atlantic to Subboreal dry period in Central Europe? Catena 2000, 41, 143–164. [Google Scholar] [CrossRef]
  68. Corradini, F.; Meza, P.; Eguiluz, R.; Casado, F.; Huerta-Lwanga, E.; Geissen, V. Evidence of microplastic accumulation in agricultural soils from sewage sludge disposal. Sci. Total Environ. 2019, 671, 411–420. [Google Scholar] [CrossRef]
  69. Fryirs, K.A.; Brierley, G.J. Geomorphic Analysis of River Systems: An Approach to Reading the Landscape; Wiley: Chichester, UK; Hoboken, NJ, USA, 2013. [Google Scholar]
  70. Kabata-Pendias, A. Trace Elements in Soils and Plants, 4th ed.; CRC Press: Boca Raton, FL, USA, 2011; ISBN 9781420093681. [Google Scholar]
  71. Manta, D.S.; Angelone, M.; Bellanca, A.; Neri, R.; Sprovieri, M. Heavy metals in urban soils: A case study from the city of Palermo (Sicily), Italy. Sci. Total Environ. 2002, 300, 229–243. [Google Scholar] [CrossRef]
  72. Hahn, J.; Zils, V.; Berresheim, L. Joint recording of contamination status, multi-element dynamics, and source identification on a sub-catchment scale: The example Lahn River (Germany). Sci. Total Environ. 2021, 762, 143110. [Google Scholar] [CrossRef]
  73. Hahn, J.; Opp, C.; Zitzer, N.; Laufenberg, G. Impacts of river impoundment on dissolved heavy metals in floodplain soils of the Lahn River (Germany). Environ. Earth Sci. 2016, 75, 1–13. [Google Scholar] [CrossRef]
  74. Meschede, M.; Warr, L.N. The Geology of Germany: A Process-Oriented Approach; Springer International Publishing: Cham, Switzerland, 2019; ISBN 9783319761039. [Google Scholar]
  75. Zalasiewicz, J.; Waters, C.N.; Ivar do Sul, J.A.; Corcoran, P.L.; Barnosky, A.D.; Cearreta, A.; Edgeworth, M.; Gałuszka, A.; Jeandel, C.; Leinfelder, R.; et al. The geological cycle of plastics and their use as a stratigraphic indicator of the Anthropocene. Anthropocene 2016, 13, 4–17. [Google Scholar] [CrossRef] [Green Version]
  76. Plastics Europe. Plastics-the facts 2018: An analysis of European plastic production, demand and waste data. Plast. Eur. 2018, 52, 9874–9888. [Google Scholar]
  77. Tibbetts, J.; Krause, S.; Lynch, I.; Sambrook Smith, G. Abundance, Distribution, and Drivers of Microplastic Contamination in Urban River Environments. Water 2018, 10, 1597. [Google Scholar] [CrossRef] [Green Version]
  78. Happ, M.; Duffy, J.; Wilson, G.J.; Pask, S.D.; Buding, H.; Ostrowicki, A. Rubber, 8. Synthesis by Polymer Modification. In Ullmann’s Encyclopedia of Industrial Chemistry; Wiley-VCH Verlag GmbH & Co. KGaA: Weinheim, Germany, 2000; ISBN 3527306730. [Google Scholar]
  79. Ragusa, A.; Svelato, A.; Santacroce, C.; Catalano, P.; Notarstefano, V.; Carnevali, O.; Papa, F.; Rongioletti, M.C.A.; Baiocco, F.; Draghi, S.; et al. Plasticenta: First evidence of microplastics in human placenta. Environ. Int. 2021, 146, 106274. [Google Scholar] [CrossRef] [PubMed]
  80. Calmano, W.; Hong, J.; Förstner, U. Binding and mobilization of heavy metals in contaminated sediments affected by pH and redox potential. Water Sci. Technol. 1993, 28, 223–235. [Google Scholar] [CrossRef] [Green Version]
  81. Masson-Delmotte, V. Global Warming of 1.5 °C: An IPCC Special Report on the Impacts of Global Warming of 1.5 °C above Pre-Industrial Levels and Related Global Greenhouse Gas Emission Pathways, in the Context of Strengthening the Global Response to the Threat of Climate Change, Sustainable Development, and Efforts to Eradicate Poverty. Available online: https://www.ipcc.ch/sr15/ (accessed on 13 November 2021).
Figure 1. Web of Science (Clarivate) hits for different search term combinations (microplastic + heavy metal + “term”) (date: 27 November 2021).
Applsci 12 00595 g001
Figure 2. Floodplain soil properties for sampling areas. (a): Organic matter content (%) according to LOI analyses (maximum outliers excluded); (b): pH (-) values with mobilization limit values (1: Cd; 2: Zn, Ni, Co, As; according to Blume et al., 2004); (c): clay content (%).
Applsci 12 00595 g002
Figure 3. Overview of plastic and heavy metal loads in the Lahn catchment. Ptot: total plastic concentrations (p kg−1), calculated as the mean value from all samples of a transect; Ef: enrichment factor; PLI: pollution load index (both calculated as the mean value from all metals analyzed in soil samples of a transect).
Applsci 12 00595 g003
Figure 4. Depth distribution of plastic and heavy metal concentrations in floodplain soils. (a): With mean pollution load indices (Ef and PLI) based on geochemical background values; (b): With mean pollution load indices based on risk assessments (CSI and RI). Color separation according to proximal or distal location in the floodplain. Sizes of the dots depend on the plastic concentration (Ptot) standardized to the maximum content.
Applsci 12 00595 g004
Figure 5. Spearman correlation matrix in first principal component order (n = 110, insignificant values with p < 0.05 excluded). (a): Heavy metals and metalloids; (b): Pollution indices and floodplain soil properties (RI: ecological risk index; PLI: pollution load index; EF: enrichment factor; OM: organic matter content (%); CSI: contamination security index; Ptot: total plastic concentration (p kg−1); C.fSi.mSi: sum of fine soil fraction containing clay as well as fine and middle silt (%); S: sand content (%).
Applsci 12 00595 g005
Figure 6. Heavy metal loads extracted from macroplastic particles (n = 10).
Applsci 12 00595 g006
Table 1. Spearman correlation of total plastic concentration (Ptot) with metals, pollution indices, and soil properties for different soil depths.
RowColumnEntire Soil ProfileUpper Soil
(0–50 cm)
Subsoil
(50–200 cm)
CorpCorpCorp
PtotaV0.180.060.260.04−0.040.79
Cr0.360.000.510.000.040.80
Fe0.160.100.330.01−0.040.78
Co0.240.010.390.00−0.010.93
Ni0.250.010.470.00−0.080.59
Cu0.320.000.470.00−0.110.42
Zn0.370.000.530.00−0.110.46
As0.150.110.250.06−0.140.31
Cd0.390.000.570.00−0.120.39
Pb0.340.000.410.00−0.120.39
Ef b0.350.000.380.00−0.040.78
PLI c0.350.000.480.00−0.060.66
CSI d0.330.000.490.00−0.030.84
RI e0.340.000.430.00−0.100.46
clay−0.010.92−0.090.49−0.070.64
silt0.140.130.170.21−0.020.89
sand−0.100.30−0.090.500.040.79
pH−0.050.63−0.020.910.060.68
OM f0.310.000.360.00−0.010.96
bulk density−0.050.61−0.170.190.130.35
root density0.330.000.300.02−0.030.85
Significant correlations (p ˂ 0.05) in bold text. a Total plastic concentration (p kg−1). b Enrichment factor. c Pollution load index. d Contamination security index. e Ecological risk index. f Organic matter (%).
Publisher’s Note: MDPI stays neutral with regard to jurisdictional claims in published maps and institutional affiliations.

