Article

Propolis as a Potential Novel Histological Tissue Fixative: A Preliminary Analysis

1
Department of Biomedical Dental Sciences, College of Dentistry, Imam Abdulrahman Bin Faisal University, Dammam P.O. Box 1982, Saudi Arabia
2
Dental Intern, College of Dentistry, Imam Abdulrahman Bin Faisal University, Dammam P.O. Box 1982, Saudi Arabia
3
Dental Student, College of Dentistry, Imam Abdulrahman Bin Faisal University, Dammam P.O. Box 1982, Saudi Arabia
*
Author to whom correspondence should be addressed.
Appl. Sci. 2022, 12(19), 9842; https://doi.org/10.3390/app12199842
Submission received: 17 August 2022 / Revised: 27 September 2022 / Accepted: 28 September 2022 / Published: 29 September 2022
(This article belongs to the Special Issue Oral Pathology and Medicine: Diagnosis and Therapy)

Abstract

:
Background: Fixation of biopsy specimens is a critical step before processing and staining them for histological tissue examination. Formalin is considered the gold standard fixative solution for its attributes. However, it has concerning side effects, such as carcinogenic and potential irritational properties. Owing to its various harmful effects, a safer natural substitute should be explored. In this study, we compared the effectiveness of propolis to 10% formalin and determined its ability as a natural fixative solution. Materials and Methods: Sixty tissue specimens were collected from goats’ tongues and immediately placed in (1) 6.6% propolis, (2) 10% natural buffered formalin (positive control), (3) 6.6% propolis followed by 10% formalin, and (4) 0.9% saline (negative control). Tissue samples were fixed at different time points (12, 24, 48, and 72 h) at room temperature, followed by processing and staining. The quality of the microscopic parameters was blindly assessed by two oral and maxillofacial pathologists using a numerical scoring scale. Scores were statistically analyzed. Results: The fixation of tissue samples placed in 6.6% propolis was statistically significantly better than that of samples placed in 10% formalin and 0.9% saline at different time points. Conclusion: Propolis showed promising fixation properties and can be considered a natural alternative to 10% formalin.

1. Introduction

Adequate tissue specimen fixation is an essential step for successful and precise microscopic interpretation. Fixation is defined as a series of chemical processes that preserve tissue from deterioration and prevent it from autolysis (tissue destruction by enzymatic activity) and putrefaction (tissue breakdown by bacterial action) [1,2]. Fixing the tissue before processing and staining is crucial to maintain the cellular morphology and composition as “lifelike” as possible by crosslinking the protein molecules to convert the tissue from a semi-liquid state to a semi-solid state [2,3]. Hardening the tissue specimen prevents its deterioration during preparation, facilitates its manipulation, and allows thin cutting (4–5 μm) before staining [2,3,4].
Tissue fixation can be achieved using physical and chemical methods. The major agents available for tissue fixation include aldehydes, oxidizing agents, alcohol-based agents, and metallic group fixative agents [3]. An example of an aldehyde-based solution is 10% formalin, which consists of 3.7% formaldehyde in water with 1% methanol [5]. It is a fixative agent used worldwide owing to its commercial availability, ease of handling, low cost, and effective tissue preservation ability with minimal cellular disruption [5,6]. However, 10% formalin has some concerning toxic side effects, such as allergic reactions, skin irritation, and eye burning sensation [6,7,8]. Moreover, formaldehyde has potential human carcinogenicity that can cause nasopharyngeal cancer, myeloid leukemia, and brain tumors [9,10]. Therefore, non-toxic natural fixative substitutes should be investigated.
Propolis, also known as “bee glue”, is a natural resinous material produced by bees from substances in plants and flower buds [11,12]. The hue of propolis varies according to the region and the plant it originates from [13]. Its diverse types have a wide melting range of 60–100 °C. It is rigid at low temperatures and pliable at high temperatures [14]. In contrast to solvents such as water and oil, ethanol rapidly dissolves the primary biologically active components of propolis [15]. Propolis primarily consists of resin (50–70%), oil and wax (30–50%), and pollen (5–10%), as well as chemical elements such as phenol; amino acids; minerals; carbohydrates; vitamins B, C, and E; flavonoids; and carbohydrates [16,17]. Propolis has numerous biological and pharmacological properties, such as antimicrobial, anti-inflammatory, immunomodulatory, antitumor, and even anti-ulcer effects [18]. These beneficial properties of propolis are attributed to the scavenging activity of free radicals and superoxide anions by butylated hydroxytoluene [19].
As evident from previous studies, propolis decreases the apoptosis of periodontal ligament cells and can be used as a storage medium for avulsed teeth [20]. However, there is a lack of studies in the available literature regarding the tissue fixation ability of propolis. Therefore, we aimed to assess the fixative properties of propolis, as it is relatively non-toxic and has attractive biological and pharmacological properties, leading us to believe that propolis might be a safer and more effective natural substitute for formalin.

2. Materials and Methods

This is an experimental in vitro study that used biopsy specimens collected from goats’ tongues. The study was approved by Imam Abdulrahman bin Faisal University Institutional Review Board (IRB-2021-02-468).

2.1. Tissue Samples Preparation

The tongues of ten recently slaughtered goats were collected from a local slaughterhouse (Figure 1A). The interval between the time of slaughter and the time of tongue biopsy was consistently between 20 and 30 min. A total of 48 biopsy samples were obtained from the lateral surfaces of the tongues using an 8 mm diameter punch biopsy (Figure 1B,C). Three samples were directly placed in three different 15 mL tubes into the following solutions (Figure 1D): (a) 6.6% propolis extract (Nature’s Answer, Alcohol-Free, 2000 mg/30 mL; Group P), (b) 10% buffered formalin (positive control; Group F), (c) 0.9% normal saline (Pharmaceutical Solutions Industry, 0.9% w/v sodium chloride; negative control; Group S), and (d) 6.6% propolis and then subsequently transferred to 10% formalin for overnight (Group P + F).
According to the manufacture, the liquid contains 2 g of propolis extract. Hence, the concentration of propolis was established according to the following formula (Dixon-Massey formula, 1957): weight (w)/volume (v)% = weight of the solute/volume of solution × 100. (w/v% = 2/30 × 100, which is 6.66%.) Each group was fixed in their solution at room temperature (20–25 °C) for different time points (12, 24, 48, and 72 h). Only Group P + F was subsequently transferred to 10% buffered formalin overnight (Figure 2).

2.2. Preparation of Histological Slides

All tissues were dehydrated by immersing them in a series of alcohol solutions of increasing concentrations. Then, tissues were cleared using a clearing reagent, xylene. Thereafter, the tissues were oriented and embedded into melted paraffin wax at a high temperature to prepare the tissue block. The embedded paraffin tissue blocks were cut into slice sections using a microtome and then stained with hematoxylin and eosin [21,22].

2.3. Histological Assessment

The prepared slides were scanned into a virtual format, and the quality of various histological structures was blindly evaluated by two calibrated oral and maxillofacial pathologists individually (Figure 3). The following microscopic structures were assessed: (1) the superficial 1/3rd of the epithelium, (2) the middle 1/3rd of the epithelium, (3) the lower 1/3rd of the epithelium, (4) basement membrane and rete ridges, (5) fibrous connective tissue, (6) blood vessels and endothelial cells, (7) skeletal muscles, (8) adipose tissue, and (9) nerve bundles.
To standardize the assessment methods and minimize the subjectivity between the two pathologists, a numerical scoring scale was created to evaluate different microscopic structures, and the scores were classified from 1 to 4, as follows: (1) major changes that affect the diagnosis, (2) minor changes that may affect diagnosis, (3) minor changes that do not affect diagnosis, and (4) no apparent change (Table 1).
Figure 4 shows photomicrographs of adipocytes of different biopsy tissue samples placed in various solutions showing different scores according to the numerical scoring scale.

2.4. Statistical Analysis

Kappa statistics were used to determine the variability between the two different examiners. To compare the mean scores from various media, analysis of variance (ANOVA) was performed, followed by Tukey’s multiple post hoc analysis. SPSS Statistics version 27 was used for all statistical analyses.

3. Results

Tissues placed in 6.6% propolis became firmer over time during grossing and sectioning compared with those placed in other solutions. Furthermore, tissues placed either in 6.6% propolis only (Group P) or 6.6% propolis followed by 10% formalin (Group P + F) exhibited a dark brown color compared with those placed in 0.9% saline and 10% formalin (Figure 5).

3.1. Examiners’ Agreement

According to Landis and Koch agreement measures for categorical data, the Kappa statistics in this study revealed substantial agreement (kappa = 0.81) between the two oral pathologists in the scores of tissues placed in propolis (Group P), while the scores in other groups demonstrated a moderate agreement between the examiners [23] (Table 2).

3.2. Comparison between Different Groups at Different Time Points

Group P tissue samples had the highest mean scores at all time points, followed by Group P + F tissue samples.

3.2.1. Twelve Hours

Group P tissue samples demonstrated the highest mean score (mean = 3.74), followed by Group P + F tissue samples (mean = 3.48) (Table 3).
In the between-group analysis, Group P tissue samples demonstrated a statistically significant higher mean score than Group F tissue samples (p = 0.0008). Similarly, Group P + F tissue samples had a statistically significant higher mean score than Group F tissue samples (p = 0.0142) (Table 3).

3.2.2. Twenty-Four Hours

Group P tissue samples demonstrated the highest mean score (mean = 3.89), followed by Group P + F tissue samples (mean = 3.70) (Table 3).
When comparing the mean scores for all solutions, we found that keeping the tissue samples in 6.6% propolis (Group P) for 24 h enhanced the tissue fixation and showed better quality of various microscopic structures than those placed in 10% formalin (Group F) and 0.9% saline (Group S) (p = 0.0086 and p = 0.0129, respectively) (Table 3).

3.2.3. Forty-Eight Hours

Group P tissue samples demonstrated an excellent quality of various microscopic parameters with the highest mean score (mean = 4.00), followed by Group P + F tissue samples (mean = 3.74) (Table 3).
When comparing the mean scores obtained for various solutions, we found that tissues placed in 0.9% saline (Group S) for 48 h demonstrated a substandard quality of various microscopic structures, with a statistically significantly lower mean score than those placed in 6.6% propolis (Group P), 6.6% propolis followed by 10% formalin (Group P + F), and 10% formalin (Group F) (p = 0.0001, p = 0.0004, and p = 0.0006, respectively) (Table 3).

3.2.4. Seventy-Two Hours

Group P tissue samples had the highest mean score (mean = 3.96), followed by Group P + F tissue samples (mean = 3.74) (Table 3).
Group P tissue samples scored statistically significantly higher mean scores than Group S and Group F tissue samples (p = 0.0006 and p = 0.0059, respectively). Similarly, Group P + F tissue samples had a statistically significant higher mean score than Group S tissue samples (p = 0.0096) (Table 3).
Figure 6 provides a graph showing a comparison between groups. Group P tissue samples demonstrated the highest score in the study, followed by Group P + F tissue samples.

3.3. Changes in the Mean Score at Different Points Compared with 12 h

3.3.1. Changes from 12 to 24 h

Between-Group Comparison

When all the mean scores of various solutions were compared from 12 to 24 h, a statistically non-significant improvement in the fixative ability of 10% formalin (Group F), propolis (Group P), and propolis followed by 10% formalin (Group P + F) was observed at 24 h compared with 12 h. In contrast, Group S tissue samples showed a statistically non-significant decrease in the mean score (Table 4).

Within-Group Comparison

Storing the tissue samples for more than 12 h in 10% formalin (Group F) and propolis followed by 10% formalin (Group P + F) showed statistically significant improvements in tissue fixation compared with tissues fixed only for 12 h (0.0212 and 0.0222, respectively) (Table 5).

3.3.2. Changes from 12 to 48 h

Between-Group Comparison

When various solutions were compared, 6.6% propolis (Group P) and 6.6% propolis followed by 10% formalin (Group P + S) showed statistically significant improvements in tissue fixation compared with 10% formalin (Group F) (p = 0.0014, both groups). Similarly, Group F tissue samples showed a statistically significant improvement in fixation ability compared with Group S tissue samples (p = 0.0001) (Table 4).

Within-Group Comparison

Keeping the tissue samples in 6.6% propolis (Group P), 10% formalin (Group F), and propolis followed by 10% formalin (Group P + F) for 48 h showed persistent improvement in their fixation ability compared with keeping them for 12 h (p = 0.0007, p = 0.0003, and p = 0.0232) (Table 5).

3.3.3. Changes from 12 to 72 h

Between-Group Comparison

Almost all groups showed improvement in the mean score of various microscopic parameters at 72 h compared with 12 h, except Group S. However, this improvement decreased when compared to the mean score at 24 and 48 h. A statistically significant improvement in tissue fixation was observed in Group F tissue samples compared with Group S tissue samples (p = 0.0152) (Table 4).

Within-Group Comparison

A statistically significant improvement in the mean scores of various microscopic parameters was observed in Group F, Group P, and Group P + F compared with 12 h (p = 0.0017, p = 0.0039, and p = 0.0081, respectively) (Table 5).
Figure 7 provides a graph showing that most tissue samples in various solutions scored a maximum at around 48 h, except Group S tissue samples, which had a top score at 24 h.

3.4. Comparison of Fixation Ability of Different Solutions throughout Various Microscopic Structures

There was no significant difference in the mean score of almost all the microscopic structures individually. However, tissue samples placed in 6.6% propolis (Group P) showed better quality in superficial one-third of the epithelial lining with a significantly higher mean score compared to tissue placed in 0.9% saline (p = 0.03) (Table 6a–c).
At the microscopic level, tissues placed in 0.9% saline showed significant cellular swelling (cytoplasmic vacuolization), shrinkage of the nucleus (pyknotic), indistinct cell borders, and poor staining quality. These features may indicate tissue autolysis (Figure 8A). On the other hand, other fixative agents could fix tissue samples over different time points (Figure 8B–D). Most of the tissue samples placed in 6.6% propolis showed better staining quality, cellular outline, and nuclear and cytoplasmic details than those in 10% formalin. However, homogenization of connective tissue was observed in some tissue samples placed in 6.6% propolis for 48 h. The tissue sections of Group P + F had adequate overall morphology and nuclear, cytoplasmic details, and staining quality. Hence, all solutions, except 0.9% saline, were able to fix the tissue throughout different time points, with 6.6% propolis giving the best results.

4. Discussion

Formalin (10%) is the leading tissue fixative agent worldwide for histology and research laboratories. However, owing to the serious and harmful side effects of formaldehyde-based solutions such as 10% formalin, other superior and safer alternative natural fixative agents should be explored and researched.
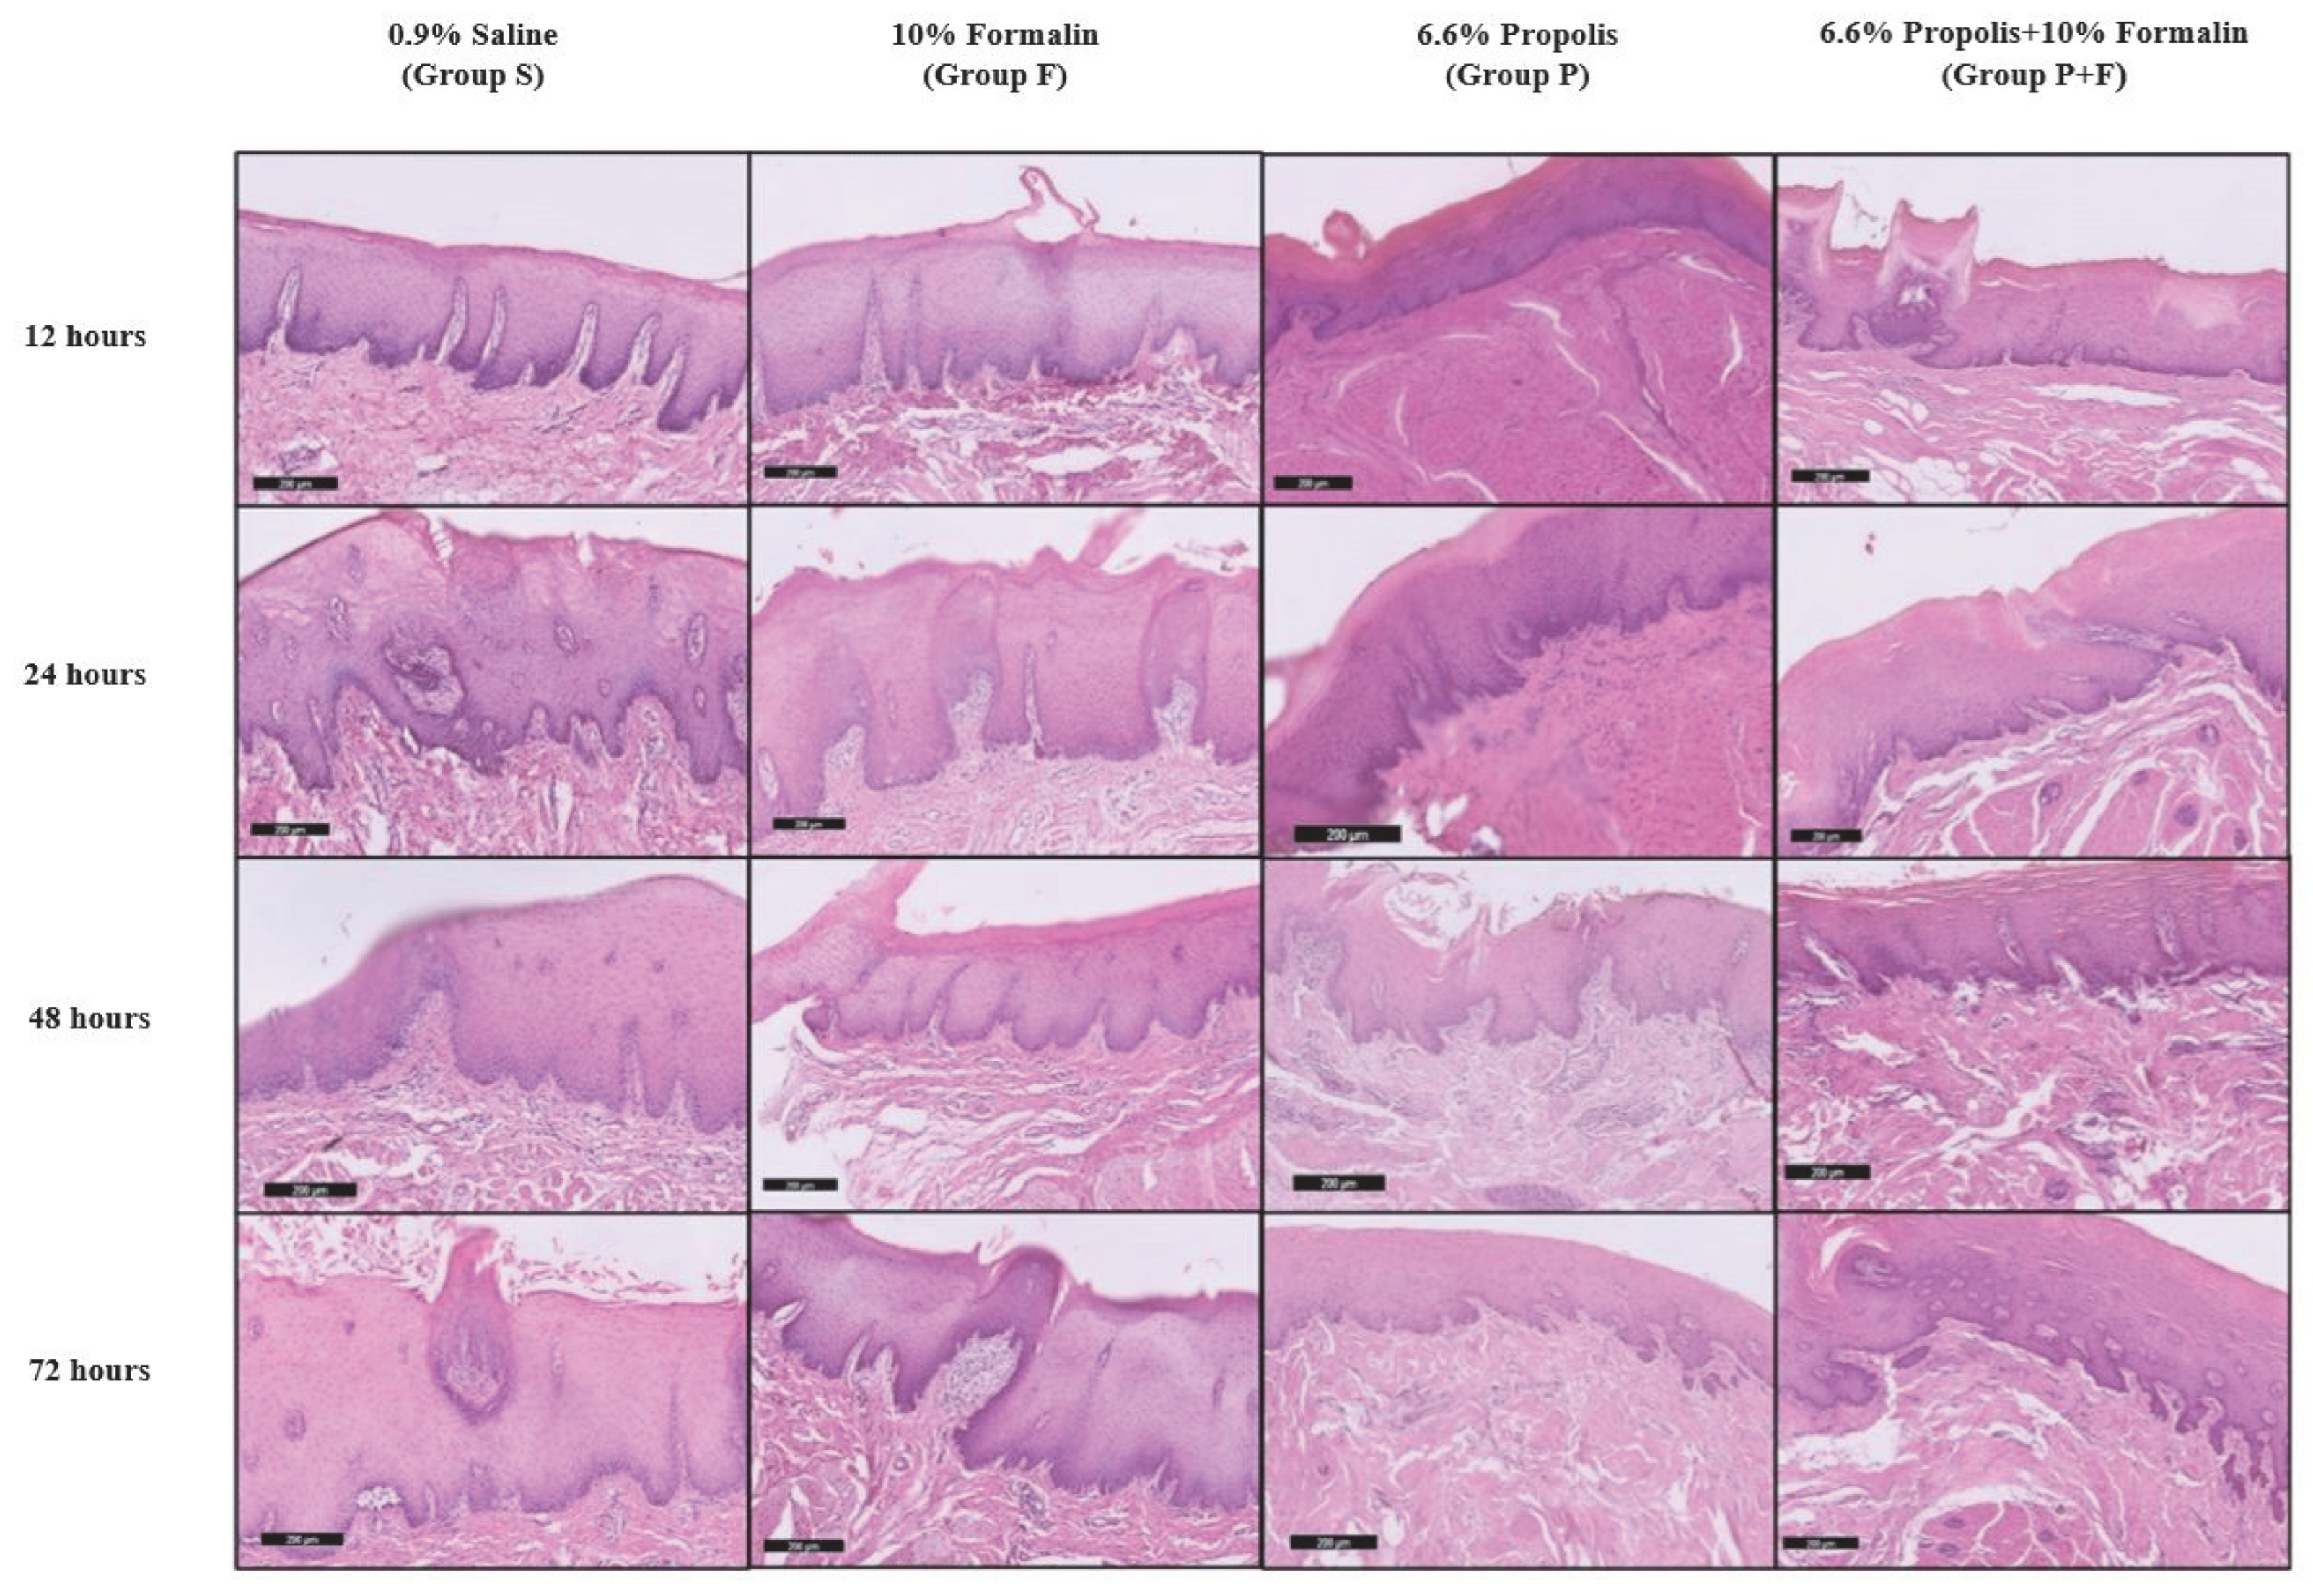
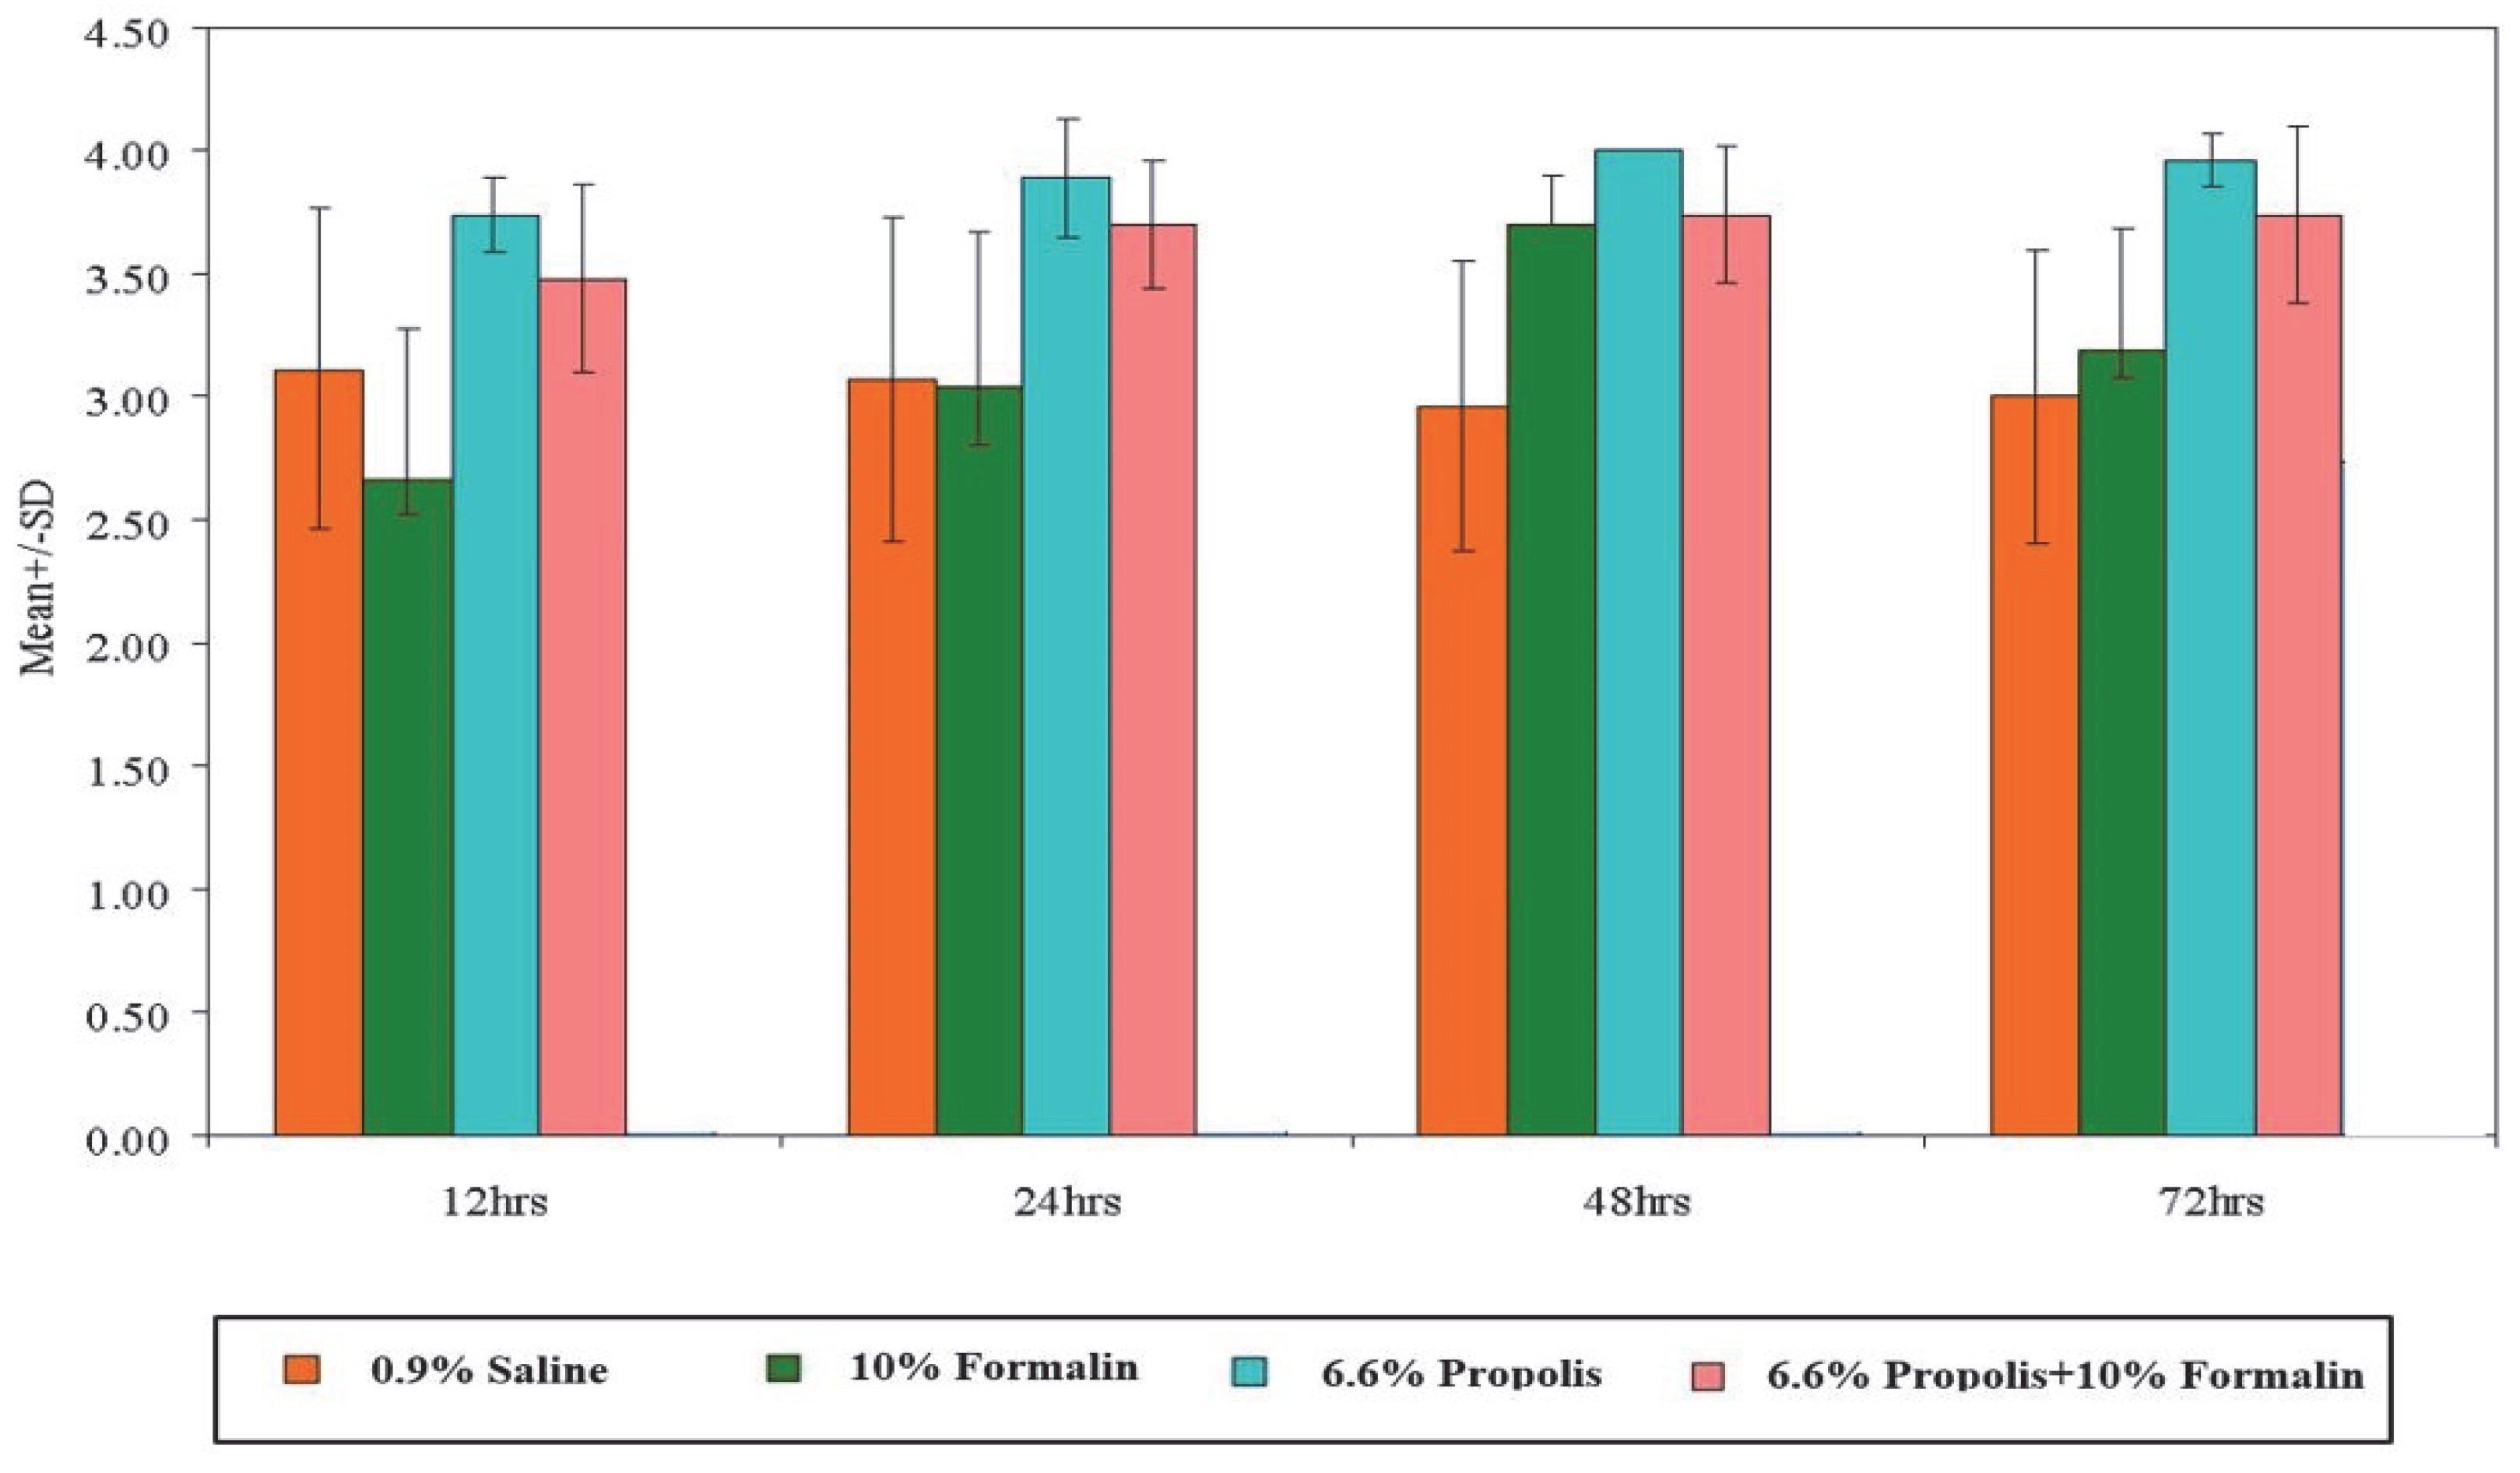
In this study, propolis displayed promising results in terms of tissue fixation at all time points. Propolis composition may play a role in its effectiveness as tissue fixative and its superiority over 10% formalin. Propolis is composed mainly of a mixture of resin (40–50%), wax (25–30%), essential oils (10%), pollen (5%), and organic compounds such as steroids, amino acids, and polyphenols [24]. The stickiness of propolis may protect tissue samples from the invasion of various pathogens (putrefaction) and reinforce cellular structure integrity [24]. Furthermore, the presence of a mixture of resin and wax in the propolis composition could contribute to the crosslinking of tissue molecular proteins, which accelerates and enhances its fixation ability. Organic compounds, by their scavenging action, prevent tissue putrefaction and autolysis due to their antimicrobial and antioxidant effects, and this may also improve propolis fixation properties [19]. This could explain why the tissue samples that were placed in propolis were firmer during grossing and fixed faster at 12 h and improved over time when compared to 10% formalin, where its fixation capacity improved after 24 h.
To the best of our knowledge, no study in the current literature has been conducted to investigate the fixative properties of propolis. However, several other investigations have been conducted to find alternative natural solutions to be used as substitutes for formalin. For example, honey has demonstrated promising fixative properties [25]. Sugar syrup and jaggery have also shown encouraging results as alternative natural fixative agents [8].
Patil et al. conducted an experimental in vitro study on five commercially available fresh goat meats (buccal mucosa) that were placed in 20% buffered formalin, distilled water, 20% honey, 20% sugar syrup, and 30% jaggery syrup. After storing the tissues for 24 h, they reported that honey, sugar, and jaggery syrup fixation ability were similar to each other and closer to formalin, with jaggery syrup showing the best results [26]. These results are consistent with the findings from our study where honey, sugar, and jaggary syrup can be used as alternative natural fixative agents. However, our study showed that propolis had superior fixation ability compared to 10% formalin after 24 h. The same research group conducted another study to evaluate the fixation properties of 20% honey and 30% jaggery syrup over 6 months and concluded that jaggery and honey demonstrated satisfactory results after 6 months, and jaggery was comparable to formalin in tissue fixation [27]. Al-Maaini et al. investigated the effectiveness of honey as a natural substitute for formalin by fixing kidney tissue and rat liver in honey and formalin for 24 h; they found that tissues fixed in low honey concentrations (10% and 20%) had comparable results to formalin-fixed control tissues, and increased concentrations of honey produced slower penetration rates and increased tissue hardening, making them difficult to section [28]. A similar study was conducted by Lalwani et al., who tested the fixation and preservation efficacy of 10% processed and unprocessed honey for 24 h compared to 10% formalin. All groups had an adequate fixation for diagnosis, as there were no statistically significant differences in the scores between the groups. However, they found that the presence of staining artifacts was higher in the honey groups. In concordance with our study’s finding of propolis fixation ability, they concluded that both processed and unprocessed honey could be safe alternatives to formalin [29].
Kuriachan et al. evaluated the fixative properties of 20% honey, 20% jaggery, and 20% sugar compared to 10% formalin. Human gingival tissues were placed in these solutions for 24 h. Honey and jaggery gave better results than formalin, which aligns with our results as propolis was superior to 10% formalin. However, contrary to our results, sugar showed inferior fixation ability compared to 10% formalin [30].
Interestingly, propolis showed excellent preservation and fixation properties at 12 and 24 h compared with formalin. Furthermore, subsequent transfer of the tissue samples placed in propolis to formalin showed better fixation ability than formalin alone at all time points. These observations suggest that propolis could be an emergency fixative solution, especially in the absence of formalin. In addition, Kasetty et al. found that local anesthesia showed comparable morphological features as tissues fixed using formalin and can be utilized as an emergency fixative solution [22].
Our research is the first study using propolis for tissue fixation, with no existing studies in the literature on the use of propolis as a natural formalin substitute. Propolis is non-toxic, non-carcinogenic, readily available, and can be a natural substitute for formalin. Moreover, it can also be naturally extracted using various extraction techniques. Our results showed that propolis is effective in tissue fixation and can be used as a safe substitute for formalin.

4.1. Study Limitations

The evaluators’ subjectivity in scoring different microscopic parameters in this study limited their ability to obtain accurate and highly standardized information. The scale used to score the slides should be more objective. Wide varieties of propolis with varied content could result in an unpredictable outcome while being used in this type of study. Thus, this study requires complete chemical analysis of the propolis extract used. Raw propolis is a non-homogenous resinous mass that cannot be directly used [31]. It needs to undergo solvent extraction for purification, which can be technique-sensitive [17]. Moreover, developing a standardized concentration of propolis is challenging because no research has previously examined its usage as a fixative agent. This study warrants further investigation to assess the application of propolis in histopathology.

4.2. Conclusions

Based on the results of this investigation, we conclude that propolis may be a promising natural fixative that could be useful in histopathology. Moreover, propolis can be used as an interim medium to preserve tissue biopsies before formalin fixation, as our study showed that propolis enhances the quality of formalin tissue preservation and fixation.

Author Contributions

Conceptualization, A.S.B. and H.A.A.; formal analysis, A.S.B., A.M.K. and H.A.A.; writing—original draft preparation, A.S.B., H.A.A., R.R.A., R.A.A., S.A.K. and N.M.A.; writing—review and editing, A.S.B., H.A.A., R.R.A., R.A.A., A.M.K., S.A.K. and N.M.A.; supervision, A.S.B. and H.A.A.; data curation, A.S.B., H.A.A., R.R.A., R.A.A., S.A.K., M.H.A. and N.M.A. All authors have read and agreed to the published version of the manuscript.

Funding

This research received no external funding.

Institutional Review Board Statement

The study was approved by Imam Abdulrahman Bin Faisal University Institutional Review Board (IRB-2021-02-468).

Informed Consent Statement

Not applicable.

Data Availability Statement

Raw data of this study are available from the corresponding author upon request.

Conflicts of Interest

The authors declare no conflict of interest.

References

  1. Bancroft, J.D.; Gamble, M. Theory and Practice of Histological Techniques; Churchill Livingstone: Edinburgh, UK, 1996; p. 766. [Google Scholar]
  2. Bhat, A.H.; Hussein, S. Fixation and different types of fixatives: Their role and functions: A review. Int. J. Clin. Diagn. Pathol. 2021, 4, 113–119. [Google Scholar] [CrossRef]
  3. Thavarajah, R.; Mudimbaimannar, V.K.; Elizabeth, J.; Rao, U.K.; Ranganathan, K. Chemical and physical basics of routine formaldehyde fixation. J. Oral. Maxillofac. Pathol. 2012, 16, 400–405. [Google Scholar] [CrossRef] [PubMed]
  4. Grizzle, W.E. Special symposium: Fixation and tissue processing models. Biotechnol. Histochem. 2009, 84, 185–193. [Google Scholar] [CrossRef] [PubMed]
  5. Fox, C.H.; Johnson, F.B.; Whiting, J.; Roller, P.P. Formaldehyde fixation. J. Histochem. Cytochem. 1985, 33, 845–853. [Google Scholar] [CrossRef] [PubMed]
  6. Swenberg, J.A.; Moeller, B.C.; Lu, K.; Rager, J.E.; Fry, R.C.; Starr, T.B. Formaldehyde carcinogenicity research: 30 years and counting for mode of action, epidemiology, and cancer risk assessment. Toxicol. Pathol. 2013, 41, 181–189. [Google Scholar] [CrossRef]
  7. Piatek-Koziej, K.; Holda, J.; Koziej, M.; Tyrak, K.; Jasinska, K.A.; Bonczar, A.; Walocha, J.A.; Holda, M.K. Fixative properties of honey solutions as a formaldehyde substitute in cardiac tissue preservation. Folia Med. Cracov. 2019, 59, 101–114. [Google Scholar]
  8. Ramamoorthy, A.; Ravi, S.; Jeddy, N.; Thangavelu, R.; Janardhanan, S. Natural Alternatives for Chemicals Used in Histopathology Lab- A Literature Review. J. Clin. Diagn. Res. 2016, 10, EE01–EE04. [Google Scholar] [CrossRef]
  9. Swenberg, J.A.; Kerns, W.D.; Mitchell, R.I.; Gralla, E.J.; Pavkov, K.L. Induction of squamous cell carcinomas of the rat nasal cavity by inhalation exposure to formaldehyde vapor. Cancer Res. 1980, 40, 3398–3402. [Google Scholar]
  10. Hauptmann, M.; Stewart, P.A.; Lubin, J.H.; Beane Freeman, L.E.; Hornung, R.W.; Herrick, R.F.; Hoover, R.N.; Fraumeni, J.F., Jr.; Blair, A.; Hayes, R.B. Mortality from lymphohematopoietic malignancies and brain cancer among embalmers exposed to formaldehyde. J. Natl. Cancer Inst. 2009, 101, 1696–1708. [Google Scholar] [CrossRef]
  11. Kolayli, S.; Palabiyik, I.; Atik, D.; Keskin, M.; Bozdeveci, A.; Karaoglu, S. Comparison of Antibacterial and Antifungal Effects of Different Varieties of Honey and Propolis Samples. Acta Aliment. 2020, 49, 8. [Google Scholar] [CrossRef]
  12. Castaldo, S.; Capasso, F. Propolis, an old remedy used in modern medicine. Fitoterapia 2002, 73 (Suppl. S1), S1–S6. [Google Scholar] [CrossRef]
  13. Ahmed, R.; Tanvir, E.M.; Hossen, S.; Afroz, R.; Ahmmed, I.; Rumpa, N.-E.; Paul, S.; Gan, S.H.; Sulaiman, S.A.; Khalil, I. Antioxidant Properties and Cardioprotective Mechanism of Malaysian Propolis in Rats. Evid.-Based Complement. Altern. Med. 2017, 2017, 5370545. [Google Scholar] [CrossRef] [Green Version]
  14. Martinotti, S.; Ranzato, E. Propolis: A new frontier for wound healing? Burn. Trauma 2015, 3, 9. [Google Scholar] [CrossRef] [PubMed]
  15. Kubiliene, L.; Laugaliene, V.; Pavilonis, A.; Maruska, A.; Majiene, D.; Barcauskaite, K.; Kubilius, R.; Kasparaviciene, G.; Savickas, A. Alternative preparation of propolis extracts: Comparison of their composition and biological activities. BMC Complement. Altern. Med. 2015, 15, 156. [Google Scholar] [CrossRef] [PubMed]
  16. Bankova, V.S.; De Castro, S.L.; Marcucci, M.C. Propolis: Recent advances in chemistry and plant origin. Apidologie 2000, 31, 3–15. [Google Scholar] [CrossRef]
  17. Ahangari, Z.; Naseri, M.; Vatandoost, F. Propolis: Chemical Composition and Its Applications in Endodontics. Iran. Endod. J. 2018, 13, 285–292. [Google Scholar] [CrossRef] [PubMed]
  18. Farooqui, T. Beneficial effects of propolis on human health and neurological diseases. Front. Biosci. 2012, 4, 779–793. [Google Scholar] [CrossRef]
  19. Mavri, A.; Abramovič, H.; Polak, T.; Bertoncelj, J.; Jamnik, P.; Možina, S.S.; Jeršek, B. Chemical Properties and Antioxidant and Antimicrobial Activities of Slovenian Propolis. Chem. Biodivers. 2012, 9, 1545–1558. [Google Scholar] [CrossRef]
  20. Gjertsen, A.W.; Stothz, K.A.; Neiva, K.G.; Pileggi, R. Effect of propolis on proliferation and apoptosis of periodontal ligament fibroblasts. Oral Surg. Oral Med. Oral Pathol. Oral Radiol. Endodontol. 2011, 112, 843–848. [Google Scholar] [CrossRef]
  21. Godkar, P.B.; Godkar, P.D. Textbook of Medical Laboratory Technology, 2nd ed.; Bhalani Publication House: Mumbai, India, 1996. [Google Scholar]
  22. Kasetty, S.; Dwivedi, D.; Ragavendra, T.R.; Kallianpur, S.; Gupta, S.; Prabhakar, N. Comparison of efficacy of local anesthetic solution, distilled water and normal saline as emergency fixatives. J. Oral Maxillofac. Pathol. 2018, 22, 283. [Google Scholar] [CrossRef]
  23. Landis, J.R.; Koch, G.G. The measurement of observer agreement for categorical data. Biometrics 1977, 33, 159–174. [Google Scholar] [CrossRef] [PubMed]
  24. Easton-Calabria, A.; Demary, K.C.; Oner, N.J. Beyond Pollination: Honey Bees (Apis mellifera) as Zootherapy Keystone Species. Front. Ecol. Evol. 2019, 6, 161. [Google Scholar] [CrossRef] [Green Version]
  25. Sabarinath, B.; Sivapathasundharam, B.; Sathyakumar, M. Fixative properties of honey in comparison with formalin. J. Histotechnol. 2014, 37, 5. [Google Scholar] [CrossRef]
  26. Patil, S.; Premalatha, B.; Rao, R.S.; Ganavi, B. Revelation in the field of tissue preservation—A preliminary study on natural formalin substitutes. J. Int. Oral Health 2013, 5, 31–38. [Google Scholar] [PubMed]
  27. Patil, S.; Rao, R.S.; Ganavi, B.S.; Majumdar, B. Natural sweeteners as fixatives in histopathology: A longitudinal study. J. Nat. Sci. Biol. Med. 2015, 6, 67–70. [Google Scholar] [CrossRef]
  28. Al-Maaini, R.; Bryant, P. The Effectiveness of Honey as a Substitute for Formalin in the Histological Fixation of Tissue. J. Histotechnol. 2013, 29, 173–176. [Google Scholar] [CrossRef]
  29. Lalwani, V.; Surekha, R.; Vanishree, M.; Koneru, A.; Hunasgi, S.; Ravikumar, S. Honey as an alternative fixative for oral tissue: An evaluation of processed and unprocessed honey. J. Oral. Maxillofac. Pathol. 2015, 19, 342–347. [Google Scholar] [CrossRef]
  30. Kuriachan, D.; Suresh, R.; Janardhanan, M.; Savithri, V.; Aravind, T.; Thampy, L. Analysis of Fixative Properties of Three Eco-friendly Substances: A Comparison with Formalin. Oral Maxillofac. Pathol. J. 2017, 8, 79–84. [Google Scholar]
  31. Bachevski, D.; Damevska, K.; Simeonovski, V.; Dimova, M. Back to the basics: Propolis and COVID-19. Dermatol. Ther. 2020, 33, 3–5. [Google Scholar] [CrossRef]
Figure 1. Preparation of tissue samples. (A) Goat tongue. (B,C) Punch biopsy. (D) Samples placed directly in a 15 mL tube containing the fixative solution.
Applsci 12 09842 g001
Figure 2. Flowchart of the specimen preparation.
Applsci 12 09842 g002
Figure 3. Photomicrographs of a hematoxylin–eosin-stained section of tissues fixed in different media at different time points (5×).
Applsci 12 09842 g003
Figure 4. Photomicrographs of a hematoxylin–eosin-stained section of adipose tissue showing the scoring system. (A) Score 1: loss of cell wall integrity in most of the adipocytes. (B) Score 2: shredded cell wall with minimal preservation of the cell wall of some adipocytes. (C) Score 3: fair preservation of the cell wall of adipocytes. (D) Score 4: normal preservation of adipocytes (20×).
Applsci 12 09842 g004
Figure 5. Paraffin wax-embedded blocks showing dark brown discoloration in tissues placed in 6.6% propolis compared with those placed in other solutions.
Applsci 12 09842 g005
Figure 6. A graph showing between-group comparisons at different time points.
Applsci 12 09842 g006
Figure 7. A graph showing within-group comparison at different time points.
Applsci 12 09842 g007
Figure 8. Photomicrographs of a hematoxylin–eosin-stained section of lower 1/3rd of epithelium at 48 h (40×): (A) 0.9% saline; (B) 10% formalin; (C) 6.6% propolis; (D) 6.6% propolis followed by 10% formalin.
Applsci 12 09842 g008
Table 1. Numerical scale for microscopic tissue structures assessment.
ScoreHistological Criteria
4No apparent change
3Minor changes that do not affect the diagnosis
2Minor changes that may affect the diagnosis
1Major changes that affect the diagnosis
Table 2. Kappa statistics for inter-oral pathologists’ agreement.
Fixative AgentsAgreementKappaStrength of Agreement
0.9% Saline83.33%0.47Moderate
10% Formalin77.78%0.55Moderate
6.6% Propolis88.89%0.61Substantial
6.6% Propolis + 10% Formalin77.78%0.57Moderate
Table 3. Comparison of the fixative ability of different solutions at different treatment times.
Solution12 h24 h48 h72 h
MeanSD §MeanSDMeanSDMeanSD
0.9% Saline3.110.653.070.662.960.593.000.60
10% Formalin2.670.603.040.633.700.203.190.50
6.6% Propolis3.740.153.890.244.000.003.960.11
6.6% Propolis + 10% Formalin3.480.383.700.263.740.283.740.36
Pairwise comparisons by Tukey’s multiple post hoc procedures
6.6% Saline vs. 10% Formalinp = 0.3702p = 0.9999p = 0.0006 *p = 0.9037
0.9% Saline vs. 6.6% Propolisp = 0.0905p = 0.0129 *p = 0.0001 *p = 0.0006 *
0.9% Saline vs. 6.6% Propolis + 10% Formalinp = 0.5518p = 0.0852p = 0.0004 *p = 0.0096 *
10% Formalin vs. 6.6% Propolisp = 0.0008 *p = 0.0086 *p = 0.3814p = 0.0059 *
10% Formalin vs. 6.6% Propolis + 10% Formalinp = 0.0142 *p = 0.0602p = 0.9994p = 0.0837
6.6% Propolis vs. 6.6% Propolis + 10% Formalinp = 0.8213p = 0.9374p = 0.5153p = 0.8293
* Indicates statistical significance. § SD: Standard deviation.
Table 4. Comparison of fixative ability of different solutions with change in scores from 12 h to 24, 48, and 72 h treatment times.
SolutionChanges from 12 h to
24 h48 h72 h
MeanSD §MeanSDMeanSD
0.9% Saline0.040.450.150.380.110.53
10% Formalin−0.370.39−1.040.51−0.520.34
6.6% Propolis−0.150.24−0.260.15−0.220.17
6.6% Propolis + 10% Formalin−0.220.24−0.260.28−0.260.22
Pairwise comparisons by Tukey’s multiple post hoc procedures
0.9% Saline vs. 10% Formalinp = 0.1569p = 0.0001 *p = 0.0152 *
0.9% Saline vs. 6.6% Propolisp = 0.8262p = 0.2024p = 0.4077
0.9% Saline vs. 6.6%Propolis + 10% Formalinp = 0.5797p = 0.2024p = 0.3033
10% Formalin vs. 6.6% Propolisp = 0.7104p = 0.0014 *p = 0.5254
10% Formalin vs. 6.6% Propolis + 10% Formalinp = 0.9142p = 0.0014 *p = 0.6482
6.6% Propolis vs. 6.6% Propolis + 10%Formalinp = 0.9931p = 1.0000p = 0.9997
* Indicates statistical significance. § SD: Standard deviation.
Table 5. Within-group comparisons at different time points for each solution by ANOVA.
SolutionChange (time)Mean Diff.SD Diff. †Changes (%)p-Value
0.9% Saline12 to 24 h0.040.451.190.8131
12 to 48 h0.150.384.760.2721
12 to 72 h0.110.533.570.5447
10% Formalin12 to 24 h−0.370.39−13.890.0212 *
12 to 48 h−1.040.51−38.890.0003 *
12 to 72 h−0.520.34−19.440.0017 *
6.6% Propolis12 to 24 h−0.150.24−3.960.1038
12 to 48 h−0.260.15−6.930.0007 *
12 to 72 h−0.220.17−5.940.0039 *
6.6% Propolis + 10% Formalin12 to 24 h−0.220.24−6.380.0222 *
12 to 48 h−0.260.28−7.450.0232 *
12 to 72 h−0.260.22−7.450.0081 *
* Indicates statistical significance. Mean Diff.: Difference between mean scores of a solution at 2 different time points. † SD Diff.: Difference between standard deviations of a solution at 2 different time points.
Table 6. (a) Comparison of fixative ability of different solutions in different microscopic structures (epithelium). (b) Comparison of fixative ability of different solutions in different microscopic structures (basement membrane, nerve bundles, and fibrous tissue). (c) Comparison of fixative ability of different solutions in different microscopic structures (blood vessels, skeletal muscles, and adipose tissue).
(a)
SolutionEpithelium
Superficial 1/3rdMiddle 1/3rdLower 1/3rd
MeanSD §MeanSDMeanSD
0.9% Saline2.580.442.830.303.420.10
10% Formalin3.120.393.210.293.410.22
6.6% Propolis3.370.163.210.213.410.22
6.6% Propolis + 10% Formalin3.160.363.210.163.500.36
Pairwise comparisons by Tukey’s multiple post hoc procedures
0.9% Saline vs. 10% Formalinp = 0.2342p = 0.4502p = 1.0000
0.9% Saline vs. 6.6% Propolisp = 0.0388 *p = 0.4502p = 1.0000
0.9% Saline vs. 6.6% Propolis + 10% Formalinp = 0.1779p = 0.4502p = 0.9859
10% Formalin vs. 6.6% Propolisp = 0.8374p = 1.0000p = 1.0000
10% Formalin vs. 6.6% Propolis + 10% Formalinp = 0.9998p = 1.0000p = 0.9842
10% Propolis vs. 6.6% Propolis + 10% Formalinp = 0.9080p = 1.0000p = 0.9842
(b)
SolutionBasement MembraneNerve BundlesFibrous Tissue
MeanSDMeanSDMeanSD
0.9% Saline3.620.163.660.132.830.20
10% Formalin3.700.093.660.242.920.59
6.6% Propolis3.580.213.710.293.250.10
6.6% Propolis + 10% Formalin3.870.093.540.213.160.24
0.9% Saline + 10% Formalin3.540.443.460.442.790.48
Pairwise comparisons by Tukey’s multiple post hoc procedures
0.9% Saline vs. 10% Formalinp = 0.9883p = 1.0000p = 0.9973
0.9% Saline vs. 6.6% Propolisp = 0.9990p = 0.9995p = 0.5225
0.9% Saline vs. 6.6% Propolis + 10% Formalinp = 0.5814p = 0.9697p = 0.7081
10% Formalin vs. 6.6% Propolisp = 0.9456p = 0.9995p = 0.7136
10% Formalin vs. 6.6% Propolis + 10% Formalinp = 0.8442p = 0.9697p = 0.8724
6.6% Propolis vs. 6.6% Propolis + 10% Formalinp = 0.4367p = 0.9157p = 0.9976
(c)
SolutionBlood VesselsSkeletal MusclesAdipose Tissue
MeanSDMeanSDMeanSD
0.9% Saline3.710.293.040.293.290.25
10% Formalin3.790.162.750.403.290.34
6.6% Propolis3.870.093.160.243.080.35
6.6% Propolis + 10% Formalin3.660.132.960.212.870.16
0.9% Saline + 10% Formalin3.500.192.710.372.580.57
Pairwise comparisons by Tukey’s multiple post hoc procedures
0.9% Saline vs. 10% Formalinp = 0.9673p = 0.6760p = 1.0000
0.9% Saline vs. 6.6% Propolisp = 0.7040p = 0.9769p = 0.9195
0.9% Saline vs. 6.6% Propolis + 10% Formalinp = 0.9973p = 0.9952p = 0.4988
10% Formalin vs. 6.6% Propolisp = 0.9636p = 0.3547p = 0.9226
10% Formalin vs. 6.6% Propolis + 10% Formalinp = 0.8691p = 0.8711p = 0.5044
6.6% Propolis vs. 6.6% Propolis + 10% Formalinp = 0.5132p = 0.8711p = 0.9226
* Indicates statistical significance. § SD: Standard deviation.
Publisher’s Note: MDPI stays neutral with regard to jurisdictional claims in published maps and institutional affiliations.

