Article

Experimental Study on Failure Mechanism and Mode of Fly-Ash Dam Slope Triggered by Rainfall Infiltration

1
School of Civil Engineering, Shijiazhuang Tiedao University, Shijiazhuang 050043, China
2
Key Laboratory of Roads and Railway Engineering Safety Control of Ministry of Education, Shijiazhuang Tiedao University, Shijiazhuang 050043, China
*
Author to whom correspondence should be addressed.
Appl. Sci. 2022, 12(19), 9404; https://doi.org/10.3390/app12199404
Submission received: 3 September 2022 / Revised: 18 September 2022 / Accepted: 19 September 2022 / Published: 20 September 2022
(This article belongs to the Special Issue Slope Stability and Earth Retaining Structures)

Abstract

:
The fly-ash dam is used to store the fly ash discharged from the thermal power plant. A fly-ash dam is a special slope built with fly ash, and rainfall infiltration is an important reason to induce the landslide of this kind of slope. In this paper, the laboratory tests of different slope ratios and initial seepage fields under rainfall were carried out, aimed at studying the failure mechanism, failure mode, triggering mechanism, and influence factors for the slope instability of the fly ash dam slope under rainfall infiltration. The results show that: (I) Three failure mechanisms were found in the tests: sliding failure, runoff erosion, and flow-slide failure. Due to the low density of fly ash, runoff erosion is more likely to occur under rainfall. Differently from clay slope, flow slide is an important failure mechanism of fly ash slope under rainfall. (II) Local erosion damages caused by runoff erosion and flow slide are the important triggering factors of the fly-ash dam slope failure under rainfall. (III) Three failure modes were observed in the test: the overall sliding failure of the slope, the retrogressive landslide caused by multi-stage local sliding, and the gradual erosion failure of the slope (caused by the combined action of runoff erosion and flow slide). (IV) The slope ratio has an important influence on the failure mode. With the decrease in slope ratio, the failure mode evolves from sliding failure to flow-slide failure and runoff erosion failure. The greater the slope ratio, the more obvious the sliding failure characteristics; the lower the slope rate, the greater the runoff erosion damage. The existence of an internal seepage field in the slope intensifies the occurrence of flow slide.

1. Introduction

Fly-ash dams are used to store fly ash discharged from thermal power plants. There are more than 9000 fly-ash dams in the world [1]. A fly-ash dam is a special kind of slope built with fly ash. In China, the storage form of the fly-ash dam is very similar to that of the tailings dam. The harm from the failure of tailings dams and the relevant research results have important references for the fly-ash dam. Therefore, it is essential to conduct a review of the literature, not only on fly-ash dams but also on tailings dams. Fly-ash dam and tailings dam failure accidents have occurred from time to time in the world [1,2,3,4,5,6]. They have had a significant impact on the surrounding downstream environment [7,8,9,10], and threatened the safety of life and property [6,11]. For instance, the catastrophic accident of the fly-ash dam at the Kingston fossil power plant in Tennessee in 2008, as well as the failure of Brumadinho tailings dam in Minas Gerais in 2019, caused significant casualties and environmental disasters [12]. Kamrul [13] analyzed the impact of dam failure in the past 100 years from a global perspective, and drew conclusions: the number of dam failures is rising again, and the trajectory of dam failures has been transferred from developed countries to developing countries.
Due to of the disastrous consequences of the failure of the tailings dam, research on the failure causes and mechanisms of the tailings dam has been given attention. Nahyan [14] comprehensively analyzed the failure mechanism and inducing factors of the tailings dam through 63 failure cases. Joaquín [15], Alonso [16], and Gens [17,18,19] studied the failure mechanism and causes of the Aznalcóllar tailings dam. Roberto [20] summarized the flow failure conditions of the tailings dam based on 67 Spanish tailings dams, and proposed corresponding preventive measures. Luke Clarkson [21] analyzed the factors leading to the failure of the tailings dam in detail, including foundation failure, internal erosion and piping, overtopping, seepage, seismic activity, and slope instability. Niekerk [22] investigated the causes and consequences of the Merrispruit tailings dam failure, Fourier [23] studied the flood overtopping failure process of the Merrispruit tailings dam, while Chandler [24] explored the failure causes of the Stava Valley tailing dams and considered that the low safety factor of the dam slope was the main reason. Vick [25] introduced the failure causes and protective measures of the tailings dam at Omai in Guyana. Villavicencio [26] and Dobry [27] analyzed the failure mechanism and characteristics of a tailings dam in Chile under earthquake. Harder [28] summarized the damage mechanism, damage characteristics, and impact downstream of the Tapo Canyon tailings dam under earthquake. It is considered that the liquefaction of seismic saturated tailing sand was an important reason for the failure of the tailings dam. Glotov [29] analyzed the reason for the failure of the Karamken tailing dam, and considered that synergic engineering, hydrogeology, and human factors were the critical reasons for the failure of the tailings dam.
Test, theory, and numerical simulation are important methods to solve geotechnical problems [30,31,32,33,34], and they are also applicable to study the failure of tailings dams and fly-ash dams, including numerical simulation, experimental methods, and theoretical methods [35,36,37,38,39,40]. In view of the complexity of the failure mechanism and the variety of instability modes of tailings dams, a laboratory test is still an effective method to study the failure mechanism and failure mode of the tailings dam. Yao [41] adopted the flood overtopping tailings dam failure test to study the impact of the tailings size on the dam break. The influence of particle size on the erosion pattern of the tailings dam’s surface was analyzed. Wu [42] studied the piping process in the tailings dam by model test, and proposed three stages of piping failure in the tailings dam. Sen [43] carried out a physical model test of the dam break based on an iron tailings dam in Sichuan Province of China, and studied the damage process of the dam during flood overtopping. Wu [44] established the physical model test based on the Wadugou tailings dam, analyzed the overtopping-dam-breaking process of the tailings dam under natural conditions and artificial dam protection measures, and studied the impact of different dam surface conditions on the failure of the tailings dam. Zhang [45] studied the failure process of the tailings dam under high water level operation by model experiment and analyzed the failure process of the tailings dam slope.
Quan [46] analyzed the causes and regional distribution patterns of the dam failures of 342 tailings dams in the world from 1915 to 2021 using the statistics method. The results showed that most tailings dam failures in Asia and Europe were closely related to rainfall. Therefore, the research on the failure mode and failure mechanism of the tailings dam under rainfall needs to be paid more attention. Lv [47] carried out the test on rainfall erosion, and analyzed the erosion characteristics and influencing factors of an iron tailings dam under six different slope conditions. Yang Sun [48] conducted the rainfall erosion test, and considered that rainfall infiltration was the main factor in the hydraulic erosion and deformation instability of the tailings dam slope. Furthermore, the environmental protection measures were put forward for the tailings dam slope. Wang [49] analyzed the change law of the seepage line of the tailings dam slope, as well as the dam break process of flood overtopping induced by rainfall through the tests. Hu [50] explored the mechanisms of damage and fluidization of the tailings dam by using the flume model test, and analyzed the impact of rainfall on dam body safety.
At present, laboratory tests on failures of the tailings dam under rainfall mainly focuses on specific failure mechanisms and influence factors, such as flood overtopping, erosion, etc. Research is lacking on the influence of different test conditions on the failure mode and failure mechanism under rainfall, such as initial seepage field, slope ratio, and other factors. In addition, the research object is a tailings dam, while the research on fly-ash dams is less. Therefore, in order to close the gap, this paper has carried out the laboratory tests considering the changes of initial seepage fields and slope ratios, aimed at studying the failure modes, failure mechanisms, and landslide-triggering factors of fly ash dam slopes under rainfall. Throughout the tests, three failure mechanisms and three failure modes were found. Differently from the clay slope, flow slide is an important failure mechanism of fly ash slopes under rainfall. Local erosion damage caused by runoff erosion and flow slide are the important triggering factors of the fly ash dam slope failure under rainfall. Furthermore, the influence of the initial seepage field and slope ratio on failure mode and failure mechanism is analyzed, which provides a reference for slope protection of the fly-ash dam.

2. Materials and Methods

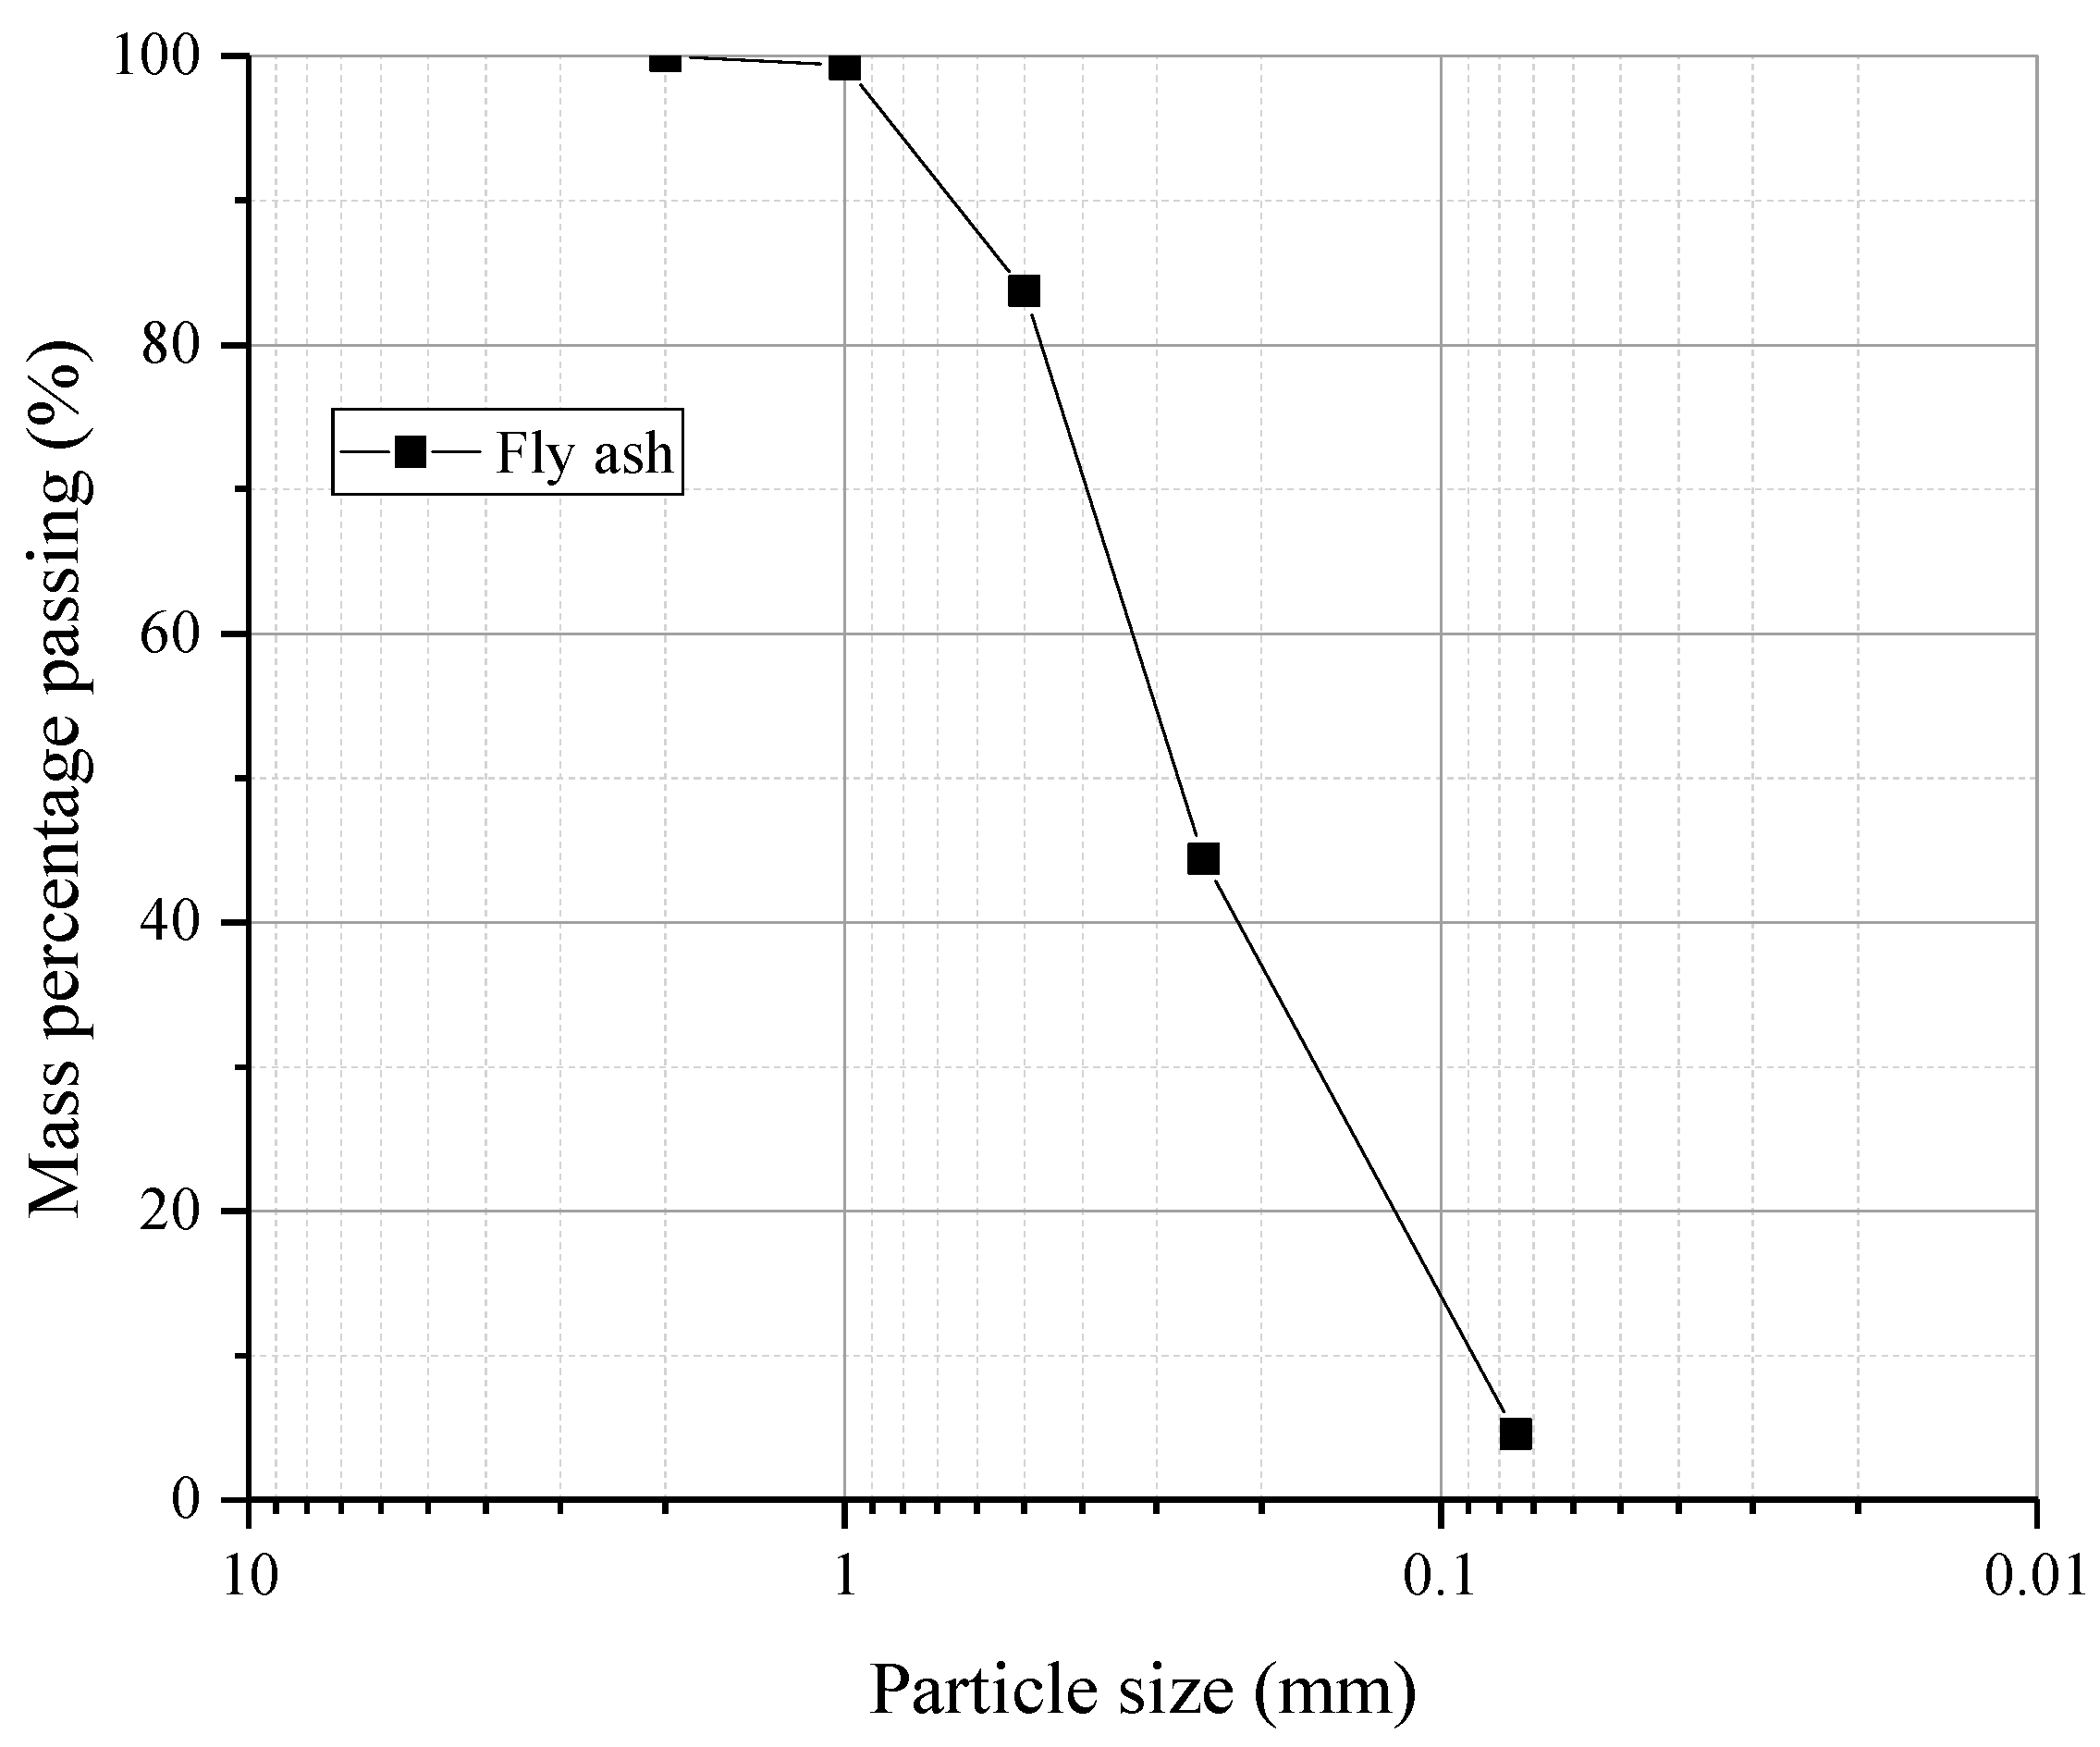
2.1. Materials in the Test

In this test fly ash was selected from the Xiangyanggou fly-ash dam in Shijiazhuang City, China, and gravel was used in the initial dam. Its physical and mechanical parameters are shown in Table 1, and the particles grading curve of fly ash is shown in Figure 1.

2.2. Laboratory Test Facility
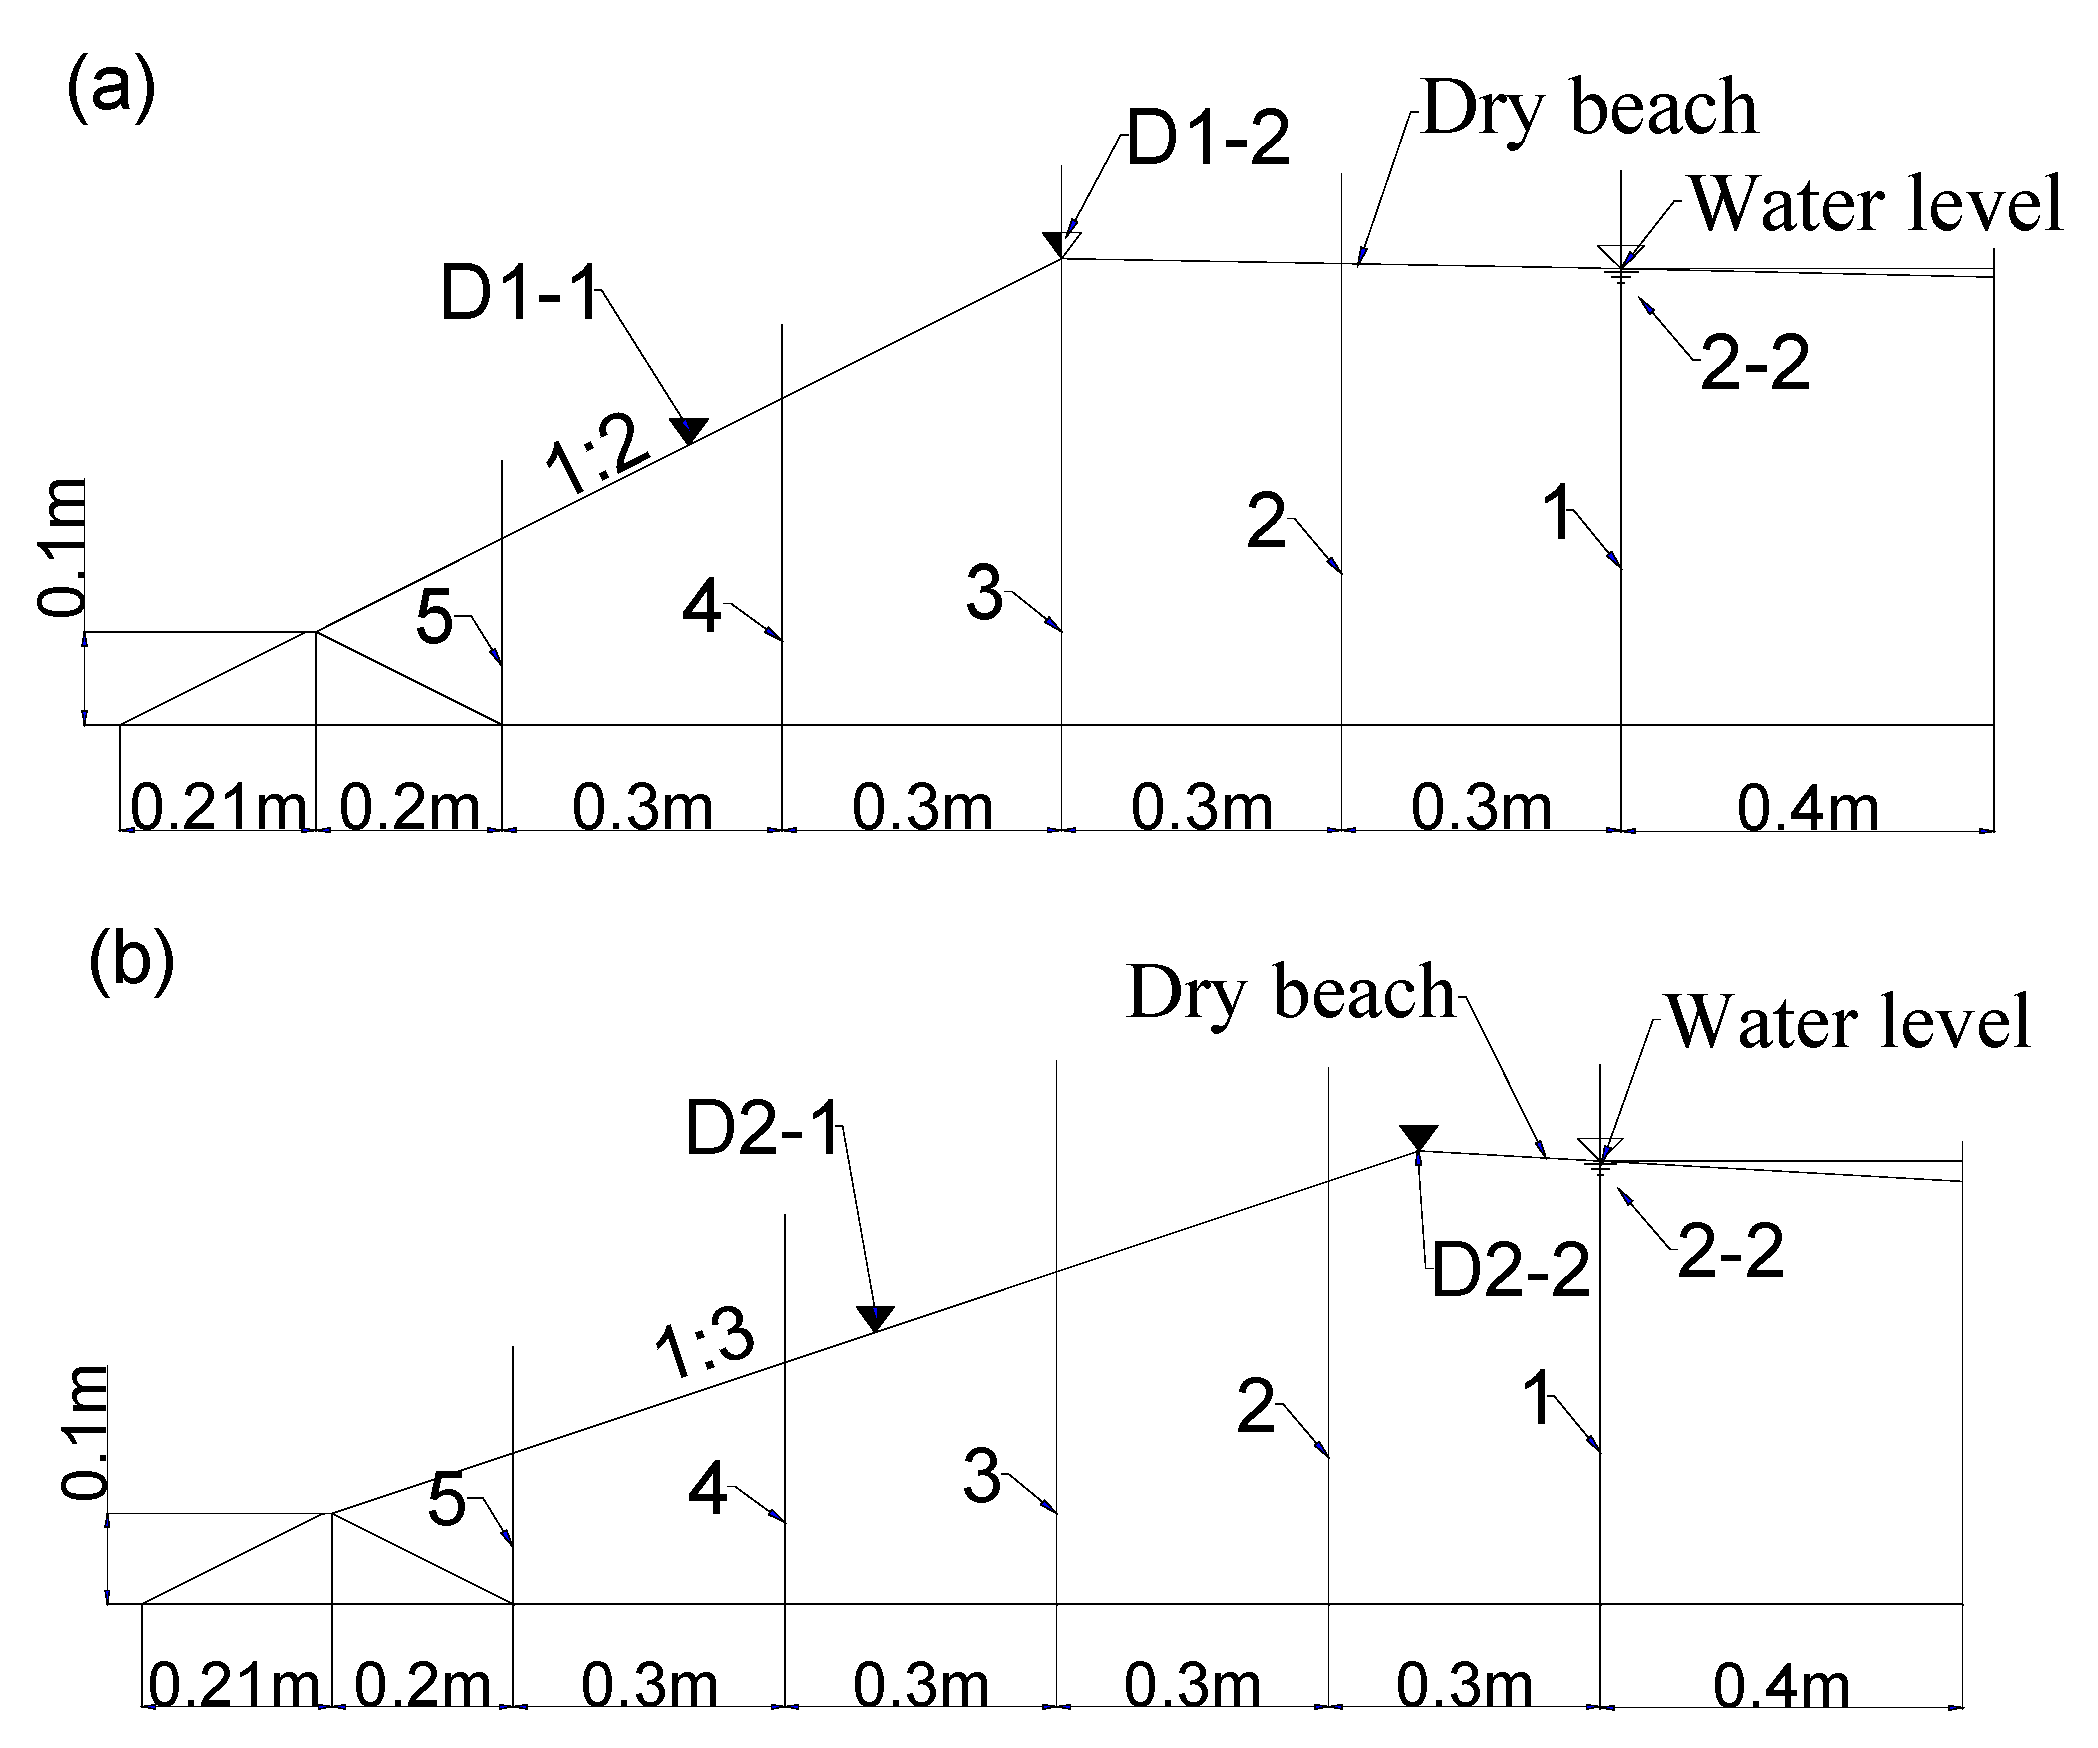
The laboratory tests were carried out in the model test box, which was 3 m long, 1 m wide, and 1.5 m high, equipped with a plexiglass plate as its side wall and a rainfall system on the top. The rainfall system mainly included the rainfall sprinkler, rainfall meter, rainfall control system, water pump, and water supply pipeline. The rainfall control system was developed by Nanjing Forestry University. The effective rainfall areas were 3 m2, and the raindrops size was 0.5~2.8 mm, as shown in Figure 2 and Figure 3.
The measurement system in the laboratory tests included using a camera to record the failure process of the dam slope, using a total station to measure the deformation of the slope surface, drawing a grid on the side plexiglass to observe the shape change of the dam body during the failure process, and laying white lines on the side of the soil layer every 10cm during the layered filling process of the dam slope. According to the deformation of these white lines, the soil deformation of the fly ash dam slope can be analyzed, and the position of the sliding surface can be determined by the disconnection of the marking lines.

2.3. Test Design

As shown in Table 2, the outer slope ratio of 1:2 can represent the slope ratio of the general sub-dam of the fly-ash dam, and 1:3 can represent the slope ratio of a gentle sub-dam or a steep whole-dam. The rainfall intensity was set to 17 mm/h. Under the conditions S1 and S2, a stable seepage field existed in the dam slope before rainfall. In order to make the test comparable, the infiltration positions under S1 and S2 conditions should be the same to maintain the same seepage field, so as to analyze the impact of different slope ratios on failure characteristics. However, under conditions S3 and S4, there was no initial seepage field in the fly-ash dam, which corresponded to the dry-stack ash dam or the hydraulic-filling ash dam with a deep saturation line. Then, by comparison with conditions S1/S2 and S3/S4, the influence of the initial seepage fields on failure characteristics of the fly ash dam slope was reflected.

3. Results and Discussion

3.1. Results of the Test under S1 and S2 Conditions

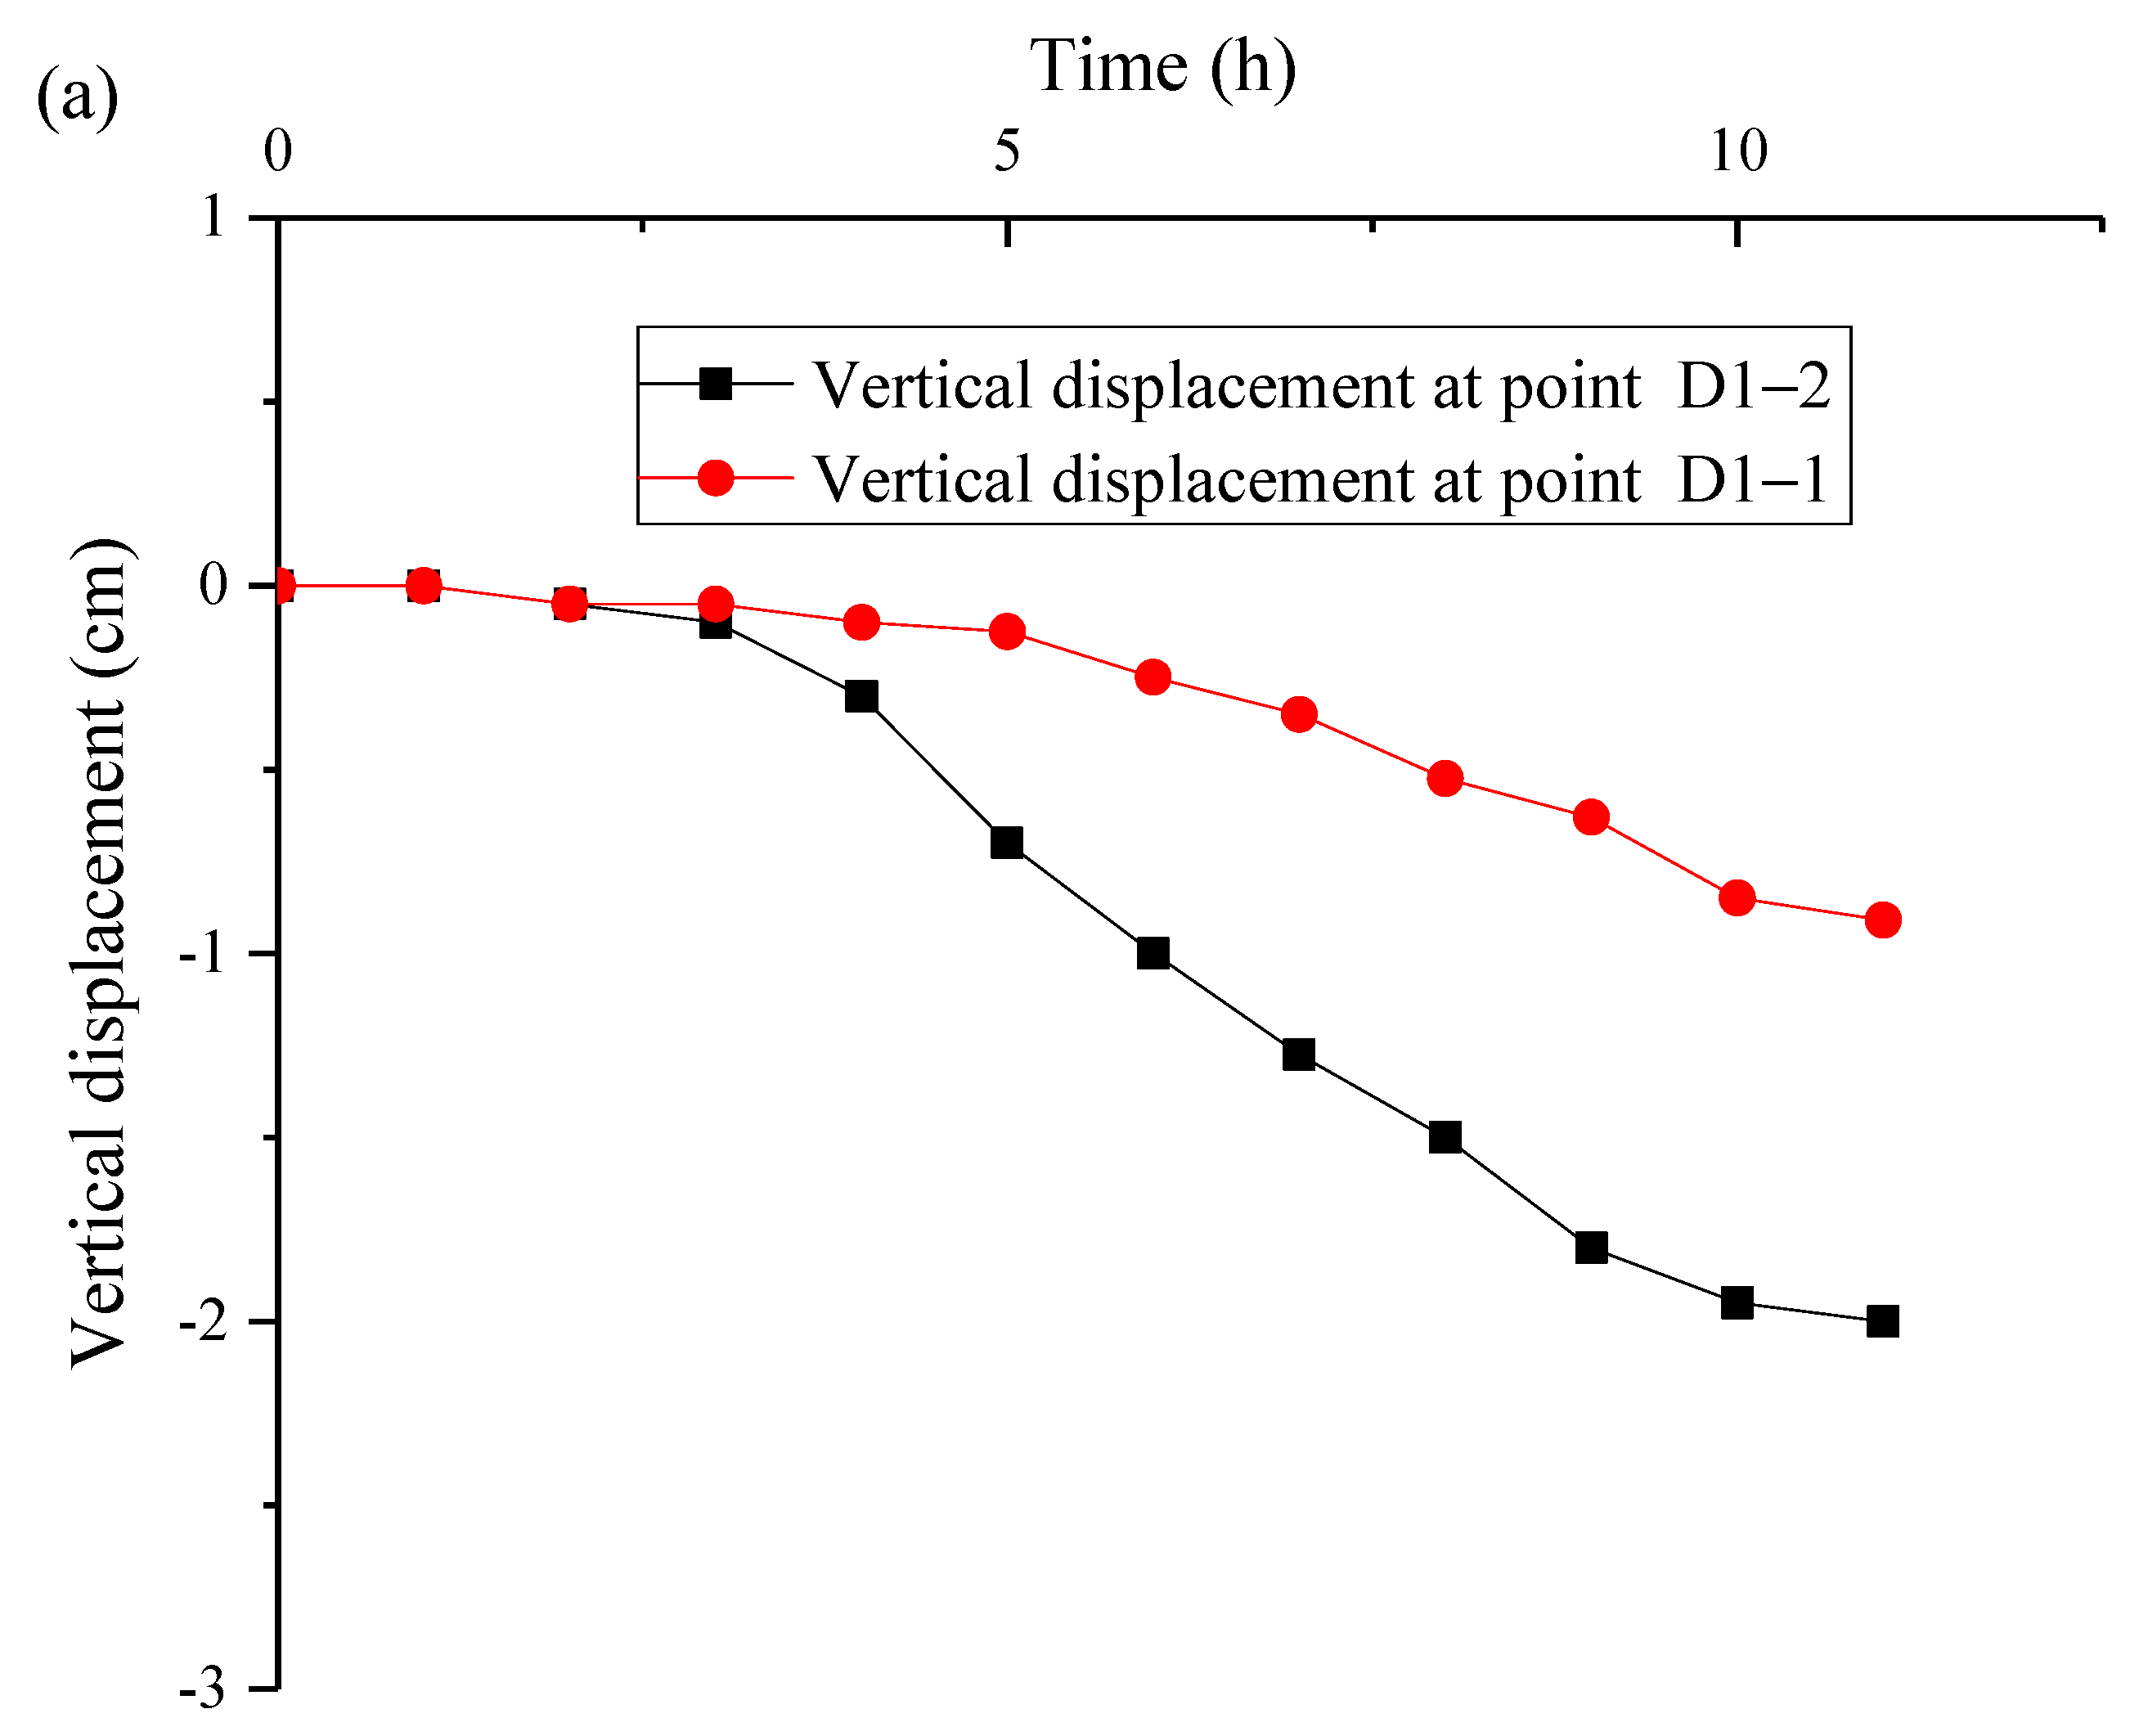
3.1.1. Tests on Formation of the Initial Seepage Field in the Dam Slopes of S1 and S2

Firstly, the dam slopes of S1 and S2 were subjected to the seepage tests under the constant total head of 0.48 m. Both dam slopes had the same infiltration position. Five pressure measuring pipes were arranged in the dam body (as shown in Figure 3 and Figure 4), and two settlement observation positions were set at the top and the middle of the dam-slope surface. In the seepage tests, the water level of the pressure measuring pipe would change with time. When the water level was stable in the pipes, it showed that the stable seepage fields were formed in the dams, and then the seepage tests were over.
The measurement results of the saturation lines during the tests are shown in Figure 5. As seen in Figure 5, the saturation lines in the dams were basically stable after 11 h, and the distribution of the final saturation lines in the two dams were basically the same.
The settlement measurement results at the top and middle of the dam-slope surface during the seepage of the dams are shown in Figure 6. From Figure 6, the dam-slope surface had a certain settlement during the seepage process. Comparing the dam slopes with the slope ratio of 1:2 and 1:3, the vertical settlement of the latter was larger. According to the test results, the final average slope ratio of the dam slope, with the initial slope ratio of 1:2 and 1:3, turned to 1:2.1 and 1:3.2, respectively, after seepage tests.

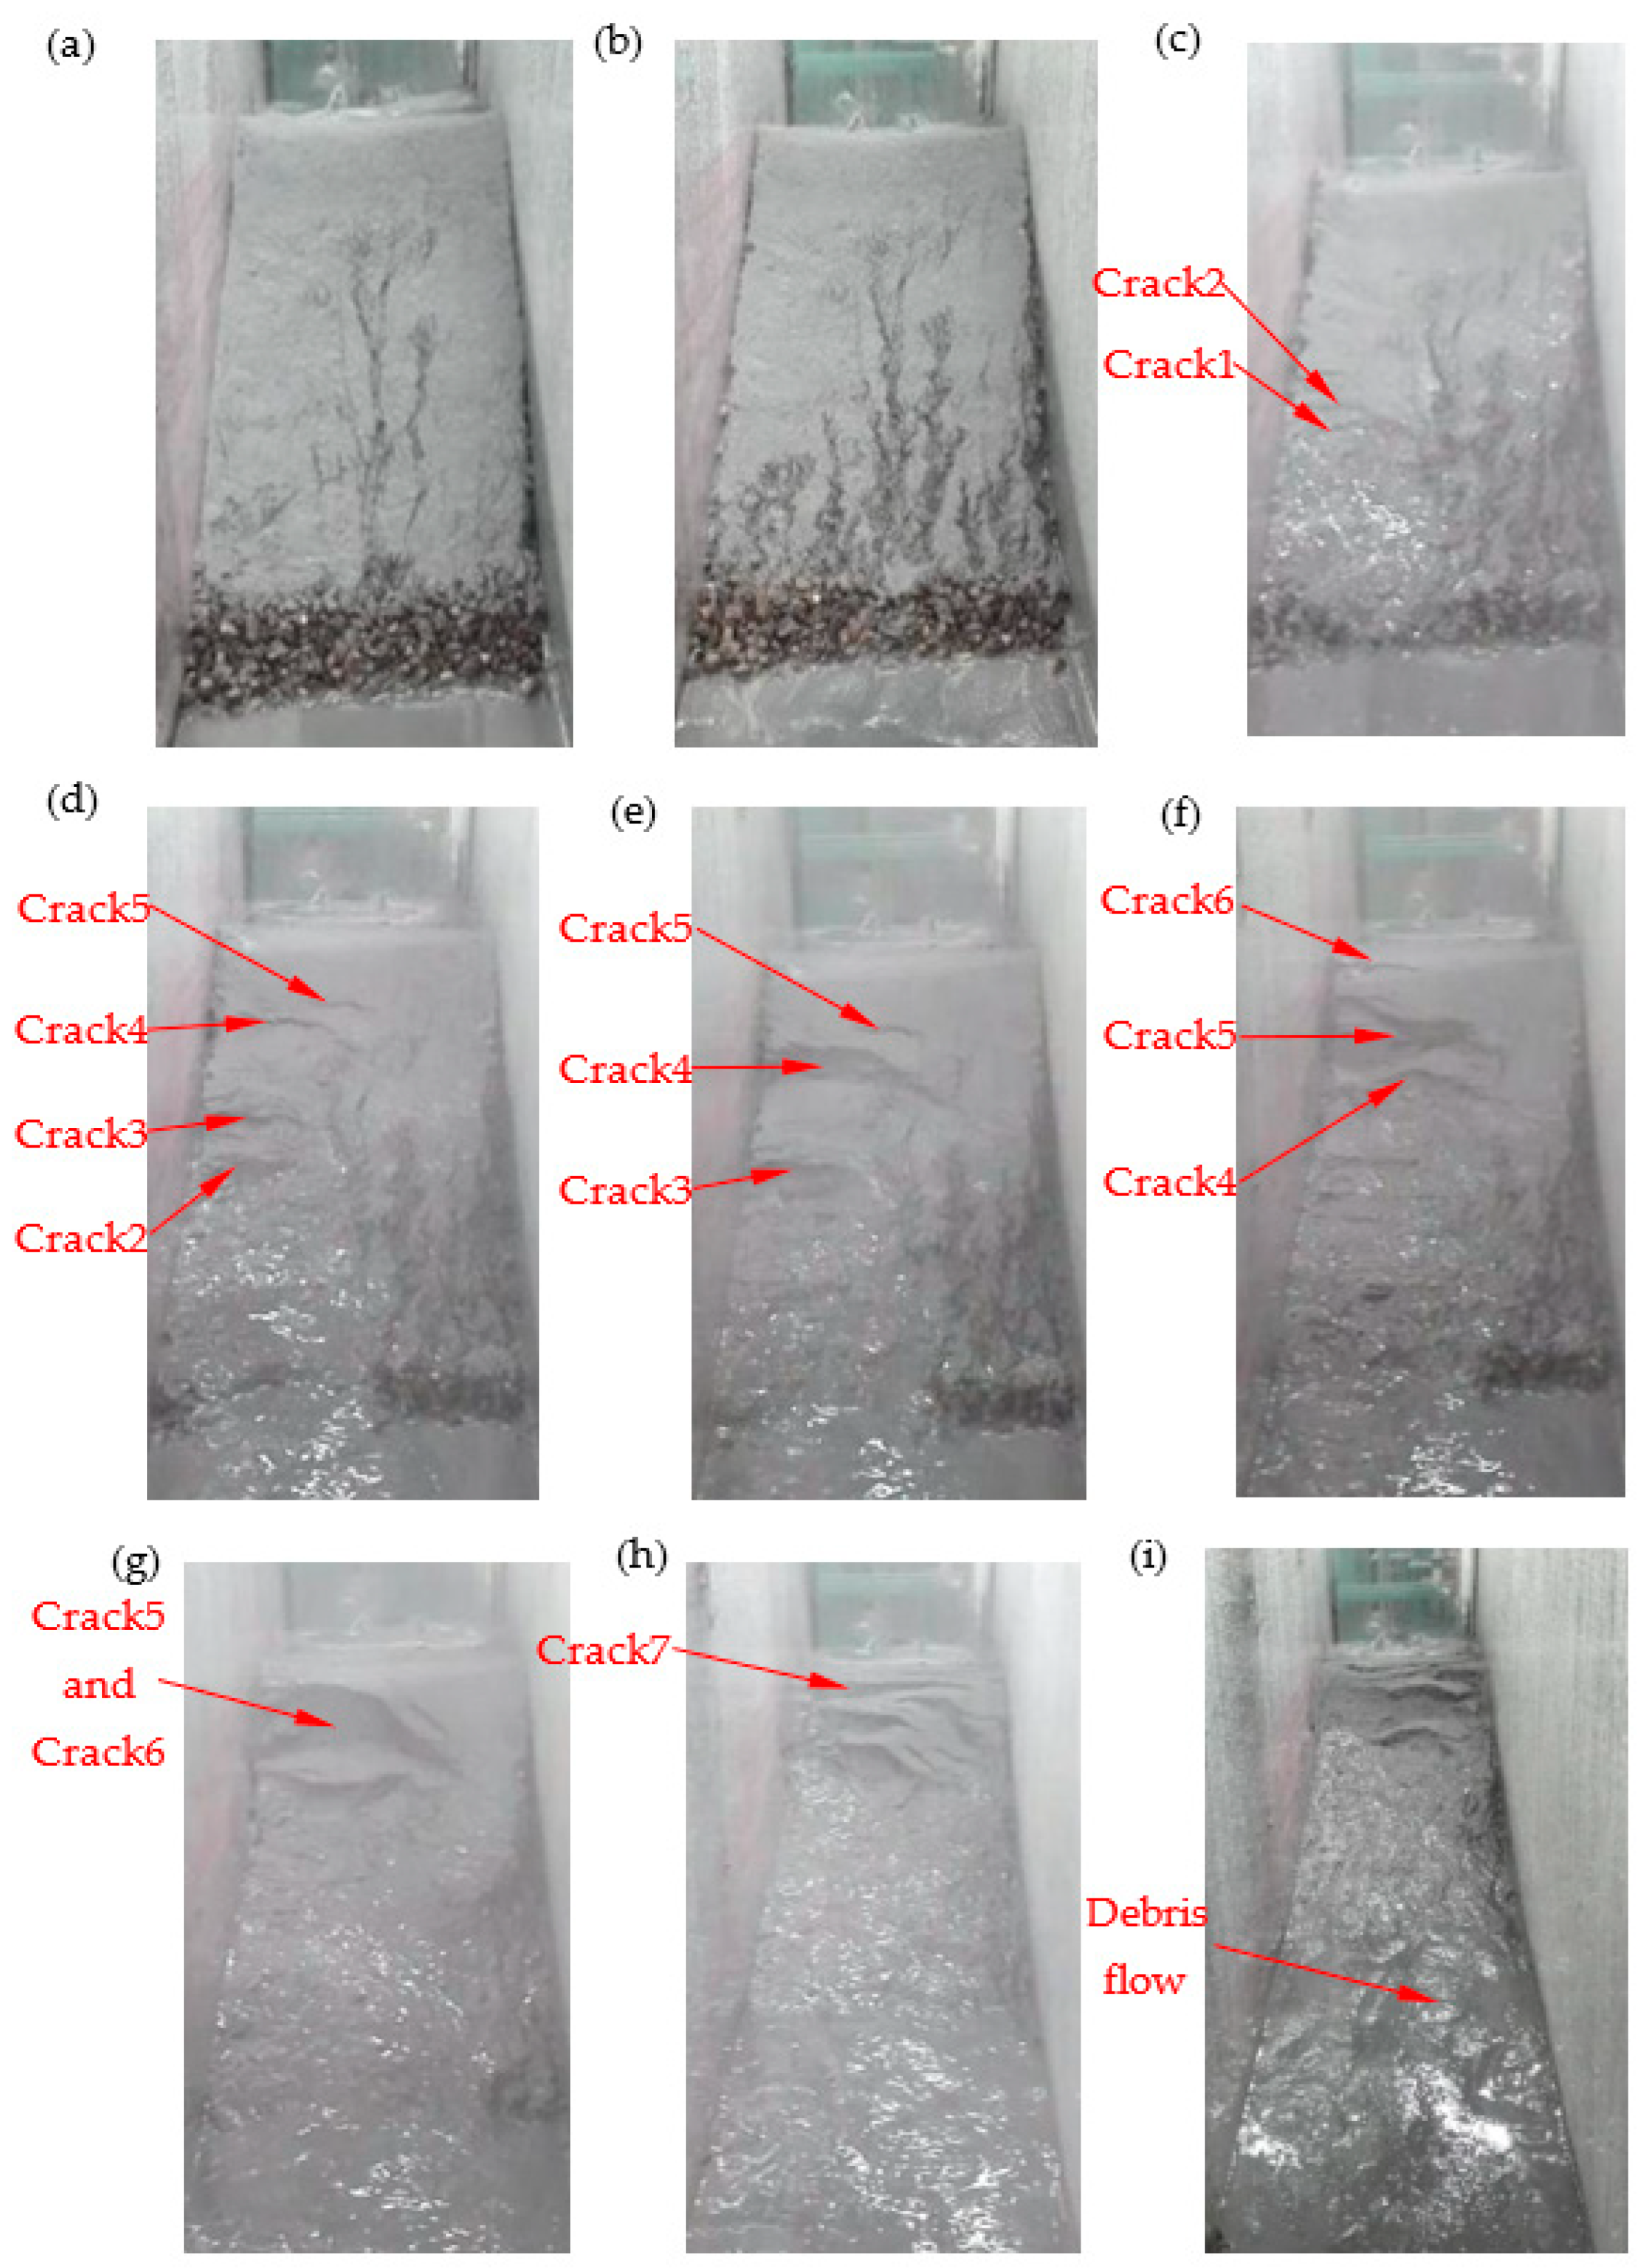
3.1.2. Rainfall Test of S1

Before rainfall, the pressure measuring pipes were removed in order to avoid affecting the failure process of the fly ash dam slope. After the rainfall lasted for 1 h 34 min, some small gullies began to appear at the toe of the dam slope, and these small gullies gradually developed upstream, as shown in Figure 7a. After 2 h 6 min, due to the scouring action of rainwater, the gullies on the dam-slope surface developed rapidly, as shown in Figure 7b.
After 2 h 12 min, due to the runoff erosion at the dam toe, a small-scale flow slide occurred above the left side of dam-slope toe. This caused the upper soil to lose its support and slide downward, and induced the transverse tension cracks 1 and 2 on the dam-slope surface, as shown in Figure 7c.
After 2 h 23 min, with the development of flow sliding, crack 1 disappeared, and crack 2 gradually widened, where a new free surface was formed. With the development of the free surface at crack 2, three new tensile cracks appeared successively above crack 2, including a tensile crack 3, a transverse crack 4 with a length of 30 cm, and a small tensile crack 5. The formation of these tensile cracks indicated the occurrence of the retrogressive landslide. The first local sliding failure occurred at crack 2, as shown in Figure 7d.
After 2 h 28 min, the first local sliding caused the soil above crack 2 to lose support, and a new free surface was generated at crack 3. With further development of the free surface, the sliding body formed, and the second local-sliding failure occurred at crack 3, as shown in Figure 7e. At the same time, due to the traction of the lower soil mass, crack 4 gradually widened and expanded to the right side, forming a large new free surface at the crack 4.
After 2 h 31 min, crack 5 propagated rapidly, and a sliding body was formed between crack 4 and crack 5. With the slow sliding of the sliding body, the length and width of crack 5 gradually increased, and a free surface with a width of 35 cm was formed in the middle-upper part of the dam slope. Subsequently, a crack 6 with a length of approximately 20 cm appeared at the left side of the dam-slope crest, and the third local landslide occurred at crack 4, as shown in Figure 7f.
After 2 h 33 min, crack 6 at the beach top rapidly developed and deflected towards crack 5, finally leading to coalescence. At this time, the soil mass between the two cracks gradually slid downward, and the fourth sliding failure occurred at crack 6, as shown in Figure 7g.
After 2 h 35 min, due to the influence of the fourth sliding, the upper soil mass of the dam-slope crest lost its support, and a transverse crack 7 penetrating the entire surface of the dam slope appeared at the top. Several tensile cracks were rapidly generated on the right side of the dam-slope surface below crack 7, and the dam slope suffered the fifth sliding failure, as shown in Figure 7h.
After 2 h 37 min, when the crack development reached the dam-slope crest, the dam slope had failed, the rainfall was stopped, and the test ended. Due to the multiple sliding damages of the dam slope, the sediment of the whole dam body slid in the downstream direction, and the total settlement of the dam-slope crest was 5 cm. According to the test phenomena, the failure mode of S1 was: runoff erosion failure triggered soil flow slide at the dam-slope toe, resulting in a multi-stage retrogressive landslide. After the landslides, ash was rapidly liquefied under the action of rainfall and discharged from the dam slope in the form of mud flow, as shown in Figure 7i.

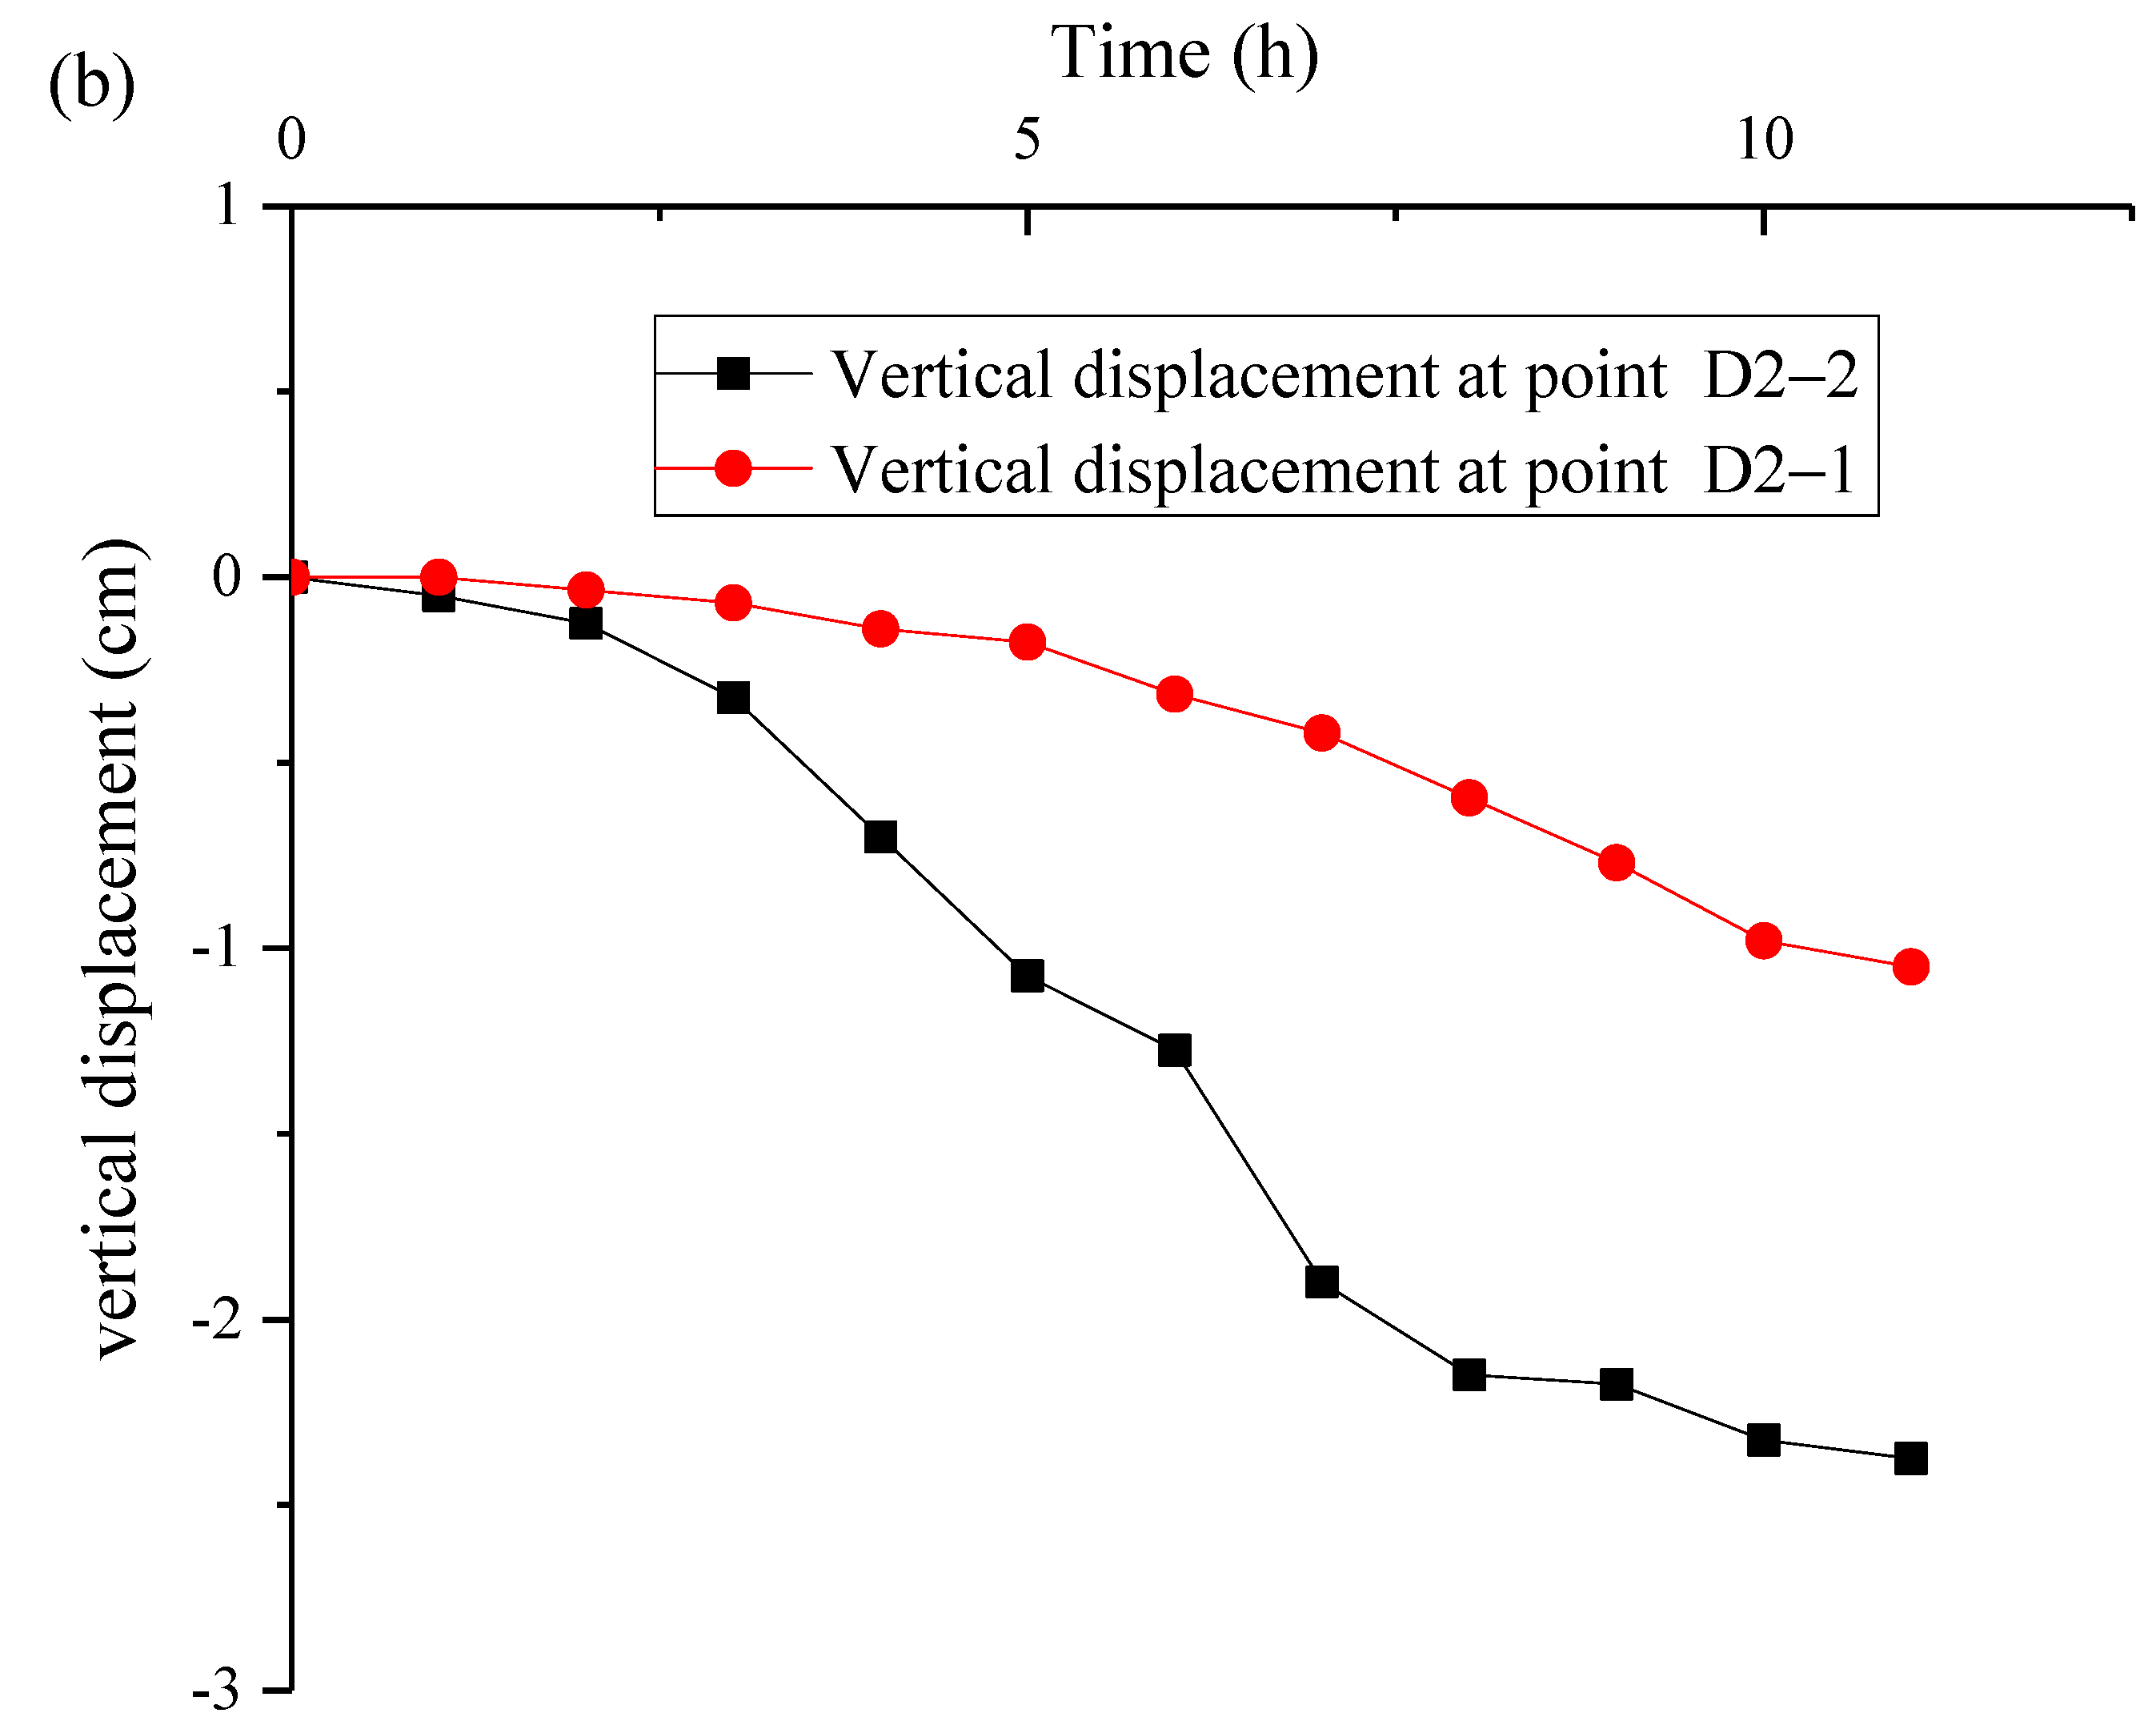
3.1.3. Rainfall Test of S2

Before rainfall, the pressure measuring pipes were removed in order to avoid affecting the failure process of the fly ash dam slope. After the rainfall lasted for 1 h 19 min, the gullies were first formed at the dam-slope toe by runoff erosion, as shown in Figure 8a. With time passing by, the gullies at the dam-slope toe continued to develop in the upstream direction; at the same time, the number of gullies increased, and the depth increased as well.
After 1 h 50 min, the gullies reached the middle position of the dam-slope surface. The gullies were narrow and shallow in the upper part and wide and deep in the lower part. The adjacent gullies gradually merged into larger gullies, which aggravated the erosion on the dam-slope surface, as shown in Figure 8b.
After 2 h 32 min, the gullies continued to develop, becoming deeper and wider. The gullies at the lower part of the dam slope eroded the dam-slope toe, and the flow-slide failure began to appear on the right side of the dam-slope toe. The upper part of the flow-slide body generated small multi-level cracks, and the first local flow-slide failure occurred, as shown in Figure 8c.
After 2 h 35 min, runoff erosion damage and flow-slide damage occurred simultaneously and developed upstream of the dam slope. Small tensile cracks were generated in the upper soil mass, and the dam-slope erosion was more serious, as shown in Figure 8d.
After 2 h 42 min, the third flow slide occurred on the left side of the dam slope. With the loss of soil in the lower part of the dam slope, the slope ratio of the dam slope increased significantly, and the upper dam body became unstable. At this time, transverse tensile crack 1 appeared on the dam-slope crest, indicating possible local sliding, as shown in Figure 8e.
After 2 h 46 min, the soil at the edge of transverse crack 3 on the dam-slope crest was liquefied, and the sliding body divided by crack 3 began to slide slowly, as shown in Figure 8f. After 2 h 55 min, the sliding body accelerated, and local-sliding damage was formed. Under the action of rainfall, the sliding body formed mud flow downstream, as shown in Figure 8g. After 2 h 58 min, the dam-slope damage extended to the dam-slope crest, and the rainfall was stopped. The final failure form of the dam slope is shown in Figure 8h. The failure process of S2 was flow slide at the dam-slope toe caused by runoff erosion, followed by several flow-slide failures. The failure position gradually developed upstream, and finally led to a local-sliding failure.

3.2. Results of Test under S3 and S4 Conditions

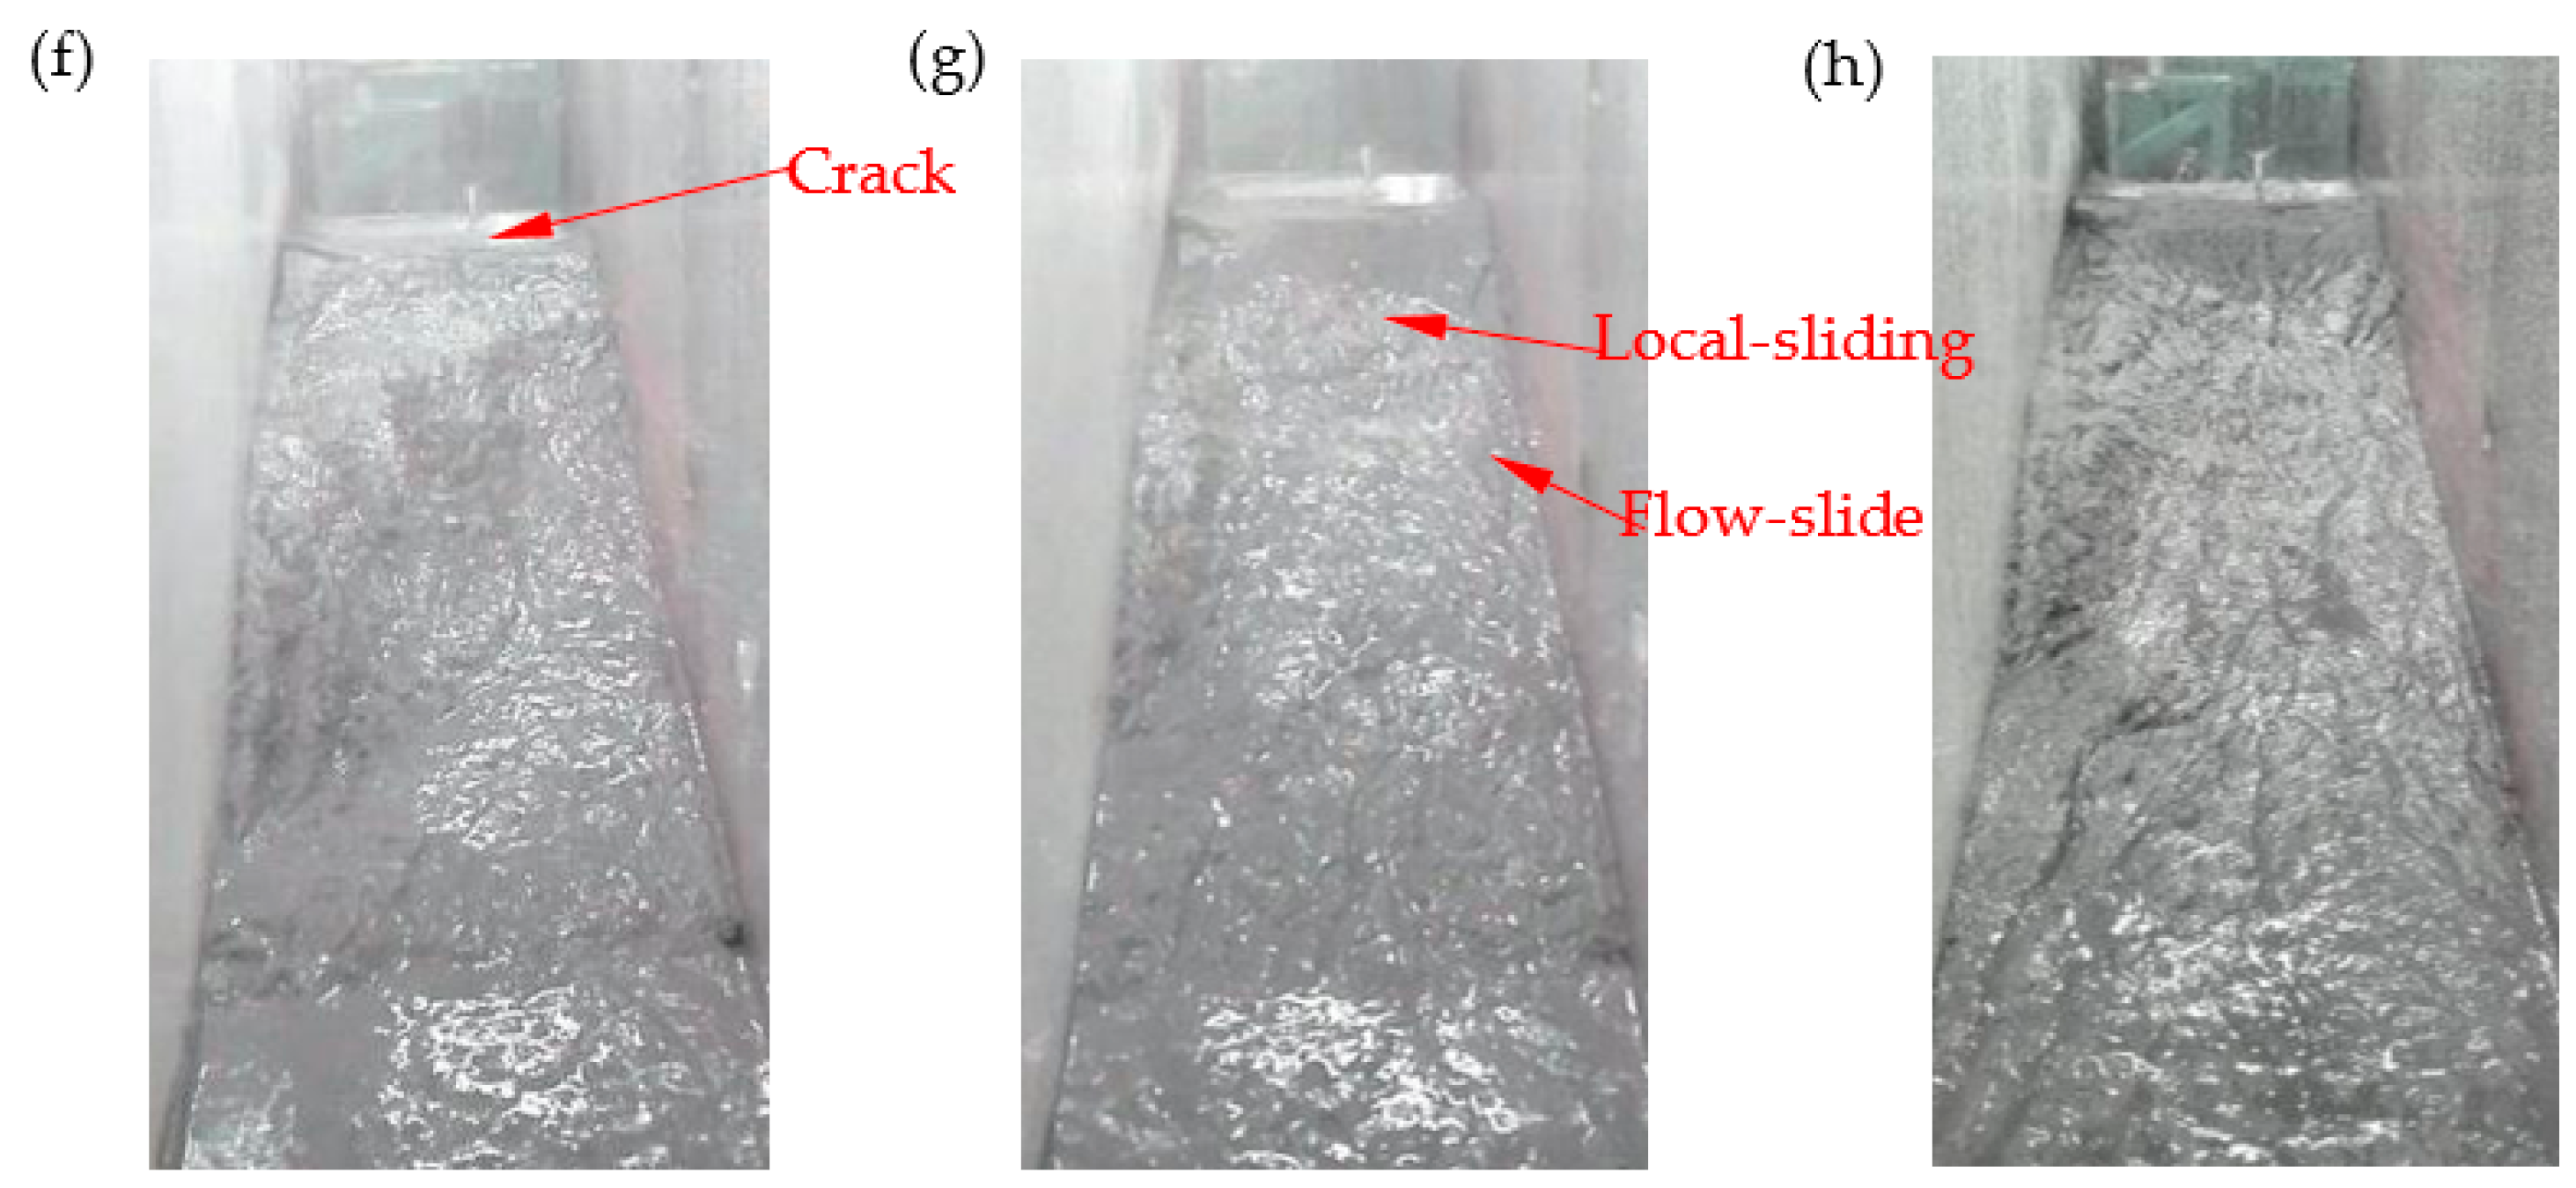
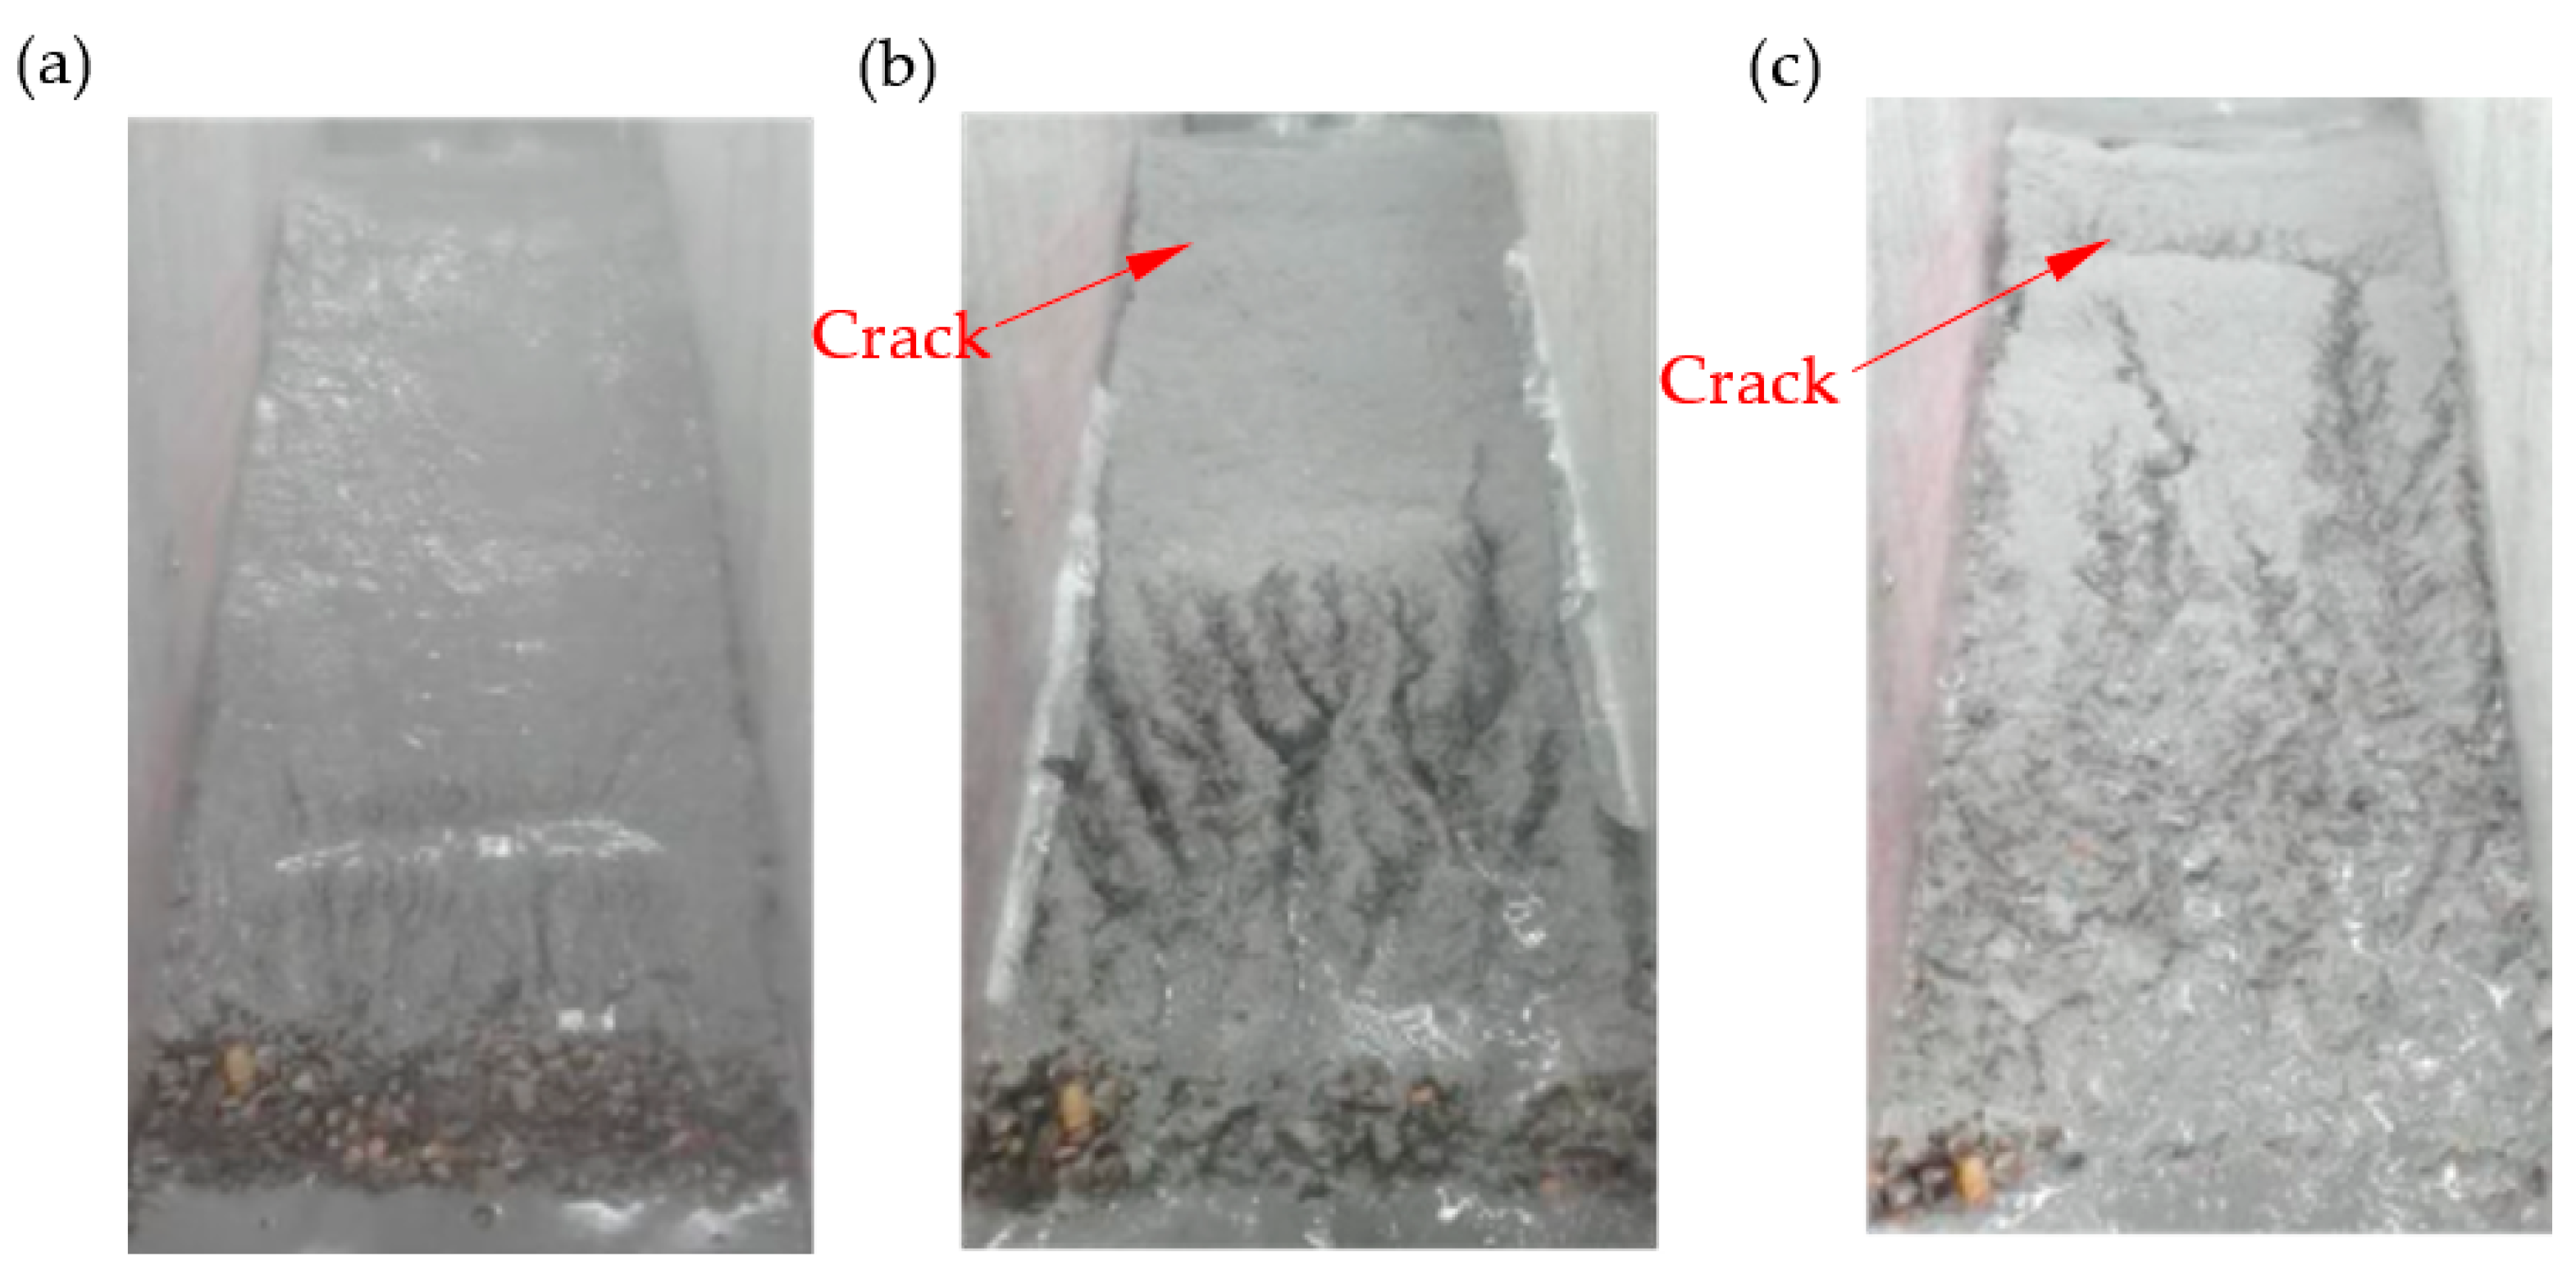
3.2.1. Rainfall Test of S3

At the initial stage of rainfall, the rainfall intensity was less than the infiltration capacity of the soil. Most of the rainwater infiltrated into the dam body, and there was no obvious change on the dam-slope surface.
After 2 h 5 min, due to the influence of rainfall infiltration, settlement cracks occurred in the dam-slope surface. Transverse crack 1 appeared on the left side of the dam-slope surface and transverse crack 2 appeared near the dam-slope crest, as shown in Figure 9a.
After 2 h 13 min, because the soil layer at the dam-slope toe was relatively thin, this part was saturated first, then the gullies began to appear. The gullies were short and thin, as shown in Figure 9b. After 2 h 40 min, the gullies on the dam-slope surface became longer and wider, and developed upstream. With the progress of rainfall, the cracks on the dam-slope surface accelerated the infiltration of rainwater, and crack 1 was soaked by rainwater and gradually closed. After 2 h 55 min, the gullies on the dam-slope surface developed upstream, but the erosion on the dam-slope surface was not serious for the whole. At this time, transverse cracks appeared near the dam-slope crest, the dam-slope toe was raised, and obvious settlement occurred in the middle and upper part of the dam slope, indicating that the internal sliding surface of the dam body was forming, as shown in Figure 9c.
After 3 h 28 min, the dam body suddenly suffered from an overall sliding failure, as shown in Figure 9d. From the deformation and disconnection of the horizontal white line marked in the dam body, it can be seen that the failure was an overall sliding failure, and the shape of the sliding surface was similar to an arc (as shown as Figure 9e). Therefore, it can be judged that the failure was an overall shear-sliding failure. It can be seen from the test that the overall sliding failure had the characteristics of a sudden and short duration, which is often harmful in reality.

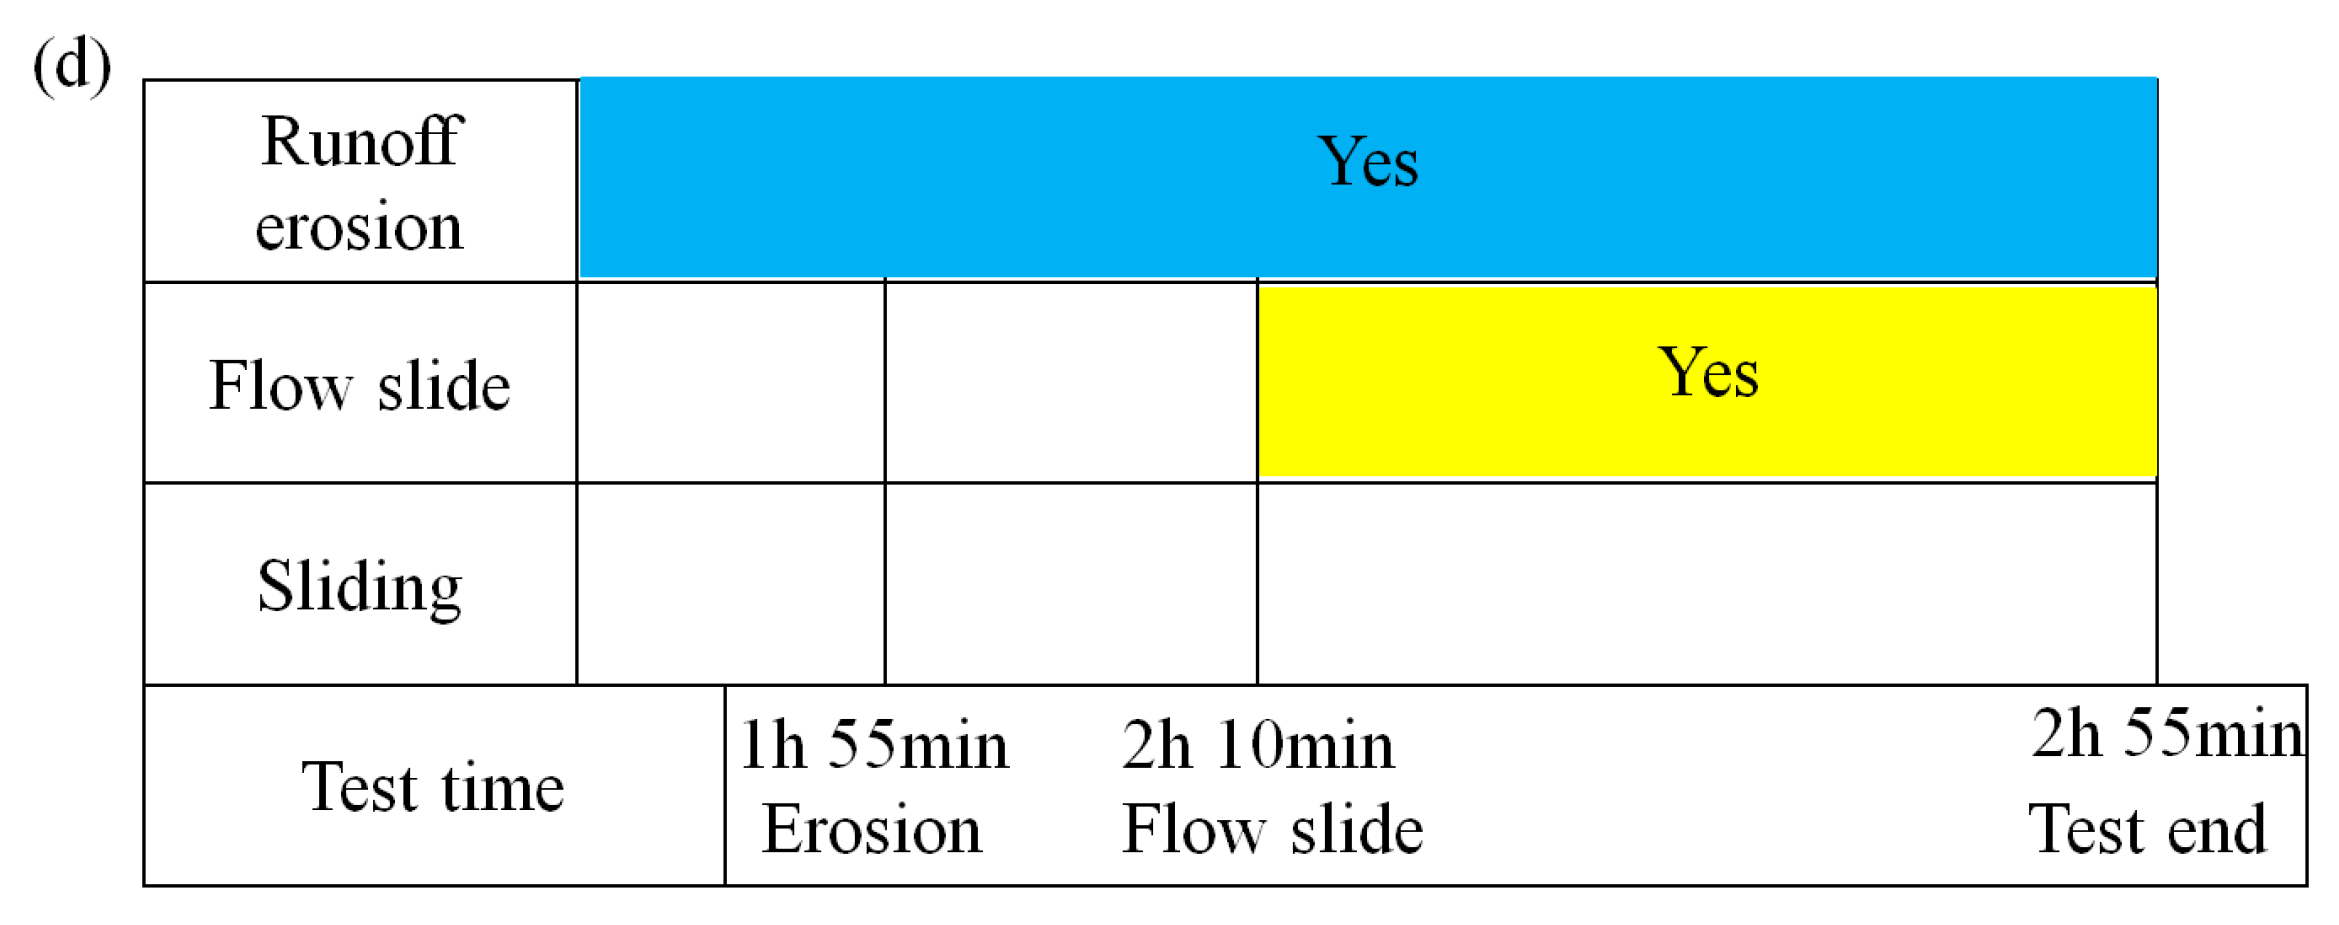
3.2.2. Rainfall Test of S4

After 1 h 55 min, the soil at the dam-slope toe was first saturated. A large number of gullies began to appear at the dam-slope toe, as shown in Figure 10a; after 2 h 10 min, the gullies on the dam-slope surface developed rapidly. The gullies at the dam-slope toe cut the dam body, accompanied by a small-scale local flow slide, resulting in serious erosion of the dam-slope toe. At the same time, a transverse crack appeared 20 cm away from the dam-slope crest, as shown in Figure 10b. After 2 h 15 min, the transverse cracks in the upper part of the dam-slope surface provided a channel for rainwater infiltration, and the crack width increased rapidly. After 2 h 55 min, the runoff erosion of the lower part of the dam slope was serious, the original slope toe basically disappeared, and the erosion failure surface gradually developed upstream (dam-slope crest). The dam slope was seriously damaged, then the test was over. The final erosion failure of the dam slope is shown in Figure 10c. Overall, S4 had no sliding failure, and the dam-slope surface was mainly eroded by runoff, accompanied by small-scale local flow-slide failure. Unlike S2, S4 had no large-scale flow-slide or sliding failure.

3.3. Analysis and Discussion on Failure Characteristics of Fly Ash Dam Slope under Rainfall

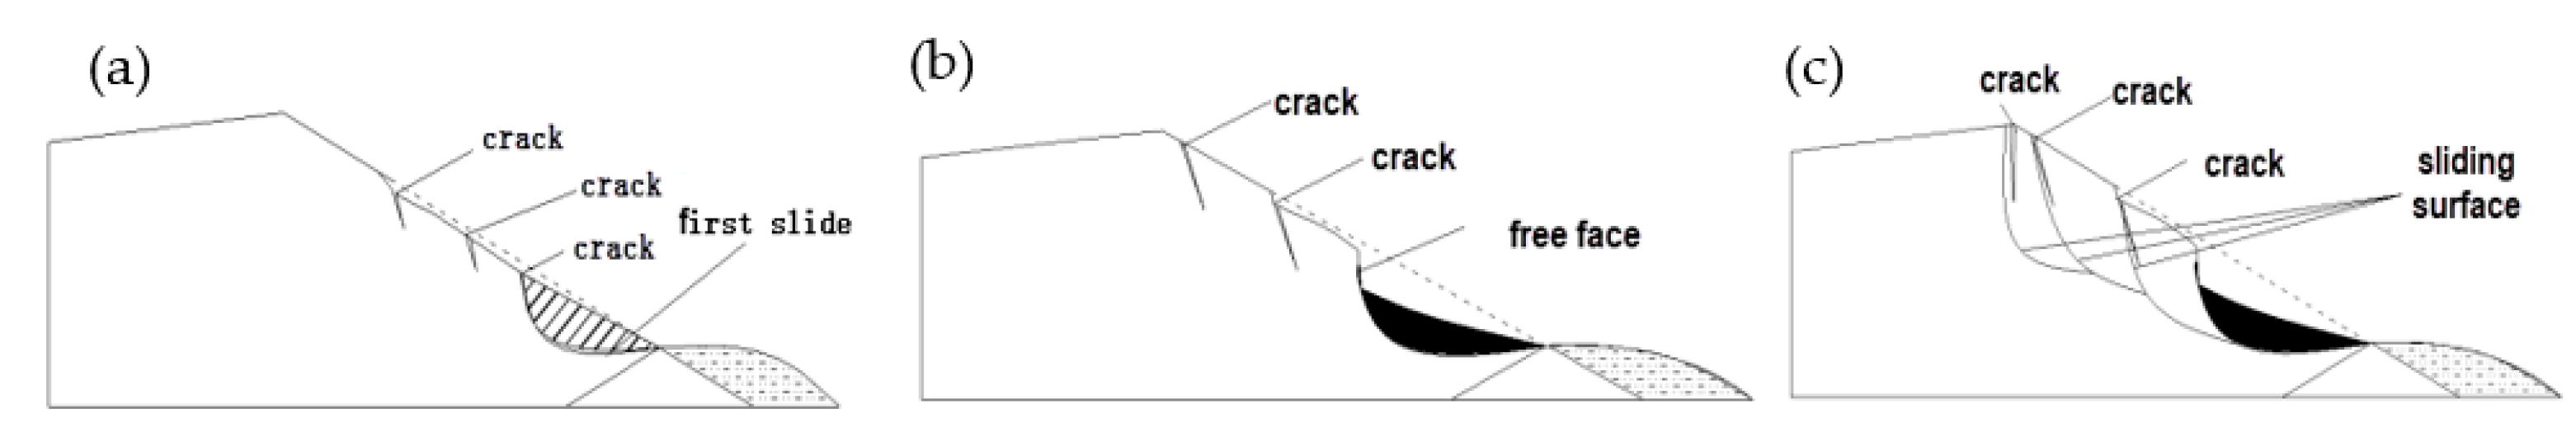
3.3.1. Failure Mechanism and Failure Mode Analysis of Fly Ash Dam-Slope under Rainfall

It can be seen from the test phenomena that the failure mechanisms of fly ash dam slopes under rainfall can be divided into three categories: sliding failure, runoff erosion failure, and flow-slide failure. The failure process of S1 was a multi-stage sliding failure. There was obvious sliding surface at each stage, and the sliding developed gradually from downstream to upstream, with progressive failure characteristics, which was similar to the failure mode of an ordinary slope described in the literature [51,52]. In the failure process of S2, there were flow-slide failures, local sliding failures, and runoff erosion. The three kinds of failures occurred repeatedly, which together led to the erosion failure of the dam body; among them, flow-slide failure played a major role. However, in S4, there was erosion failure caused by flow-slide failure and runoff erosion, and runoff erosion played a major role. In S3, the overall sliding failure occurred with an obvious arc-shaped sliding surface, which was the overall shear-sliding failure. The failure forms in the laboratory tests are shown in statistical Table 3.
The failure process of S1 is divided into the following stages: (1) With the rainfall infiltration, the water content of the dam body increased, and runoff erosion occurred at the dam-slope toe, which made the upper soil lose its support and slide downward. This caused the forming of transverse cracks on the surface of the dam slope, and thus, the first local-sliding failure was formed, as shown in Figure 11a,b. (2) After sliding, the loose fly ash was taken away by the rain, the upper dam body soil lost its support, another local sliding occurred, and multiple transverse cracks were formed on the slope surface. (3) The sliding surface continuously developed to the dam-slope crest, forming the retrogressive landslide by multi-stage sliding failure, as shown in Figure 11c, and finally forming a shallow failure area in the dam body.
In S2, there are three development stages of flow-slide damage caused by runoff erosion: (1) Firstly, runoff erosion occurred at the dam-slope toe and developed upward, which led to local steepening of the dam slope, as shown in Figure 12a. (2) Due to the cut-ting of the dam body by the runoff, the local soil mass lost the lateral restraint. It became loose and was liquefied under the effect of rainfall, triggering the local flow-slide failure, as shown in Figure 12b. (3) Runoff erosion and flow-slide failure were repeated, eventually leading to a larger-scale flow slide, forming the progressive erosion failure of the dam body, as shown in Figure 12.
Similarly, the erosion failure of S4 can be divided into three stages; the first two stages were the same as S2, and the third stage was different from S2. There was hardly large-scale flow-slide failure, but mainly runoff erosion damage.
S3’s sliding failure was mainly affected by two factors: (1) rainfall infiltration led to the increase in soil saturation and the increase in sliding force, and caused the decrease in soil strength and the decrease in anti-sliding force; (2) the appearance of runoff erosion at the dam-slope toe further weakened the stability of the dam-slope toe, as shown in Figure 13a. These two factors triggered the overall shear-sliding failure of the dam slope, as shown in Figure 13b.
The evolution of the failure mechanism during dam slope failure under different working conditions is shown in Figure 13.
It can be seen from Figure 14 that local erosion damages caused by runoff erosion and flow slide are the important triggering factors of fly ash dam-slope failure under rainfall.

3.3.2. Influencing Factors of the Failure Characteristics of Fly-Ash Dam Slopes under Rainfall

With regard to dam-slope materials, the density of fly ash is low, and runoff erosion is more likely to occur under rainfall. In the tests, erosion caused looseness of nearby soil, which was easily liquefied under rainfall, causing flow-slide damage. This is different from the general clay slope; the nearby clay after runoff erosion is more prone to collapse in a clay slope [53]. Therefore, for the fly ash dam slope, in the early stages of rainfall, the local erosion damage was often caused by runoff erosion and flow slide. With the progress of rainfall, the local erosion will trigger a series of failures, including overall sliding failures, multi-stage sliding failures, and further erosion. Therefore, the local erosion needs to be paid attention to as an early warning of slope damage [54], and the surface of the fly ash dam slope should be strictly protected.
With regard to slope ratio, with the decrease in slope ratio, the failure mode evolves from a sliding failure to a flow-slide failure and a runoff erosion failure. The larger the slope ratio, the more obvious the sliding failure characteristics; the smaller the slope rate, the more obvious the runoff erosion damage. However, the above conclusion is different from the erosion effect on the slope under rainstorm conditions [47,48]. In the tests, the slope ratios of S1, S2, S3, and S4 before rainfall were 1:2.1, 1:3.2, 1:2, and 1:3, respectively. As the slope ratios of S1 and S3 were large, sliding failure occurred under this condition. The slope ratios of S2 and S4, which were small, hardly had sliding failures occur; instead, flow-slide failures and runoff erosion failures occurred.
From the initial seepage field of the fly ash dam slope, the water content of dam-slope soil is high due to the existence of the initial seepage field. In the tests, the saturated area of the dam-slope surface appeared first at the dam-slope toe under rainfall, due to the thinnest soil layer being at the dam-slope toe. Under the action of seepage and rainfall, the soil in this area was prone to liquefaction [50], and rainfall runoff erosion was generated at the dam-slope toe, causing local damage and erosion of the dam-slope toe. If the dam slope ratio were relatively large, the local damage could cause a series of shallow sliding failures (in S1); if the dam slope ratio were gentle and could not reach the sliding failure condition, the existence of a local failure area would intensify runoff erosion. The runoff cutting on the dam body would cause the local soil to lose its lateral constraint and become loose. Affected by the initial seepage field, the soil had high water content, and the loose soil was more likely to be liquefied by rainfall. This finally led to flow-slide failure, forming a flow-slide failure mode (in S2). When there was no seepage field before rainfall, runoff erosion still occurred first. The erosion damage and the increase in the soil moisture content reduced the anti-slide force of the slope. When the slope gradient was large, sliding failure more easily occurred (in S3). On the contrary, when the slope was gentle and there was no sliding failure, the erosion developed upstream. Compared with S2, the water content of the soil is low and it is difficult to form a large-scale flow slide. Therefore, only a small-scale flow slide is observed in the test, and the main failure mode is runoff erosion (in S4).

4. Conclusions and Discussions

The laboratory test study has been carried out on the failure characteristics of fly ash dam slope under rainfall. The conclusions are as follows:
(1) Based on the tests, three failure mechanisms of the fly ash dam slope under rainfall are revealed: sliding failure, runoff erosion, and flow-slide failure. Due to the low density of fly ash, runoff erosion is more likely to occur under rainfall. Runoff erosion causes looseness of nearby fly ash, which is easily liquefied under rainfall, causing flow-slide damage. This is different from the general clay slope, where the nearby clay after runoff erosion is more prone to collapse. In the tests, flow slide was an important failure mechanism of the fly ash slope, and played a key role in the failure process of the fly ash slope in tests S1 and S2.
(2) Local erosion damages caused by runoff erosion and flow slide are the important triggering factors of the fly ash dam-slope failure under rainfall. For the fly ash dam slope, in the early stage of rainfall, the local erosion damage was often caused by runoff erosion and flow slide. With the progress of rainfall, the local erosion will trigger a series of failures, including overall sliding failures, retrogressive landslides, and further erosion.
(3) According to the test, three different failure modes of fly ash dam slopes under rainfall are proposed: overall sliding failure, the retrogressive landslide caused by multi-stage local sliding, and progressive erosion failure (caused by the combined action of runoff erosion and flow slide). The overall sliding failure is sudden, but the latter two failure modes occur gradually.
(4) The slope ratio has an important influence on the failure mode. With the decrease in slope ratio, the failure mode evolves from sliding failure to flow-slide failure and runoff erosion failure. The greater the slope ratio, the more obvious the sliding failure characteristics; the lower the slope ratio, the greater the runoff erosion damage.
(5) The failure mode is related to the initial seepage field in the dam slope, and the existence of an internal seepage field in the slope intensifies the occurrence of flow slide. When there is a seepage field before rainfall, the flow-slide failure easily occurs in the erosion process of the slope under rainfall. On the contrary, runoff erosion mainly occurs in the erosion process of the slope under rainfall.
It can be seen from the above conclusions that local erosion damages are the important triggering factors of the fly ash dam-slope failure under rainfall. Therefore, the protection of the fly-ash dam slope should be strengthened, and the smaller dam slope ratio and the lower buried depth of the phreatic line should be controlled in order to prevent rain erosion. Considering that there are many factors affecting the failure law of fly ash dam slopes under rainfall, and the three failure mechanisms may play different roles in the failure processes of fly ash dam slopes under different conditions, which may have an impact on the failure process. It is suggested that in future research, the erosion of fly-ash dam slopes under the action of rainfall should be further studied. The impact of erosion laws and shallow failure laws of fly-ash dam slopes under different rainfall intensity, different dam density, and greater slope ratios should be considered. The next step is to further study the relationship between the potential failure mode and the above influencing factors under rainfall conditions by combining experiment and theory, as a way to provide a basis for the stability analysis of fly ash dam slopes under rainfall.

Author Contributions

Conceptualization, Q.L. and H.-K.N.; methodology, Q.L. and H.-K.N.; test, Q.L. and J.-T.W.; formal analysis, X.L.; investigation, L.-T.Z.; data curation, Q.L., H.-K.N., and J.-T.W.; writing—original draft preparation, Q.L. and H.-K.N.; writing—review and editing, X.L.; funding acquisition, H.-K.N. and L.-T.Z. All authors have read and agreed to the published version of the manuscript.

Funding

This research was funded by the Natural Science Foundation of Hebei Province (E2019210304, E2021210092), the Youth Top Talent Project of Hebei Province, S&T Program of Hebei (No. 22375412D).

Institutional Review Board Statement

Not applicable.

Informed Consent Statement

Not applicable.

Conflicts of Interest

The authors declare no conflict of interest.

References

  1. Santamarina, J.C.; Torres-Cruz, L.A.; Bachus, R.C. Why coal ash and tailings dam disasters occur. Science 2009, 364, 526–528. [Google Scholar] [CrossRef] [PubMed]
  2. Radtke Russell, P. Fly-ash spill raises questions on storage. Eng. News Rec. 2009, 2019, 12–13. [Google Scholar]
  3. Rico, M.; Benito, G.; Salgueiro, A.; Díez-Herrero, A.; Pereira, H. Reported tailings dam failures: A review of the European incidents in the worldwide context. J. Hazard. Mater. 2008, 152, 846–852. [Google Scholar] [CrossRef] [PubMed]
  4. Kossoff, D.; Dubbin, W.E.; Alfredsson, M.; Edwards, S.J.; Macklin, M.G.; Hudson-Edwards, K.A. Mine tailings dams: Characteristics, failure, environmental impacts, and remediation. Appl. Geochem. 2014, 51, 229–245. [Google Scholar] [CrossRef]
  5. Agurto-Detzel, H.; Bianchi, M.; Assumpção, M.; Schimmel, M.; Collaço, B.; Ciardelli, C.; Barbosa, J.R.; Calhau, J. The tailings dam failure of 5 November 2015 in SE Brazil and its preceding seismic sequence. Geophys. Res. Lett. 2016, 43, 4929–4936. [Google Scholar] [CrossRef]
  6. Lyu, Z.; Chai, J.; Xu, Z.; Qin, Y.; Cao, J. A Comprehensive Review on Reasons for Tailings Dam Failures Based on Case History. Adv. Civ. Eng. 2019, 2019, 4159306. [Google Scholar] [CrossRef]
  7. Laureano, F.V.; Kwitko-Ribeiro, R.; Guimarães, L.; Leão, L.P. Mineralogical Fingerprint of Iron Ore Tailings in Paraopeba River Bedload Sediments after the B1 Dam Failure in Brumadinho, MG (Brazil). Minerals 2022, 12, 716. [Google Scholar] [CrossRef]
  8. Quaresma, V.S.; Aguiar, V.M.C.; Bastos, A.C.; Oliveira, K.S.; Vieira, F.V.; Sá, F.; Baptista Neto, J.A. The impact of trace metals in marine sediments after a tailing dam failure: The Fundão dam case (Brazil). Environ. Earth Sci. 2021, 80, 1–16. [Google Scholar] [CrossRef]
  9. do Carmo, F.F.; Kamino, L.H.Y.; Junior, R.T.; de Campos, I.C.; do Carmo, F.F.D.; Silvino, G.; da Silva Xavier de Castro, K.J.; Mauro, M.L.; Rodrigues, N.U.A.; de Souza Miranda, M.P.; et al. Fundão tailings dam failures: The environment tragedy of the largest technological disaster of Brazilian mining in global context. Perspect. Ecol. Conserv. 2017, 15, 145–151. [Google Scholar] [CrossRef]
  10. Hatje, V.; Pedreira, R.M.; de Rezende, C.E.; Schettini, C.A.F.; de Souza, G.C.; Marin, D.C.; Hackspacher, P.C. The environmental impacts of one of the largest tailing dam failures worldwide. Sci. Rep. 2017, 7, 10706. [Google Scholar] [CrossRef]
  11. de Lima, R.E.; de Lima Picanço, J.; da Silva, A.F.; Acordes, F.A. An anthropogenic flow type gravitational mass movement: The Córrego do Feijão tailings dam disaster, Brumadinho, Brazil. Landslides 2020, 17, 2895–2906. [Google Scholar] [CrossRef]
  12. Du, Z.; Ge, L.; Ng, A.H.-M.; Zhu, Q.; Horgan, F.G.; Zhang, Q. Risk assessment for tailings dams in Brumadinho of Brazil using InSAR time series approach. Sci. Total Environ. 2020, 717, 137125. [Google Scholar] [CrossRef] [PubMed]
  13. Islam, K.; Murakami, S. Global-scale impact analysis of mine tailings dam failures: 1915–2020. Glob. Environ. Chang. 2021, 70, 102361. [Google Scholar] [CrossRef]
  14. Rana, N.M.; Ghahramani, N.; Evans, S.G.; McDougall, S.; Small, A.; Take, W.A. Catastrophic mass flows resulting from tailings impoundment failures. Eng. Geol. 2021, 292, 106262. [Google Scholar] [CrossRef]
  15. Martí, J.; Riera, F.; Martínez, F. Interpretation of the Failure of the Aznalcóllar (Spain) Tailings Dam. Mine Water Environ. 2021, 40, 189–208. [Google Scholar] [CrossRef]
  16. Alonso, E.E. The Failure of the Aznalcóllar Tailings Dam in SW Spain. Mine Water Environ. 2021, 40, 209–224. [Google Scholar] [CrossRef]
  17. Alonso, E.E.; Gens, A. Aznalcóllar dam failure. Part 1: Field observations and material properties. Géotechnique 2006, 56, 165–183. [Google Scholar] [CrossRef]
  18. Gens, A.; Alonso, E.E. Aznalcóllar dam failure. Part 2: Stability conditions and failure. Géotechnique 2006, 56, 185–201. [Google Scholar] [CrossRef]
  19. Alonso, E.E.; Gens, A. Aznalcóllar dam failure. Part 3: Dynamics of the motion. Géotechnique 2006, 56, 203–210. [Google Scholar] [CrossRef]
  20. Rodríguez, R.; Muñoz-Moreno, A.; Caparrós, A.V.; Garcia-Garcia, C.; Brime-Barrios, A.; Arranz-Gonzalez, J.C.; Rodriguez-Gomez, V.; Fernandez-Naranjo, F.J.; Alcolea, A. How to Prevent Flow Failures in Tailings Dams. Mine Water Environ. 2021, 40, 83–112. [Google Scholar] [CrossRef]
  21. Clarkson, L.; Williams, D. An Overview of Conventional Tailings Dam Geotechnical Failure Mechanisms. Min. Metall. Explor. 2021, 38, 1305–1328. [Google Scholar] [CrossRef]
  22. Van Niekerk, H.J.; Viljoen, M.J. Causes and conse quences of the Merriespruit and other tailings-dam failures. Land Degrad. Dev. 2005, 16, 201–212. [Google Scholar] [CrossRef]
  23. Fourie, A.B.; Blight, G.E.; Papageorgiou, G. Static liquefaction as a possible explanation for the Merriespruit tailings dam failure. Can. Geotech. J. 2001, 38, 707–719. [Google Scholar] [CrossRef]
  24. Chandler, R.J.; Tosatti, G. The Stava tailings dams failure, Italy, July 1985. Int. J. Rock Mech. Min. Sci. Geomech. Abstr. 1996, 33, 35. [Google Scholar] [CrossRef]
  25. Vick, S.G. Tailings dam failure at Omai in Guyana. Min. Eng. 1996, 48, 34–37. [Google Scholar]
  26. Villavicencio, G.; Espinace, R.; Palma, J.; Fourie, A.; Valenzuela, P. Failures of sand tailings dams in a highly seismic country. Can. Geotech. J. 2014, 51, 449–464. [Google Scholar] [CrossRef]
  27. Dobry, R.; Alvarez, L. Seismic failures of Chilean tailings dams. J. Soil Mech. Found. Div. 1967, 93, 237–260. [Google Scholar] [CrossRef]
  28. Harder, L.F.; Stewart, J.P. Failure of Tapo Canyon tailings dam. J. Perform. Constr. Facil. 1996, 10, 109–114. [Google Scholar] [CrossRef]
  29. Glotov, V.E.; Chlachula, J.; Glotova, L.P.; Little, E. Causes and environmental impact of the gold-tailings dam failure at Karamken, the Russian Far East. Eng. Geol. 2018, 245, 236–247. [Google Scholar] [CrossRef]
  30. Ahmad, M.; Hu, J.-L.; Hadzima-Nyarko, M.; Ahmad, F.; Tang, X.-W.; Rahman, Z.U.; Nawaz, A.; Abrar, M. Rockburst Hazard Prediction in Underground Projects Using Two Intelligent Classification Techniques: A Comparative Study. Symmetry 2021, 13, 632. [Google Scholar] [CrossRef]
  31. Yang, X.-L.; Wei, J.-J. Analytical approach for stability of 3D two-stage slope in non-uniform and unsaturated soils. Eng. Geol. 2021, 292, 106243. [Google Scholar] [CrossRef]
  32. Ahmad, M.; Katman, H.Y.; Al-Mansob, R.A.; Ahmad, F.; Safdar, M.; Alguno, A.C. Prediction of Rockburst Intensity Grade in Deep Underground Excavation Using Adaptive Boosting Classifier. Complexity 2022, 2022, 6156210. [Google Scholar] [CrossRef]
  33. Yang, X.-L.; Wei, J.-J. Seismic stability for reinforced 3D slope in unsaturated soils with pseudo-dynamic approach. Comput. Geotech. 2021, 134, 104124. [Google Scholar]
  34. Yang, X.L.; Yin, J.H. Slope stability analysis with nonlinear failure criterion. J. Eng. Mech. 2004, 130, 267–273. [Google Scholar] [CrossRef]
  35. Zandarín, M.T.; Oldecop, L.A.; Rodríguez, R.; Zabala, F. The role of capillary water in the stability of tailing dams. Eng. Geol. 2009, 105, 108–118. [Google Scholar] [CrossRef]
  36. Yu, D.; Tang, L.; Ye, F.; Chen, C. A virtual geographic environment for dynamic simulation and analysis of tailings dam failure. Int. J. Digit. Earth 2021, 14, 1212. [Google Scholar] [CrossRef]
  37. Lazarim, T.P.; de Souza Júnior, T.F.; Teixeira, S.H.C.; Mohseni, A.P.V. A Method for Estimating the Area Covered by Tailings in a Dam Failure Scenario. Geotech. Geol. Eng. 2022, 40, 483–498. [Google Scholar] [CrossRef]
  38. Dedring, T.; Graw, V.; Thygesen, K.; Rienow, A. Validation of an Empirical Model with Risk Assessment Functionalities to Simulate and Evaluate the Tailings Dam Failure in Brumadinho. Sustainability 2022, 14, 6681. [Google Scholar] [CrossRef]
  39. Williams, D.J. Lessons from Tailings Dam Failures—Where to Go from Here? Minerals 2021, 11, 853. [Google Scholar] [CrossRef]
  40. Yin, G.; Li, G.; Wei, Z.; Wan, L.; Shui, G.; Jing, X. Stability analysis of a copper tailings dam via laboratory model tests: A Chinese case study. Miner. Eng. 2011, 24, 122–130. [Google Scholar] [CrossRef]
  41. Yao, C.; Wu, L.; Yang, J.; Xiao, L.; Liu, X.; Jiang, Q.; Zhou, C. Influences of Tailings Particle Size on Overtopping Tailings Dam Failures. Mine Water Environ. 2021, 40, 174–188. [Google Scholar] [CrossRef]
  42. Wu, S.; Cai, H.; Xiao, J.; Du, J.; Yan, J.; Liu, C.; Zheng, B. Experimental study on discharge impact characteristics induced by piping failure of tailings dam. Arab. J. Geosci. 2021, 14, 2054. [Google Scholar]
  43. Tian, S.; Dai, X.; Wang, G.; Lu, Y.; Chen, J. Formation and evolution characteristics of dam breach and tailings flow from dam failure: An experimental study. Nat. Hazards 2021, 107, 1621–1638. [Google Scholar] [CrossRef]
  44. Wu, T.; Qin, J. Experimental Study of a Tailings Impoundment Dam Failure Due to Overtopping. Mine Water Environ. 2018, 37, 272–280. [Google Scholar] [CrossRef]
  45. Zhang, L.-T.; Qi, Q.-L.; Li, Q.; Zhang, S.; Liu, Y.B. Experimental model study on dam break and evolution law of tailings pond. J. Hydraul. Eng. 2016, 47, 229–235. (In Chinese) [Google Scholar]
  46. Lin, S.-Q.; Wang, G.-J.; Liu, W.-L.; Zhao, B.; Shen, Y.-M.; Wang, M.-L.; Li, X.-S. Regional Distribution and Causes of Global Mine Tailings Dam Failures. Metals 2022, 12, 905. [Google Scholar] [CrossRef]
  47. Lv, C.; Bi, R.; Guo, X.; Chen, D.; Guo, Y.; Xu, Z. Erosion characteristics of different reclaimed substrates on iron tailings slopes under simulated rainfall. Sci. Rep. 2020, 10, 4275. [Google Scholar] [CrossRef]
  48. Sun, Y.; Gu, X.; Xu, X. Experimental Study on Hydraulic Erosion Characteristics of Ecological Slope of Tailings Reservoir under Rainfall. KSCE J. Civ. Eng. 2021, 25, 2426–2436. [Google Scholar] [CrossRef]
  49. Guang-Jin, W.; Jing-Wen, K.; Chao, D.; Yong-Jun, T.; Xiang-Yun, K. Study on tailings dam over-topping failure model test and break mechanism under the rainfall condition. Tech. Gaz. 2017, 24, 1897–1904. [Google Scholar]
  50. Hu, W.; Xin, C.; Li, Y.; Zheng, Y.; van Asch, T.; McSaveney, M. Instrumented flume tests on the failure and fluidization of tailings dams induced by rainfall infiltration. Eng. Geol. 2021, 294, 106401. [Google Scholar] [CrossRef]
  51. Zuo, Z.-B.; Zhang, L.-L.; Wang, J.-H. Model tests on rainfall-induced colluvium landslides: Effects of particle-size distribution. Chin. J. Geotech. Eng. 2015, 37, 1319–1327. (In Chinese) [Google Scholar]
  52. Shen, S.; Sun, H.; Shang, Y.; Zhong, J.; Huang, J. Scouring-penetration coupling analysis of embankment slope under rainfall action. Chin. J. Rock Mech. Eng. 2011, 30, 2456–2462. (In Chinese) [Google Scholar]
  53. Wu, Q.; Wang, C.-M.; Song, P.R.; Zhu, H.-B.; Ma, D.-H. Rainfall erosion experiment for steep loess slope and fluid-soil coupling simulation with PFC3D. Rock Soil Mech. 2014, 35, 977–985. (In Chinese) [Google Scholar]
  54. Guo, Z.; Torra, O.; Hürlimann, M.; Abancó, C.; Medina, V. FSLAM: A QGIS plugin for fast regional susceptibility assessment of rainfall-induced landslides. Environ. Model. Softw. 2022, 150, 105354. [Google Scholar] [CrossRef]
Figure 1. Particles grading curve of fly ash.
Applsci 12 09404 g001
Figure 2. Model test system: (a) test system; (b) model box.
Applsci 12 09404 g002
Figure 3. Pressure measuring pipes buried in the dam.
Applsci 12 09404 g003
Figure 4. Measuring points of saturation line and settlement in the dam; (a) slope ratio 1:2, 1~5 were the pressure measuring pipes, D1-1 and D1-2 were the settlement observation positions; (b) slope ratio 1:3, 1~5 were the pressure measuring pipes, D2-1 and D2-2 were the settlement observation positions.
Applsci 12 09404 g004
Figure 5. Time-dependent relationship of saturation lines in the dams; (a) slope ratio 1:2; (b) slope ratio 1:3.
Applsci 12 09404 g005aApplsci 12 09404 g005b
Figure 6. Relationship of settlement over time; (a) slope ratio 1:2; (b) slope ratio 1:3.
Applsci 12 09404 g006aApplsci 12 09404 g006b
Figure 7. Retrogressive landslide caused by multi-stage local-sliding. (a) Gullies appearance on dam-slope surface after 1 h 34 min. (b) Gullies development on dam-slope surface after 2 h 6 min. (c) Flow slide at dam-slope toe after 2 h 12 min. (d) First sliding failure after 2 h 23 min. (e) Second sliding failure after 2 h 28 min. (f) Third sliding failure after 2 h 31 min. (g) Fourth sliding failure after 2 h 33 min. (h) Fifth sliding failure after 2 h 35 min. (i) Final sliding failure (test termination after 2 h 37 min).
Applsci 12 09404 g007
Figure 8. Progressive erosion failure mode by runoff erosion and flow-slide damage. (a) Gullies’ development after 1 h 19 min. (b) Gullies’ development after 1 h 50 min. (c) First flow-slide failure after 2 h 32 min. (d) Second flow-slide failure after 2 h 35 min. (e) Third flow-slide failure after 2 h 42 min. (f) Transverse crack 3 on the top after 2 h 46 min. (g) Local sliding after 2 h 55 min. (h) Final failure mode (test termination after 2 h 58 min).
Applsci 12 09404 g008aApplsci 12 09404 g008b
Figure 9. Overall-sliding failure. (a) Cracks appeared after 2 h 5 min. (b) Gullies appeared after 2 h 13 min. (c) Gullies’ development and sliding deformation appeared after 2 h 55 min. (d) Overall sliding occurs after 3 h 28 min (test termination). (e) Final sliding failure (from side view).
Applsci 12 09404 g009
Figure 10. Progressive erosion failure mode mainly by runoff erosion. (a) Gullies appeared after 1 h 55 min. (b) Gullies’ development after 2 h 10 min. (c) Gullies’ development after 2 h 55 min (test termination).
Applsci 12 09404 g010
Figure 11. Backward failure caused by multilevel local-sliding damage; (a) the shallow sliding trend forms; (b) the first shallow sliding; (c) subsequent shallow sliding.
Applsci 12 09404 g011
Figure 12. Progressive erosion failure by runoff erosion and flow-slide; (a) runoff erosion; (b) local flow-slide; (c) runoff erosion and local flow-slide.
Applsci 12 09404 g012
Figure 13. Overall sliding failure process; (a) runoff erosion; (b) overall sliding.
Applsci 12 09404 g013
Figure 14. The evolution of failure mechanism during dam slope failure: (a) S1; (b) S2; (c) S3; (d) S4.
Applsci 12 09404 g014aApplsci 12 09404 g014b
Table 1. Physical and mechanical parameters of the fly ash and gravel.
Soil TypeDry Density
(g·cm−3)
Permeability Coefficient
(m·s−1)
Cohesive Strength
(kPa)
Angle of Internal
Friction (°)
fly ash1.032.5 × 10−51.8628
gravel2.21.00 × 10−3035
Table 2. Test conditions.
Condition’s
Name
Outer Slope Ratio of the Dam SlopeTotal Height
of Dam Slope (cm)
Initial Dam Height
(cm)
Rainfall Intensity
(mm·h−1)
Length of the Dry Beach (cm)Test Conditions
S11:250101760First, a stable seepage field was formed in the fly-ash dam, and then rainfall began.
S21:350101710First, a stable seepage field was formed in the fly-ash dam, and then rainfall began.
S31:2501017/Dry-stack, direct rainfall.
S41:3501017/Dry-stack, direct rainfall.
Table 3. Failure characteristics.
No.Failure ModeIs There a Sliding SurfaceMaximum Depth of the Failure Surface (cm)Characteristics of Failure Surface
S1Retrogressive landslide caused by multi-stage local-slidingYes10Shallow
S2Progressive erosion failure mode by runoff erosion and flow-slide damageNO--
S3Overall-sliding failureYes(arc)18Deep
S4Progressive erosion failure mode mainly by runoff erosionNO--
Publisher’s Note: MDPI stays neutral with regard to jurisdictional claims in published maps and institutional affiliations.

