1. Introduction
The analysis of vibrations including contact is a demanding requirement in the field of industrial applications. A few methods of vibrations analysis exist, including non-linearity in the form of contact, which can be separated into two main groups: frequency domain and time domain analysis.
For frequency domain analysis, the following might be listed: the Harmonic Balance Method described in [
1,
2,
3,
4] and its modifications based on force response [
5], or the System DOF reduction described in [
6,
7,
8]. Other methods used in the frequency domain are the energy conservation schemes described in [
9,
10]. In specific problems such as turbomachinery blades, a non-linear modal analysis was proposed [
11]. All of those methods are applied or are for simple geometrical cases, or are relatively difficult to apply in industrial usage, because of the truncated Fourier expansion used for the frequency domain for each DOF, which would produce extremely large models [
12].
As a specific type of solution for the situation of vibrations with contact is the linearization of a model, which is used for beams with cantilever-Hertzian contact vibrations, as described in [
13,
14,
15,
16]. However, these simplifications, always taking into account closed contact, are applicable only for specific cases, as presented in those papers.
The time domain methods that can be pointed out for solving the problem are based on the full solution of dynamic equations including interactions, such as contacts, and their simplifications. The full solution for dynamic equations has been shown in many cases to be very accurate. In addition, some of the research has been completed in that field for delaminated sandwich-composite panels to simulate the behavior of a delaminated area subjected to vibrations, including surface contact [
17].
In addition, for that group, there are modifications of the method that use both the time and frequency domain shown in [
18].
Finite Element (FE) codes, widely used in industry, have no implementation on frequency domain methods except for classical modal analysis, and only the time domain solution is available for use in engineering to include contact in vibrations. The explicit solution of dynamics shown in [
16] also has some limitations for large models. The Courant criterion enforces a very short time step which will lead to a huge number of steps [
19], which increases the integration error or limits the simulation to short-time events.
Three main approaches could be observed to obtain resonance frequencies of the system in practice. The first is by neglecting contact and performing simulation, in the way that contact was always opened [
20,
21]. Second, where simplification for modal analysis is completed, in a way similar to contact being always closed [
22,
23,
24,
25]. A third approach is to simulate a situation between the two mentioned springs and springs are added to contact to introduce additional stiffness, based on earlier experimental tests; however, the method requires earlier physical testing which is impractical in many solutions.
To study how resonance frequency reacts to the introduction of contact to the system, a cantilever beam was carried out with usage of an implicit dynamics solution. The implicit algorithm was selected over the explicit algorithm due to no problems with tiny time-stepping or simulation time limitation.
With the extracted characteristic of resonance frequency to contact length dependence, a simplified method of prediction was proposed, using modal analysis.
2. Approach to Estimation Method
Classical modal analysis in usage for cases where contact exists leads to one of two approaches: neglect the contact [
20,
21] or fixed edge of the contact like it was all the time closed [
22,
23,
24,
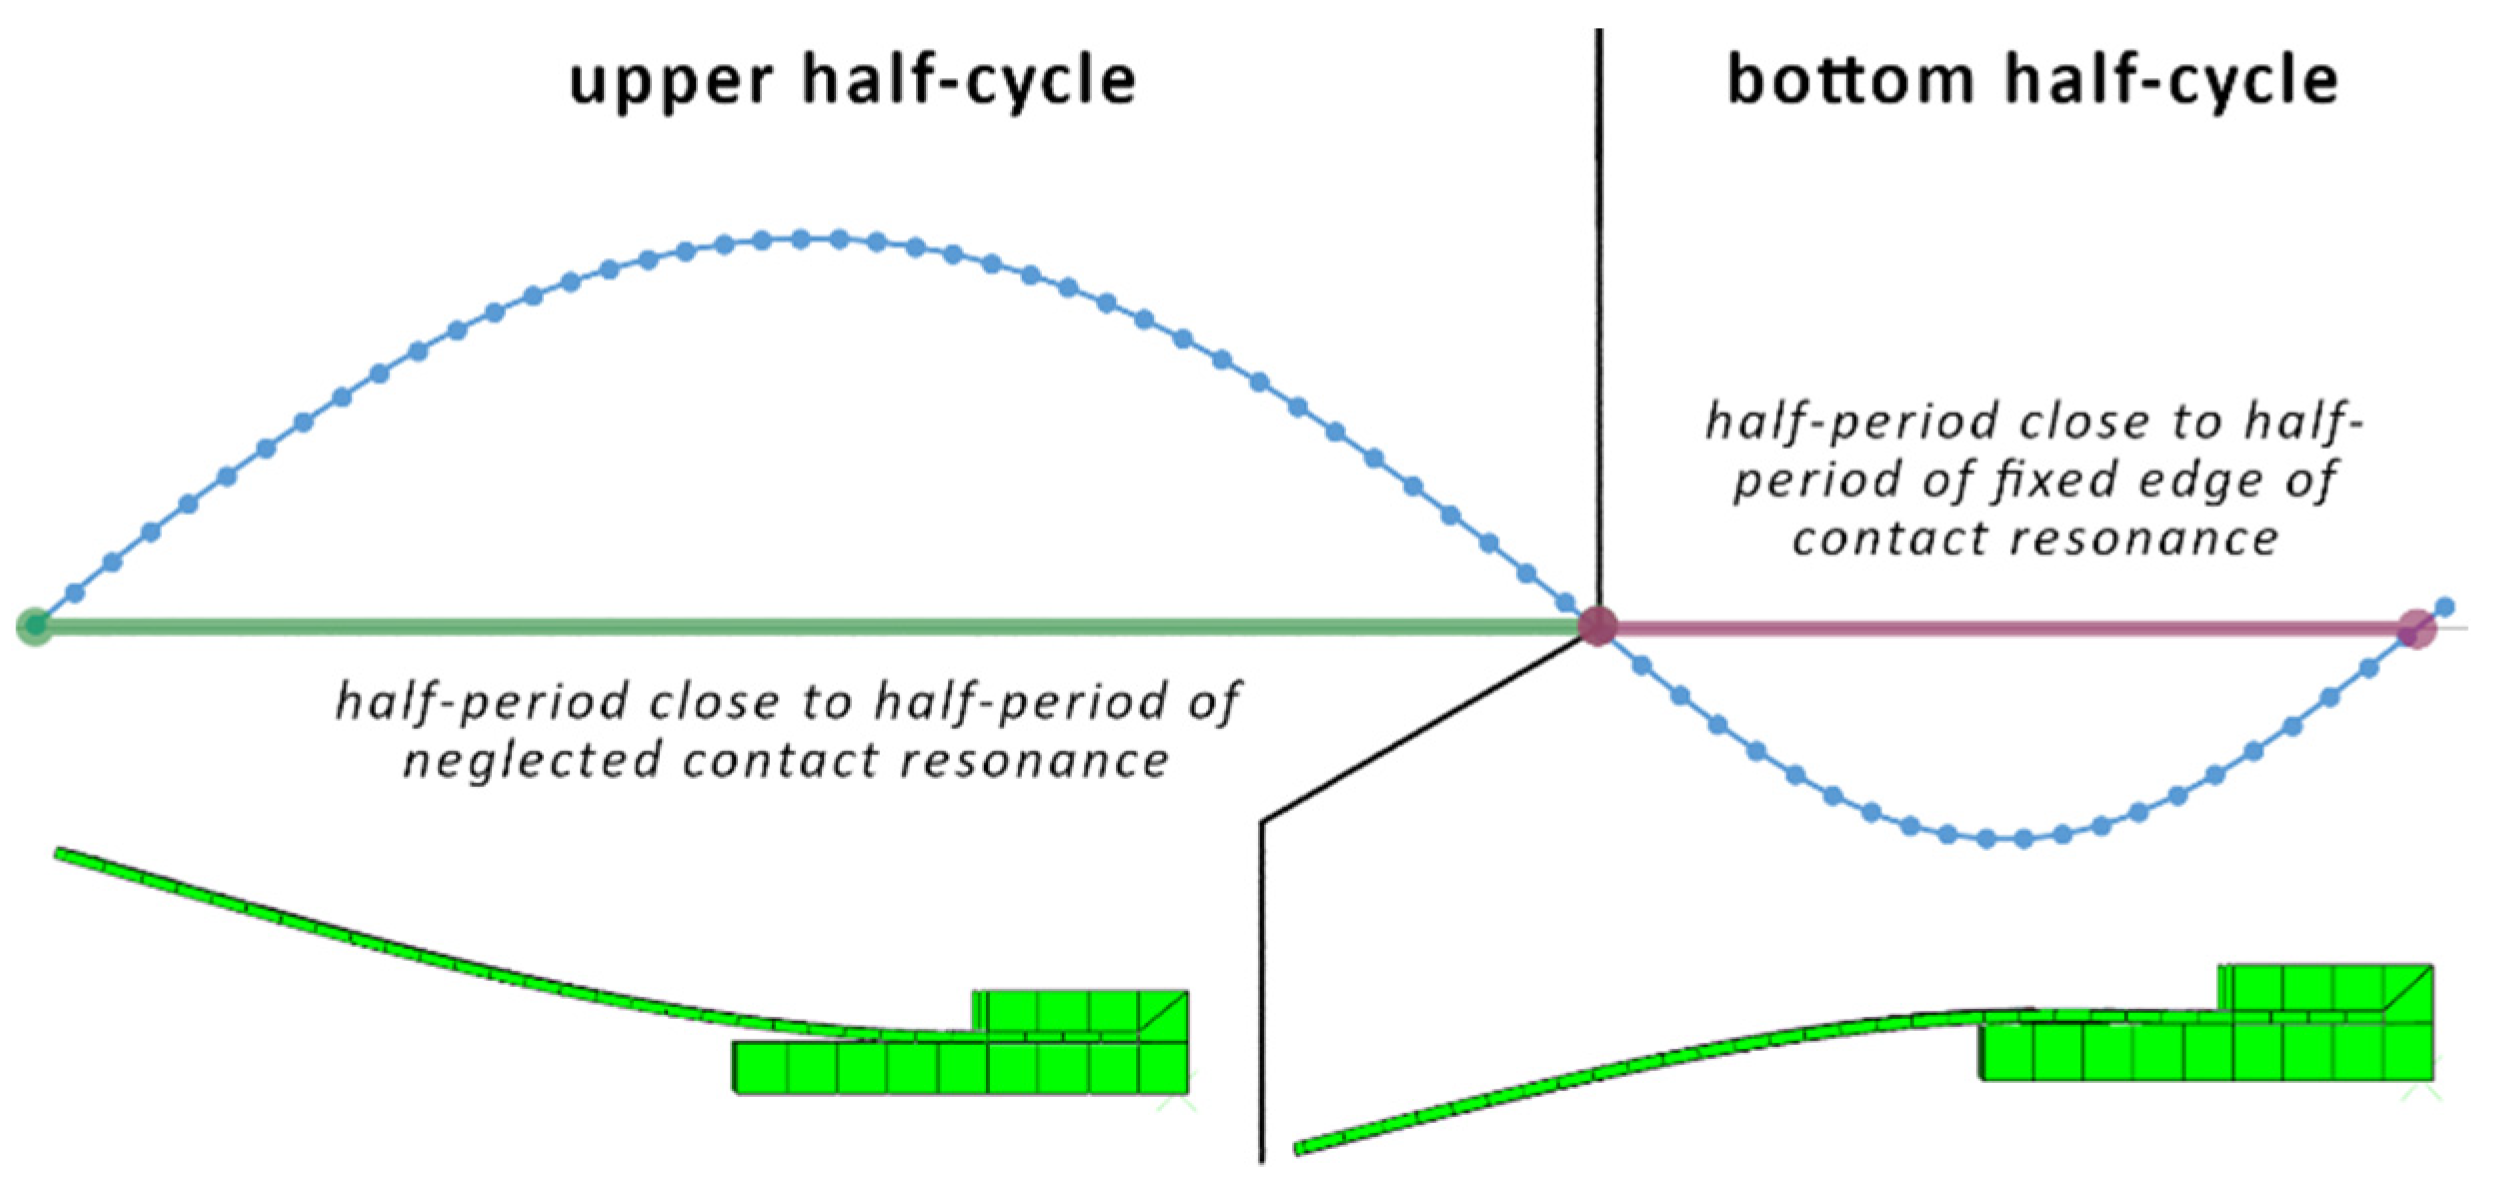
25]. For the specimen considered in this paper, it can be observed, that the actual resonance frequency occurs between values of both approaches.
The closer look at the response of the vibration in the resonance verified by non-linear dynamics shows that a full vibration cycle is built out of the lower half-cycle part (while the contact is closed) and the upper half-cycle part (while the contact is open). The lower half-cycle frequency is close to the frequency calculated by modal analysis with a fixed edge of the contact, while the upper half-cycle resonance frequency is equal to the one calculated by modal analysis with neglected contact.
Based on that knowledge, the idea appeared to create an expression that will use both approaches of modal analysis to calculate, based on the resonance frequency values gained in both analyses, the resonance frequency that will appear in reality. The illustration of one period of non-linear response with both half-cycles’ conception is shown in
Figure 1.
The method that allows for the estimation of the resonance frequency of the system with usage of only linear modal analysis would be a very useful tool for engineers in industrial applications because of the simplicity, low resource demands compared to non-linear dynamics, and easily accessible by well-known FEA codes, in contrast to the methods listed in the first paragraph.
The main rule for the formula is to use both of the analysis half-cycle period times, collected by linear modal analysis, and to introduce a parameter related to the contact length to compensate for the error. To omit the contact length as a direct parameter—which is influenced by geometry—the parameter that represents the stiffening of the system by contact is introduced as the ratio of the resonance frequency of the system extracted with modal analysis with a fixed contact edge (fe) to the resonance frequency of the system extracted with modal analysis with neglected contact (f0).
3. Vibrations Research with Numerical Simulations
For a detailed look at how systems behave during vibration with contact, the numerical simulation method was selected as the main tool of the preliminary investigation. To accurately include the contact phenomenon, it was mandatory to use full dynamic simulation. Because accuracy was a priority in the simulations, the implicit algorithm was selected over the explicit algorithm. For the preliminary tests, a flat rectangle specimen with a straight edge of contact was selected.
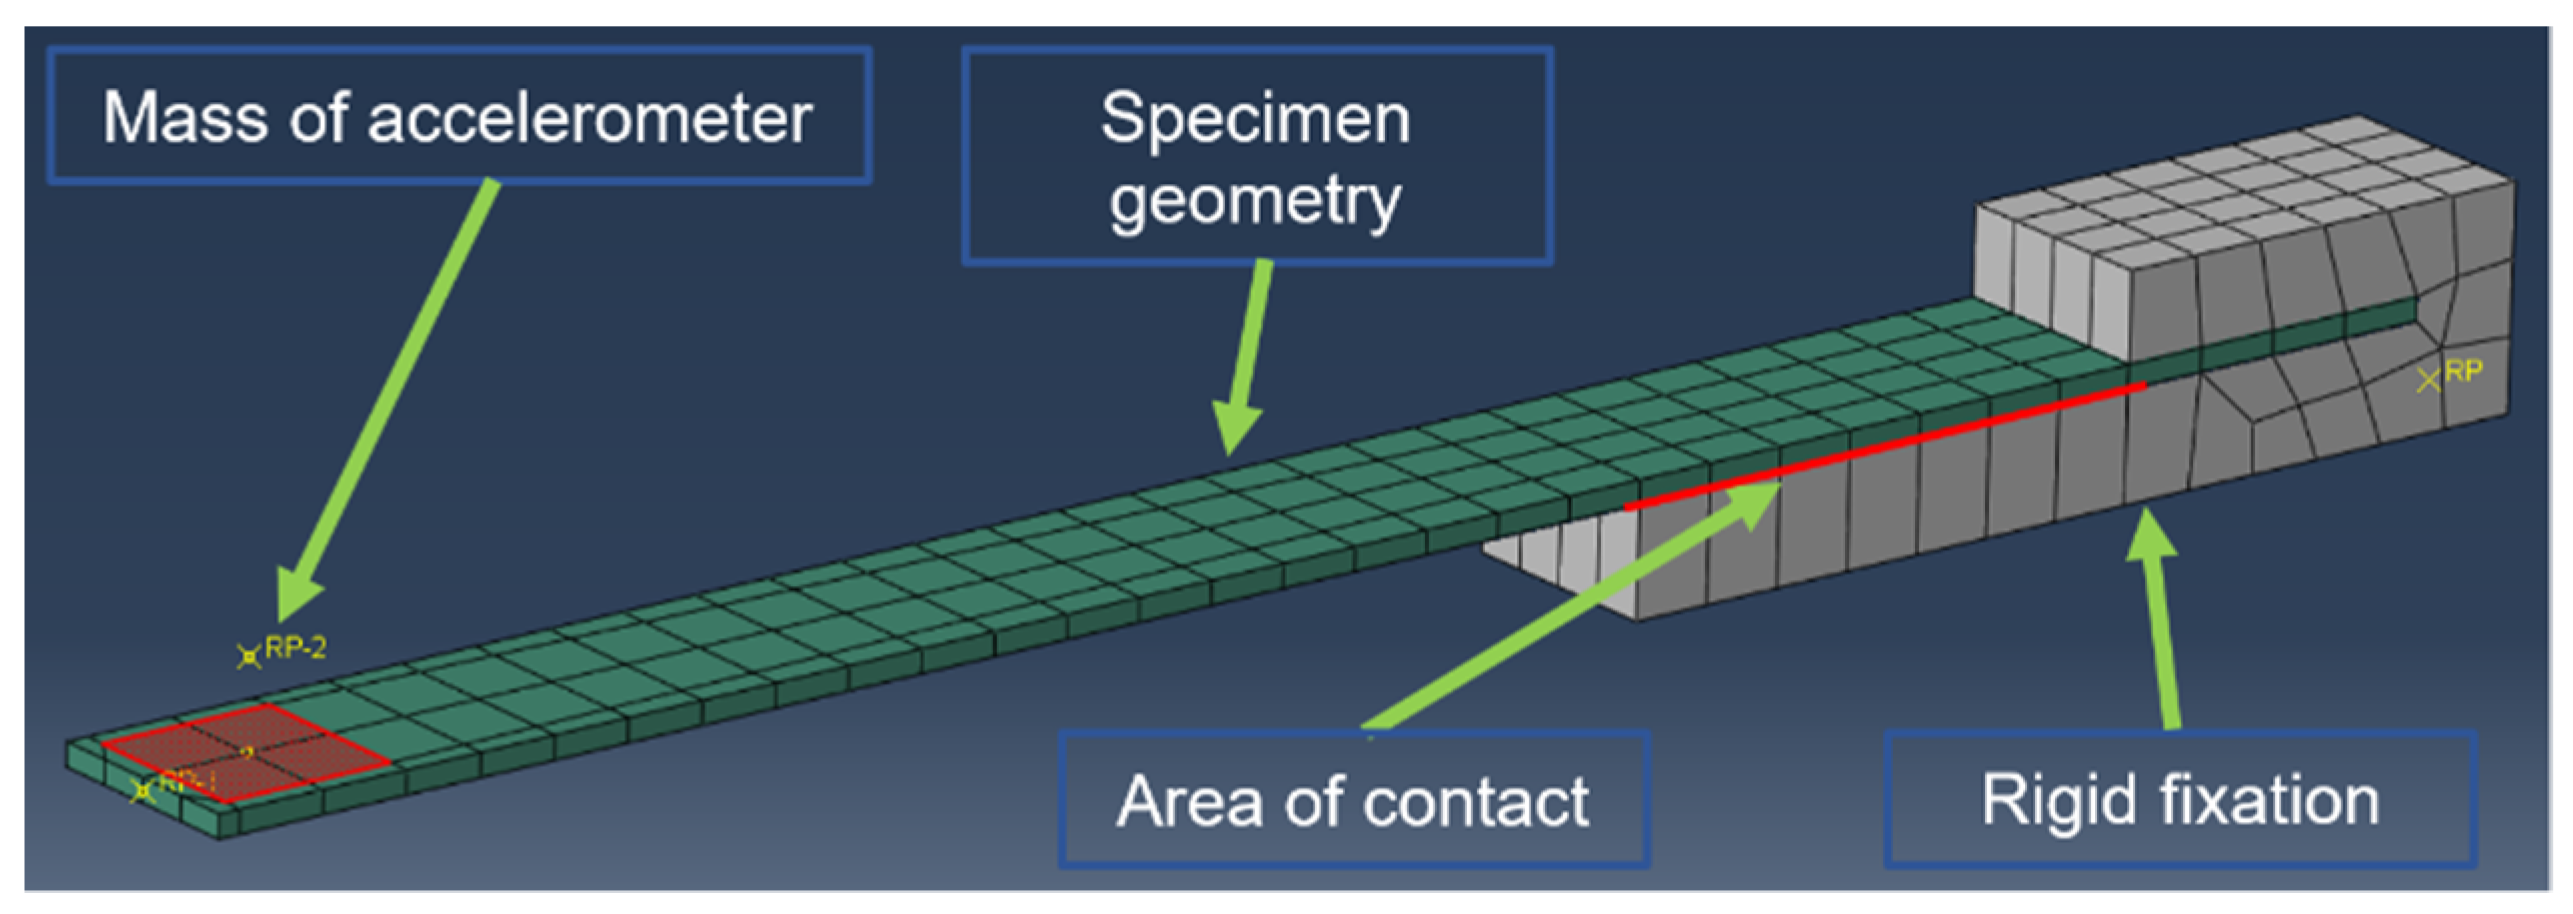
The model built for analysis was made out of continuous shell elements fixed to the rigid clamp with an introduced area of contact. Additionally, a mass point was included to represent the accelerometer mass and allow for future repeating of the simulation in experimental tests. The model is presented in
Figure 2.
The simulation was following the tip of the specimen, where the accelerometer mass point was attached, and had an enforced displacement of 20 mm in the first step. The second step of the simulation was to release the enforced displacement. The specimen then started to vibrate at natural frequencies. The displacement of the accelerometer point in time was recorded. For the described simulation, Abaqus 2018 was used, with a nonlinear implicit dynamics algorithm, taking into account the contact and geometrical nonlinearity. The CFRP specimen was modelled with Continuum Shell-layered elements, and the accelerometer was modelled as single node mass, connected to the specimen with rigid elements. In addition, the fixation was modelled with discrete rigid elements. For contact, the definition penalization algorithm was used with a friction coefficient of value f = 0.2. To analyze the resonance frequency of the system, a Python script was created to apply a fast Fourier transform on the displacement- time characteristic.
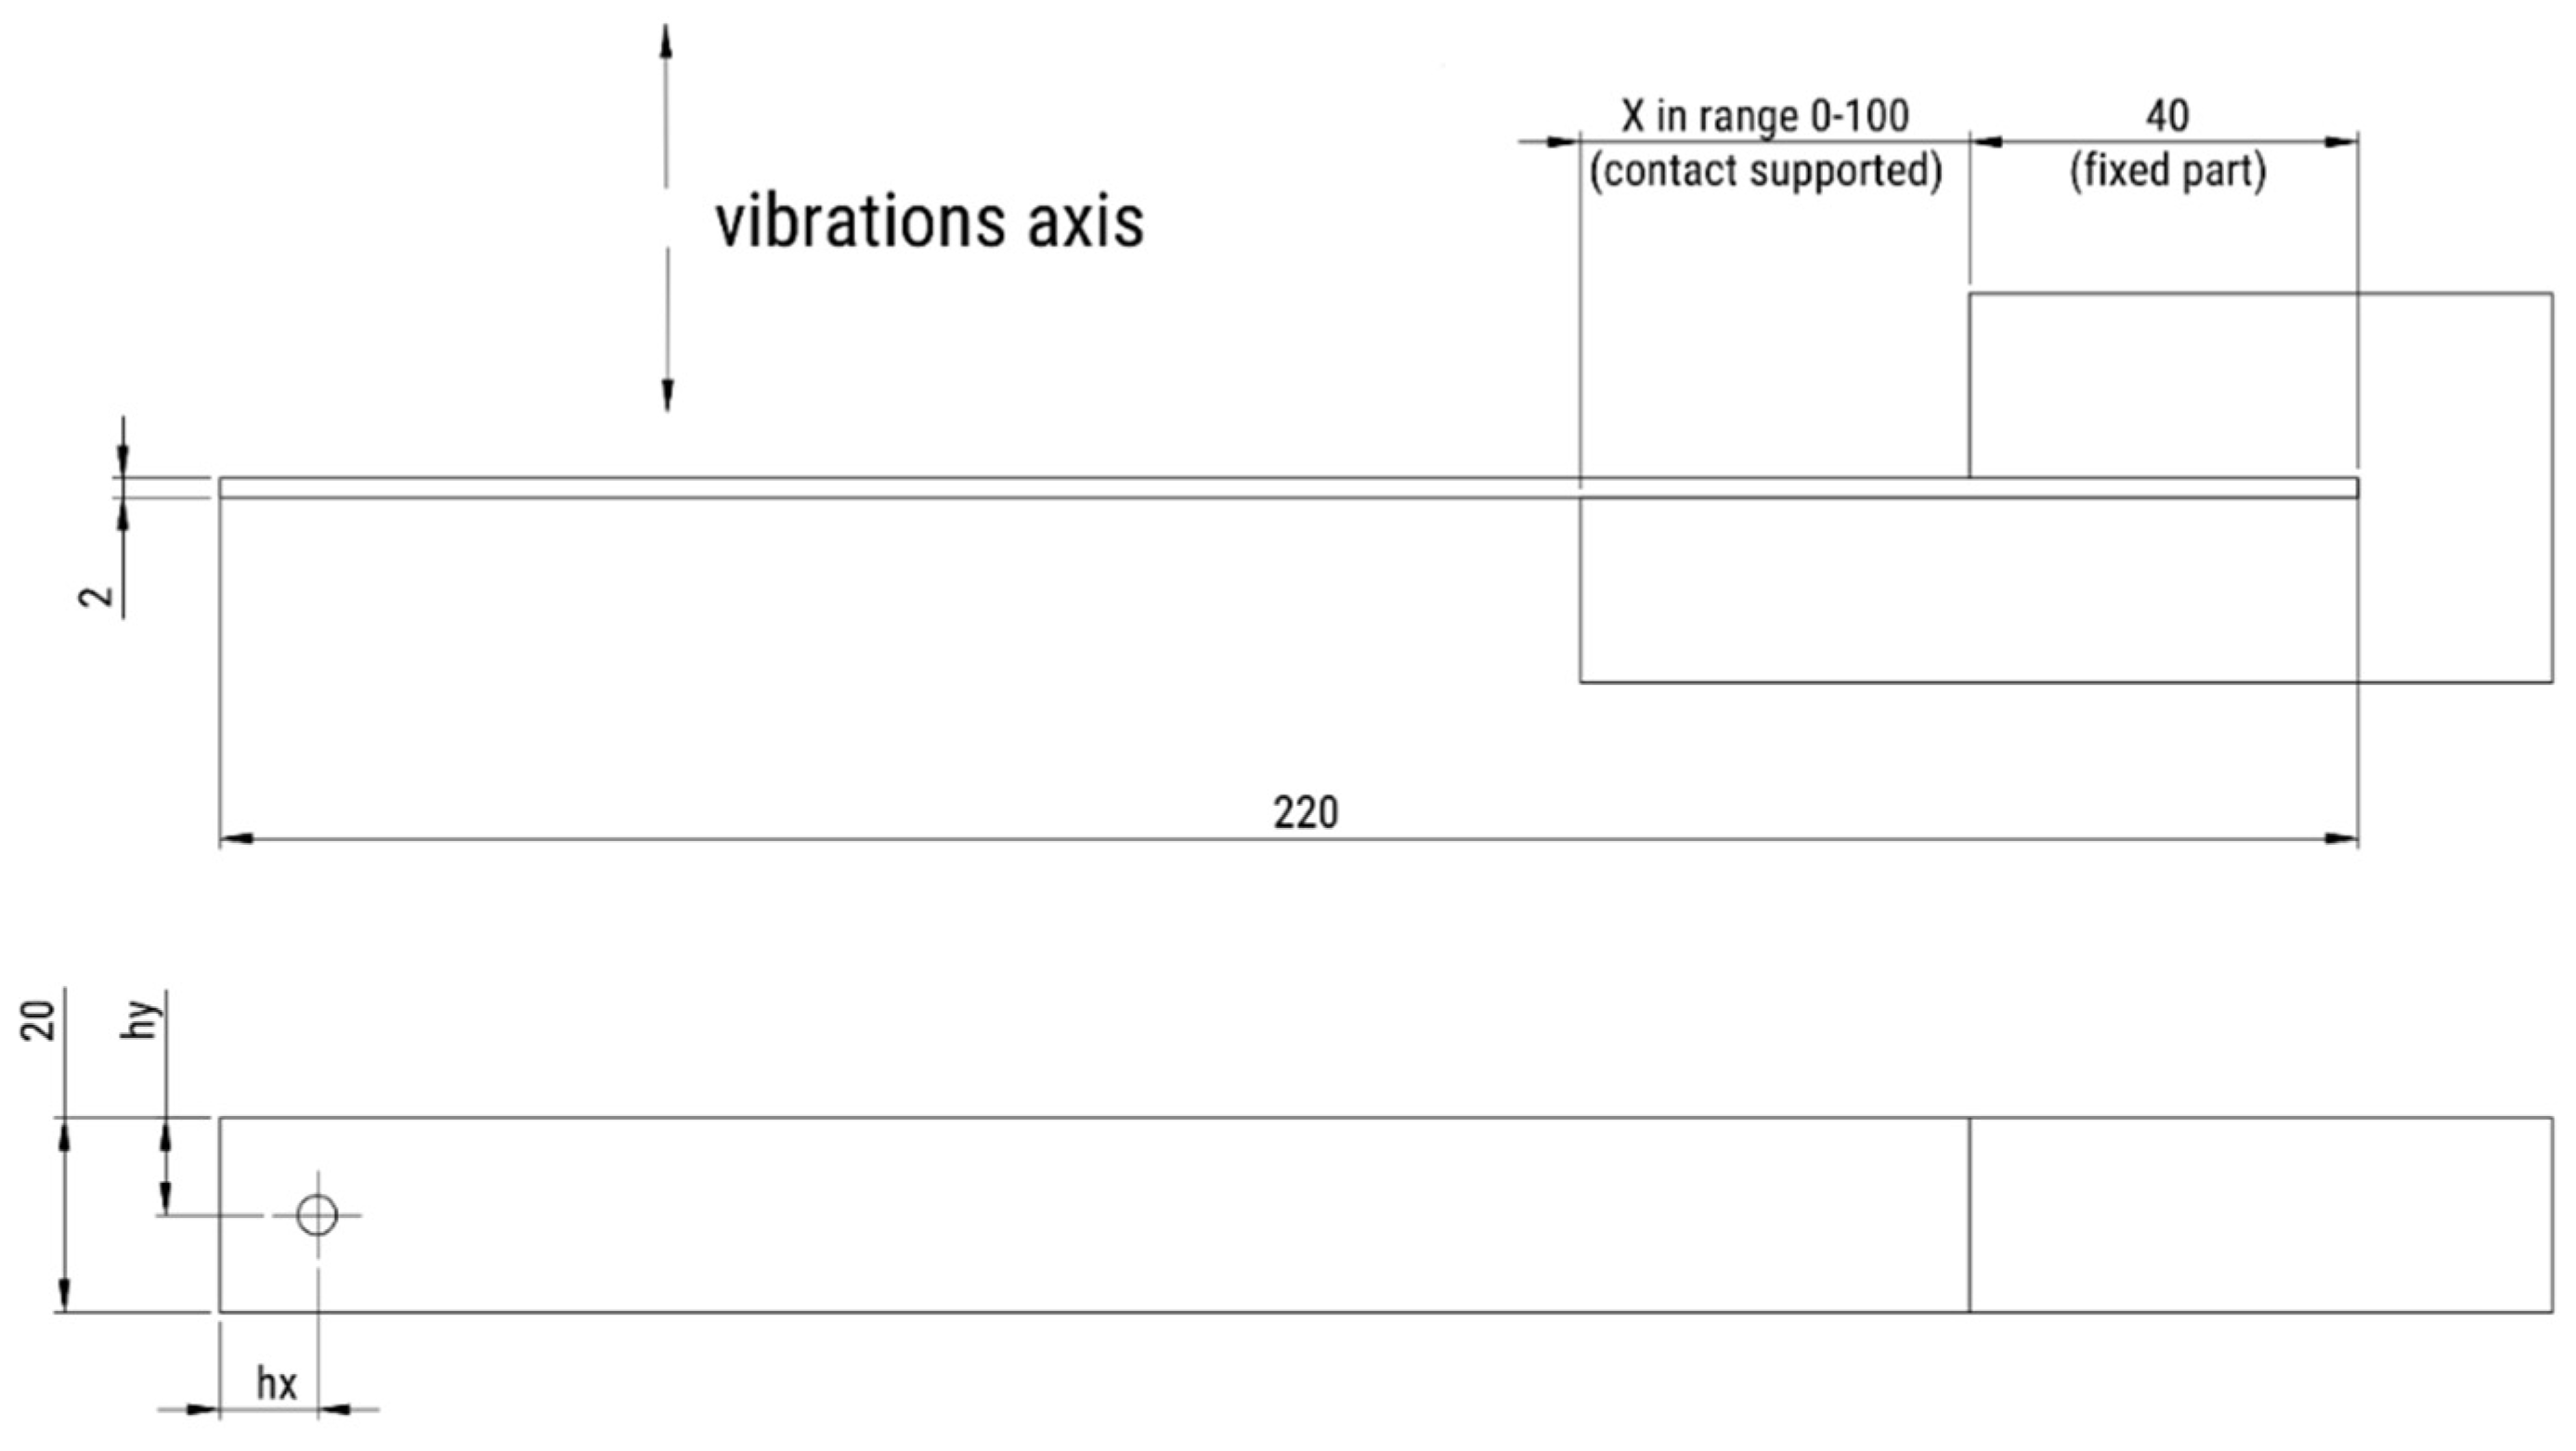
For research purposes, a flat rectangle specimen geometry was selected as an object of investigation. The dimensions of the specimen were 220 × 20 mm with 2 mm thickness. The specimen material was 10 plies of carbon fiber twill weave composite with 0/90 layup. The specimen was fixed at 40 mm length.
Additionally, for the experimental tests a hole in the free end of the specimen was introduced to attach additional mass as a parameter. The two masses that were included to change the resonance frequency of the system were 7.6 g and 9.7 g.
The mechanical properties of the material were evaluated in the static tensile strength test for three manufactured pieces. The values of the properties are collected in
Table 1.
The exact placement of the holes in the samples is described in
Table 2 as parameters hx—longitude distance from end of the sample, hy—side distance from end of the specimen.
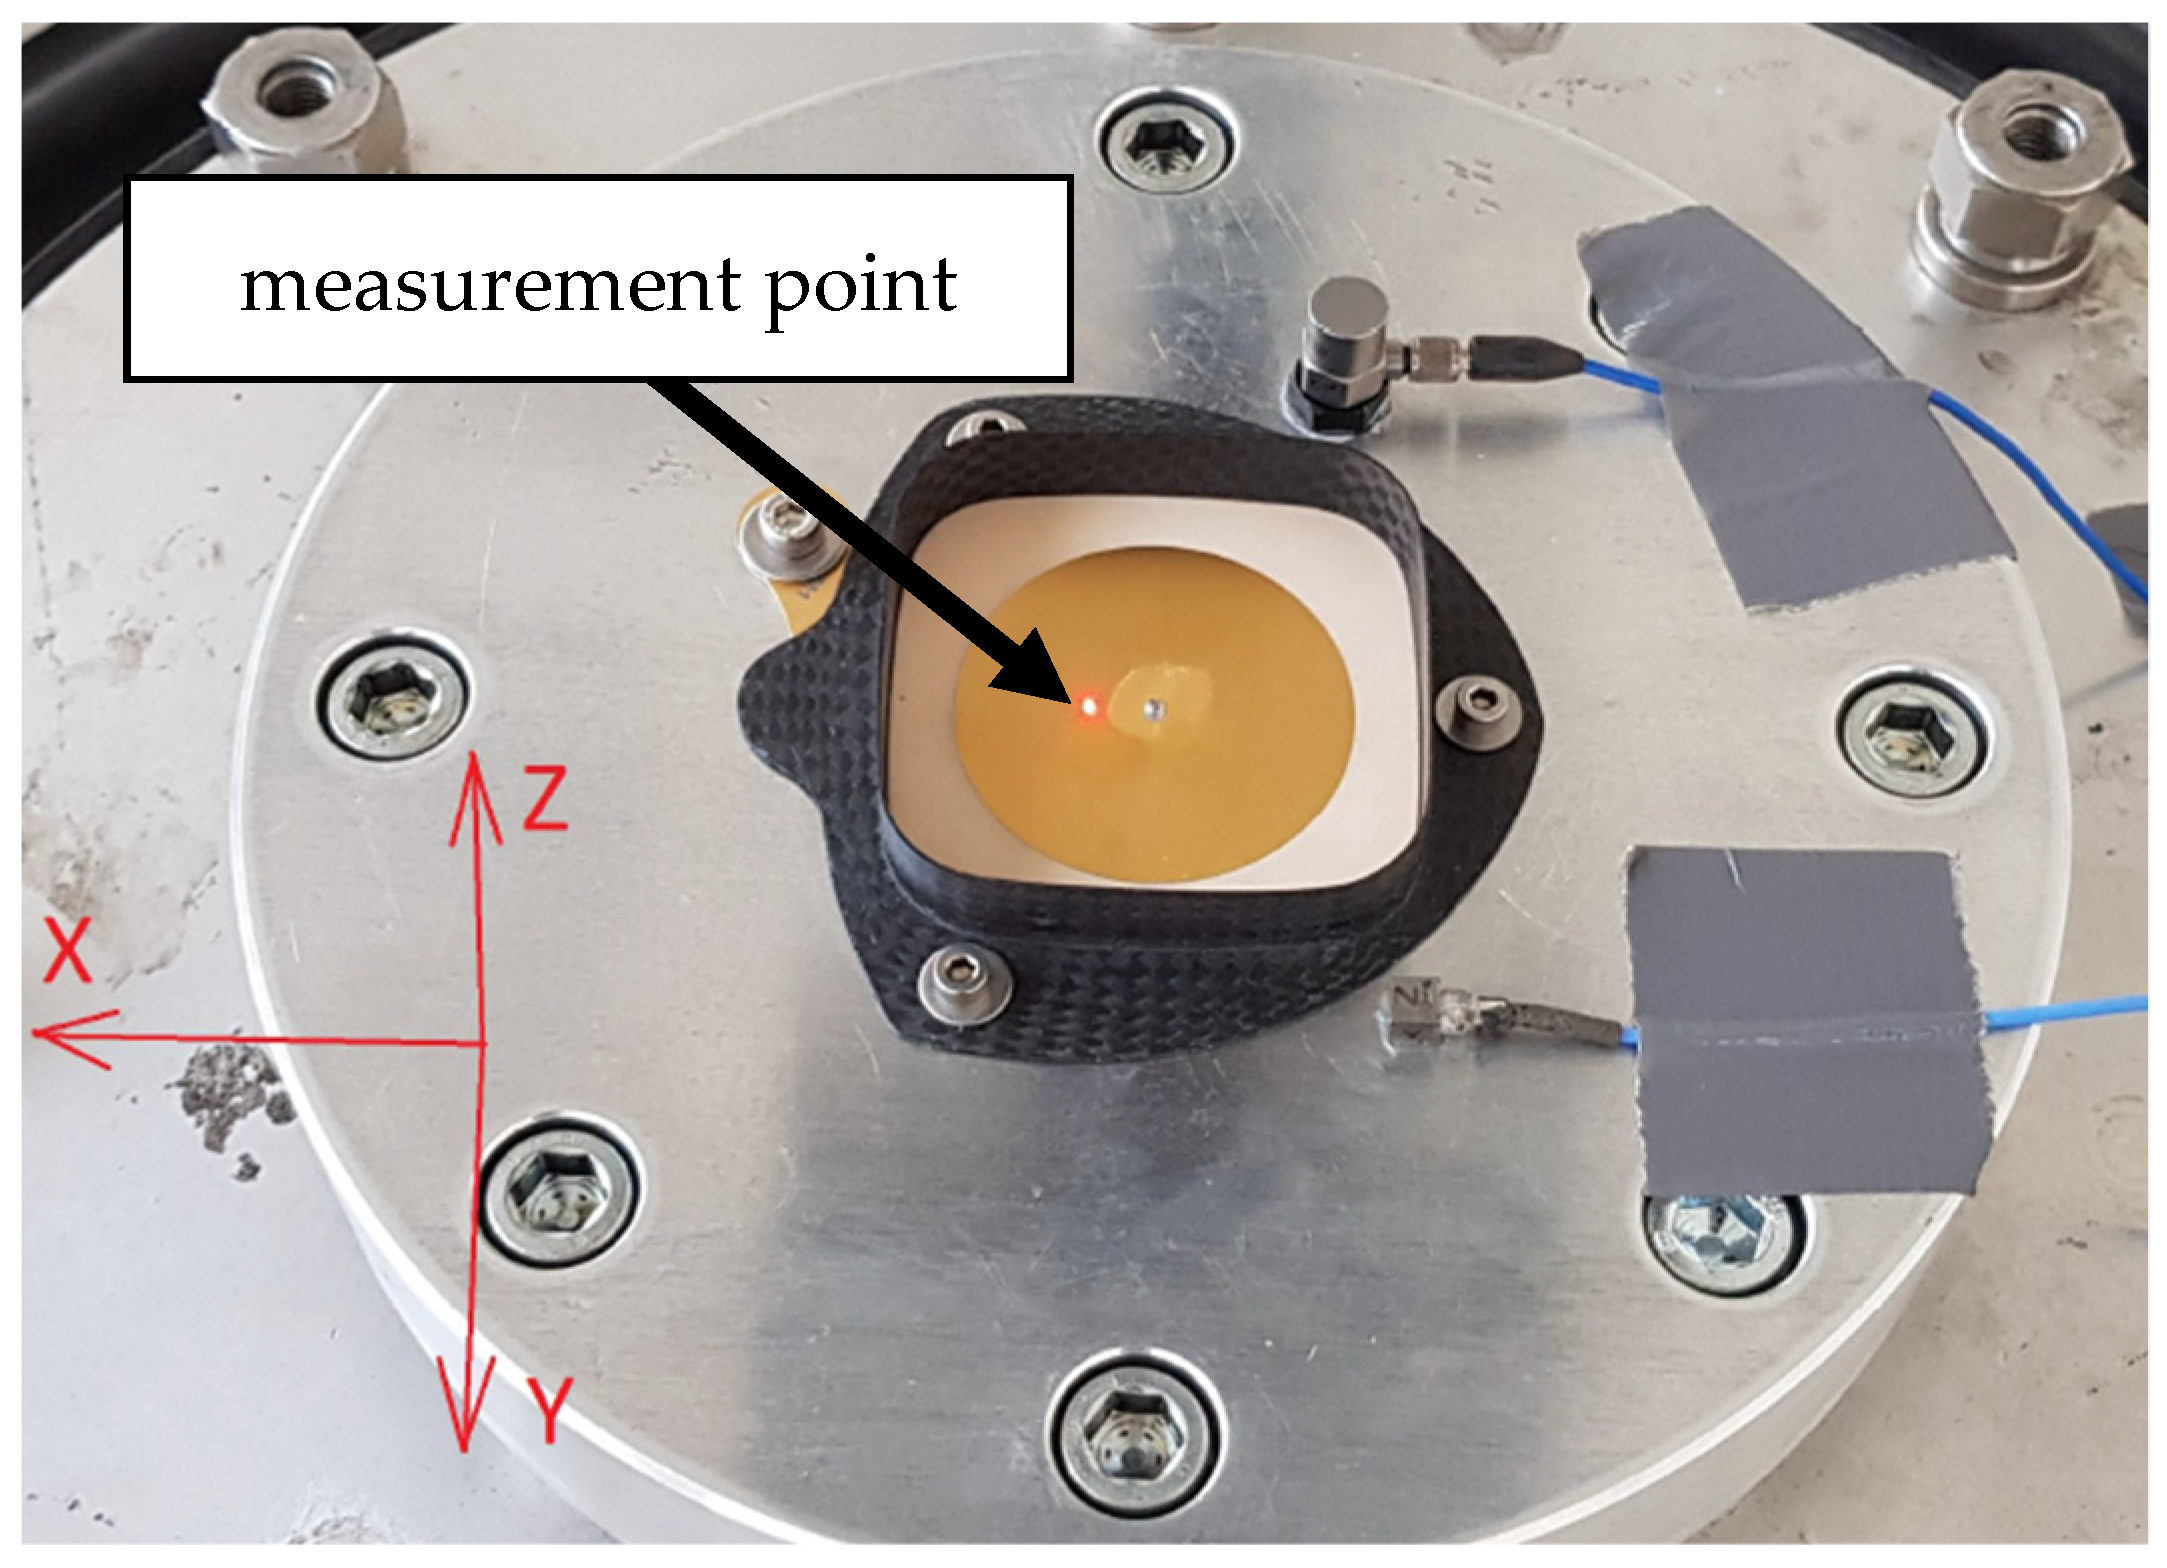
The described setup is presented in
Figure 3.
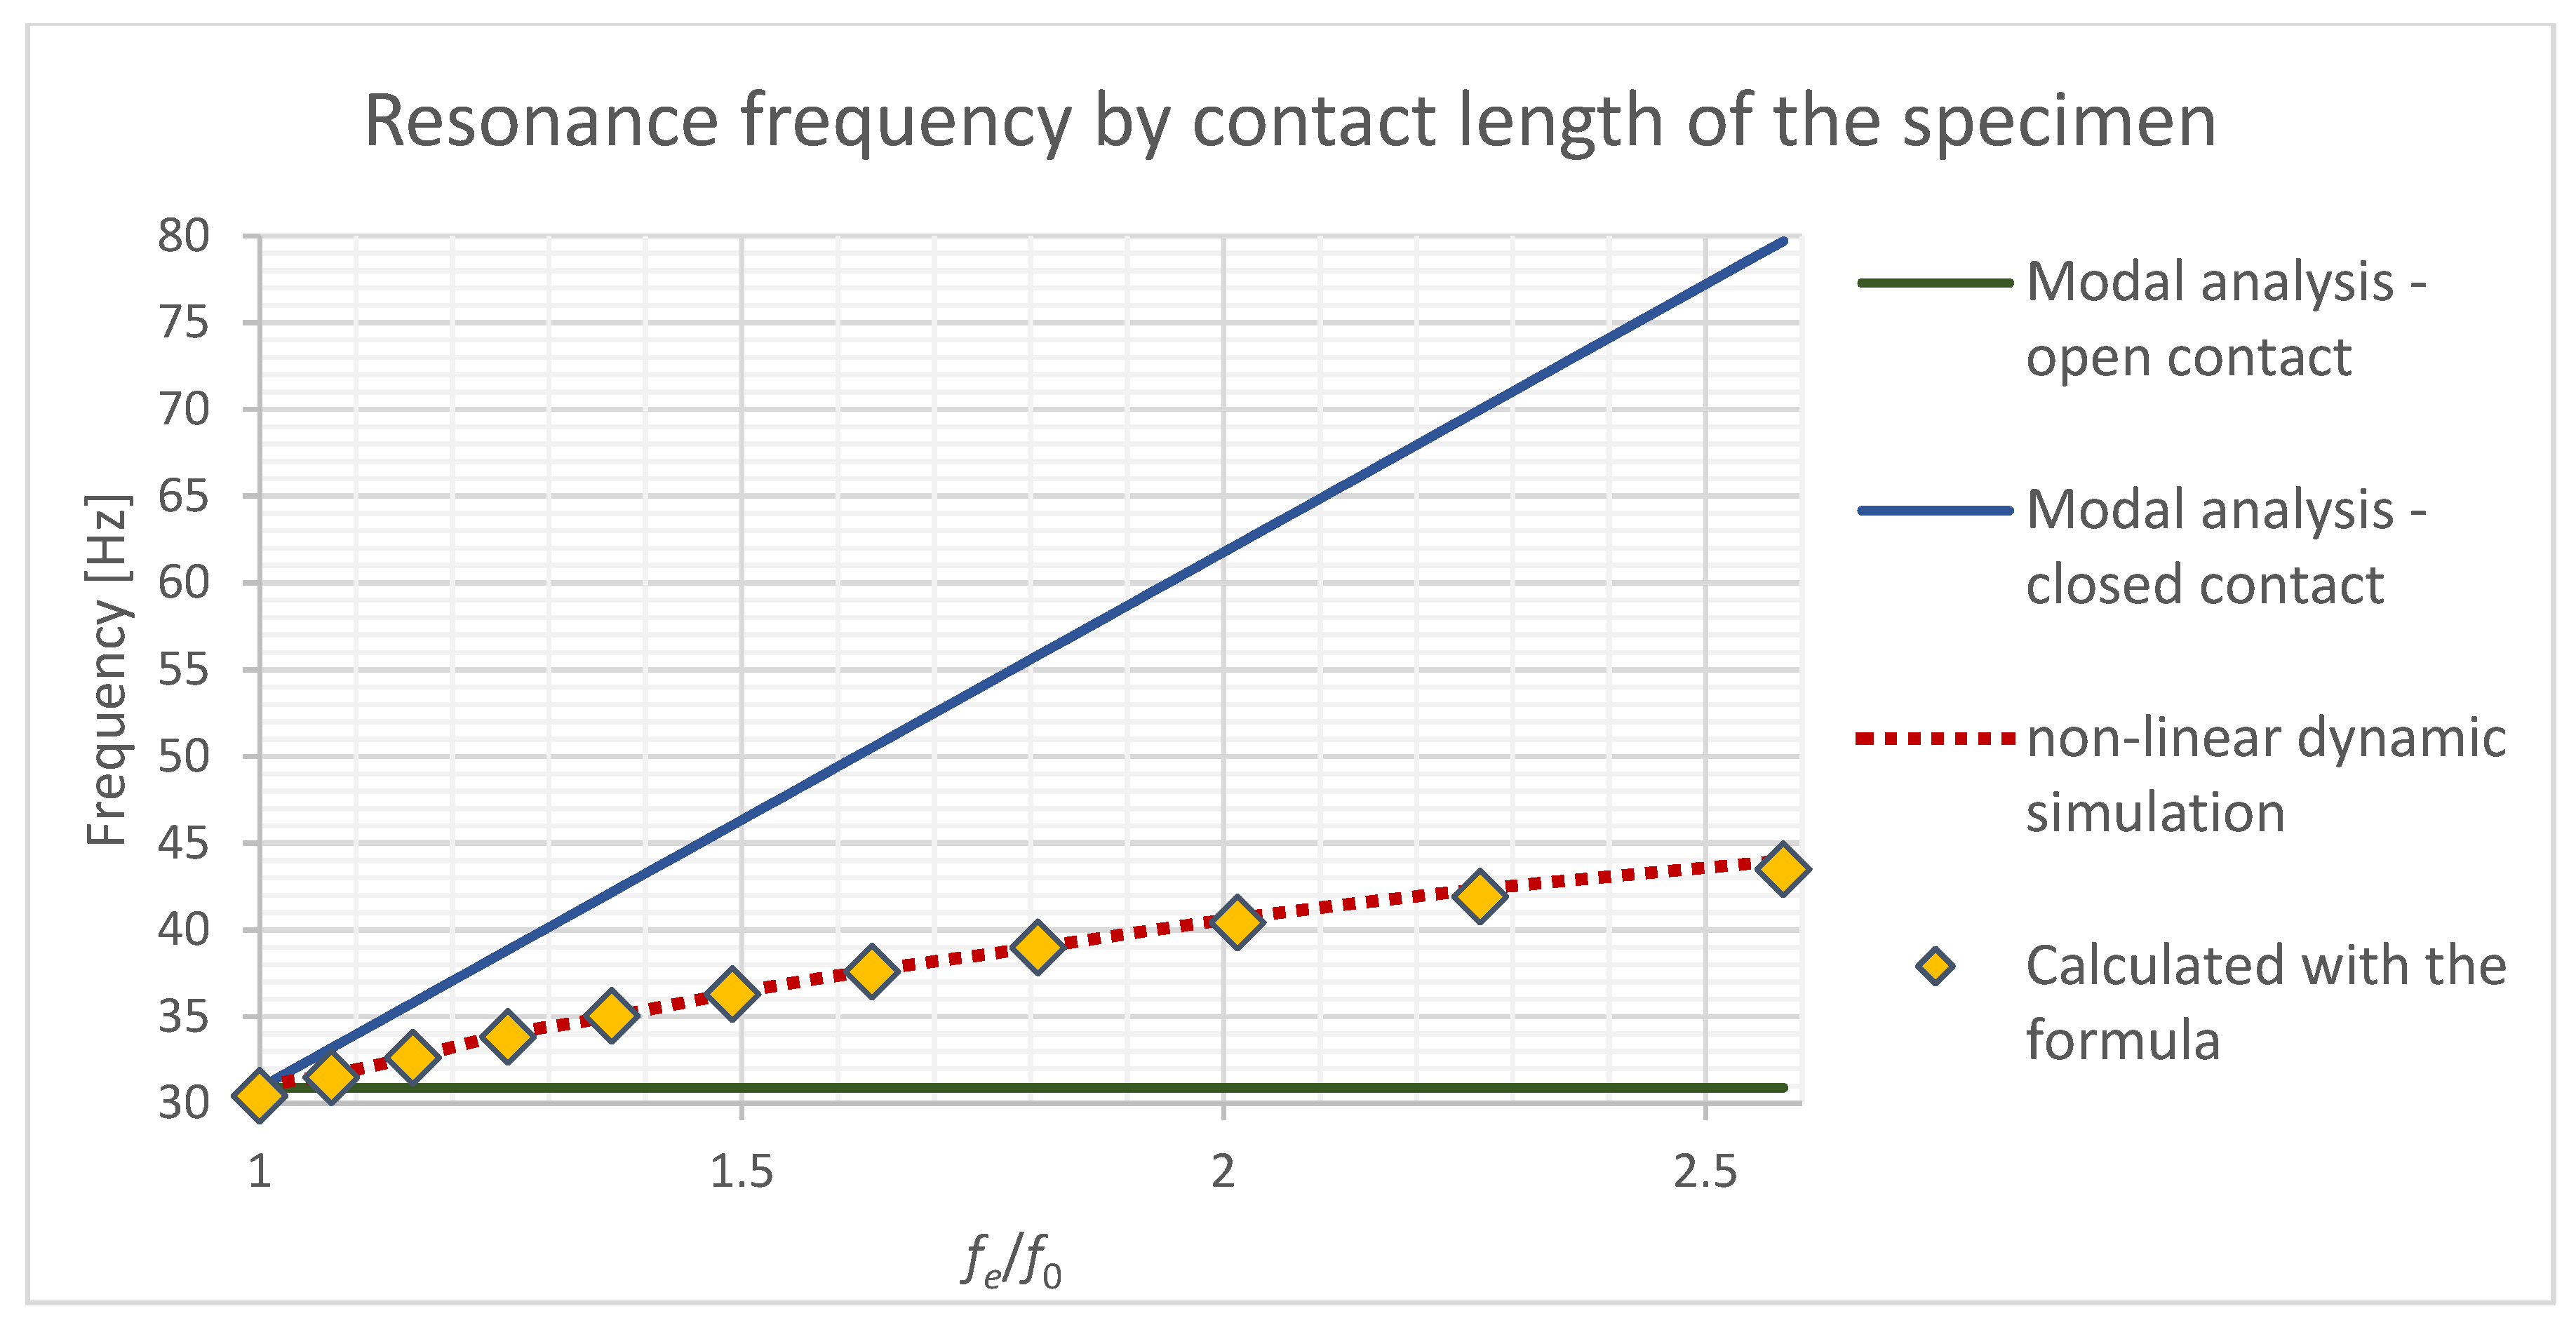
Dynamic FE simulation was performed with 10 different lengths of contact X in the range 0–100 mm, each 10 mm. The characteristics of the natural resonance frequency by contact length are shown in
Figure 4. Additionally, the resonance frequencies calculated with the classical modal analysis with fixed contact edge and opened contact were included to visualize the difference.
4. Formula Created for Resonance Frequency Estimation
The estimation formula for the resonance frequency was prepared by the resonance frequencies extracted in the classical modal analysis simulation with two types of boundary conditions—neglecting the contact and fixing the edge of the contact. The formula includes a correction factor that is connected to the stiffening of the structure with the contact as to ratio.
The preliminary form of the equation is based on observations of vibration with contact behavior. The part of the formula responsible for vibration without support was taken as the half period of the cycle, and the part responsible for the specimen in contact was taken as the half period of the cycle with additional correction factor. The preliminary Formula (1) is as follows:
Based on the collected data for vibrations with 10 contact lengths and some additional cases, such as thicker specimens or different material orientation, nonlinear regression was applied to extract the values of and correction parameters. The values of the parameters were equal to:
For simplification of the formula, the correction factors were rounded to integer values. The final values of the correction factors were as follows:
The final shape of the formula is as follows (2):
The equation was proposed according to the observation presented in
Figure 1, that the full cycle of vibration can be split into two. The first part of the cycle, while contact is closed, may be described with modal analysis with the fixed edge of the contact, while the second cycle can be described with modal analysis omitting the contact. The formula presents the sum of times that it takes each of the half-cycles to occur, with some correction factors. The value of the correction factors (
A and
B) were defined with a regression method, in such a way that the error of the formula result was minimized according to non-linear simulation case for couple of iterations.
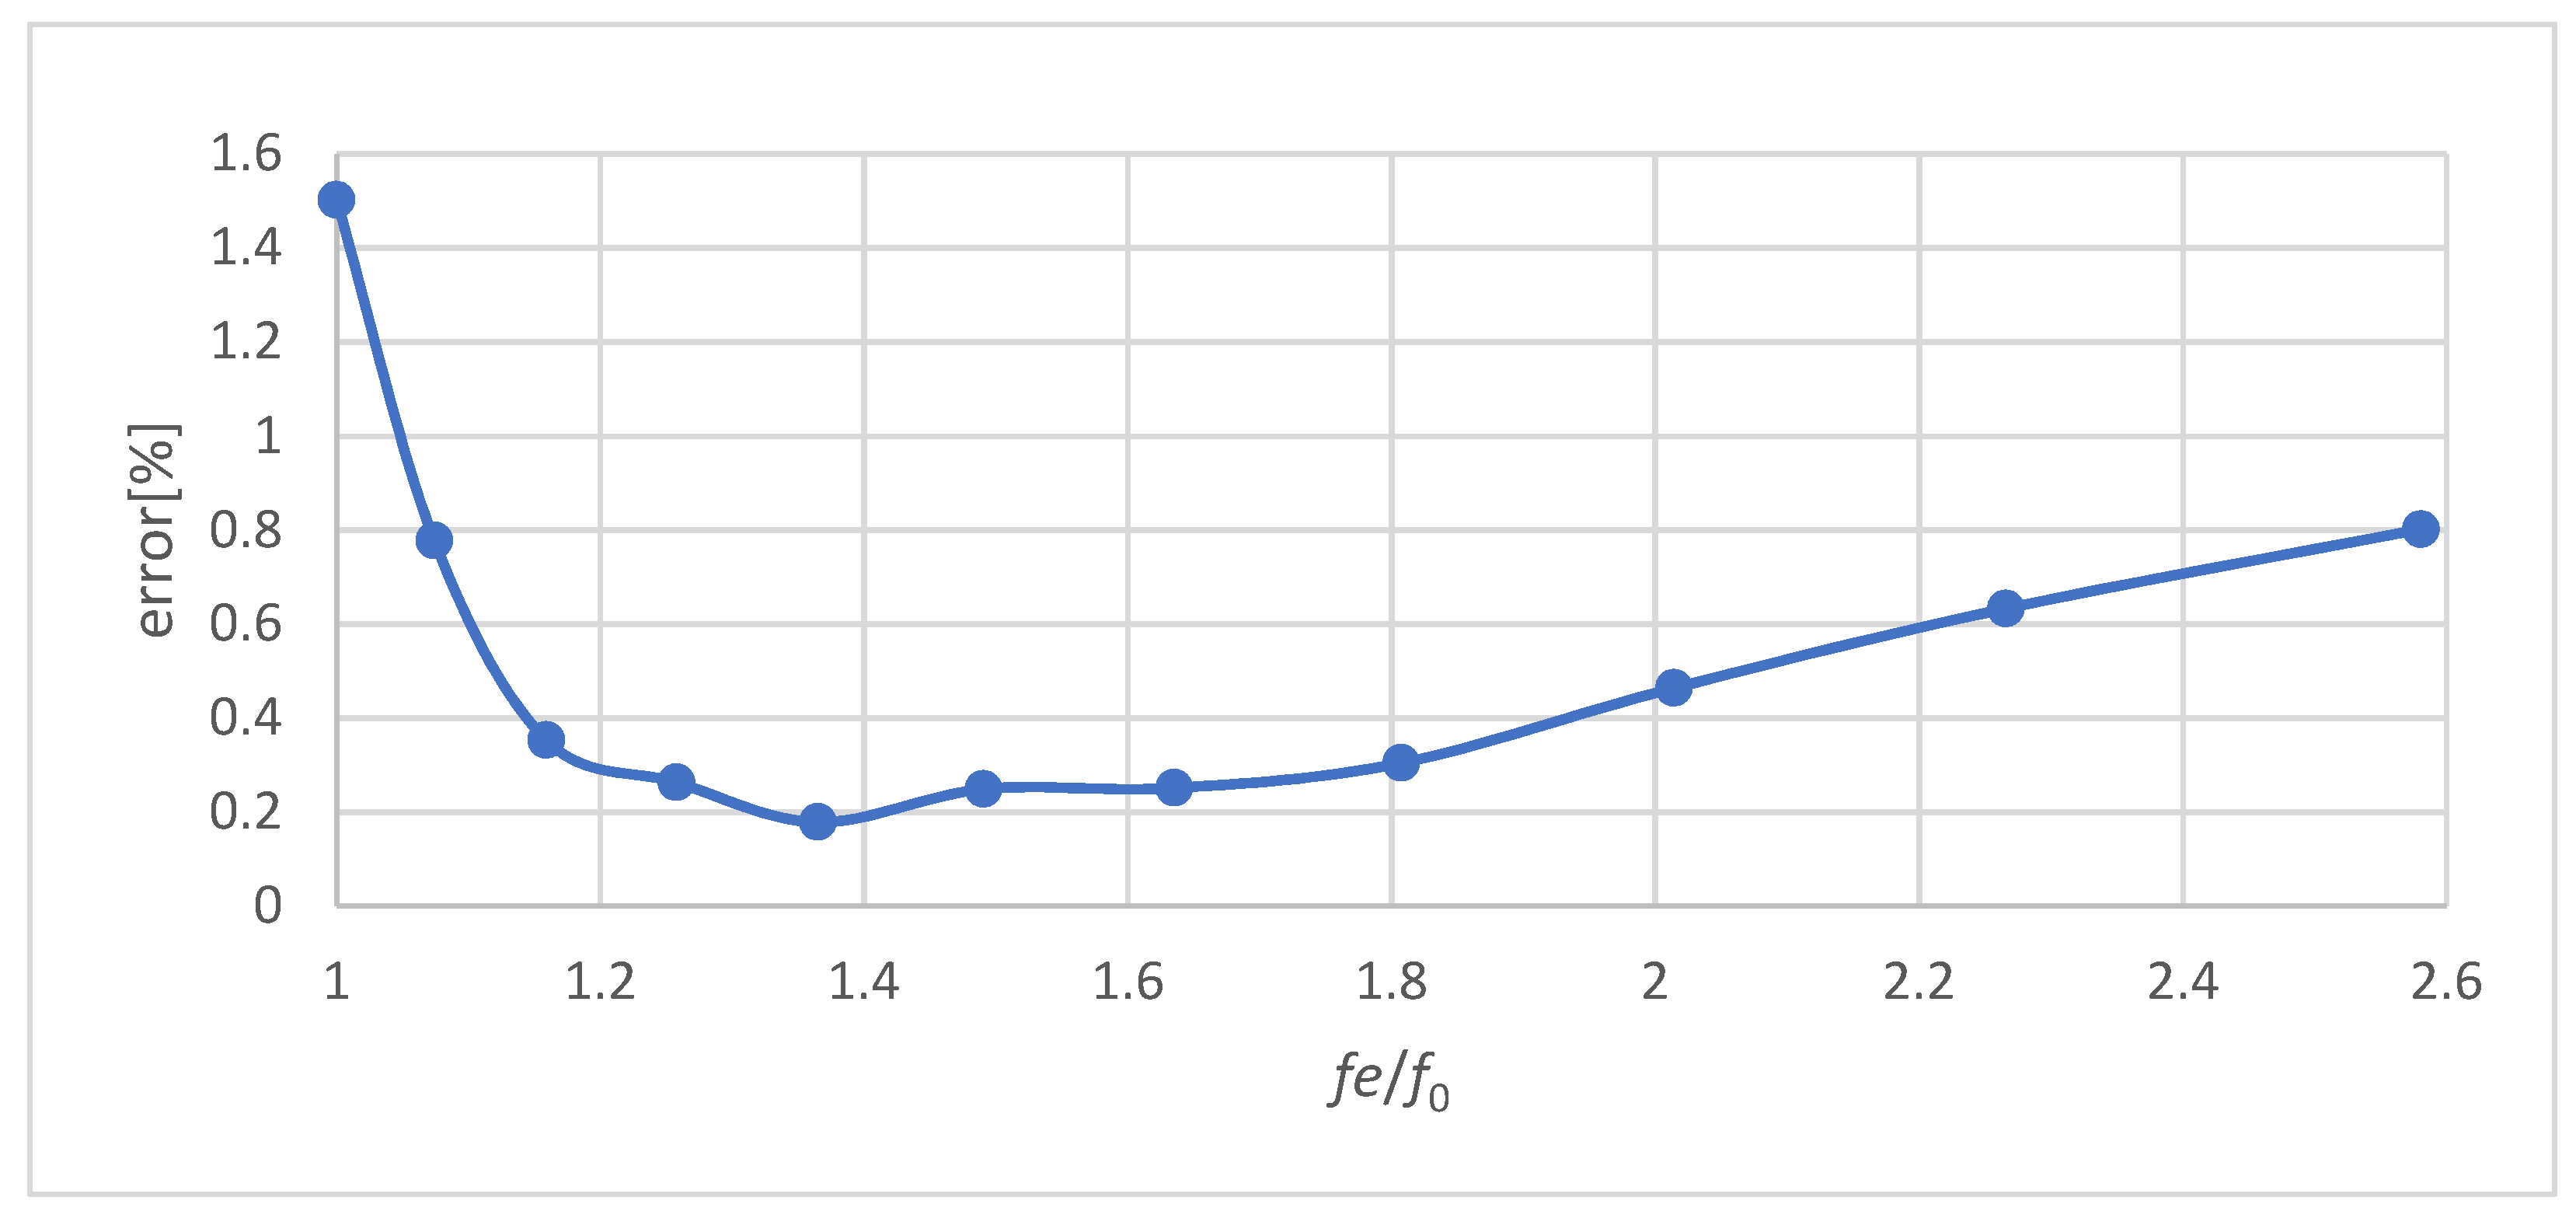
The formula was back-tested on the entry data. The error of the formula-based estimation for the case that was verified with non-linear dynamics for each iteration of the contact length is shown in
Figure 5.
5. Experimental Verification
5.1. Tests on Cantilever Beam
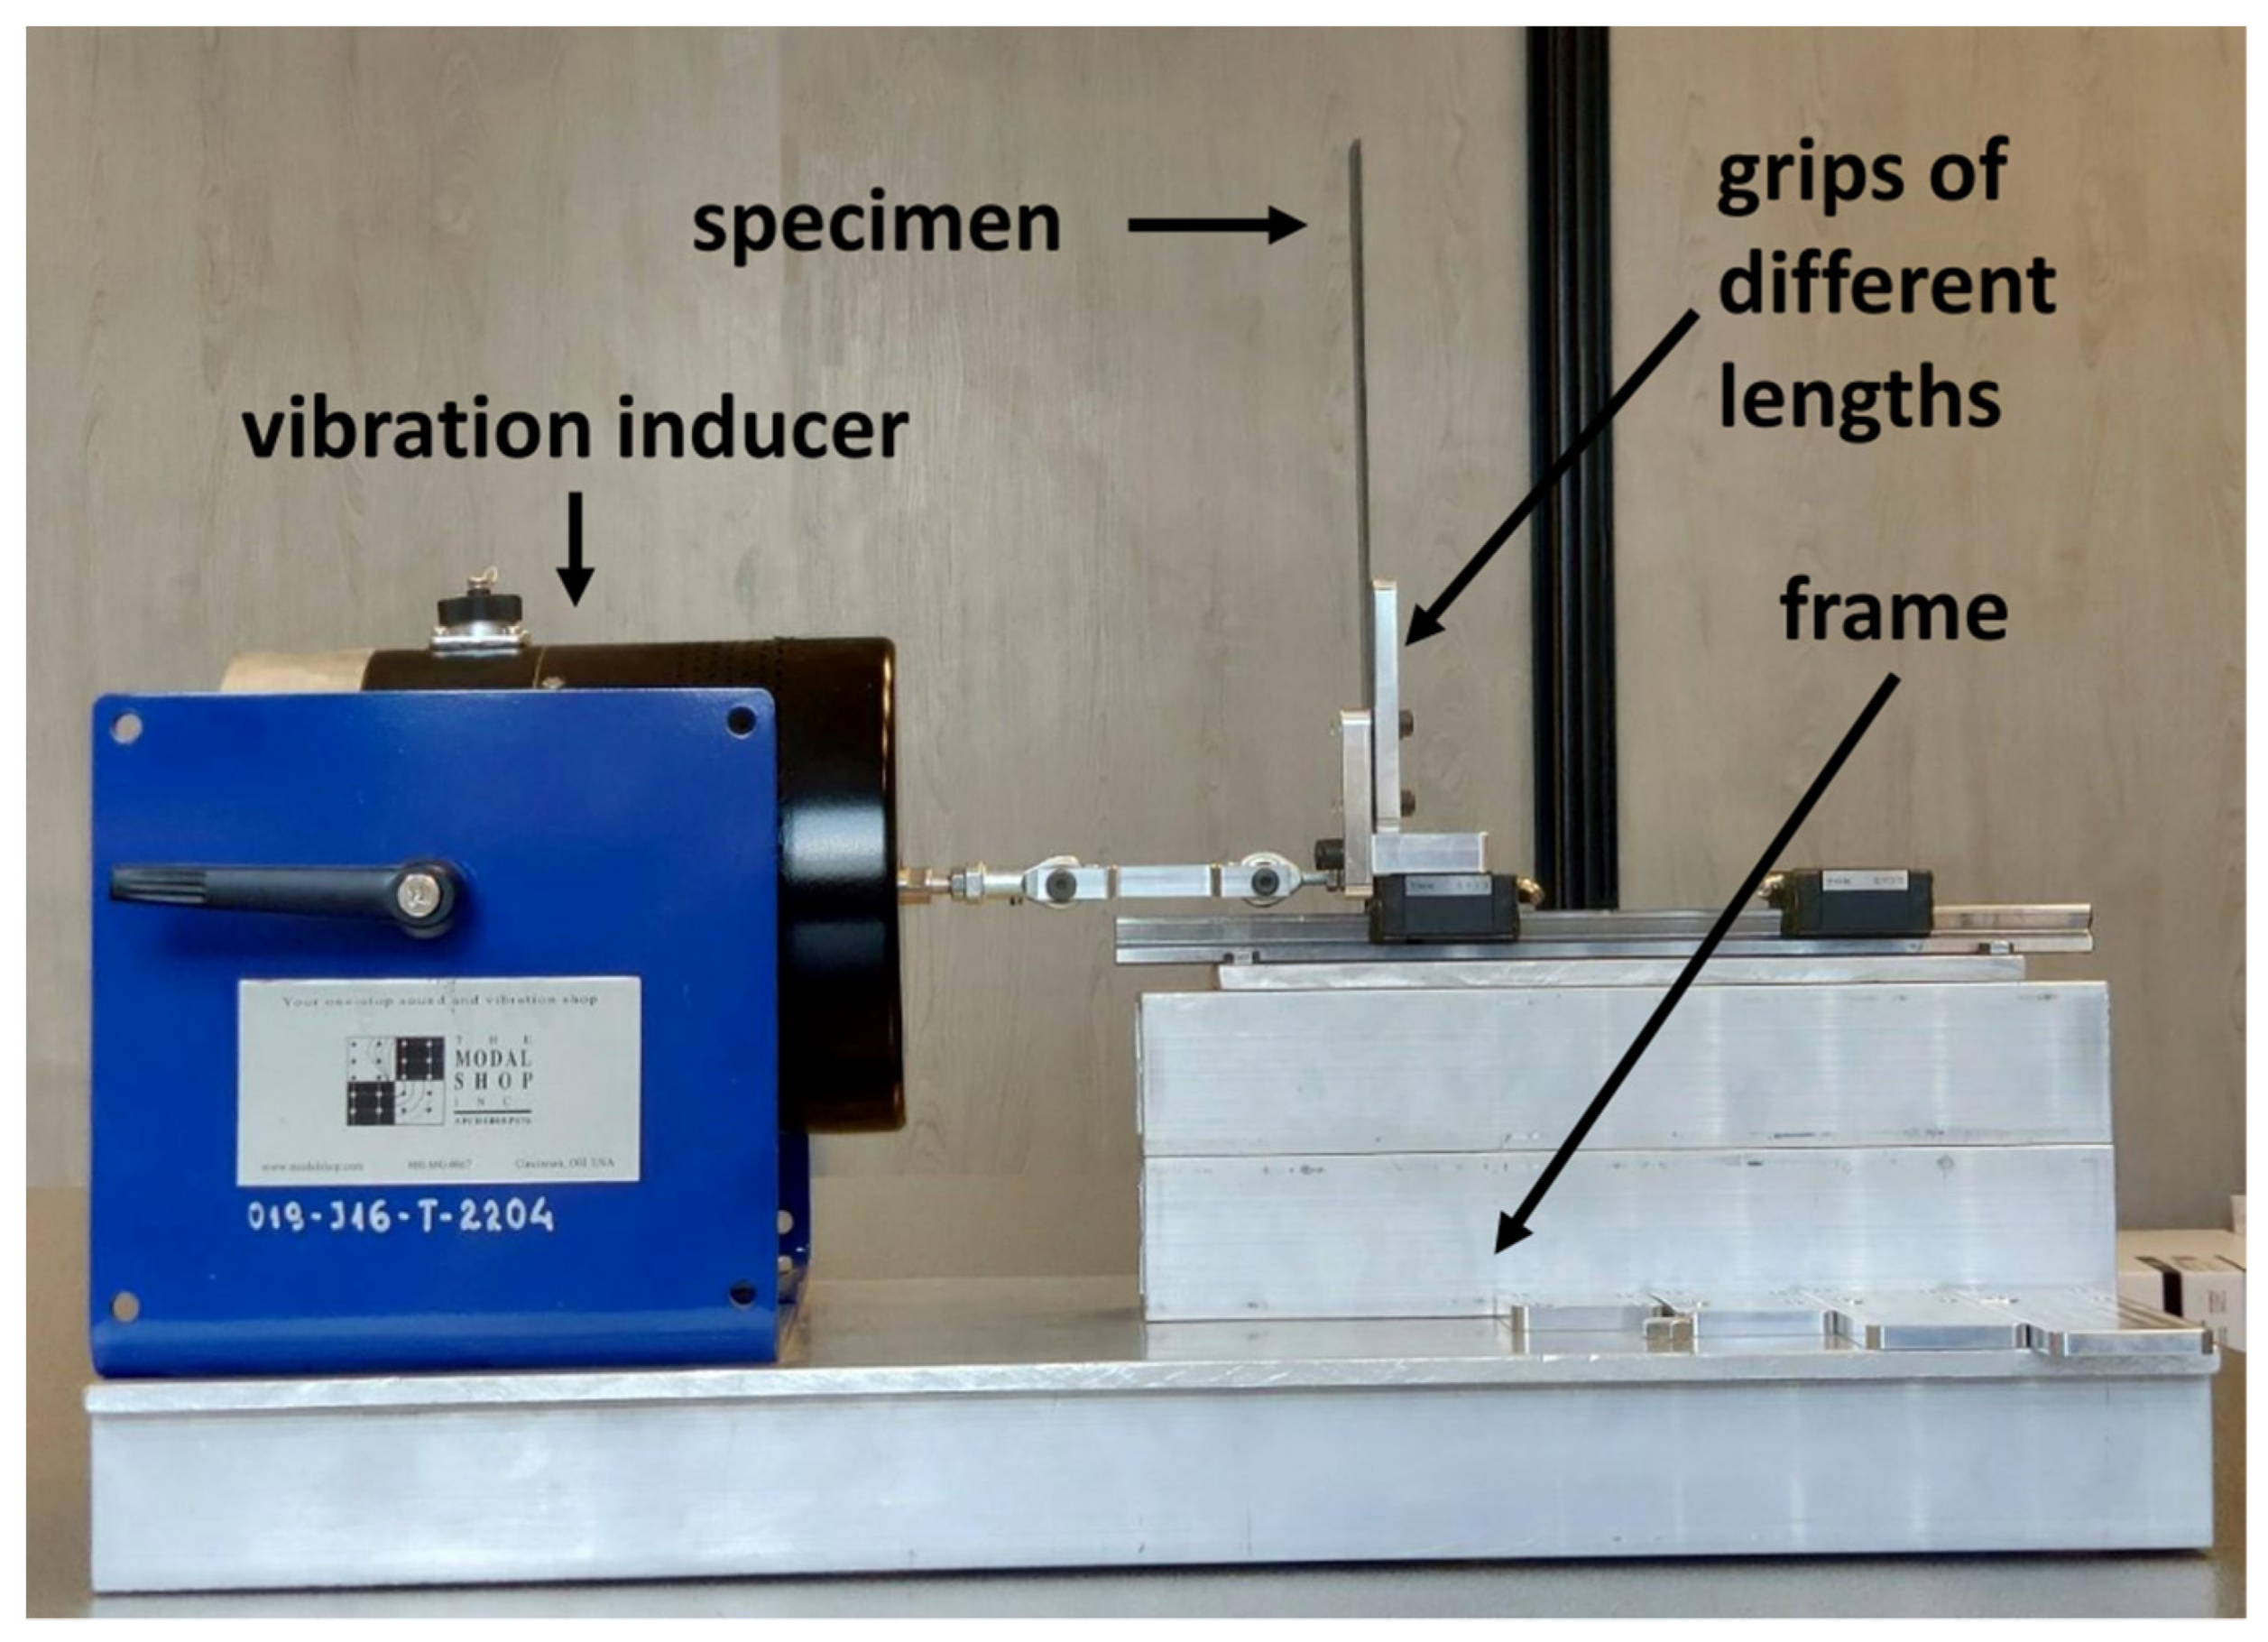
To perform experimental verification of the formula, a test stand was designed and manufactured. The test bench for the vibration examination was designed as a rail and a guide car, with an attached sample holder. The sample was mounted vertically to eliminate the influence of gravity and avoid the need to mount the rail vertically. The vibrations were forced by the inductor attached with the base to the frame shared with the rail; the vibrating head was connected with the carriage by a rod.
The MTS Systems Corporation shaker model 2100E11 was used as mechanical excitation. The imposing signal was an audio file sent to the QSC RMX2450be amplifier, which was directly connected to the shaker.
Vibration measurement was performed with laser vibrometer Polytec PSV-400 connected to the Polytec OFV-5000 controller. Additionally, the Siemens LMS system with PCB 356A16 was used for signal calibration and additional measurements in the sample holder. The complete test bench is shown in
Figure 6.
For imposing signal generation, the Python script was written, which can create a wave file with sinusoidal signal with variable frequency and amplitude. The script allows one to impose the sine sweep test of constant acceleration, which was used to find resonance frequency of the system.
The experiment was planned with the following assumptions:
A total of three flat specimens made out of CFRP composite, with the same dimensions as described for nonlinear dynamics simulation, to investigate manufacturing deviations;
Five different grips to support specimens with four different lengths of contact (20 mm, 40 mm, 60 mm, 80 mm) and without contact (one side simple fixation);
Two additional masses that were attached to the free end of each sample to verify the system with different natural frequencies (case without attached mass and two cases with different masses).
Each of the probes was repeated three times to compensate for variation on mounting the specimen on the test bench. The cumulative number of probes performed was:
The measured dimensions of the prepared specimens are presented in
Table 2.
5.2. Tests on Satellite Antenna Structure
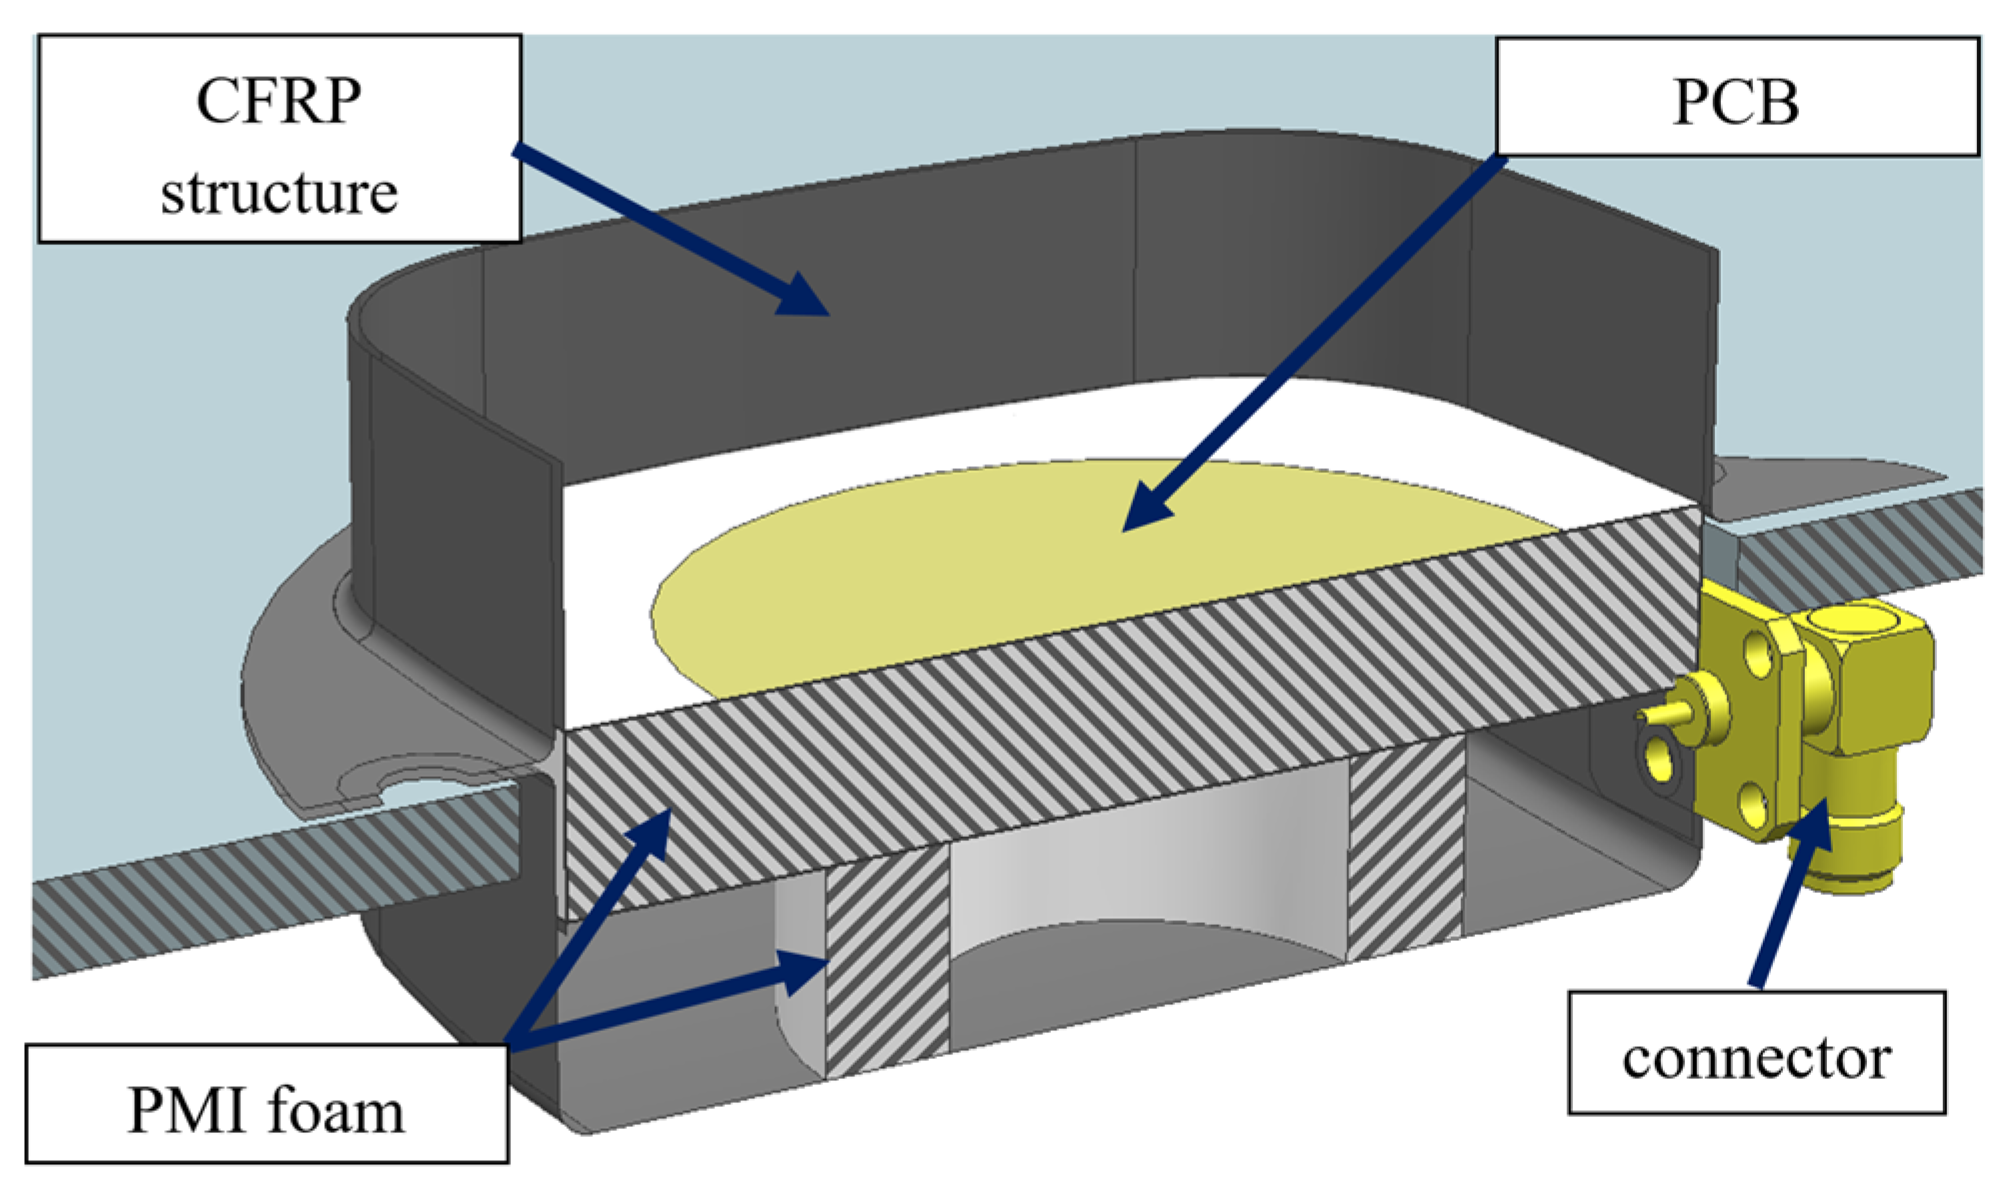
An additional structure was selected as another experimental object. Non-destructive tests were performed on the ESEO satellite antenna panel. The panel is made out of two-layered CFRP composite, bonded in lightweight foam structures to support electronics and stiffen the setup. The cross section with the description is shown in
Figure 7. The contact of this case is based on the fixation method.
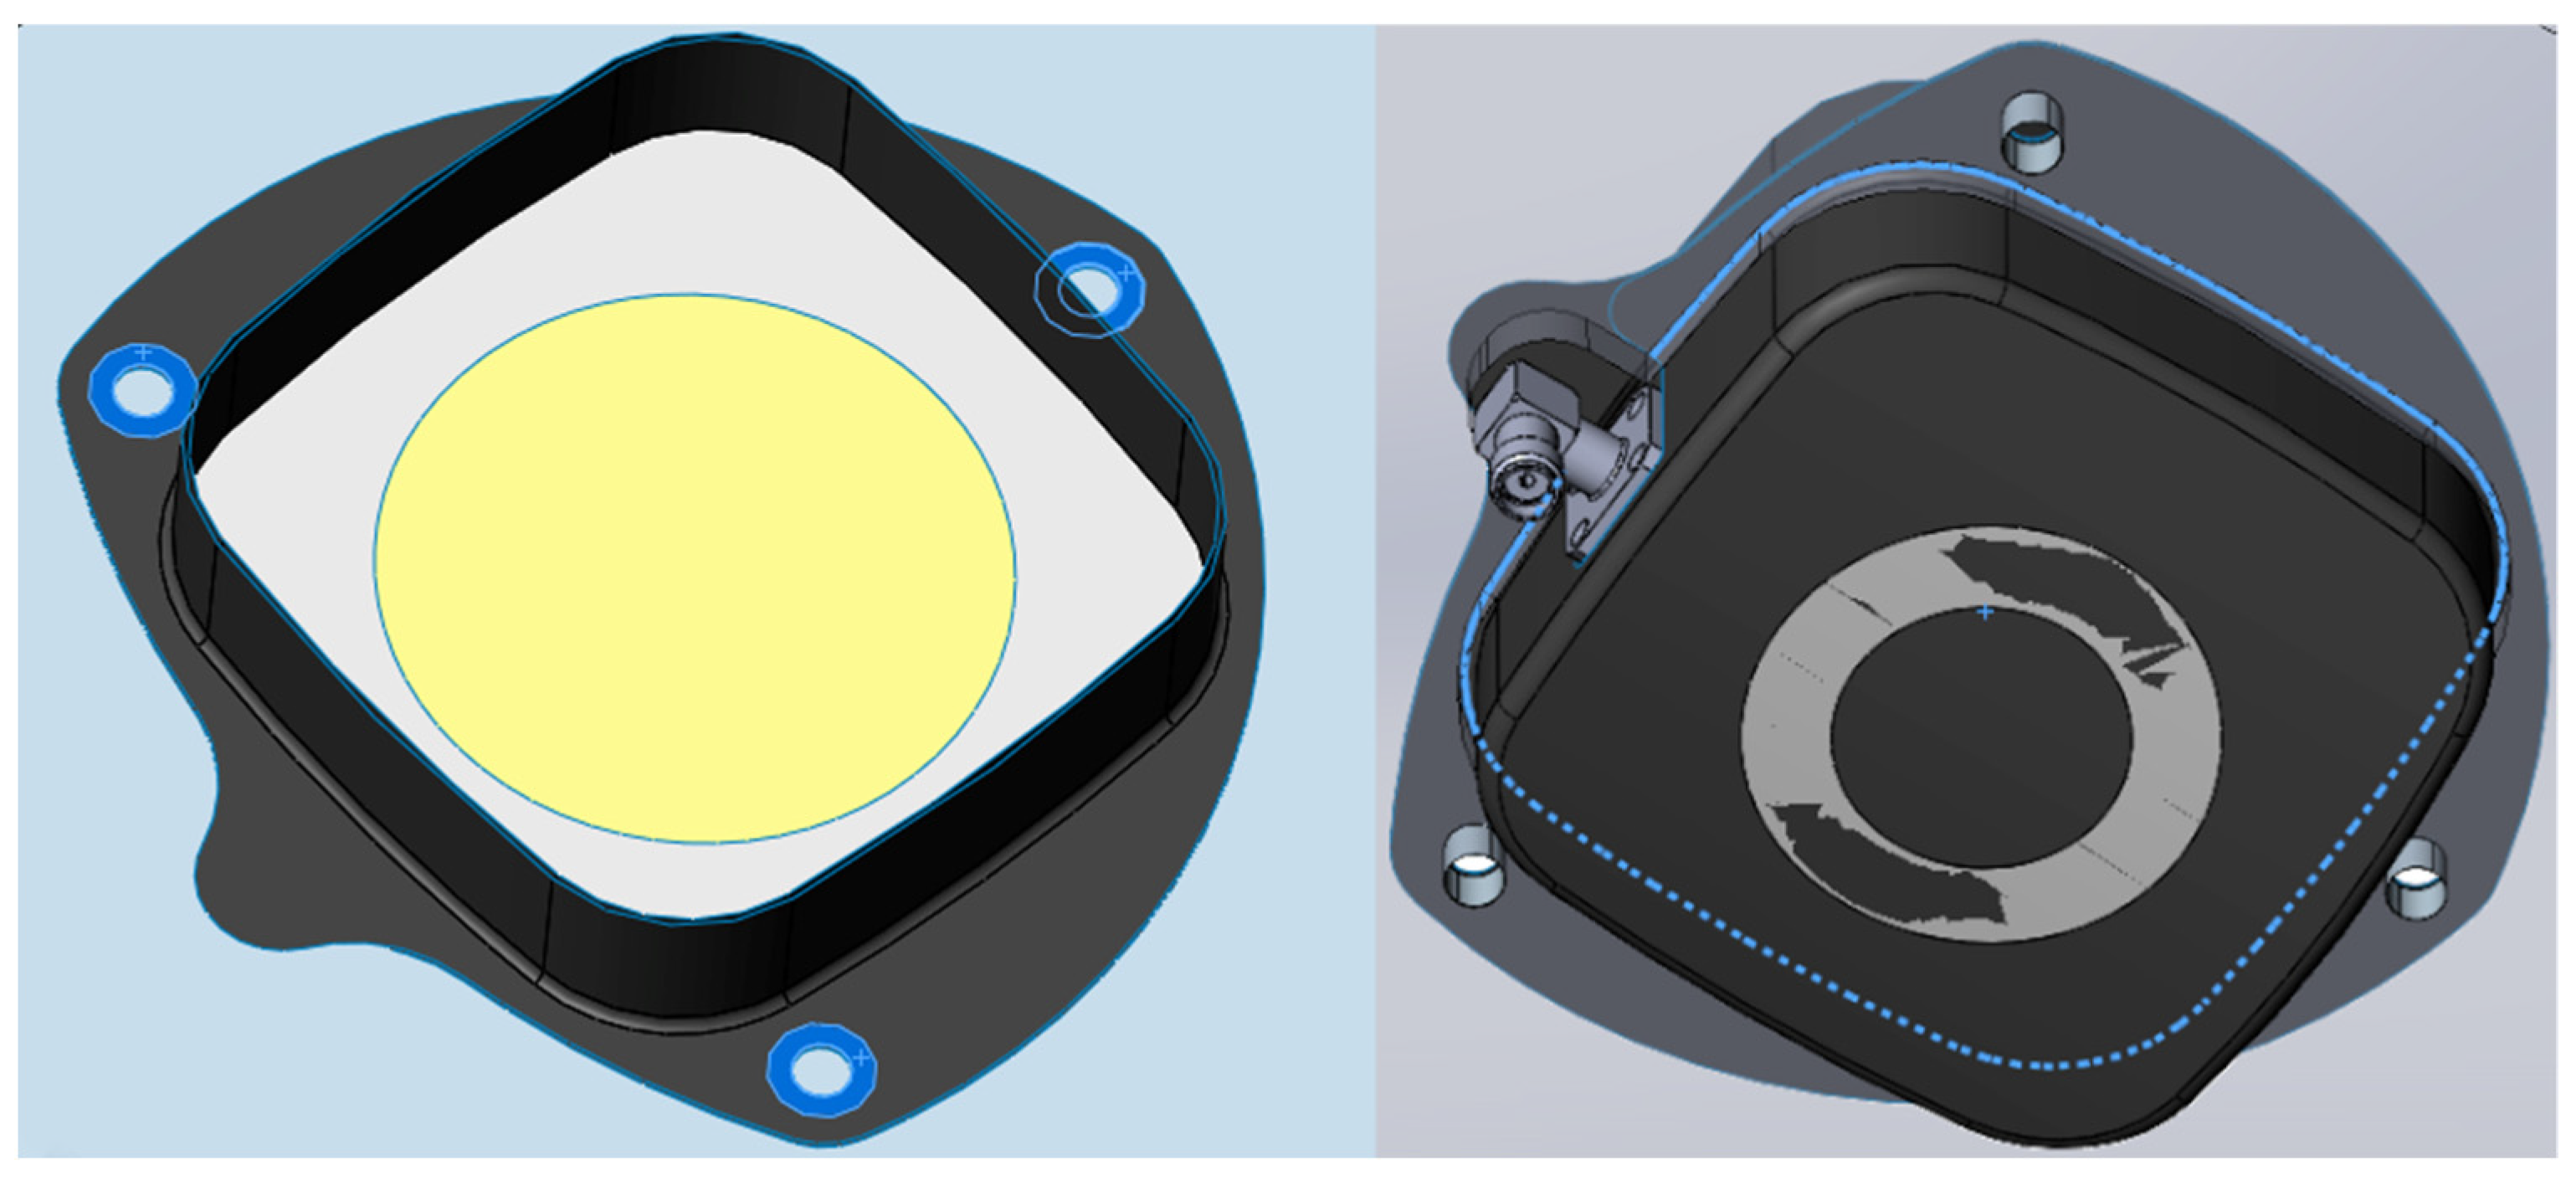
The component is tightened to the satellite structure with three bolts in cut-out holes in the main structure. The upper half cycle is when the panel is supported only on the bolt heads, the lower half cycle is when it is supported on the edge of the cut-out hole in the main structure (
Figure 8).
The numerical model for the modal analysis of the antenna was prepared with layered shell elements for CFRP panels and solid elements for foam parts. The shell and solid elements were glued together in the interface areas. The electrical connector was modeled as a mass point attached to its fixation points in the CFRP panel. The mechanical properties of the materials are presented in
Table 3.
The experimental tests of the component were completed with the use of Dongling Technologies vibration machine model with GT600M table. Vibrations were measured with the Polytec vibrometer model: PSV-500. The software used for the control was Siemens NV LMS Test.Lab. The component was screwed with three bolts to the fixation tool, mounted on the table of the vibration machine. The test stand is shown in
Figure 9. The test was performed in accordance with the ESA requirements [
26]. The test method was sine sweep of equal enforced acceleration of the base. The tested frequency range was 20–2600 Hz with an acceleration amplitude of 1 g on the Z axis.
6. Results
6.1. Results—Cantilever Beam
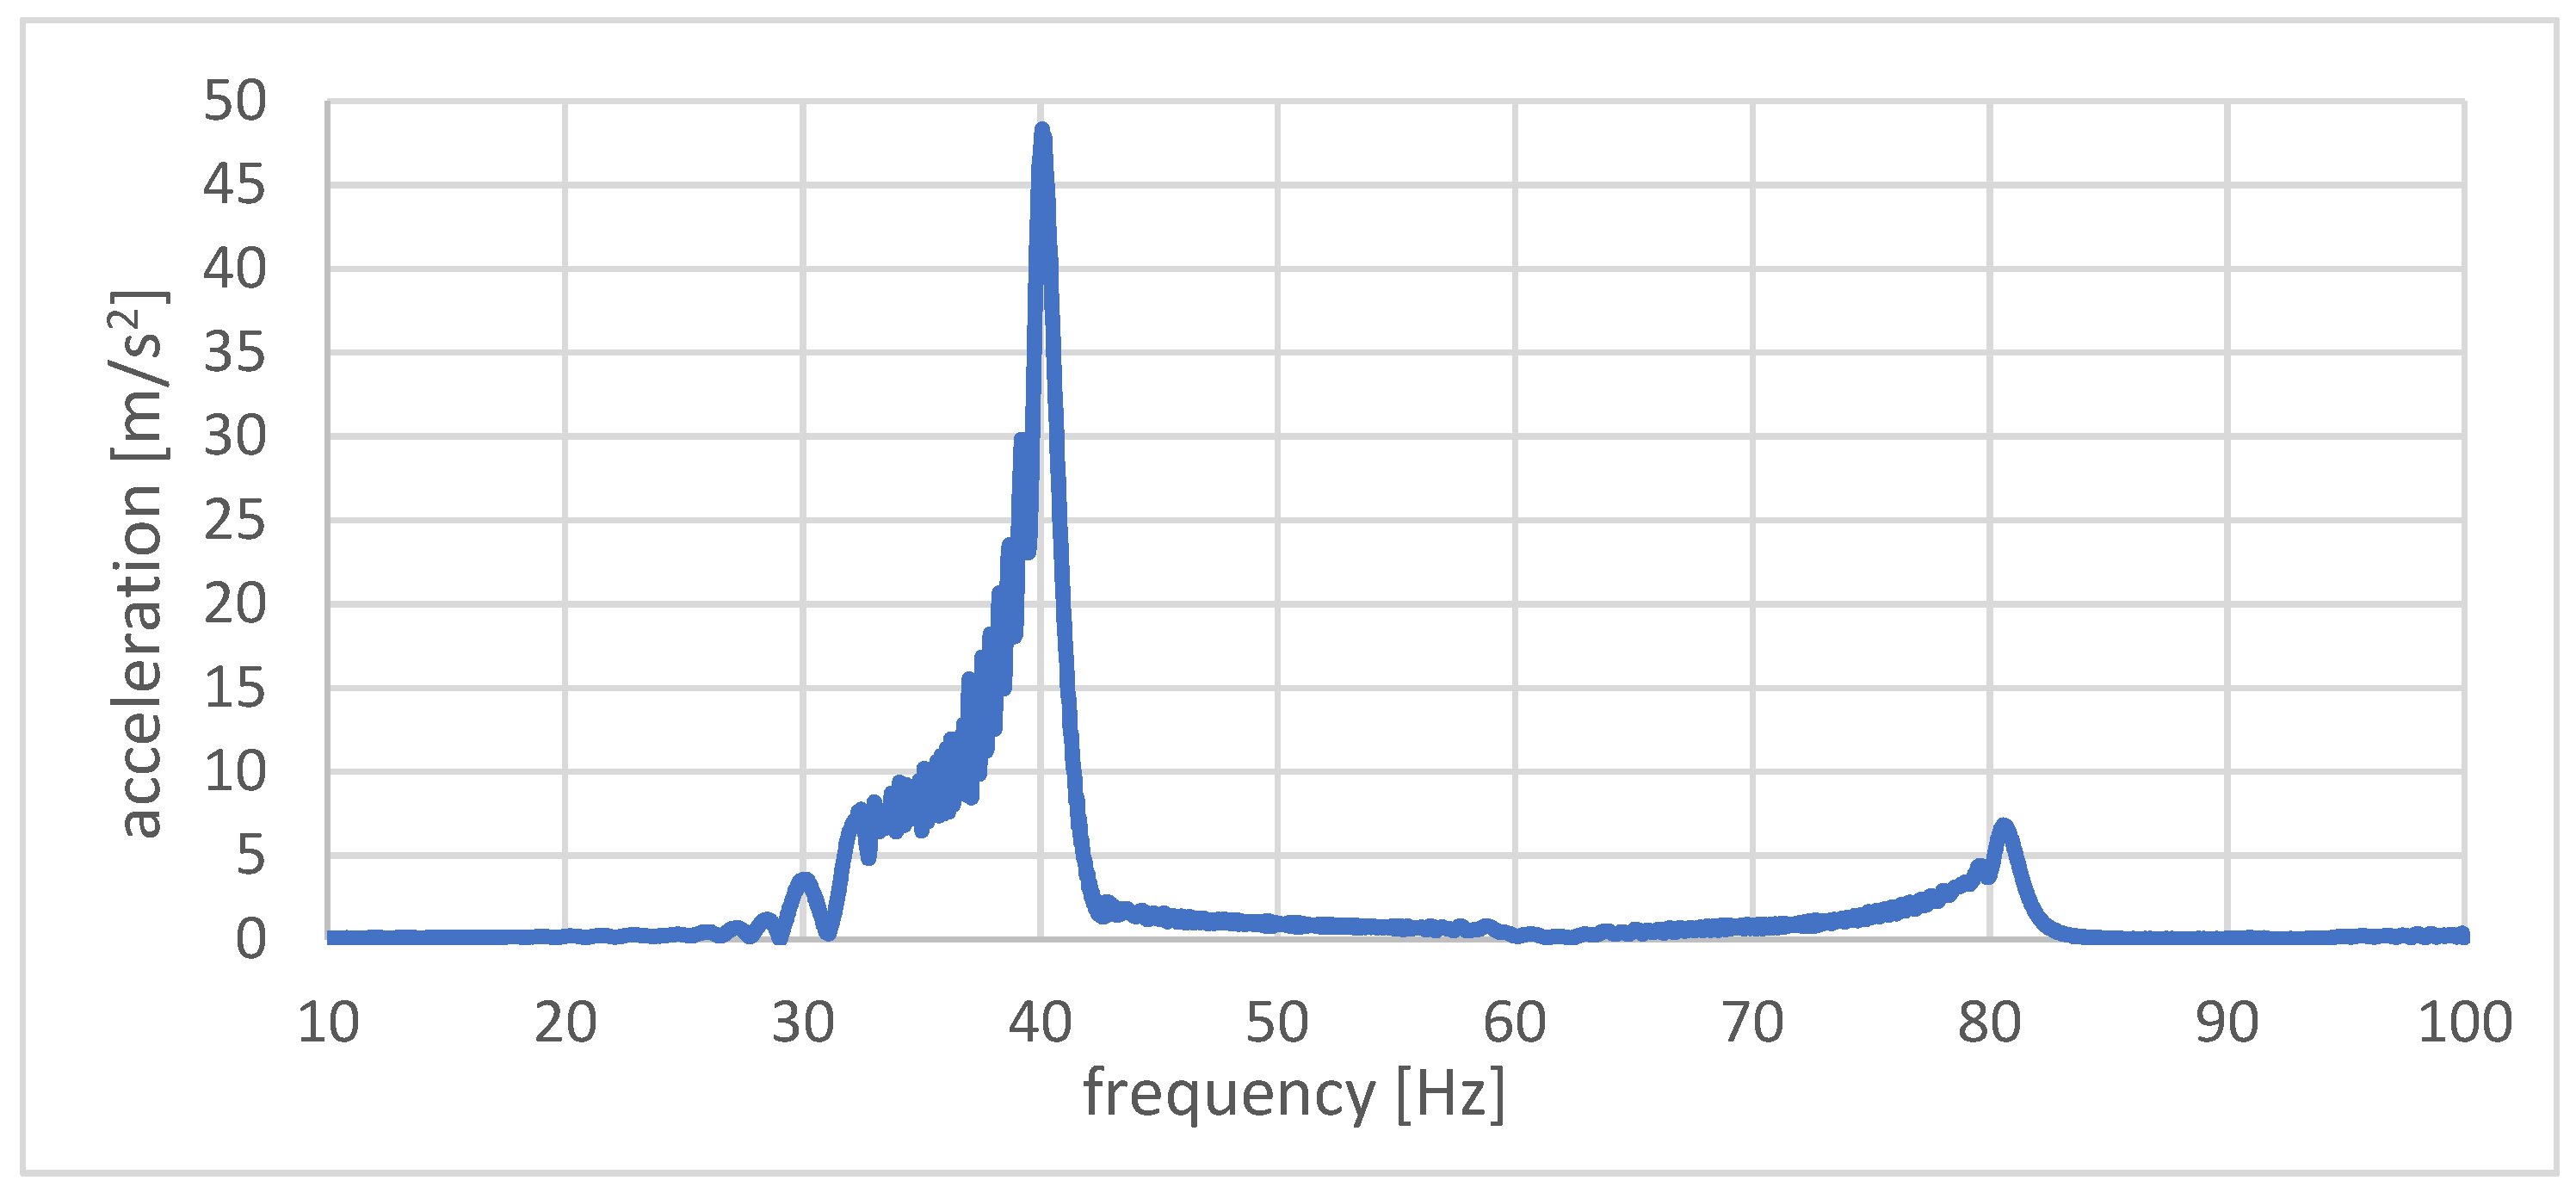
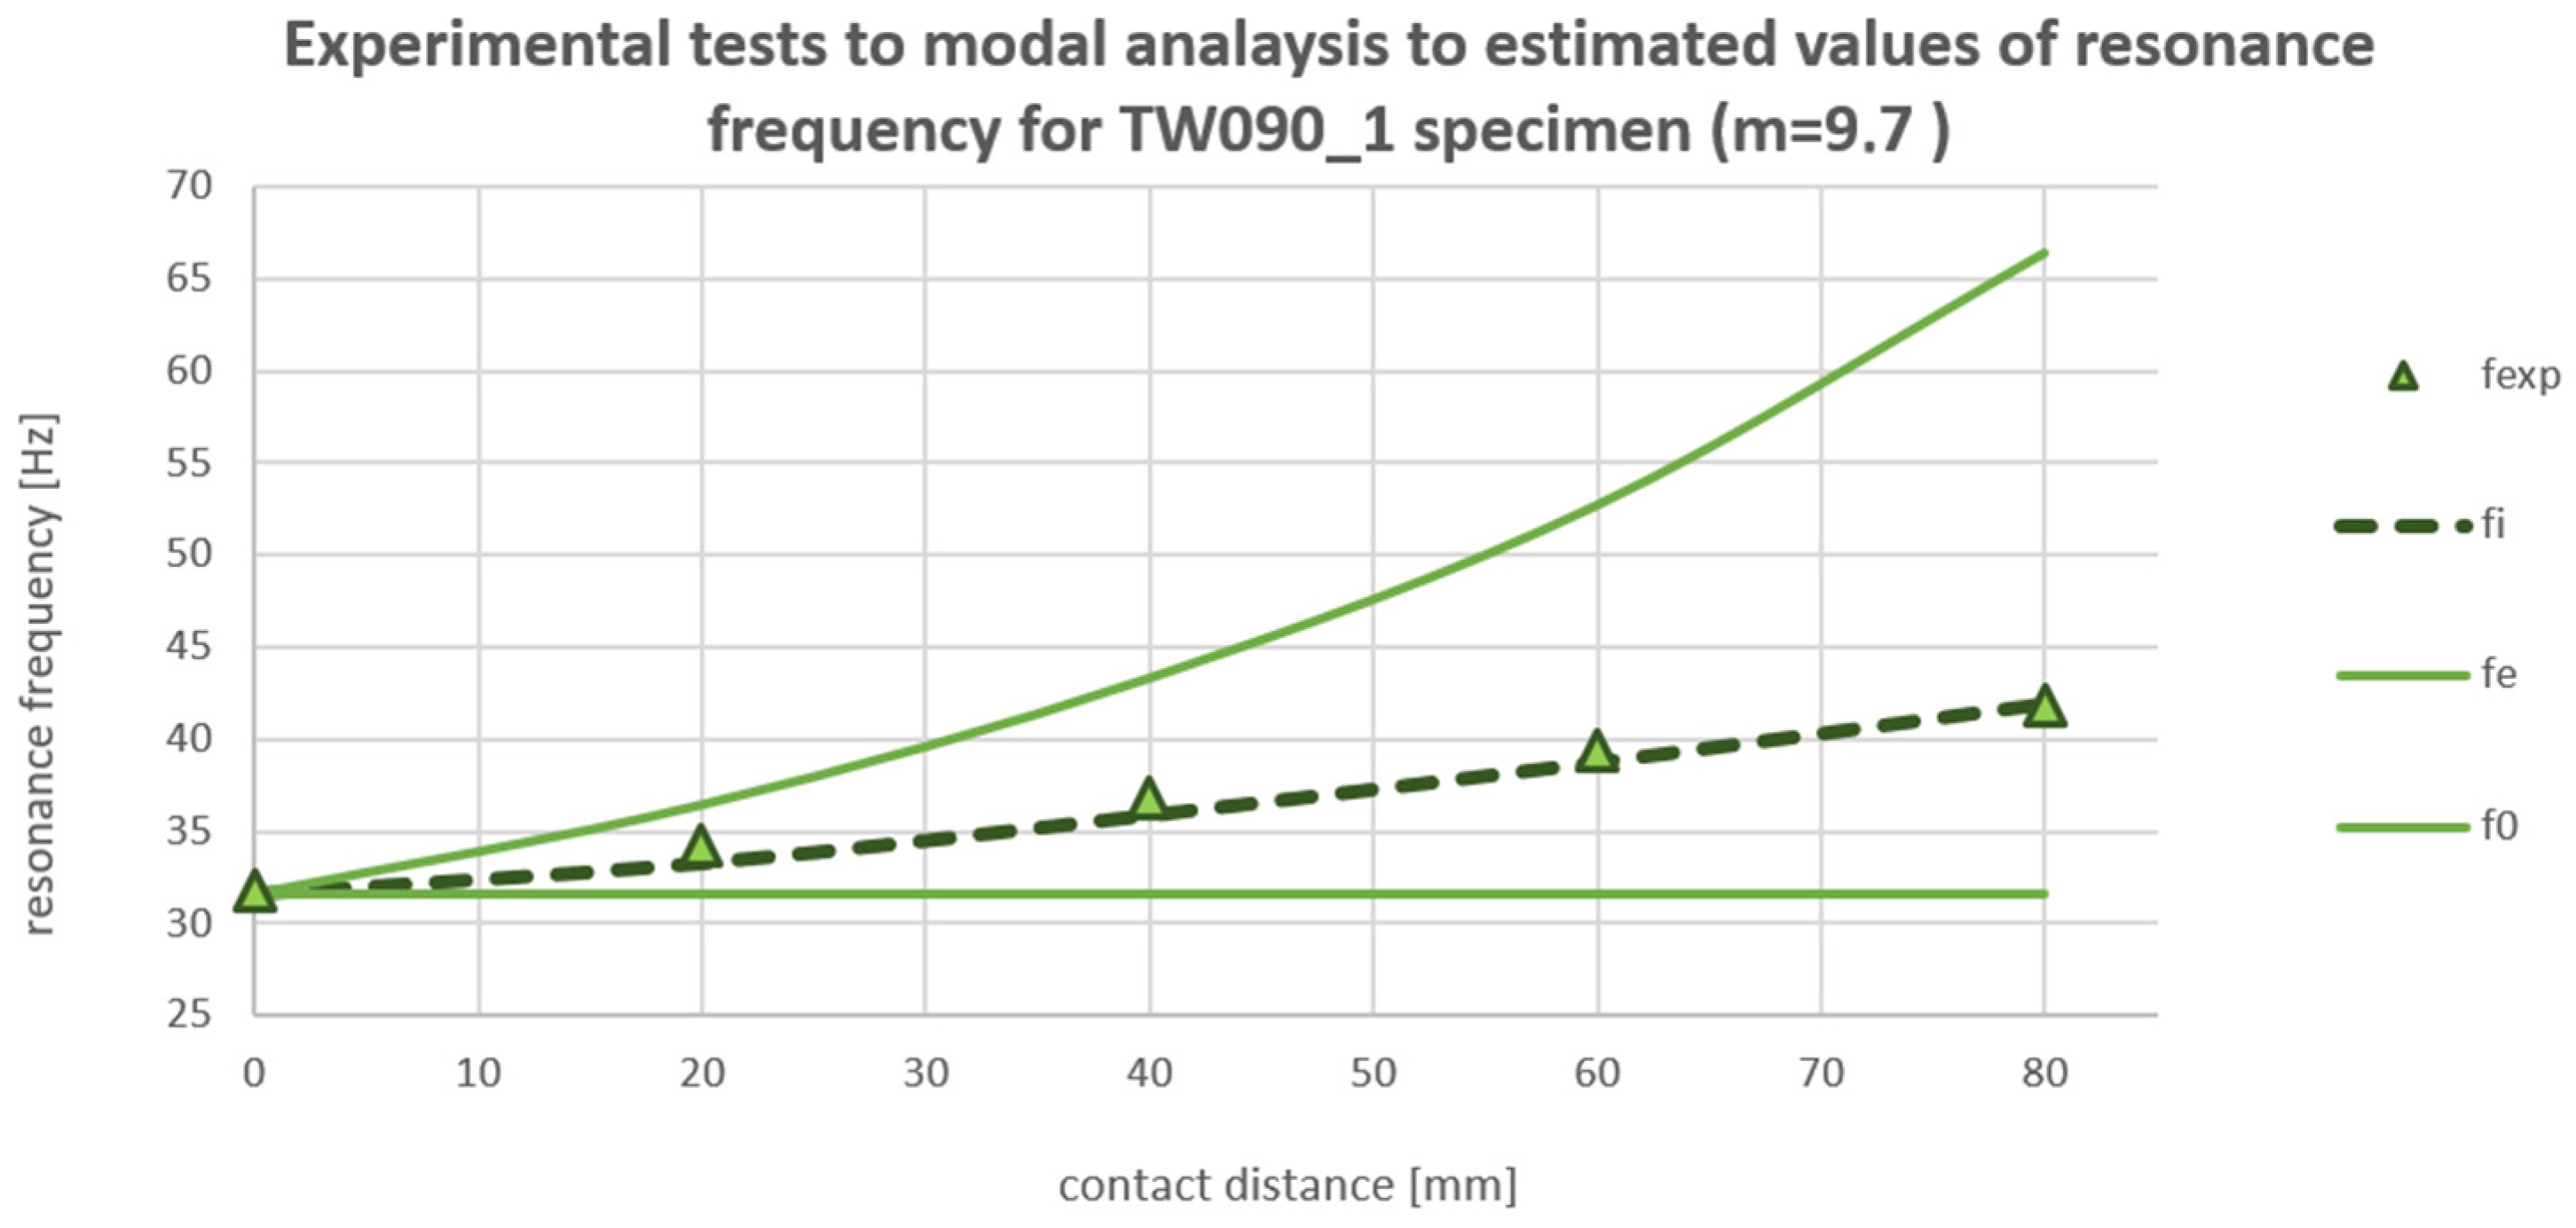
For all of the pointed cases, the response of the specimen was registered. Based on that, the first resonance frequency was evaluated. An example plot of the resonance frequency for the TW090_1 specimen is shown in
Figure 10. The full comparison and differences between all of the cases are collected in
Table 4. The biggest difference in all of the cases was registered as 3.94%. The average difference between the estimate and the test result is equal to 1.18%.
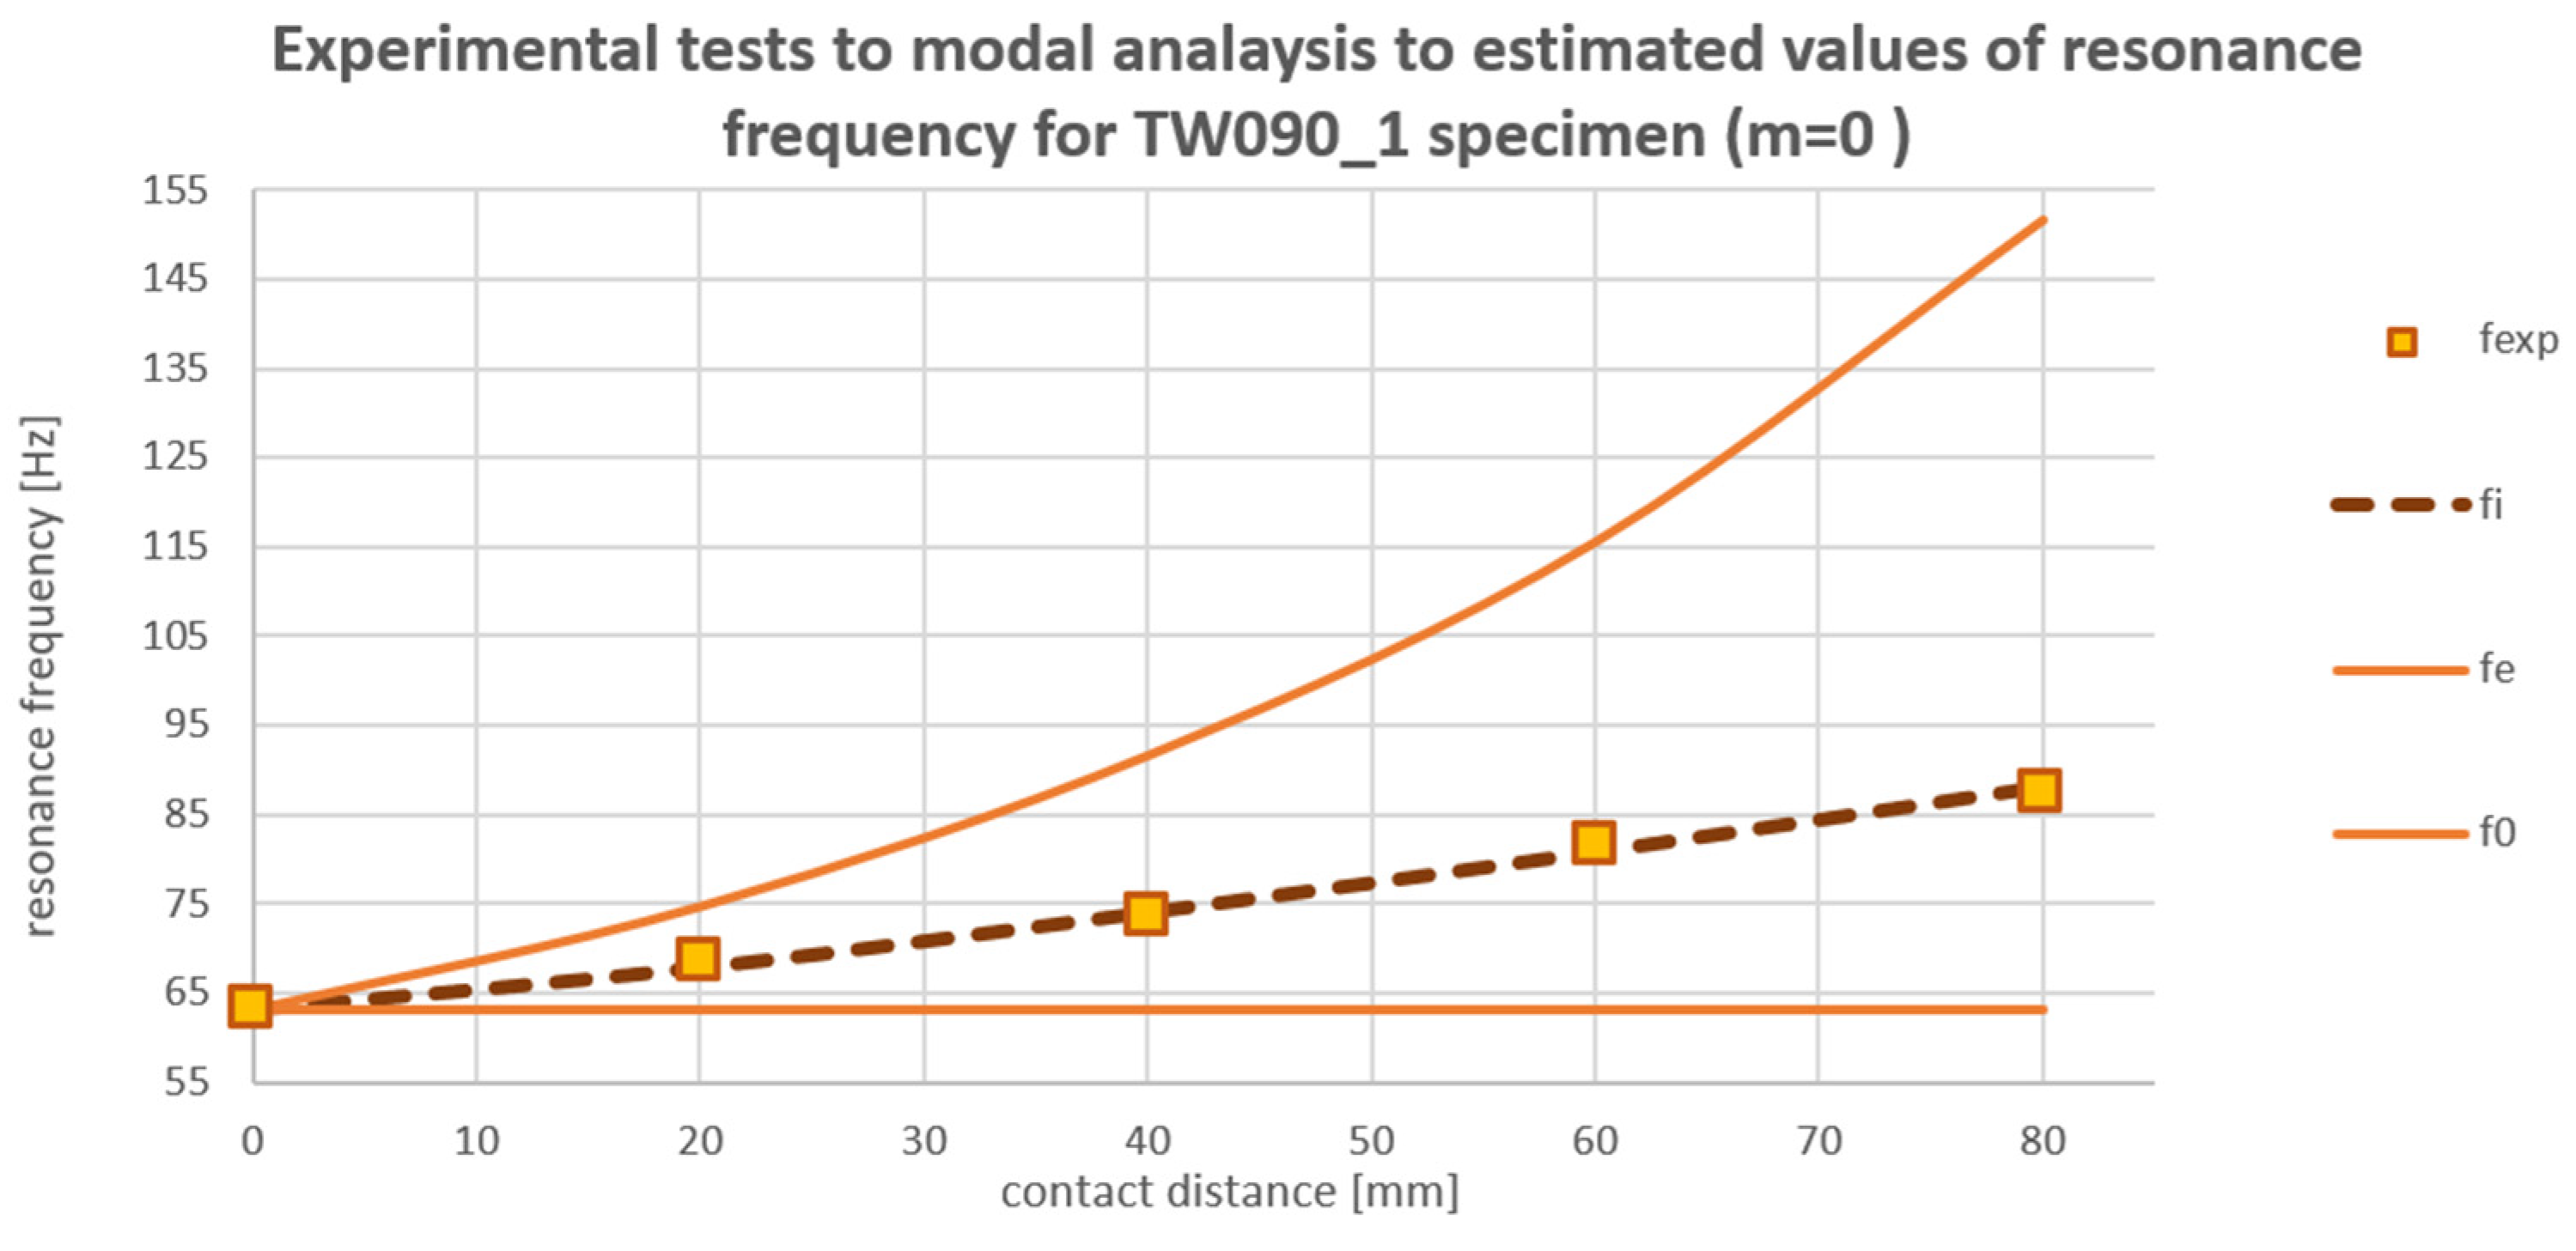
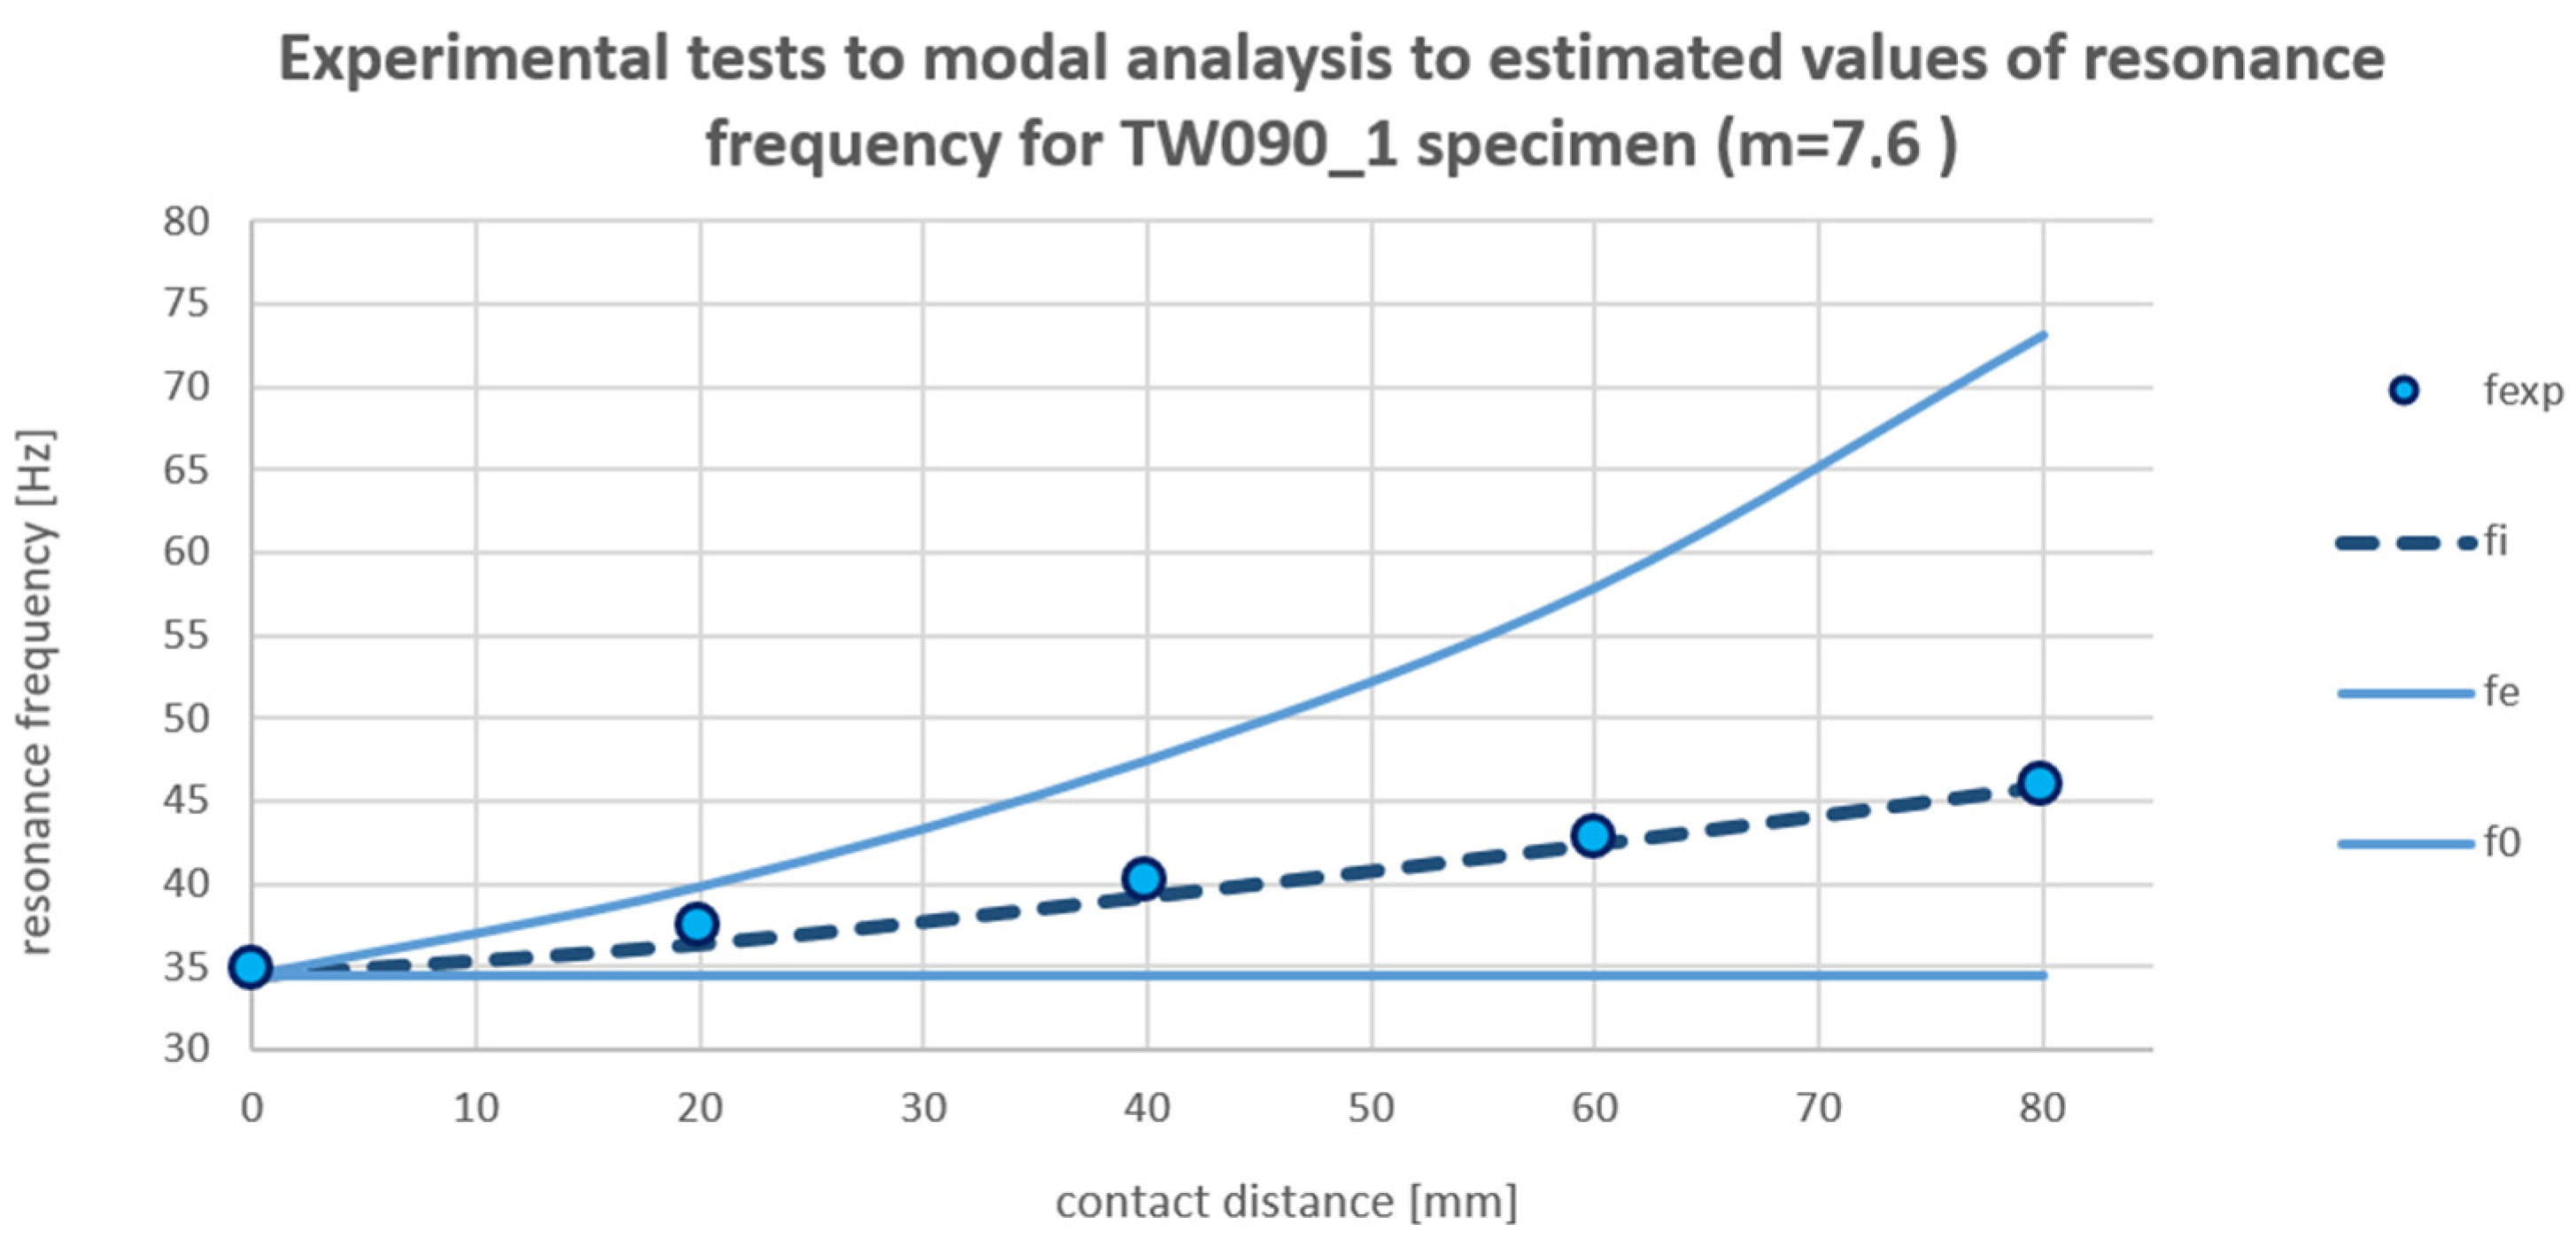
For the visualization difference between the approaches that are widely used as always closed or neglected contact, the comparison plot is shown in
Figure 11,
Figure 12 and
Figure 13 for TW090_1. The values that are compared together are the estimated resonance frequencies with usage of the presented formula, the values obtained in the experimental test, and the values obtained in modal analysis with always closed contact. The neglected contact values are equal to modal analysis for 0 mm contact distance (free vibration without contact).
The difference between the resonance frequency and always closed modal analysis was that the higher the contact, the distance was longer. The biggest difference between the modal analysis and the tested specimens was observed for the 80 mm contact distance, and it was equal to 72%. For the neglected contact modal analysis, for the same contact distance difference between the simulation and experimental test, it was equal to 58%. These values vary slightly for each specimen or included mass, in the range of ±1%.
6.2. Results—Satellite Antenna Structure
For the satellite antenna during functional tests, a sine sweep test was performed to point out the resonance characteristics. There were two runs of the sine sweep test—before functional tests and after—to investigate whether there was a change in the structure after functional tests. Both of the runs resulted in being very close to each other’s response. The resonance frequencies obtained in the test were taken as an object of comparison to numerical simulations and the simplified resonance estimation method. The responses of the sine sweep tests are plotted in
Figure 14.
Numerical simulations were performed using the presented method for the numerical model of antenna. In this case, not only the value of resonance frequencies were to be registered but also the mode shapes were recognized and matched together, for simulation with neglected contact and for fixed contact edge case. The differences between the vibration modes were: 0.43% for the first mode, 1.18% for the second, and 0.92% for the third one. Results of the satellite antenna tests are presented in
Table 5.
7. Discussion
As presented in the Results section, the differences in resonance frequencies obtained in the tests and estimated with the presented formula were small. In particular, this could be stated compared to the values collected in the method of modal analysis, where the error was of an order higher than for the estimation method.
Differences in the estimation method and tests may occur for several reasons. The method was prepared on one specific geometry. Several tests for other configurations of the geometry were prepared, but the common aspect was contact that allowed a clear second-mode formation in the second half-cycle. While the contact enforces vibration, that will change its shape during half-cycles, and the method will lead to significant errors or will not be applicable anymore. A similar scenario has to be applied to the system with multiple contacts that are closed during vibration. These are the limitations for the estimation method established with the presented research. More research should be completed to verify more cases to develop the field of applicability.
The accuracy of the method is very good compared to the widely used techniques nowadays, which makes it better tool for resonance frequency assessment than modal only analysis.
Despite the limitations, the method shows potential for application in systems with similar contact behavior during vibration, as was presented in the tests of the satellite antenna, which was more complex than the cantilever beam.
8. Summary
In this paper, we presented experimental verification of resonance frequency estimation with the use of modal analysis. The way of creating the estimation formula was described. Furthermore, the experimental verification of the estimation method was presented. The experiment was based on research of resonance for the flat CFRP specimens, which were with and without additional nonstructural mass, as simple geometry, and for the satellite antenna, as a complex object.
The nominal geometry of the specimen was not changed during the tests, only the additional mass of the specimen. Three different specimens were manufactured to verify the test multiple times. The variable in the test for each of the probes was the contact distance measured from fixation.
Based on the results, it could be assumed that the estimation formula predicted resonance frequencies with good accuracy with respect to the values obtained in experimental tests. The tested resonance frequencies differ a lot compared to the values obtained in numerical simulations with the use of always closed or neglected contact modal simulations.
A conclusion may be assumed, based on the presented results, that when the contact effect is more dominant in the structure, the modal simulation errors will increase. The presented formula estimates the resonance frequency much better and might be applicable in industry applications, while further research will be completed.
The formula was also tested for more complex shapes. The satellite antenna was selected for verification. The results of the experimental tests were in good agreement with the estimated values. However, the case was demonstrated that for more complex geometry, the mode shapes in two different half-cycles should be recognized and matched.
The applicability limit that was observed is the contact edge in the model. If the contact edge changes during vibrations, the method is not applicable, because it assumes that there are two visible half-cycles. In addition, closing second or third contact is also not included, for the same reason.
Despite the limitations, the method seems to have potential in industrial application. Further research should be completed in terms of testing more geometries with nonregular shape.


