Article

Study on the Technology Trend Screening Framework Using Unsupervised Learning

1
Machine Learning Big Data Institute, Korea University, Seoul 02841, Korea
2
Department of Big Data and Statistics, Cheongju University, Cheongju 28503, Korea
3
Institute of Engineering Research, Korea University, Seoul 02841, Korea
*
Author to whom correspondence should be addressed.
Appl. Sci. 2022, 12(17), 8920; https://doi.org/10.3390/app12178920
Submission received: 16 August 2022 / Revised: 27 August 2022 / Accepted: 3 September 2022 / Published: 5 September 2022

Abstract

:
Outliers that deviate from a normal distribution are typically removed during the analysis process. However, the patterns of outliers are recognized as important information in the outlier detection method. This study proposes a technology trend screening framework based on a machine learning algorithm using outliers. The proposed method is as follows: first, we split the dataset by time into training and testing sets for training the Doc2Vec model. Next, we pre-process the patent documents using the trained model. The final outlier documents are selected from the preprocessed document data, through voting for the outlier documents extracted using the IQR, the three-sigma rule, and the Isolation Forest algorithm. Finally, the technical topics of the outlier documents extracted through the topic model are identified. This study analyzes the patent data on drones to describe the proposed method. Results show that, despite cumulative research on drone-related hardware and system technology, there is a general lack of research regarding the autonomous flight field.

1. Introduction

Continuous interest has been paid to big data for approximately 10 years, and there has been a continuous emphasis on its importance. Big data was defined as data having 3V properties—Velocity, Volume, and Variety [1]. Moreover, the properties of big data are called 5V, including Value and Veracity, and in particular, value is described as the crucial part of big data [2]. In contemporary society, big data is applied in various fields, such as industries, economics, and logistics, contributing to resolving difficult problems and creating new value.
In technology management, various efforts are being made to derive differentiated strategies using big data, seeking a competitive edge in a difficult business environment. In recent years, the convergence of technologies has actively fostered technological development. As a result, the shortening cycle of technology development necessitates rapid technology development. However, it is difficult to accomplish this due to a corresponding increase in development costs. Thus, companies are seeking, instead of direct R&D, strategies to gain a competitive advantage by jointly utilizing knowledge, such as technology transfer and joint development, or acquiring related companies [3,4,5].
Patents can be considered to be a method to secure the right to knowledge that is the product of R&D in the technology field. A patent is a system that grants exclusive rights to an inventor, rather than disclosing the content of the invention. Many universities, research institutes, and companies apply for and register patents to secure exclusive rights to newly developed technologies. Thus, a patent application or patent registration (hereinafter referred to as a “patent document”) can be said to be a technical document. Patent documents, to describe each technology, are composed using various expressive forms, such as text, pictures, and numbers. Furthermore, these documents include prior research and a general description of a specific field for the legal protection of technology and a clear definition of its rights [6,7]. In this respect, patent analysis has long been recognized as an important approach to evaluating the change in technologies in various aspects [8]. Patent analysis can be conducted from both microscopic and macroscopic viewpoints [7]. The microscopic viewpoint refers to the detailed analysis of a single patent document, while the macroscopic refers to the analysis of a patent portfolio. In particular, recent developments in big data technologies, including data storage and processing, have led to attempts to analyze individual patent documents from a macroscopic viewpoint to accomplish various goals: (a) discovery of promising technologies, (b) search for vacant technologies, (c) technology forecasting, (d) technological road mapping, and (e) analyzing patent trends [6]. The patent big data analysis method analyzes patents utilizing data mining techniques from a macroscopic viewpoint [9,10,11,12,13]. In particular, the analysis of the text of patent documents is characterized by count-based word representation (CBWR), such as bag-of word (BoW), term frequency-inverse document frequency (TF-IDF), and document-term matrix (DTM) [11,14,15,16,17]. The CBWR is a method of vectorizing keywords with the frequency of occurrence regardless of the order of words. In this case, the BoW, which treats homonyms as the same keyword, can misinterpret the analysis results.
Typically, outliers are removed in statistical analysis because they have the potential to cause errors. However, some studies have recognized and utilized outliers as important features [16,18,19,20,21]. With the frequent emergence of new technologies, we often are receiving news about new technology. Because new technology introduced is not widely known yet, the terms of new technology are infrequent in documents. In this respect, keywords with low frequency may be recognized as outliers, which are data that deviate from the distribution or pattern of normal data, and are further removed from the analysis. Jun and Park proposed a method of eliminating a small volume of data from a macroscopic viewpoint to improve this problem [17]. Thus, we intend to propose a framework that can screen technology trends by analyzing outliers in patent documents.
The proposed framework uses representation learning to overcome the limitations of previous research on patent big data analysis based on CBWR. Embedding techniques, such as Word2vec, Doc2vec, and global vectors for word representation (GloVe) have been proposed to overcome the limitation of information loss that occurs during the text vectorization process [22,23,24]. This study utilizes Doc2vec, which is the algorithm that a paragraph or document represents as a vector through learning, to allow similar patent document vectors to be located closer. Thus, we pre-process patent documents through Doc2vec and analyze outlier data to identify technology trends. In this case, this study seeks to discover meaningful information from the outlier data by analyzing it through the outlier detection technique. The proposed framework is able to provide useful information, such as new technology, vacant technology, and emerging technology, from outliers. Therefore, researchers or R&D planners can reduce the losing opportunity and respond to a technology change quickly. The remainder of this research article is organized as follows. Section 2 describes the analysis method using patent big data, Doc2vec, and the Topic model. Section 3 introduces the proposed method in detail, and Section 4 summarizes the experiments conducted based on the method proposed in Section 3. Finally, Section 5 provides a summary of the results and presents implications.

2. Literature Review on Methodology

2.1. Patent Analysis on Management of Technology

Patent analysis is useful for obtaining new information on technology, and establishing technology development strategies by securing technological strengths, weaknesses, and intellectual property (IP) portfolios of competitors [6]. A patent grants exclusive rights to an inventor for a certain period of time in exchange for disclosing the detail of the invention to the public. Some companies are unwilling to apply for a patent to avoid the disclosure of the invention to the public. However, many companies tend to be active in patent applications due to the advantage of a unique market positioning with the strategic utilization of patents. The conventional approaches to understanding technology trends have been focused mainly on analysis based on expert opinions, which is exemplified by the Delphi method [25]. This approach is disadvantageous due to a large deviation in the results depending on the experience and knowledge levels of experts. In addition to the trend of an active patent application for corporate competitiveness, research is being conducted regarding patent analysis based on scientific techniques, due to the recent improvement in computing performance and the development of big data analysis technology [11,14,15,16,17]. Patent data utilized in patent analysis applying text mining techniques are mostly written in text because the rights are protected based on the content of the claims. Accordingly, Yoon et al. proposed a patent analysis method using text mining and network analysis techniques [14]. Jun conducted a study comparing the core technologies of major companies through the network relationship in the international patent classification (IPC), as well as text data in patent data [26]. A technology transfer prediction model was proposed based on patent analysis using quantitative data included in patent data, such as the number of applicants, citations, and claims [27]. As thus far described, patent analysis is a useful technique, which provides valuable information in technology management, as well as objective information in establishing technology development strategies.

2.2. Document Embedding Method—Doc2Vec

Doc2Vec is a method proposed by Quoc Le and Tomas Mikolov in 2014, which is subdivided into distributed memory model of paragraph (PV-DM) and distributed bag of words version given the paragraph vector (PV-DBOW) models [23]. Figure 1a,b shows the PV-DM model and the DBOW model.
A paragraph vector predicts the following word in many contexts sampled from a paragraph. In PV-DM, each paragraph is mapped onto a unique vector and represented in a column of matrix D, and each word is further mapped onto a unique vector and represented by a column of matrix W. Paragraph and word vectors are either averaged or concatenated to predict the following word in context.
y = b + U h ( w t k , , w t + k ; W ) .
In Equation (1), U   and   b are softmax parameters, and h is produced by concatenation or average of word vectors extracted from matrix w. The above method considers the concatenation of the paragraph vectors including the word vector to predict the following word in the text window. PV-DBOW is characterized by training using paragraph vectors alone. A paragraph vector is utilized to classify words in the document, rather than to predict the target word [23]. Thus, PV-DBOW has the advantage of using less memory.

2.3. Outlier and Outlier Detection

Outliers are data that deviate from the distribution or pattern of normal data (inliners) [18,19,20]. Reasons for observing outliers include human error, instrumentation error, and malicious activity [18]. Outliers, exhibiting different patterns from normal data, can induce distortion in statistical data analysis, which is typically considered to be noise data and subjected to data cleansing. In contrast, outliers arising from instrumentation error and malicious activity are characterized by different patterns from normal data, and analysts attempt to obtain new insights from them using various approaches. There have been many studies on ways to extract meaningful information from an abnormal pattern found in outliers.
Outlier detection techniques (ODTs) can be largely divided into two types, anomaly detection and novelty detection, which are representative techniques for using outliers in machine learning. One method, anomaly detection, is to detect noise data that deviates from the distribution or pattern of normal data. The other is novelty detection, which discovers new patterns that have not been observed from normal data [18,20]. That is a technique that performs training regarding only the data located in a normal distribution, considering all data but the data located in the normal distribution to be abnormal. In particular, the latter is widely used to detect risk factors in the security field, including the discovery of terrorist activities, cyberattacks, and credit card fraud, or to detect abnormal signs from facilities [28]. These outliers, which can become either noise or useful information, depending on the viewpoint of the data analysis, can be detected through machine learning algorithms, such as one class-support vector machine (OC-SVM), Isolation Forest (iForest), and density-based spatial clustering of applications with noise (DBSCAN). In the patent analysis and patent mining (as a subfield of technology management), there has been research to apply the aforementioned novelty detection technique to establish a technology development strategy [16,21].

2.4. Topic Model

This study utilizes Latent Dirichlet allocation (LDA), a topic modelling technique, to identify mainstream and non-mainstream technologies. The LDA, a generative probabilistic model proposed by D. Blei (2003), is a three-level hierarchical Bayesian model: corpus-level parameter, document-level parameter, and word-level variable [29]. Figure 2 shows the structure of the LDA.
Following the generative process for each document w in a corpus D is assumed in LDA.
  • Choose N ~ P o i s s i o n ( ξ )
  • Choose θ ~ D i r ( α )
  • For each of the N words w n
    • Choose a topic z n ~ Multinomial ( θ )
    • Choose a word w n from p ( w n | z n , β ) , a multinomial probability conditioned on the topic z n
The dimensionality k of the Dirichlet distribution can be selected through known or fixed. Topic variable z follows the dimensionality k of the Dirichlet distribution. Next, the word probabilities are parameterized by a k × V matrix β where β i j = p ( w j = 1 | z i = 1 ) , treated as a fixed quantity to be estimated. The Poisson assumption is not important, more realistic document length distributions can be used as needed. The k-dimensional Dirichlet random variable θ may have a value in ( k 1 ) -simplex. The probability density on simplex is shown in Equation (2). The parameter α is a component where α i > 0 and Γ ( x ) is a Gamma function.
p ( θ | α ) = Γ ( i = 1 k α i ) i = 1 k Γ ( α i ) θ 1 α 1 1 θ k α k 1
Given the parameters α , β , which are corpus level parameters, the joint distribution of a topic mixture θ , a set of N topics z , and a set of N words w can be represented as in Equation (3).
p ( θ , z , w | α , β ) = p ( θ | α ) n = 1 N p ( z n | θ ) p ( w n | z n , β ) ,
where p ( z n | θ ) is θ i for the unique i such that z n i = 1 . The integral for θ , and the sum for z , resulting in a marginal distribution for the document as shown in Equation (4).
p ( w | α , β ) = p ( θ | α ) ( n = 1 N z n p ( z n | θ ) p ( w n | z n , β ) ) d θ ,
Ultimately, as shown in Equation (5), the probability of corpus can be obtained as the product of the marginal probability for single documents.
p ( D | α , β ) = d = 1 M p ( θ d | α ) ( n = 1 N z n p ( z d n | θ d ) p ( w d n | z d n , β ) ) d θ d

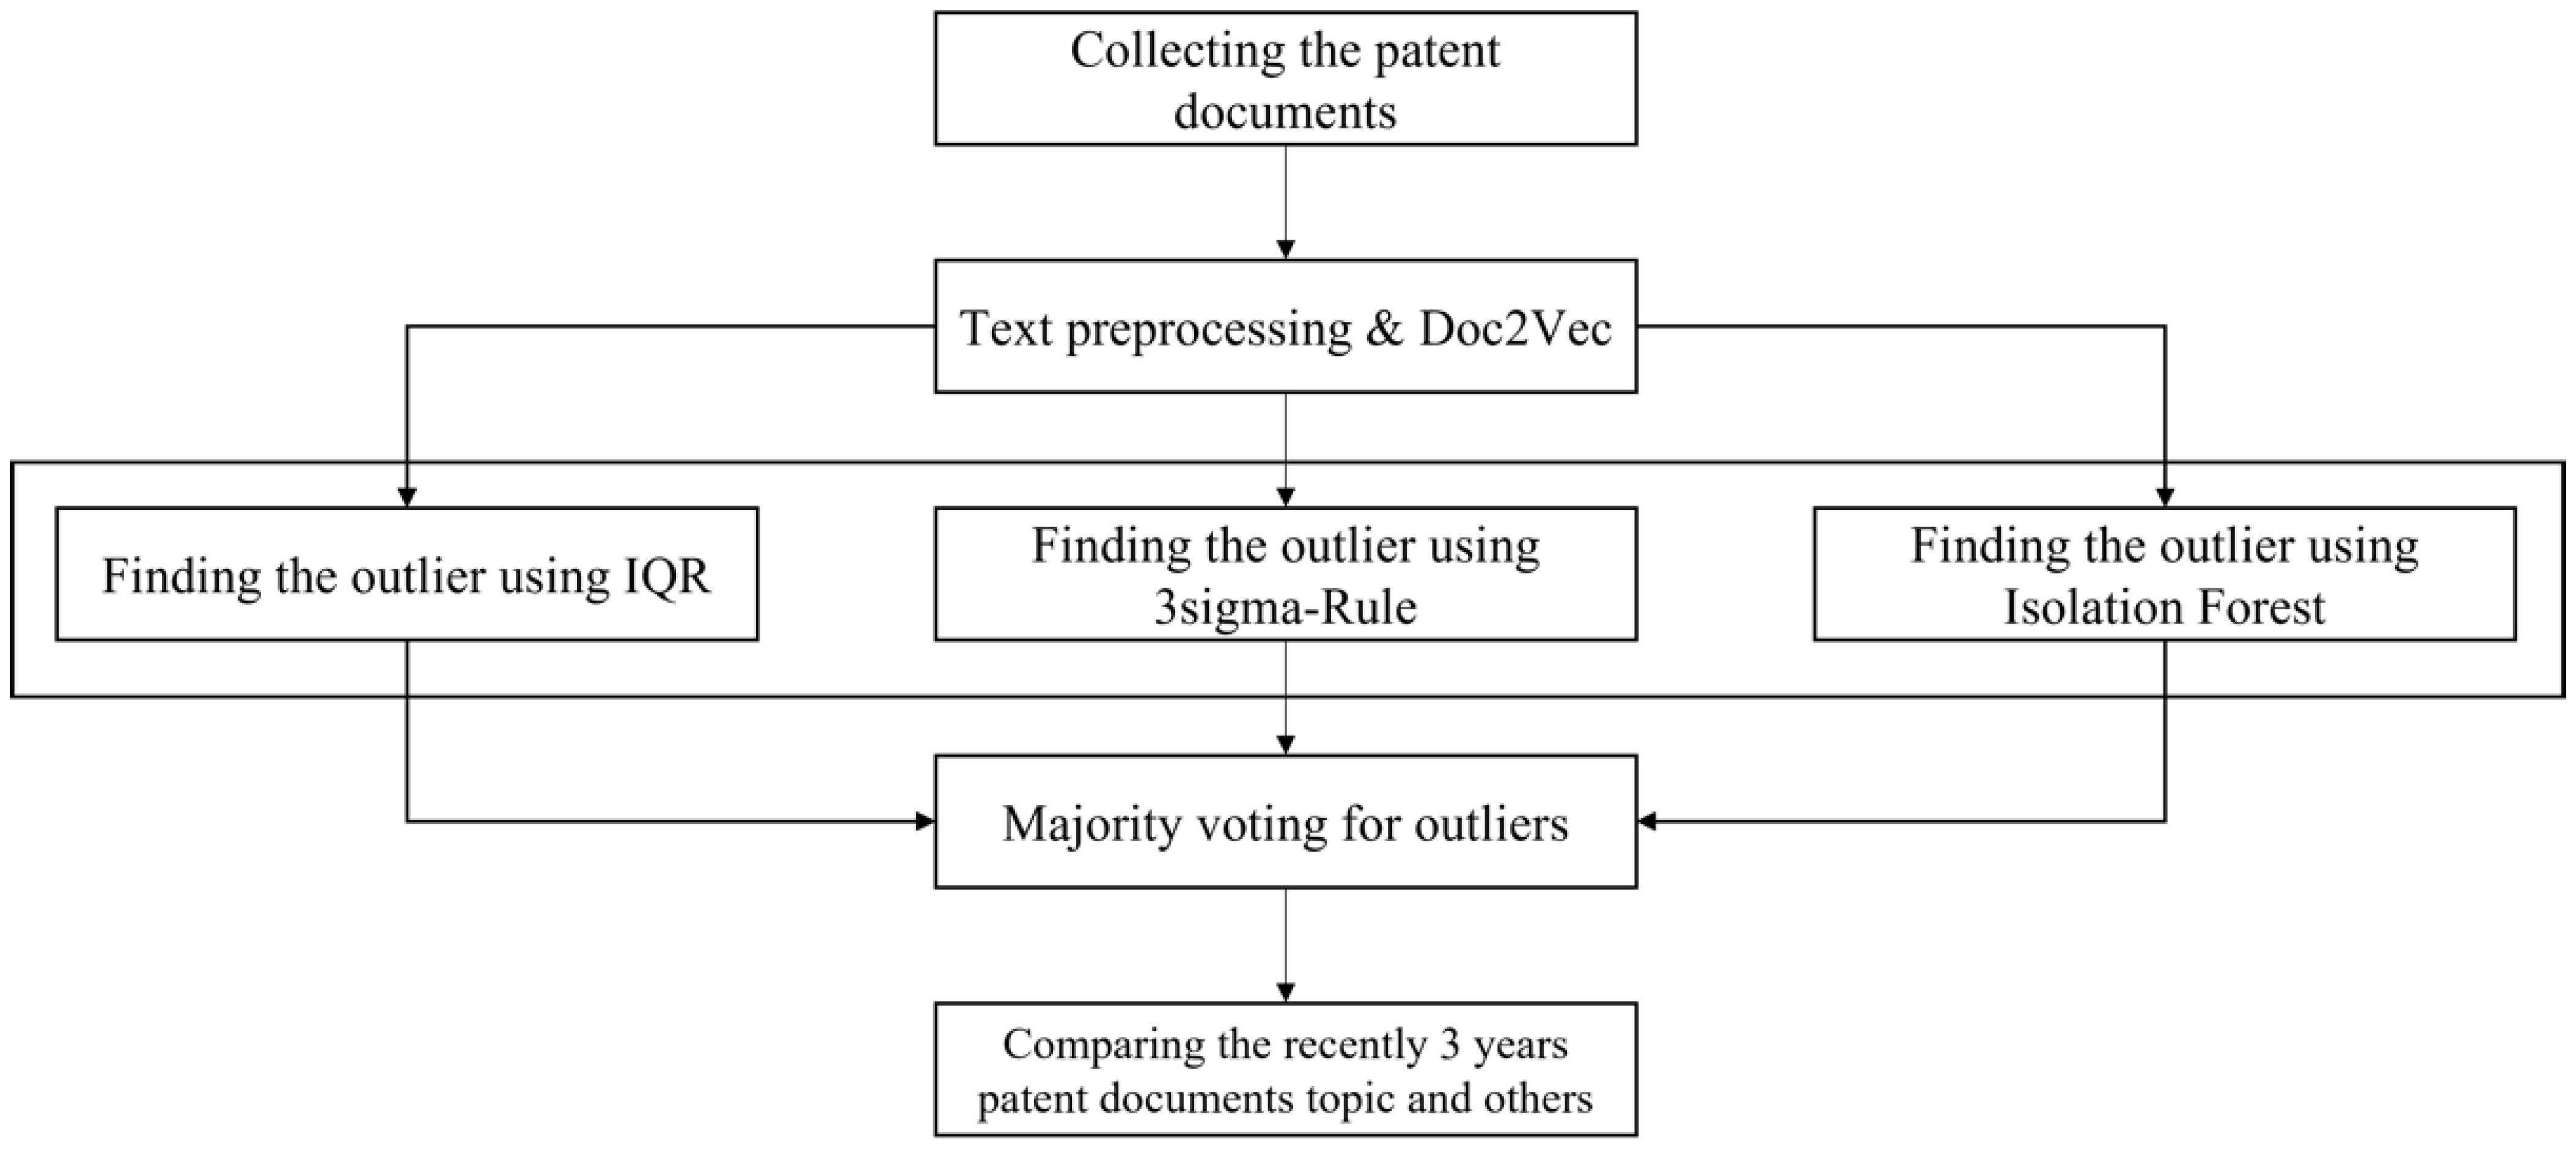
3. Proposed Methodology

This section explains details of the technology trend screening framework. The proposed methodology is based on a machine learning algorithm. Figure 3 shows the flowchart for the proposed.
To describe the proposed method, this study utilizes patent data on drone technology. The study procedure is described below:
(Step 1) Collecting the drone patent documents
(1-1) Search and collect drone-related technology patent data in the patent database
(1-2) Remove noise data, and create the valid dataset
(Step 2) Preprocessing the Patent dataset
(2-1) Parse collected patent data
(2-2) Remove stopwords, punctuation, etc.
(2-3) Standardize data with a Document-Term matrix
(Step 3) Apply the Doc2Vec model to structured data.
(3-1) Split the pre-processed data into train and test sets for training the Doc2Vec model
(3-2) Identify Inner and Outliers of document vector using IQR
(3-3) Identify Inner and Outliers of document vector using three-sigma
(3-4) Identify Inner and Outliers using the iForest algorithm
(3-5) Select the final outlier through voting for outliers derived through three methods
(Step 4) Apply the LDA model to the Inner set and Outlier set
(4-1) Calculate perplexity to determine the optimal number of topics, k
(4-2) Derive Topic through LDA application to Inner and Outlier sets of document vector for the Train Set
(4-3) Derive Topic through LDA application to Inner and Outlier sets of document vector for Test Set
(Step 5) Identify the changes in Train Topic and Test Topic, and apply them to R&D Planning

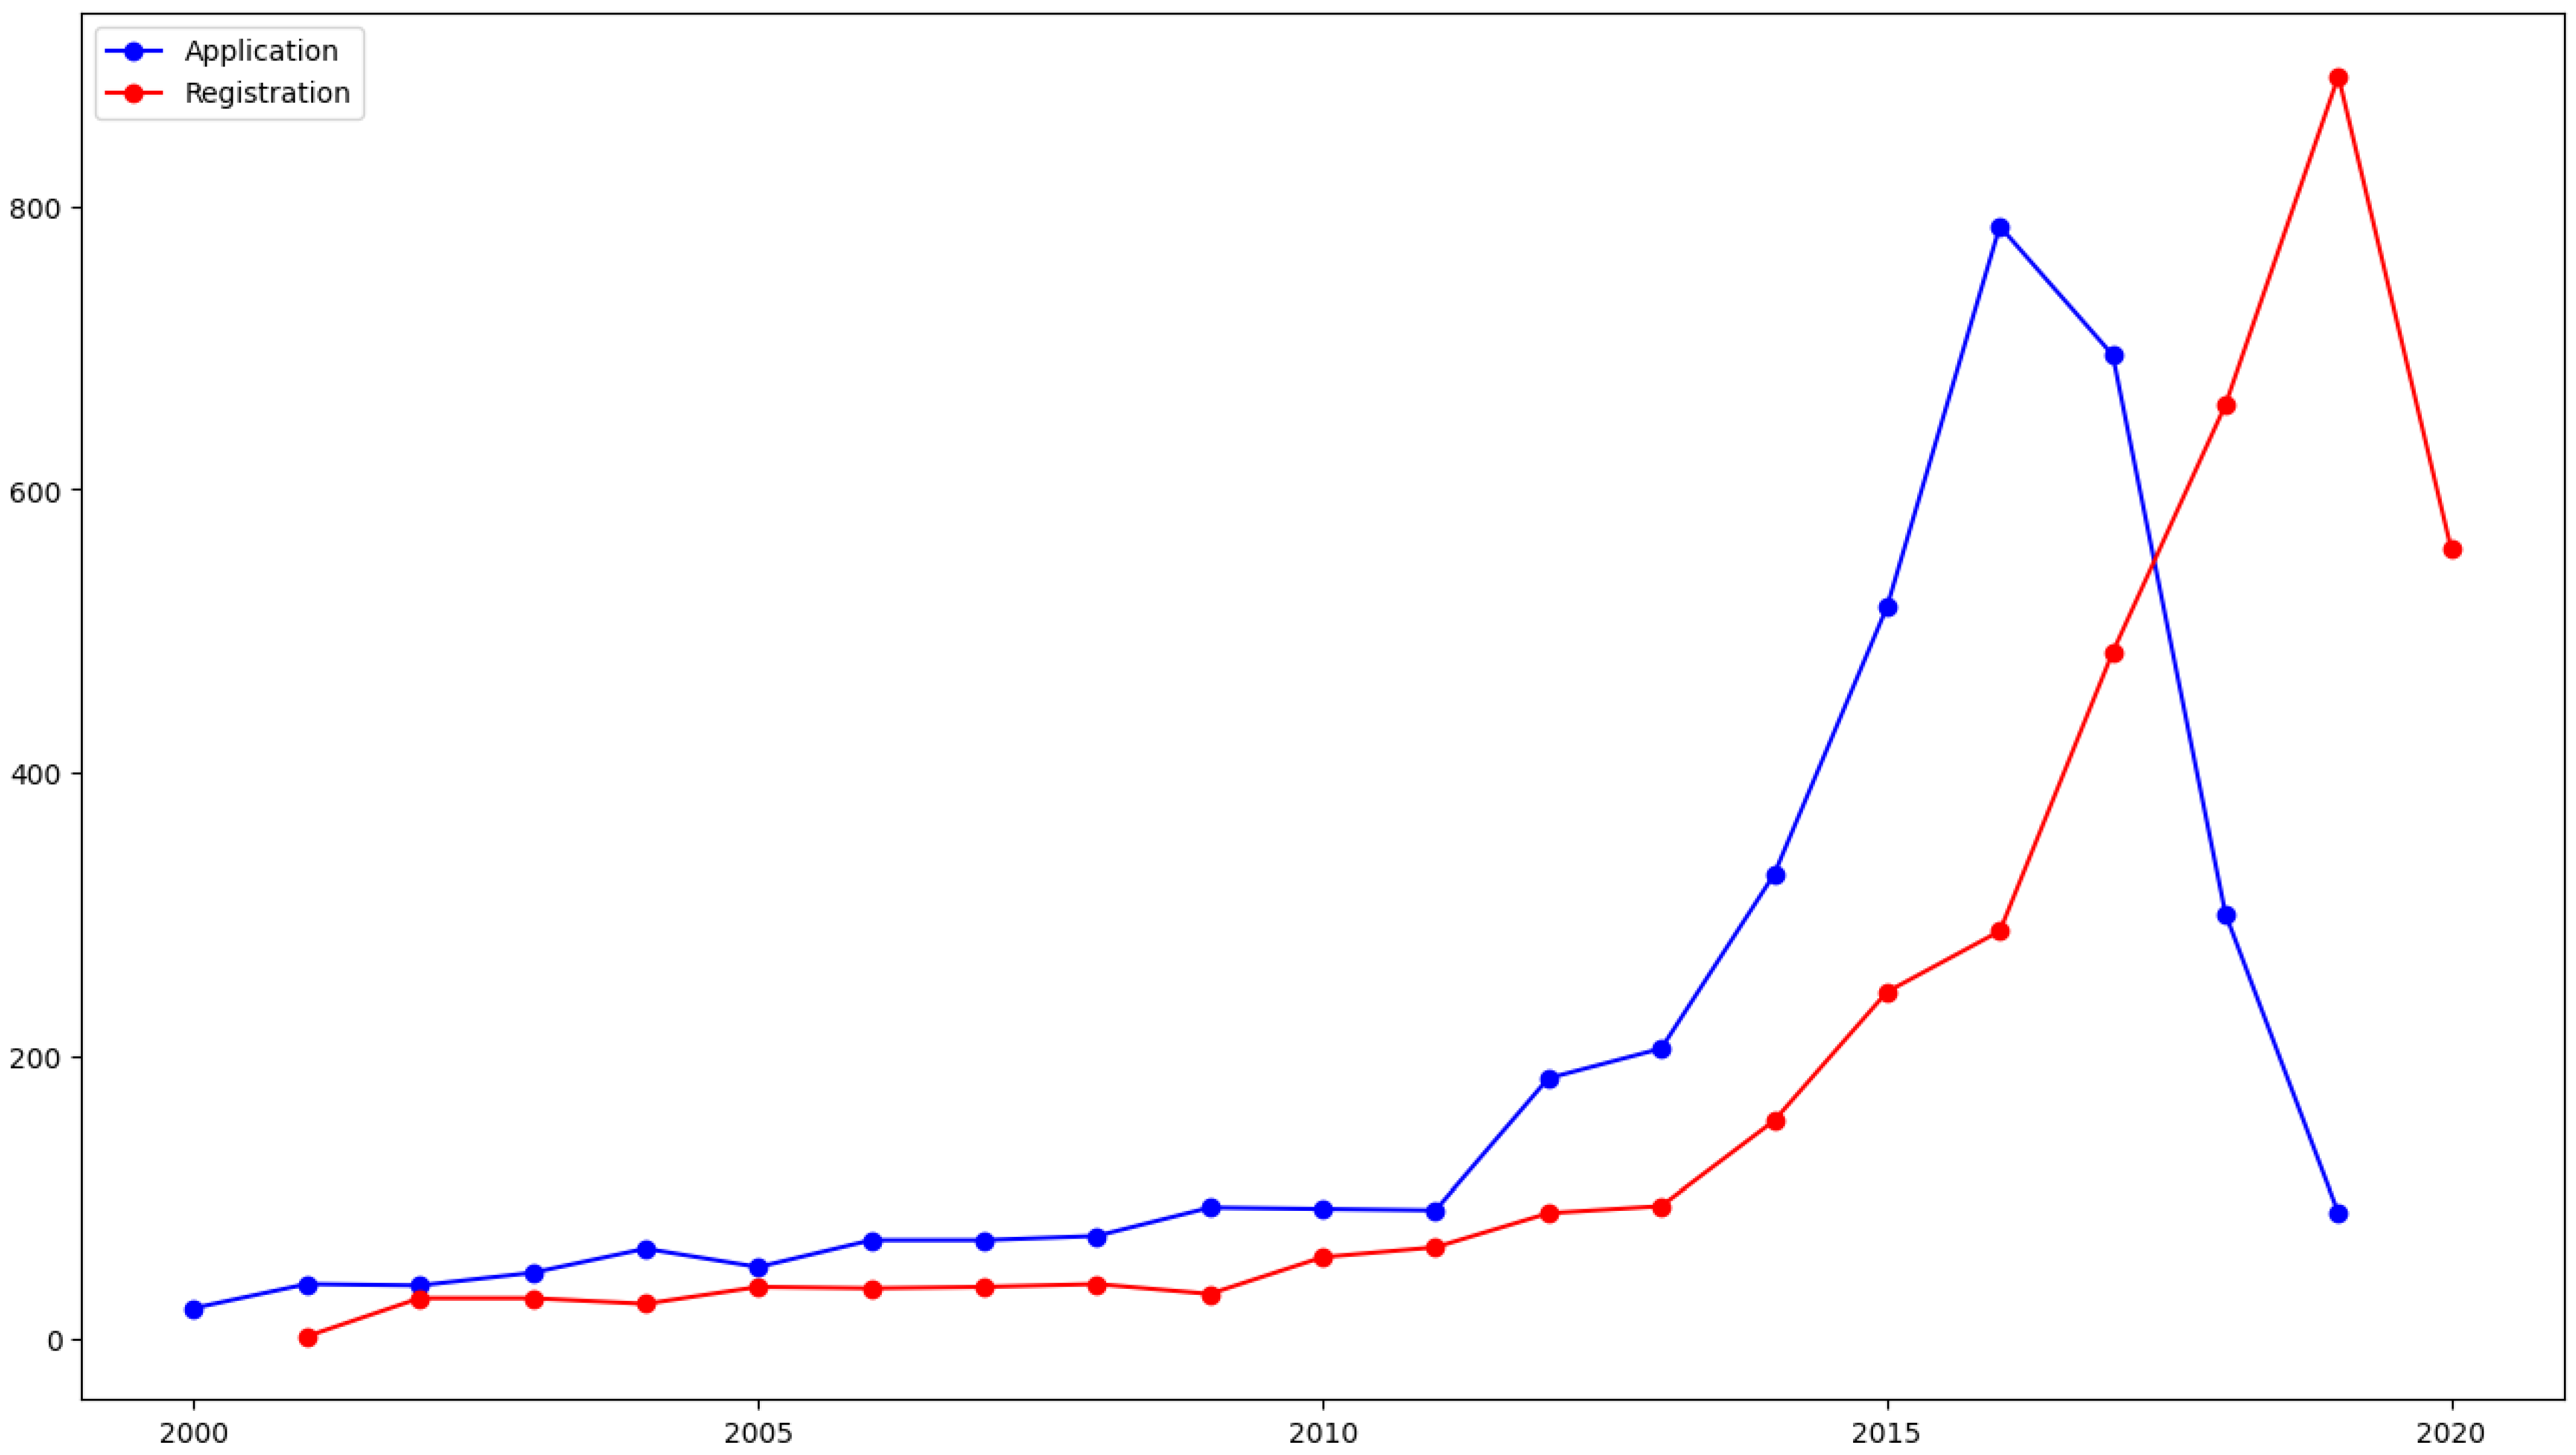
3.1. Collecting the Data

We use the patent data on the drone technical field to explain the proposed methodology, due to our research proposal being to describe the technology trend screening methodology. A drone is an unmanned aerial vehicle that flies without a human driver. As the high utility value of drones is recognized, and their prices become relatively lower, there has been related research conducted in various fields, such as military use, agriculture, and mobility. To describe the proposed methodology, we collect the patent data from KIPRIS (a Korean industrial property information search service), which provides the patent information that searchers needed. Table 1 below shows the results of searching for patents on drone technology.

3.2. Apply the Doc2Vec

Patent data is document data including various types of information, such as text, pictures, and numbers. In particular, the analysis of the text, where the content of the technology is described, is essential. This study is aimed mainly at proposing a framework that can screen technological changes by using patent document data. Thus, this study utilizes the text of patent data.
Text data, which is representative of unstructured data, is required conversion into structured data through pre-processing. Pre-processing of text data includes the removal of stopwords, such as “a,” “the,” “by,” “as,” and “to,” of punctuation and of unnecessary symbols.
After text pre-processing, the document data are able to be embedded as vectors through the Doc2vec model. As introduced in Section 2.2, similar documents are located at closer coordinates, dissimilar documents are located at relatively more distant coordinates, and vice versa. Table 2 presents the hyperparameters of the Doc2vec algorithm applied to represent the pre-processed patent document as vectors.

3.3. Technology Trend Screening Using Outlier Detection and Topic Model

This section will describe the proposed technology trend screening method based on a machine learning algorithm. Figure 4 shows the proposed approach. The key to our approach is to obtain information in outliers and present how to apply that in technology management.
This study utilizes the document embedding results performed in Section 3.2 for technology trend screening. An outlier detection method is applied to distinguish mainstream and non-mainstream technologies in document embedding results. Three techniques, as shown in Figure 3, are applied to find outliers to enhance the accuracy of the analysis: (1) finding the outlier using interquartile range(IQR) (2) finding the outlier using the three-sigma rule (3) finding the outlier using iForest.
The outlier detection method using IQR, IQR can be calculated using Equation (6). Q1 and Q3 refer to the first and third quartiles, respectively.
IQR = Q 3   Q 1
If an observation value is smaller than Q 1 1.5 × IQR , or larger than Q 3 + 1.5 × IQR , the value is determined to be an outlier.
The technique to find outliers using the three-sigma rule is described as follows. When the distribution of data is a normal distribution, an outlier is determined if it deviates from Equation (7). μ and σ refer to mean and standard deviation, respectively.
μ ± 3 σ
iForest, a machine learning-based outlier detection algorithm proposed by Fei et al., is executed based on the regression decision tree [30]. In iForest, because normal data requires recursive binary partitioning, which is not true for outliers, there is an assumption that its depth is close to the root node.
Non-mainstream outliers are selected through voting for the set of outliers derived through each outlier detection technique. LDA is utilized to identify technical topics for the selected set of outliers. Table 3 shows the hyperparameters for the LDA model.
Perplexity is one of the measures for evaluating a probabilistic model, which determines how well a model performs a prediction for a given dataset [29]. Because LDA is one of the representative probabilistic models, it can be evaluated using perplexity. A lower perplexity value represents a better generalization performance. When there are M document test sets, perplexity can be obtained by using Equation (8).
p e r p l e x i t y ( D t e s t ) = e x p { d = 1 M log p ( w d ) d = 1 M N d }
As mentioned above, perplexity is primarily identified to determine the optimal number of topics. Therefore, the lowest perplexity value can be considered optimal k.

4. Experiments and Results

To describe the trend screening framework proposed in this study, drone data is utilized as shown in Section 3.1. The graph shown in Figure 5 shows the trends of drone patent applications and registrations per annum.
According to the trend of drone patent applications, there has been a drastic increase since 2010. The number of registered patents has increased proportionately. Since it takes 18 months for a patent to be published, we do not consider the drastic decrease in drone-related patents after 2018 in our research.
The data are dimensionally reduced to two dimensions using Doc2vec to analyze the collected drone data using the proposed framework. In this case, the hyperparameters of the Doc2vec model are shown in Table 2. The data are arranged by year to identify the history of drone technology. Table 4 presents the quantities of inclusive data by year. The data are split depending on the periods separated shown in Table 4, and further pre-processed through word embedding.
Three outlier extraction techniques are applied to construct an ensemble outlier extraction model based on the pre-processed text data, First, outliers are extracted by using IQR. Table 5 shows the criteria for the upper and lower bounds using IQR.
Figure 6 shows the results of applying the outlier extraction method using IQR. The boundary is represented as a red box based on the criteria of Table 5; there is a significant decrease in the outlier documents of the testing section in comparison between the train sets.
Second, the three-sigma rule is applied to extract outliers. Table 6 shows the upper and lower bounds for outliers calculated according to the three-sigma rule.
Figure 7 shows the result of applying the three-sigma rule. As previously stated, the boundary is shown as a red box in the figure; outlier documents were present on the lower bound along the y-axis in the training set, while no outlier was identified at the same location of the testing set.
Finally, the result of applying iForest is shown in Figure 8. As a result, the number of outlier documents was reduced in the test set located at the bottom of the graph, similar to using the three-sigma rule.
The final outlier document is determined using the ensemble outlier extraction model proposed in this study. Table 7 shows the results from each outlier extraction method regarding whether documents are outliers.
As shown in Table 7, a technical document is finally selected as an outlier through voting for the results of IQR, the three-sigma rule, and iForest. In this study, when an outlier is selected from two or more methods, it is judged as the final outlier description document.
Figure 9 presents the annual trend of outliers derived through the proposed method. It shows a continuously increasing trend in the number of outliers from 2001 to 2016. In particular, there was a drastic increase in the number of patent applications corresponding to outliers from 2013. Despite the recent three-year decrease on the graph, the collected data may include unpublished patents, considering that patents are published 18 months after their filing. Thus, the data until 2017 are examined, and the results show that there were many outliers in 2017. In this respect, because the proposed method classifies the recently applied patents as outliers, this method is capable of screening technology trends.
This study utilizes the topic model to identify the topic of the technology located in both inner and outlier parts. As described in Section 3.3, the optimal number of topics is set based on perplexity, and this study determines the optimal number of topics where perplexity is minimum.
Figure 10 indicates the values of inner and outer perplexity values in the training and testing datasets, respectively. According to the results, the perplexity value is the lowest when k = 9 in both training and test sections of the inner set, while it is lowest when k = 1 in both training and test sections of the outlier set. We extract topics through the topic model based on the above results, which are presented in Table 8.
Among the documents included in the training set, nine technical topics in the inner set can be identified, and one in the outlier set. The detailed topics included in the inner set of the training set indicate that the technology development is related mainly to the drone’s hardware and functions. However, there is a relative lack of technology related to the drone control system. In contrast, nine technical topics can be identified from the documents included in the testing set, whose development was related mainly to network, fuel, and drone control. However, there is a relative lack of technology related to flight control in the outlier set of the testing set. This result may be attributed to the recent autonomous flight control technology, which could be considered to be a vacant technology.

5. Conclusions and Future Research

This study proposes a technology trend screening framework using outliers. Previous studies have presented various methods for selecting keywords from patent documents, aiming at technology forecasting, the discovery of promising technologies, and the search for vacant technologies. However, the previous keyword-based method risks information loss during the pre-processing step. This study, to overcome these limitations, presents a method for interpreting outliers as a new pattern, from a technological viewpoint. DTM is generated by pre-processing text from the collected patent documents by minimizing the amount of information loss. The latest three-year data based on the time series are assigned to the testing dataset, while the remaining data are assigned to the training dataset to train the Doc2vec model. The trained model is utilized to reduce each embedded document to two dimensions. The inner and outlier parts are distinguished by applying outlier detection techniques, IQR, the three-sigma rule, and iForest, to the dimensionally reduced patent document data. The outliers extracted through each technique are used to construct an ensemble outlier extraction model proposed through voting. The final inner and outlier sets are determined through the constructed model, and the topic model is further applied to identify the technical description included in each set. According to the results of analyzing the drone technology field using the method proposed in this study, research was done regarding the technical fields related to the hardware and functions of the drone during the period included in the training set. In contrast, there is a lack of research on drone systems. The latest three-year technological change revealed that technology development has been related mainly to network, fuel, and drone control. However, the flight control technology field was determined to be an outlier, which may be attributed to the recent research on autonomous flight. Therefore, the autonomous flight field will be a vacant or promising technology for future studies in the drone field.
This study is significant in that it proposed a technology trend screening framework that offers a guide to considering outliers as new patterns, or new or vacant technologies. In our research, we use unsupervised learning to identify detailed technology in each inner and outlier set. Due to depending on text information only, there is a limitation that the performance of the model cannot be measured. In future research, there is a need to consider an outlier detection method through supervised learning to secure the reliability of the model. Also, we try to apply the XAI (explainable AI) techniques to explain in more detail why a patent has novelty or not. These efforts are expected to help technology-based corporates establish more effective strategies in the future.

Author Contributions

J.L. (Junseok Lee) designed this research and conducted the experiment as described. S.P. collected the data set for the experiment. J.L. (Juhyun Lee) analyzed the data to show the validity of this paper. In addition, all authors cooperated with each other in revising the paper. All authors have read and agreed to the published version of the manuscripts.

Funding

This work was supported by the National Research Foundation of Korea (NRF) grant funded by the Korean government (MSIT) (No. NRF-2020R1A2C1005918). This research was supported by Basic Science Research Program through the National Research Foundation of Korea(NRF) funded by the Ministry of Education (No. NRF-2022R1I1A1A01069422). This research was supported by the MOTIE (Ministry of Trade, Industry, and Energy) in Korea, under the Human Resource Development Program for Industrial Innovation (Global) (P0017311) supervised by the Korea Institute for Advancement of Technology (KIAT).

Institutional Review Board Statement

Not applicable.

Informed Consent Statement

Not applicable.

Data Availability Statement

Not applicable.

Conflicts of Interest

The authors declare no conflict of interest.

References

  1. Oussous, A.; Benjelloun, F.Z.; Ait Lahcen, A.; Belfkih, S. Big Data Technologies: A Survey. J. King Saud Univ. Comput. Inf. Sci. 2018, 30, 431–448. [Google Scholar] [CrossRef]
  2. Monino, J.L. Data Value, Big Data Analytics, and Decision-Making. J. Knowl. Econ. 2021, 12, 256–267. [Google Scholar] [CrossRef]
  3. Kang, J.; Lee, J.; Jang, D.; Park, S. A Methodology of Partner Selection for Sustainable Industry-University Cooperation Based on LDA Topic Model. Sustainability 2019, 11, 3478. [Google Scholar] [CrossRef]
  4. Jacob, M.; Hellström, T.; Adler, N.; Norrgren, F. From Sponsorship to Partnership in Academy-industry Relations. RD Manag. 2000, 30, 255–262. [Google Scholar] [CrossRef]
  5. Santoro, M.D.; Betts, S.C. Making Industry-University Partnerships Work. Res. Technol. Manag. 2002, 45, 42–46. [Google Scholar] [CrossRef]
  6. Abbas, A.; Zhang, L.; Khan, S.U. A Literature Review on the State-of-the-Art in Patent Analysis. World Pat. Inf. 2014, 37, 3–13. [Google Scholar] [CrossRef]
  7. Bonino, D.; Ciaramella, A.; Corno, F. Review of the State-of-the-Art in Patent Information and Forthcoming Evolutions in Intelligent Patent Informatics. World Pat. Inf. 2010, 32, 30–38. [Google Scholar] [CrossRef]
  8. Abraham, B.P.; Moitra, S.D. Innovation Assessment through Patent Analysis. Technovation 2001, 21, 245–252. [Google Scholar] [CrossRef]
  9. Lee, C.; Lee, G. Technology Opportunity Analysis Based on Recombinant Search: Patent Landscape Analysis for Idea Generation. Scientometrics 2019, 121, 603–632. [Google Scholar] [CrossRef]
  10. Kim, G.; Bae, J. A Novel Approach to Forecast Promising Technology through Patent Analysis. Technol. Forecast. Soc. Chang. 2017, 117, 228–237. [Google Scholar] [CrossRef]
  11. Kim, G.; Park, S.; Jang, D. Technology Analysis from Patent Data Using Latent Dirichlet Allocation. In Proceedings of the Soft Computing in Big Data Processing; Lee, K.M., Park, S.-J., Lee, J.-H., Eds.; Springer International Publishing: Cham, Switzerland, 2014; pp. 71–80. [Google Scholar]
  12. Yoon, B.; Park, Y. A Systematic Approach for Identifying Technology Opportunities: Keyword-Based Morphology Analysis. Technol. Forecast. Soc. Chang. 2005, 72, 145–160. [Google Scholar] [CrossRef]
  13. Kim, T.S.; Sohn, S.Y. Machine-Learning-Based Deep Semantic Analysis Approach for Forecasting New Technology Convergence. Technol. Forecast. Soc. Chang. 2020, 157, 120095. [Google Scholar] [CrossRef]
  14. Yoon, B.; Park, Y. A Text-Mining-Based Patent Network: Analytical Tool for High-Technology Trend. J. High Technol. Manag. Res. 2004, 15, 37–50. [Google Scholar] [CrossRef]
  15. Park, S.; Lee, S.J.; Jun, S. Patent Big Data Analysis Using Fuzzy Learning. Int. J. Fuzzy Syst. 2017, 19, 1158–1167. [Google Scholar] [CrossRef]
  16. Wang, J.; Chen, Y.J. A Novelty Detection Patent Mining Approach for Analyzing Technological Opportunities. Adv. Eng. Inform. 2019, 42, 100941. [Google Scholar] [CrossRef]
  17. Park, S.; Jun, S. Patent Analysis Using Bayesian Data Analysis and Network Modeling. Appl. Sci. 2022, 12, 1423. [Google Scholar] [CrossRef]
  18. Chandola, V.; Kumar, V. Outlier Detection: A Survey. ACM Comput. Surv. 2007, 14, 15. [Google Scholar]
  19. Singh, K.; Upadhyaya, S. Outlier Detection: Applications And Techniques. Int. J. Comput. Sci. Issues 2012, 9, 307–323. [Google Scholar]
  20. Sikder, M.N.K.; Batarseh, F.A. Outlier Detection Using AI: A Survey. arXiv 2021, arXiv:2112.00588. [Google Scholar]
  21. Jeon, D.; Ahn, J.M.; Kim, J.; Lee, C. A Doc2vec and Local Outlier Factor Approach to Measuring the Novelty of Patents. Technol. Forecast. Soc. Chang. 2022, 174, 121294. [Google Scholar] [CrossRef]
  22. Mikolov, T.; Chen, K.; Corrado, G.; Dean, J. Efficient Estimation of Word Representations in Vector Space. arXiv 2013, arXiv:1301.3781. [Google Scholar]
  23. Le, Q.V.; Mikolov, T. Distributed Representations of Sentences and Documents. arXiv 2014, arXiv:1405.4053. [Google Scholar]
  24. Pennington, J.; Socher, R.; Manning, C.D. GloVe: Global Vectors for Word Representation. In Proceedings of the 2014 Conference on Empirical Methods in Natural Language Processing (EMNLP), Doha, Qatar, 25–29 October 2014. [Google Scholar]
  25. Roper, A.T.; Cunningham, S.W.; Porter, A.L.; Mason, T.W.; Rossini, F.A.; Banks, J. Forecasting and Management of Technology, 2nd ed.; Wiley: Hoboken, NJ, USA, 2011; ISBN 9780470440902. [Google Scholar]
  26. Jun, S.; Park, S. Examining Technological Competition between BMW and Hyundai in the Korean Car Market. Technol. Anal. Strateg. Manag. 2016, 28, 156–175. [Google Scholar] [CrossRef]
  27. Lee, J.; Kang, J.H.; Jun, S.; Lim, H.; Jang, D.; Park, S. Ensemble Modeling for Sustainable Technology Transfer. Sustainability 2018, 10, 2278. [Google Scholar] [CrossRef]
  28. Chalapathy, R.; Chawla, S. Deep Learning for Anomaly Detection: A Survey. arXiv 2019, arXiv:1901.03407. [Google Scholar]
  29. Blei, D.M.; Ng, A.Y.; Jordan, M.I. Latent Dirichlet Allocation. J. Mach. Learn. Res. 2003, 3, 993–1022. [Google Scholar]
  30. Liu, F.T.; Ting, K.M.; Zhou, Z.H. Isolation-Based Anomaly Detection. ACM Trans. Knowl. Discov. Data 2012, 6, 1–39. [Google Scholar] [CrossRef]
Figure 1. Doc2Vec Model (a) Distributed Memory Model, (b) Distributed Bag of Words Model [23].
Applsci 12 08920 g001
Figure 2. LDA algorithm [29].
Applsci 12 08920 g002
Figure 3. Flowchart for proposed technology trend screening.
Applsci 12 08920 g003
Figure 4. Concept for the Technology Trend Screening.
Applsci 12 08920 g004
Figure 5. Drone patent applications and registrations trends per annum.
Applsci 12 08920 g005
Figure 6. The result of document embedding (IQR).
Applsci 12 08920 g006
Figure 7. The result of document embedding (three-sigma rule).
Applsci 12 08920 g007
Figure 8. The result of document embedding (iForest).
Applsci 12 08920 g008
Figure 9. Patent application trends by year based on outliers.
Applsci 12 08920 g009
Figure 10. The perplexity graph for topic model (a) training set—inner set (b) training set—outlier set (c) testing set—inner set (d) testing set—outlier set.
Applsci 12 08920 g010
Table 1. Collected data—Patent data.
Technical FieldNumber of Avg. Words in DocumentNumber of DocumentsPeriod
Drone6363854January 2000–December 2019
Table 2. Hyperparameters for the Doc2vec model.
HyperparameterCandidates
Vector size2
Window10
Minimum count2
Epoch30
Table 3. Hyperparameters for the LDA model.
HyperparameterCandidates
Inference AlgorithmGibbs Sampling
The Number of KFrom 1 to 10
Parameter   α α = 1.0 T
Table 4. The number of data according to years.
2000–20162017–2019
Number of documents27701084
Table 5. Criteria for the upper and lower bounds using IQR.
X-AxisY-Axis
IQR1.2412.600
Minimum   ( Q 1 1.5 × IQR ) −1.045−5.834
Maximum   ( Q 3 + 1.5 × IQR ) 3.9184.567
Table 6. Descriptive Statistic for Documents vectors.
MeanStd.Outlier (Left)Outlier (Right)
X-axis1.5411.081−1.7024.784
Y-axis−0.7451.864−6.3384.848
Table 7. Result of Ensemble Outlier Detection.
Document No.IQR3 Sigma-RuleiForest
US 10000285
US 10029790
US 9310207
US 9989378
Table 8. Result of the topic model.
Technology AreaTopic No.Topic DescriptionKeyword
Inner
in Training set
1Navigation & sensor technologydata, determin, flight, base, devic, sensor, inform, processor, method, compris
2Drone network technologydrone, signal, commun, receiv, system, object, configure, modul, data, network
3HMI(Human Machine Interface) technologycontrol, system, flight, oper, mode, command, configur, unit, signa, devic
4Thrust technologywing, rotat, rotor, motor, drive, propel, fuselag, axi, blade, propuls
5Payload technologycaptur, portion, configur, compris, assembl, posit, surfac, coupl, member, arm
6Perception technologyuav, vehicl, aerial, unman, imag, locat, area, camera, may, sensor
7Energy management technologypower, deliveri, air, electr, packag, system, batteri, energi, transport, sourc
8Technology for mission capablecell, platform, mobil, robot, light, beam, tower, array, plural, extern
9Drone landing technologyaircraft, land, posit, ground, point, zone, method, featur, speed, later
Outlier
in Training set
1UAS(unmanned aircraft system) Tech.control, vehicl, system, uav, compris, imag, flight, devic, aircraft, data
Inner
in Testing set
1Payload technologymotor, portion, propel, payload, configur, plural, support, packag, compris, arm
2Drone structure technologyrotor, assembl, wing, propuls, rotat, axi, vertic, surfac, bodi, lift
3Location estimation technologydata, drone, determin, locat, base, plural, sensor, method, processor, devic
4Network infra technologysignal, commun, wireless, system, devic, receiv, mobil, network, modul, antenna
5Fuel cell technologybatteri, configur, posit, coupl, deploy, unit, include, member, connect, compris
6Communication control technologyvehicl, uav, aerial, unman, system, control, configur, compris, may, commun
7Perception technologyimag, object, captur, camera, light, detect, virtual, len, plural, design
8Charging technologypower, electr, station, main, state, subsystem, connect, protect, left, adapt
9Thrust control & landing technologycontrol, aircraft, flight, oper, system, mode, command, signal, thrust, gener
Outlier
in Testing set
1Flight control technologyvehicl, aerial, system, drone, control, unman, flight, compris, posit, configur
Publisher’s Note: MDPI stays neutral with regard to jurisdictional claims in published maps and institutional affiliations.

