Article

Parametric Assessment of Surface Topography and Its Influence on Joint Tightness of Non-Separable Joints for Thin Wall Applications

1
Mechanical Design Department, INTROL PRO-ZAP Sp. z o.o., Grabowska 47a, 63-400 Ostrów Wielkopolski, Poland
2
Faculty of Mechanical Engineering, Opole University of Technology, St. Mikołajczyka 5, 45-271 Opole, Poland
3
Zakład Mechaniczny Zalesie, Lamki Zalesie 11, 63-400 Ostrów Wielkopolski, Poland
*
Authors to whom correspondence should be addressed.
Appl. Sci. 2022, 12(17), 8917; https://doi.org/10.3390/app12178917
Submission received: 29 July 2022 / Revised: 26 August 2022 / Accepted: 31 August 2022 / Published: 5 September 2022
(This article belongs to the Section Surface Sciences and Technology)

Abstract

:
This article describes the research carried out on six thin-walled groups of samples produced from the aluminum alloy 6060 T4 by a turning and milling operation. Additionally, the analysis of the surface topography was carried out, focusing on three-dimensional parameters, such as Sq, Ssk, Sku, Sp, Sv, Sz, Sa, Spd, and Spc. Moreover, the article contains the tests of the tightness of various types of surfaces with different clamping forces of the tested elements. Furthermore, an attempt was made to find significant representatives of the surface topography to obtain the smallest leakage between the mating surfaces. The maximum clamping force obtained in the tests between the pairs was 9060 N. Finally, it is worth mentioning that the presented surface tests can serve as the required parameters for joined elements in the production of non-detachable joints by, for example, clinching.

1. Introduction

The automotive and aviation industries, with the assumed pace of new product development and the rules related to the sequence of making the construction of individual machine parts, determine the possibilities of creating smaller components, as well as the manner of their implementation [1,2,3]. Difficulties resulting from the above aspects translate into forces or moments that should be assigned to production tools. Due to these activities, the results should be obtained in the form of an appropriate joint with a given tightness and strength. Construction activities in this area are associated with limited development options that can be used to supply the required energy to the system. Selected facilities are dedicated to connections in the automotive industry and can be used in the production of heat exchangers for the aviation industry. The tested connection of the pipe with the stub pipe is based on two cases in the air conditioning system on the high- and low-pressure side, as well as heating or cooling systems. The basis for the research is the permanent connection of the thin wall tube (tank) with the connection block designed with the thin wall. This common solution is used due to the reduction in the amount of material in the connected parts, which has an impact on the final price of the component. This methodology is more difficult to manufacture, and thus it is very important to prepare the proper surface for the parts.
One embodiment of joining a relatively large diameter pipe to another member may be to use a cylinder tool that maps the bayonet grooves on the pipe. Research in this area was conducted by Zeng et al. [4] to select the forces and the resulting stresses. These tests were carried out in relation to the flow disturbance analysis; however, the obtained results can also be used in the production of the joint. Researchers reached the conclusion that this process is not perfect and still needs future investigation. Another type of method includes the crimped EPDM electromagnetic pulse method. The electromagnetic pulse technology is a solution for quickly crimping structural parts together. This technology is especially dedicated to joining parts made of aluminum, including connections between the stub and the pipe. It is an alternative to the current processes, which are relatively energy- and cost-intensive. Moreover, it has some advantages over traditional techniques which, for example, are based on the use of glue. In this type of connection, there is no need to wait for the joint to harden. An important issue is that the materials can be joined without a significant heat supply, in order that unnecessary stresses are not introduced into the internal element and no dimensional deformation occurs beyond the external part [5]. The electromagnetic pulse technology is based on the deformation of one of the elements on the other using the induction of high electric currents [6,7]. The deformed tube imitates the shape of the stub pipe, which in this case is a model shape and creates a strong connection due to the crimping effect [8]. There are no problems with heterogeneous material or stress concentration in the joint, and it is not necessary to use additional fasteners or adhesives.
Another type of connection are crimp connections used in the production of cable connectors. The crimping of cable connectors is an important factor in the production of wire harnesses. It is very important for cable harnesses used in cars or aviation [9]. Possible repairs would be a high cost, and in extreme cases, poor connection quality could lead to a disaster. The production of the connector consists of plastic deformation of the sleeve, which can be treated as a tube on a cable. In their work, Mocellini and Petitprez [10] presented tests of a wire forming a bundle with a diameter of a single link at the level of 0.12 mm and a tube with an outer diameter of 1 mm. The research presented by the authors shows the connection made by means of four symmetrically arranged punches around the tube, with a special geometric shape ensuring the greatest possible strength of the joint. The forming depth of the punches was experimentally selected. In the work of Bouchard [11], the process of performing the FEM analyses before making the connection was presented, which illustrates the joint manufacturing process. Moreover, the author specified the values of the obtained stresses. The prepared joint requires applying a force of 700 N to the system. Kugener et al. [12] presented the nonlinear plastic crimping analyses. On the other hand, the optimization of clamp connections is presented in [13].
Traditional methods of tube forming process are based on the use of a punch and a die. However, there are methods that allow the tube collar to be closed, which can be used to create a flanged joint with the plate. On the other hand, the authors of [14] presented the process of forming the end of the pipe. The forming of the collar in the described method is based on a complex movement consisting of a vertical movement and a rotary movement of the tool. Forming is performed with a cone-shaped tool [15]. Investigators of these articles find that there is a need to control the process parameters along the crimping. In [16], the author used the aluminum alloy 6060 T4 with an outer diameter of 38 mm and a wall thickness of 1 mm. The results of the presented experimental study were analyzed by FEM. The author presented the optimization of the shape of the tool, which determined the proper geometry of the tool. The automotive and aviation industries absolutely require the creation of connectors with appropriate quality parameters.
In serial production, the economic sphere of the issue is also important. Therefore, it is crucial to choose the right connection technology, including the correct operation of the devices used for the production of these connections. The success of a fixed joint depends to a large extent on the appropriate process parameters, their control, and the input material itself [17,18].
The industry of construction of heat exchangers is based on the use of aluminum alloys as a building material. This material joining process can cause many difficulties. Meanwhile, considering the joining materials with different characteristics, such as the aluminum plate with steel parts, many difficulties can be encountered when using traditional methods [19,20,21]. There are many other options for joining aluminum alloys, such as friction welding, joining by adding an adhesive, welding, mechanical clamping, and hybrid joining [22,23]. In the mechanical process of clinching sheets, there is no need to make additional holes or introduce additional fasteners. Moreover, the joint is insensitive to surface cleanliness and roughness problems. Furthermore, a significant advantage is the lack of the influence of heat and related deformations [24]. Another noticeable advantage is the relatively short execution time, which is less than 1 s. The first patent related to the production of a joint by forcing two sheets parallel to each other was created in 1897. However, the development of this technology related to this joint gained industrial momentum only after 1980. This process has adopted the name of clinching all over the world, which is graphically based on pressing one part into another without the use of a connector. To make the joint, it is necessary to use a punch and a die [25]. However, clinching and other connections based on plastic deformation needs to deal with the friction between the materials. Ren et al. [26] investigated the clinching process with different friction factors. Their findings led to the conclusion that the friction force has a significant influence on material flow during the process. Neutralization of leakage in the industry is very important, due to the fact that some of the researchers try to find the best solutions to act against them. One of these authors is Fischer et al. [27], who investigated pushing the metal ball into a cone in an effort to prevent leakage. The conclusion was that plastic deformation of that ball reduces leakage by around 8 times. Kozuch et al. checked the leakage under different surface roughness conditions for the connection of radial lip seal and the shaft. The authors developed a conclusion that negative skewness, which indicates a large area with valleys, was revealed with the lower leakage [28]. Therefore, the purpose of the research contained in the article was to analyze the tightness of parts with different surface topographies for a variable clamping force. The influence of surface topography on joint tightness of non-separable joints for thin wall application has been discussed in this work.

2. Materials and Methods

2.1. Material Properties

In relation to the parts included in the subassembly, the material of the aluminum alloy 6060 T4 was used. This material was chosen due to its good mechanical properties, especially the yield strength, which was significant. In addition, it is a good possibility for machining, which allows for its use in complex and responsible parts of heat exchangers where this method was implemented. Moreover, this material is an alloy with a strength slightly lower than 6005 A. It has very good corrosion resistance and very good weldability. As for its use for cold working, it is also characterized by good plasticity [29]. Furthermore, it shows a good response to galvanic anodizing. Its main applications are architectural and construction elements, balustrades, water pipes, car floors, etc. as well as the thermal industry using elements for the construction of heat exchangers [30]. The chemical composition of the aluminum alloy 6060 T4 is shown in Table 1 and mechanical properties are shown in Table 2. It is worth mentioning that it has a magnesium content ranging from 0.35% to 0.60%, which indicates that it is also characterized by good machinability. On the other hand, it is quite a negative feature in the case of hard soldering since it hinders this process. This feature is the reason why dissimilar materials are often soldered together to reduce the total content of this element in the solder pair.

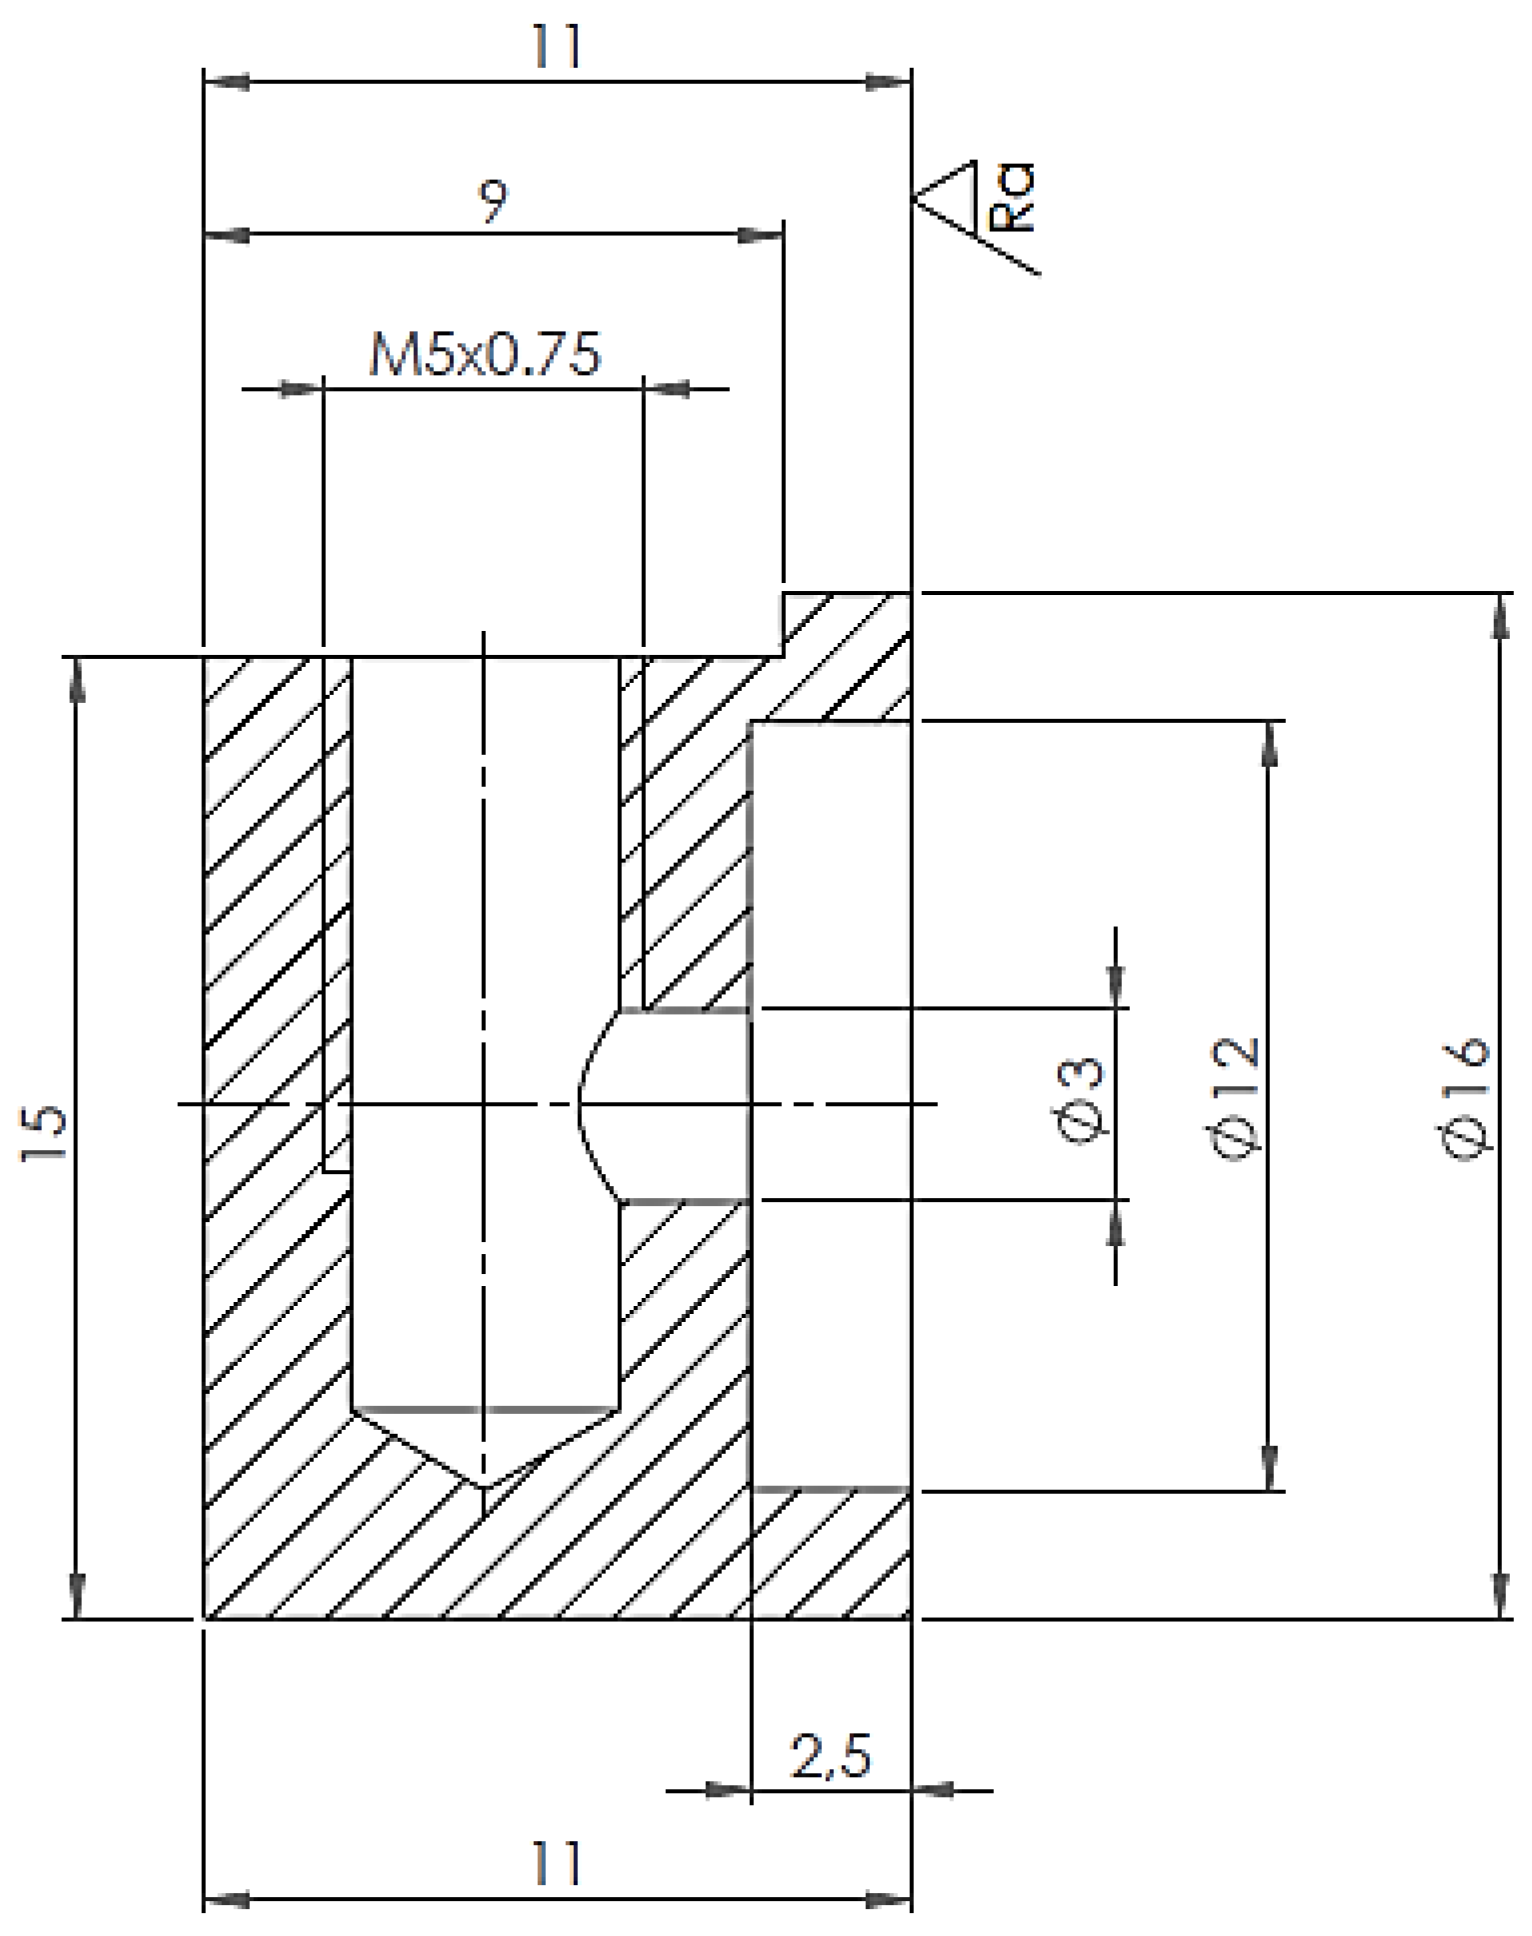
2.2. Geometry of the Component for Testing

To perform the tightness tests showing the influence of the surface topography and the pressure of the parts against each other, 42 samples were made. The analyzed surface was created by turning and milling processes for various technological cutting parameters, as shown in Figure 1.
The samples were divided into 6 groups, sorted according to preliminary tests, in which the Ra parameter was the basic roughness parameter. The values presented in Table 3 were adopted for the experiment. The geometrical dimensions of the parts prepared for the experiment are presented in Figure 2.

2.3. Leakage and Roughness Testing

To find the relations between the surface, leakage, machining, and clamping force, it was necessary to use appropriate devices which allow for leakage tests at various processing parameters, generating different surface qualities and various compressive forces of the joint. First, the topography surfaces of the tested samples were determined, then the tested parts were fixed in the testing machine which provides the required compressive force to the samples. The second step of the study, after force stabilization, was the leak test, which was the last step in the study. The surface area of the tested surface subject is 88 mm2. The measurement of the surface topography was performed using the Alicona Infinite Focus G5 type focal differentiation microscope. The components with the use of the device with 20x lens can be measured in high vertical resolution up to 50 nm and in high vertical repeatability up to 10 nm. Furthermore, the research was divided into two stages. The first phase was to select the analysis pairs with the same roughness value (Ra parameter), and the next step was to segregate the surfaces in the peer-to-peer system. For each type of set, an analysis of the surface topography was performed to determine the parameter influencing the amount of leakage at a given compression force (FS). The test was carried out for a set pressure of 2 ± 0.02 bar. The volume of the system was 21.25 cm3. The experiment was performed for the conditions presented in Table 4. The first is to fill the system, the second is to stabilize it for 9 s, the third step is the 1 s test, and the final step is to empty the test chamber.
During the test, one of the samples was fixed with the mounting plate, while the other was movable in relation to the first. This construction allowed the parts to be pressed against each other at a given value. Consequently, this allowed us to obtain characteristics showing the dependence of the clamping force on the obtained leakage and to determine the size of the leak depending on the surface topography. Moreover, it allowed the evaluation of the force at which the system stabilized and allowed the test procedure to be performed (Figure 3). The force sensor used to control the load provided during the leak test was HBM RSCC3/2T of error ±0.25% FSO with the RM4220 transducer of accuracy class 0.1. The measurement system shown below has a combined measurement error of ±0.35% FSO, it provides a value of ±70 N. The maximum force that can be provided to the assembled kit for the leak test is 20,000 N.
The first tests were carried out for twin samples (with the same roughness value). The tests were performed for various forces to obtain the expected leakage threshold of the tested elements. The stand for testing the leakage test was based on the ATEQ F620 leak detector. The device measures the pressure drop generated in a system with a known volume. The device was equipped with an electronic regulation of the inlet pressure. The tests were characterized by the leakage value associated with the gap between the surfaces. The concept of checking the tightness against the tested parts was based on the absolute pressure drop measurement method (Figure 4). To carry out the leakage tests, a stand was built based on the described leak detector associated with the machine setting the pressing force of parts in relation to each other, marked with the value FS, as shown in Figure 5. A significant condition for the performed leakage tests was the temperature of the environment and the tested parts, which was about 21 °C. Another important condition was the refilling number of the tested kit and the generated energy between the medium used for the leakage tests and connected parts. Those variables have an impact on increasing the temperature of the parts. In the studied case, no influence was noted. The unit under the test was cleaned before the leak test.
The ATEQ leak detector is a device that measures the pressure drop over a predetermined time. There are three ranges available according to the test pressure. Therefore, a device with a measuring range value <0.2 bar has been selected, while >5 bar is the enabling measurement with an accuracy of 0.05 bar. On the other hand, the measurement of the pressure drop dP/dt, along with the information on the accuracy and measurement resolution, is presented in Table 5.
According to the data presented in Table 5, the measurement error can be determined for each measured leakage with the use of one of the formulas below, depending on the range of the measured pressure drop:
Δ P   [ Pa s ] = ±   [   (   1.5 %   dP   + 0.5   Pa   ) + 0.01   Pa   ]                       for   range   0 50   Pa  
Δ P   [ Pa s ] = ±   [   (   1 %   dP   + 1   Pa   ) + 0.1   Pa   ]                               for   range   0 500   Pa
where Δ P   [ Pa s ] is the pressure drop error and dP is the measured value of the pressure drop.
A formula was used to convert the units:
Q   [ cm 3 min ] = 60   *   V U T   [ cm 3 ]   *   Q   [ Pa s ]     p a t   [ Pa ]
where Q   [ cm 3 min ] is the measured leakage cm3/min, V U T   [ cm 3 ] is the volume under the test, Q   [ Pa s ] is the measured leakage in Pa/s, and p a t   [ Pa ] is the atmospheric pressure 100,000 Pa (rounded down for convenience).

3. Results and Discussion

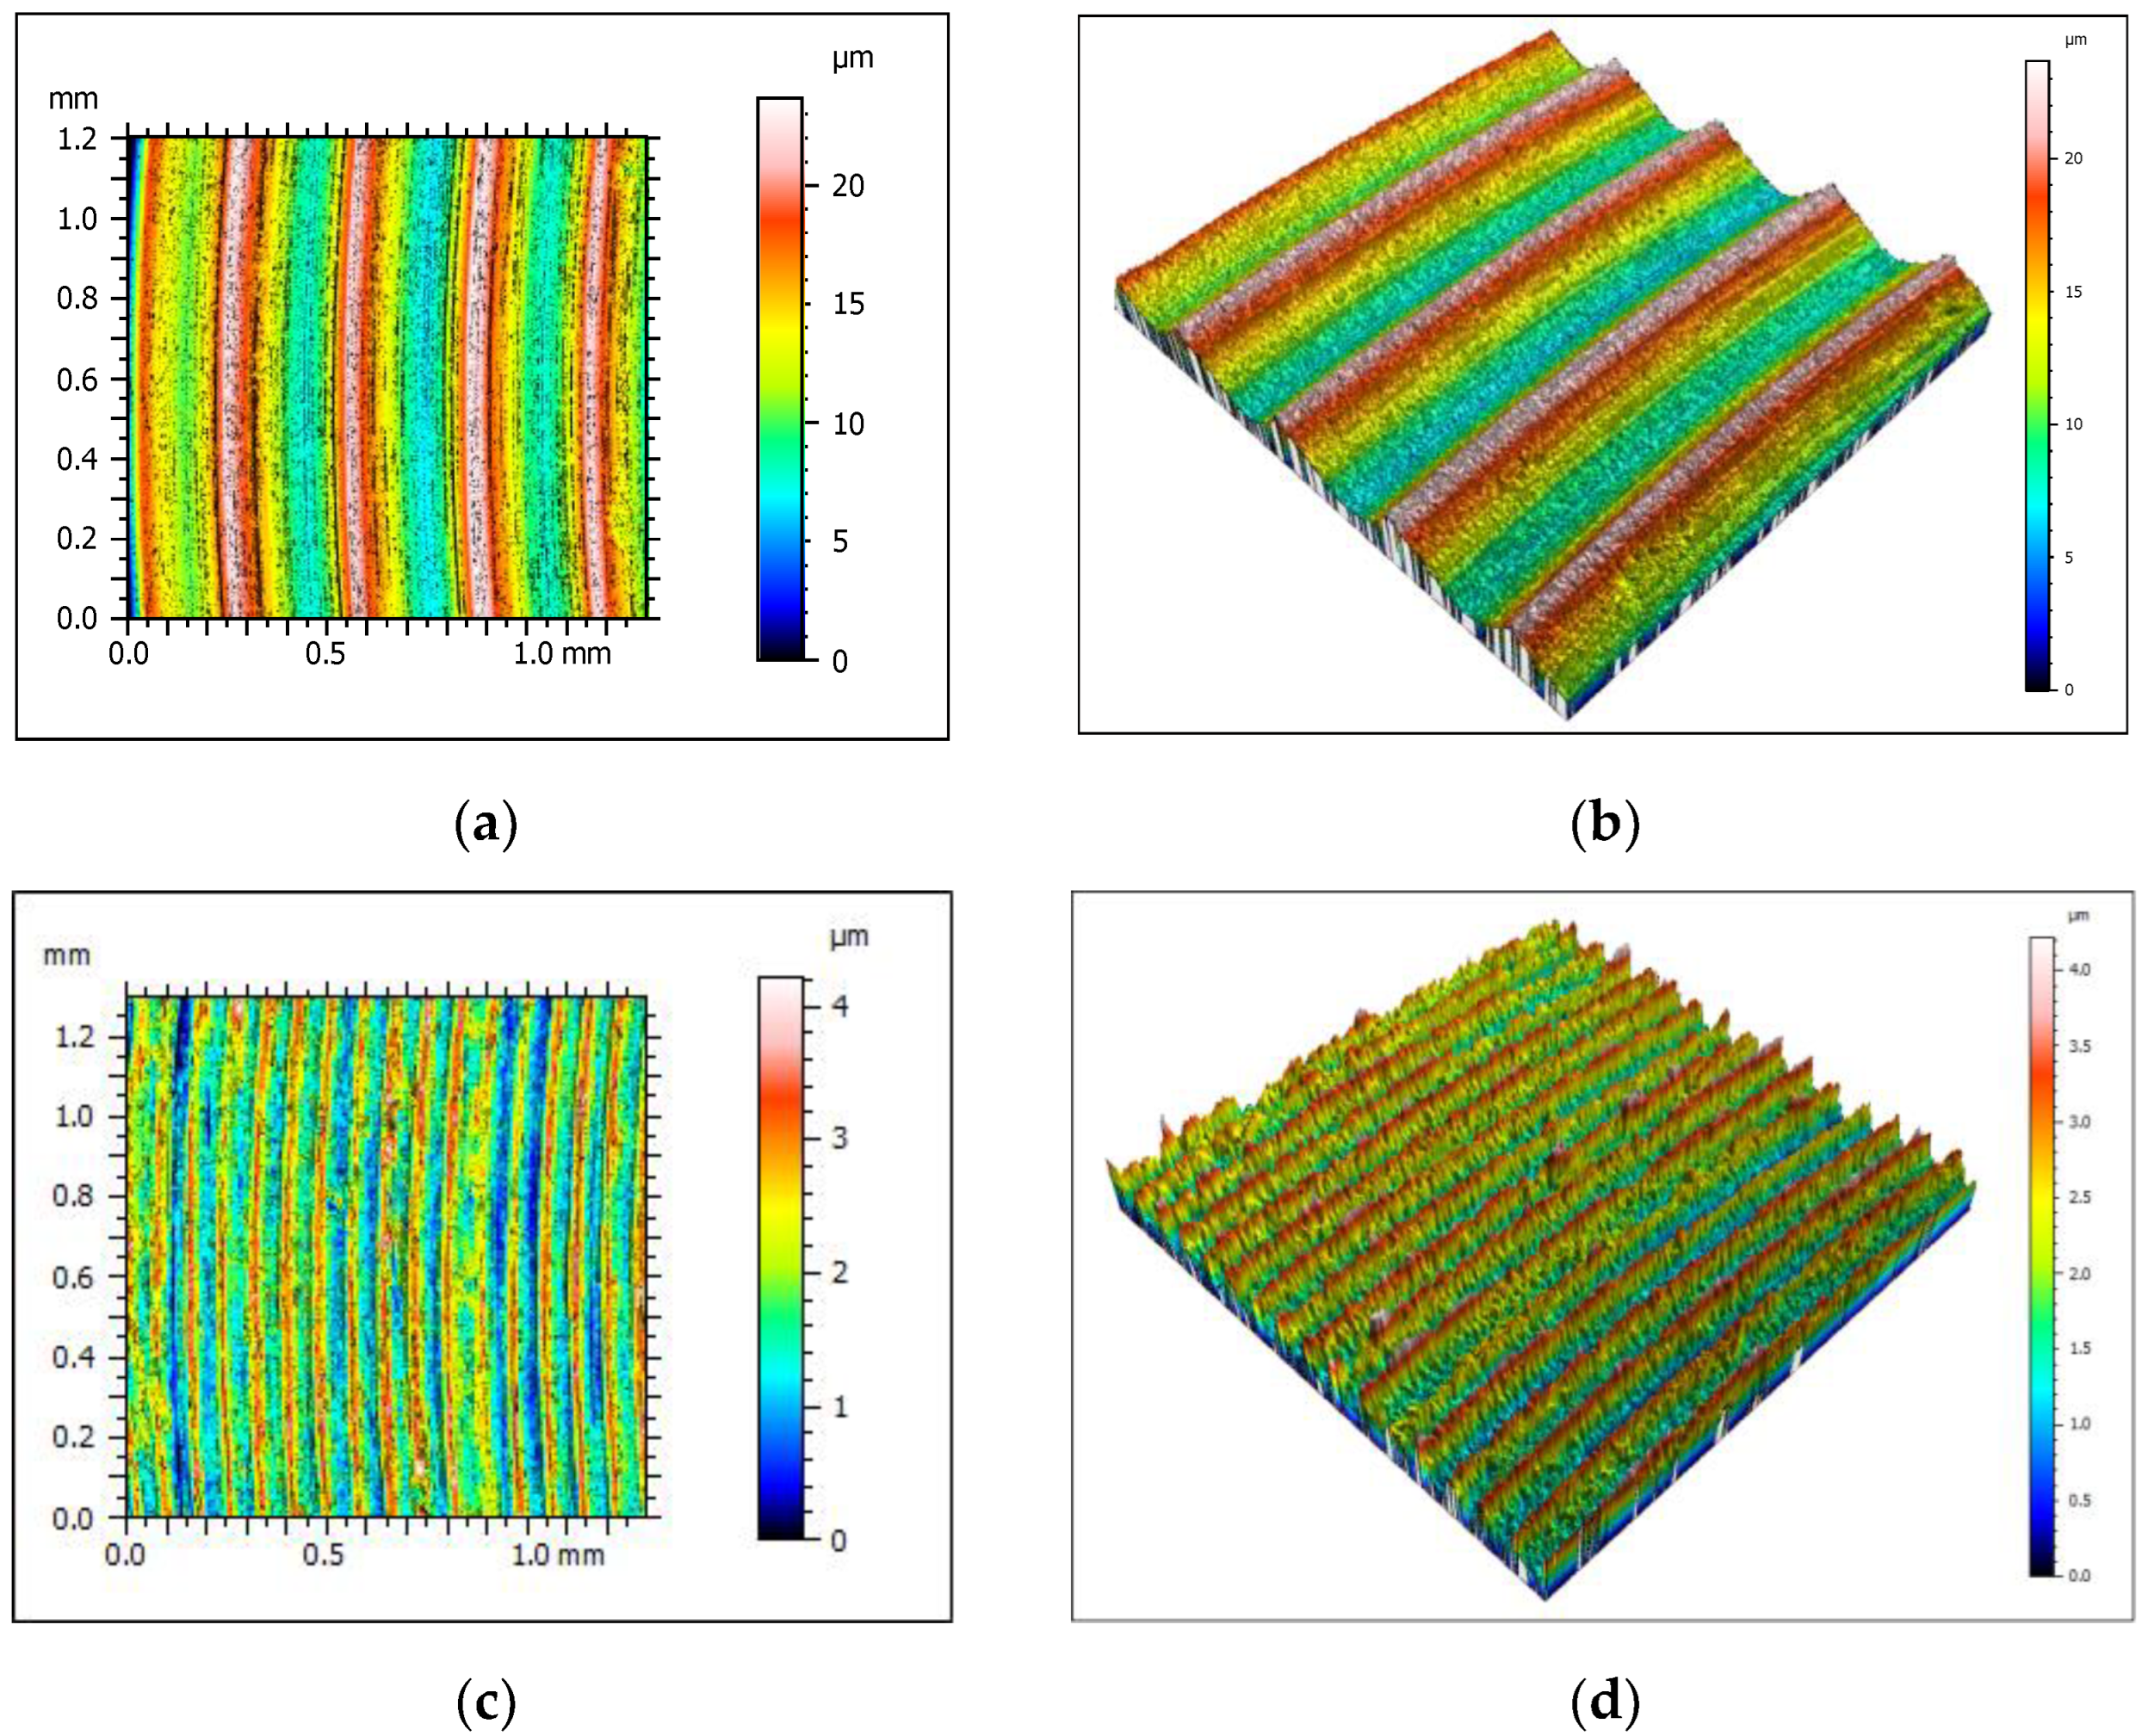
3.1. D Surface Analysis

Tightness tests against the generated surfaces at various compressive forces were carried out on 42 prepared samples. Among the manufactured parts, six groups were selected using the surface roughness Ra as a preliminary criterion. The value ranges of the adopted initial classifying feature for individual sets of samples were as follows: 4.24–4.32 µm, 2.79–2.87 µm, 1.26–1.34 µm, 1.34–1.42 µm, 0.14−0.22 µm, and 0.06–0.14 µm. Then, the Ra parameter, used initially, was replaced by the surface topography parameters. These parameters describe the actual surfaces more reliably, which allows for a more detailed analysis of the influence of the surface topography on the leakage value. Due to the analysis of the surface topography, the pre-selected parameter was changed into groups of parameters describing the generated surfaces—coded A, B, C, D, E, and F. The samples belonging to code group A were characterized by surface parameters with the following values: Sq = 6.53 µm, Ssk = −0.425 µm, Sku = 2.36 µm, Sp = 12 µm, Sv = 11.7 µm, Sz = 23.7 µm, Sa = 5.24 µm, Spd = 275 1/mm2, and Spc = 27,565 1/mm. The sample surface was generated by turning on a numerical lathe with the feed parameters f = 0.3 mm/rev and the cutting speed vc ≈ 100 m/min. Figure 6 shows the morphology of the generated surface. The code group B was characterized by surface parameters with the following values and measurement errors: Sq = 3.92 µm, Ssk = 0.083 µm, Sku = 2.03 µm, Sp = 9.1 µm, Sv = 5.86 µm, Sz = 15 µm, Sa = 3.29 µm, Spd = 394 1/mm2, and Spc = 14,779 1/mm. The sample surface was generated by turning on a numerical lathe with the feed parameters f = 0.2 mm/rev and the cutting speed vc ≈ 100 m/min. The samples belonging to code group C were characterized by surface parameters with the following values: Sq = 2.55 µm, Ssk = −0.112 µm, Sku = 2.06 µm, Sp = 5.66 µm, Sv = 4.06 µm, Sz = 9.72 µm, Sa = 2.14 µm, Spd = 671 1/mm2, and Spc = 8351 1/mm. Contrary to the previous parts, the sample surface was generated in the milling process on a numerical milling machine with feed parameters f = 800 mm/rev, cutting speed vc ≈ 20.7 m/min, and cutting depth ap = 0.3 mm.
The code group D was characterized by surface parameters with the following values: Sq = 1.54 µm, Ssk = −0.322 µm, Sku = 2.45 µm, Sp = 3.96 µm, Sv = 2.76 µm, Sz = 6.72 µm, Sa = 1.25 µm, Spd = 331 1/mm2, and Spc = 8454 1/mm. The sample surface was generated by turning on a numerical lathe with the feed parameters f = 0.1 mm/rev and the cutting speed vc ≈ 100 m/min. For the surface of the samples belonging to the group in question, a contour map, and an isometric view, presented in Figure 7, were created. The samples belonging to code group E are characterized by surface parameters with the following values: Sq = 0.414 µm, Ssk = −0.184 µm, Sku = 2.5 µm, Sp = 1.12 µm, Sv = 0.714 µm, Sz = 1.84 µm, Sa = 0.33 µm, Spd = 1942 1/mm2, and Spc = 2602 1/mm. For the parts belonging to code group C, the surface was milled on a numerical milling machine with feed parameters f = 150 mm/rev, cutting speed vc ≈ 39.6 m/min, and cutting depth ap = 0.3 mm.
The code group F was characterized by surface parameters the following values: Sq = 0.237 µm, Ssk = −0.180 µm, Sku = 3.23 µm, Sp = 0.794 µm, Sv = 0.847 µm, Sz = 4.64 µm, Sa = 0.187 µm, Spd = 1452 1/mm2, and Spc = 584 1/mm. For the parts belonging to code groups A, B, and D, the surface was made by turning on a numerical lathe with feed parameters f = 0.02 mm/rev and cutting speed vc ≈ 100 m/min. The typical roughness parameters, such as Sq, Ssk, Sku, Sp, Sv, Sz, Sa, Spd, and Spc, are strongly dependent on a variety of parameters, which can be classified into primary and natural surface roughness effects. The primary surface roughness effect is contributed by the machining parameters (cutting speed, feed rate, depth of cut, nose radius, cutting time, coating, etc.), type of machining, and tool geometry. Meanwhile, the natural surface roughness effect is contributed by the machine tool and uncontrolled variation in the machining process, such as tool wear, dynamic unbalance of machining system (stability and stiffness of the machine tool—cutting tool—workpiece system), cutting fluid, chip formation, and workpiece (workpiece deflection, material characteristics) [32,33,34,35]. It is found that within the machining parameters, the feed rate has the most significant effect on surface roughness, followed by the nose radius and cutting time. An example of the influence of a parameter change on roughness is a comparison of the values of the Sa parameter for code groups A and B. The difference in the feed rate between the groups is 0.1 mm/rev, which results in a reduction in the Sa parameter by less than 40%.

3.2. Influence of Different Roughness Topography and Force Analysis for Leakage Detection

The first pair of samples (1–2) was selected from the part with surface topography parameters belonging to code group A. When analyzing the stabilization stage of the tightness test for the study of the first test case, for the first pair of samples, i.e., the lowest pressing force equal to 890 ± 70 N, a slight pressure drop was noticeable during the test. It was 0.05 bar, which is 2.5% of the filling pressure value. In the case of increasing the clamping force (which was confirmed by repeated tests), this relationship was not noted. This may indicate that the applied clamping force was in the boundary force area, in which a positive test result was not obtained. When analyzing the test stage, i.e., the course of the leakage curve over time, a decrease in leakage with an increase in the compression force was observed. The minimum value of the required compression force of the samples is 2280 ± 70 N. For the indicated force, a leakage of 0.460 ± 0.013 cm3/min was obtained. The observed initial value of leakage, for the discussed force case, may be related to the switching of the leak detector valve. Increasing the force by almost 82%, i.e., to the value of 4140 ± 70 N, made it possible to obtain approximately 7.4 times smaller leakage, i.e., at the level of 0.062 ± 0.007 cm3/min. On the other hand, increasing the force by a value of 182% in relation to the minimum force made it possible to obtain a significantly smaller improvement in tightness than in relation to the 4140 N force. In this case, the leakage was about 8.1 times smaller than the initial one, i.e., at the level of 0.062 ± 0.007 cm3/min. By increasing the force to 6420 ± 70 N from 4140 N, i.e., almost 55%, the leakage was reduced by 0.05 ± 0.007 cm3/min, i.e., about 8%. Therefore, the testing of samples was not extended to further test the cases, i.e., increasing the clamping force, as the leakage reduction was negligible. The obtained test results are shown in Figure 8.
Analyzing the first pair of samples revealed that increasing the force has a very good influence on the tightness of the samples and that increasing the tightness is limited. Therefore, after reaching the appropriate level, there is no need to additionally increase the force. It could be noted that with the force of 4140 N, the leakage was 8.1 times smaller and the result is comparable to the conclusions of the work by Fisher et al.
The second pair (9–10) had surface parameters belonging to code group B and Figure 9 shows the graph of dependence for a pair of samples 9–10, produced with comparable surface topography parameters for different test cases, i.e., different compressive forces. The forces are leakage values of the second pair (9–10), as shown in Table 6.
The next set consisted of parts 17 and 18, which were characterized by surface topography parameters belonging to group code C. The tests of a pair of samples were carried out for various compressive forces. However, filling the chamber between the samples with the set pressure was unsuccessful; therefore, it was not possible to perform the stabilization step of the test. Moreover, the test step was not performed due to the lack of stabilization of the pressure in the chamber between the samples. The maximum force applied to the test set was about 20 kN and was over 2173% greater than the minimum force, which was enough to obtain the leak test result for the previously tested pair of samples 9–10. The next pair of parts consisted of samples 25 and 26, which were previously classified into code group D. The pair of samples 33–34 consisted of parts with surface topography parameters belonging to code group E. For all test cases, i.e., the prescribed compressive forces, the stabilization stage of the leak test was obtained and shown in Table 7. The final test set that can be classified for testing parts with comparable surface topography parameters is the pair of samples 40–41. They belonged to code group F.
The next stage of the research involved tightness tests for the sets from the first sample assigned to code group A, and from the second sample characterized by the surface topography parameters of one of the other code groups. Therefore, the following pairs of samples 6–8, 3–15, 4–22, 5–29, and 7–36 were selected. The first of the selected sets (6–8) consisted of samples with surface topography parameters belonging to code groups A and B. For all tested cases, the stabilization stage of the leak test was achieved, and the required pressure value was maintained, as shown in Figure 10. The other results of leakage and forces paired with samples of code group A are included in Table 8.
The analysis of the influence of the difference in surface topography parameters was continued by considering the samples belonging to code group B with surfaces from other groups. The following pairs of samples 6–8, 9–10, 13–16, 11–23, 12–30, and 14–38 were distinguished among the sets classified according to the described criteria, and the results for the first two have already been presented. The next tested set of parts (13–16) consisted of samples with surface topography parameters belonging to code groups B and C. The code group B tested with other representatives from the rest of the coded groups were shown in Table 9.
The study of the leakage value as a function of the applied compressive forces was continued by checking the effect of the difference in the surface topography parameters of the sample belonging to code group C with parts from the other code groups. The following pairs of samples 3–15, 13–16, 17–18, 19–24, 20–31, and 21–37 were selected. The results for the first three have already been presented at the beginning of this chapter. The tested pair of samples 19–24 consisted of parts with surface parameters belonging to code groups C and D. The tested pair of samples 19–24 consisted of parts with surface parameters belonging to code groups C and D. All used compressive forces made it possible to stabilize the set pressure. Accordingly, a leak test was performed for each case. The minimum value of the compressive force was 5175 N, for this value a leakage of 5.960 cm3/min was obtained. An increase in the clamping load of the sample by about 20%, i.e., to the value of 6210 N, allowed for the reduction in the leakage value by about 10%, i.e., 5.360 cm3/min. The next set of parts (20–31) was selected from samples belonging to code groups C and E. For the analyzed stages, the test stabilization stage was not reached, and the required pressure value was not maintained for the given compressive forces. Therefore, the test step was not performed due to the lack of stabilization of the pressure in the chamber between the samples. The samples belonging to the pair 21–37 were characterized by surface topography parameters from code groups C and F. For each of the analyzed compressive forces, the test stabilization stage was not reached, and the required pressure value was not maintained. Due to the lack of stabilization of the pressure in the chamber between the samples, the test step was not performed. The study of the impact of the difference in the values of surface topography parameters was continued for code group D together with parts from the other generated groups. Among the discussed cases, we can distinguish pairs of samples 4–22, 11–23, 19–24, 25–26, 27–32, and 28–42. The research for the first four sets has already been presented. The research on the influence of surface topography parameters on tightness was continued for group code E with samples from the other groups. For this purpose, the following sets 5–29, 12–30, 20–31, 27–32, 33–34, and 35–39 were selected. The test results were presented for each of the pairs except for the last one. The final set of tested samples 35–39 consisted of parts with surface topography parameters from code groups E and F. Moreover, code group D was checked with the other samples, which comes from the rest of the coded groups, as shown in Table 10.

3.3. Critical Roughness Parameters for Leakage Detection

Summarizing the results of the tightness of samples with surface parameters from the code group for a compressive force equal to 2280 N, the relationship between the leakage values and the values of the parameters Sq, Sp, Sa, Sz, and Spc was determined. Among the parameters mentioned, Figure 11 shows the dependencies for the parameter Sa. These parameters correspond to the profile parameter Ra used in the industry. The drawings show the decrease in the leakage value depending on the values of these parameters. A similar tendency was observed for the parameters Sz, Sq, Sp, and Spc. The demonstrated correlation of the parameters Sq, Sp, Sa, Sz, and Spc with the value of the obtained leakage at the common pressing force proves a strong influence in the peaks/hills of the surface roughness profile on the obtained leakage. As the height of the peaks of the roughness profile increases, the resulting leakage increases. The second feature of the hills that affect the leakage is the curvature of the hills itself. With an increase in the contact surface of the peaks (rounded shape of the peaks), the leakage value decreases.
Tightness is obtained due to the plastic deformation between the two surfaces. These surfaces fit with each other due to the material flow under the high force between them. This feature was dependent on the tested samples due to the roughness parameters Sq, Sp, Sa, Sz, and Spc. According to the parameters Sa, Sq, and Sz, the lower the scope of inequality in tested surfaces roughness, the easier it is to reach tightness. The particular meaning of the leakage value in the distribution of roughness inequalities indicates the height of the surface peaks (Sp) and the geometry of the peaks indicates the radius of curvature of the apex (Spc), which has an influence on the size of contact area between the samples. The surfaces characterized by sharp peaks due to the applied compressive force do not obtain a large contact area, while in the case with gentle peaks, it is possible to obtain a great surface area.
When analyzing the sets of surfaces in which one of the samples was characterized by surface parameters from code group A, while the other part of the pair belonged to one of the other groups, a relationship was observed between the surface topography parameters. As in the previous analysis, for the compressive force equal to 2280 N, a relationship was found between the leakage values and the differences in the values of the parameters Sq, Sp, Sa, Sz, and Spc between the constituent parts of pairs of samples. This relationship for the Sa parameter is shown in Figure 12. It was observed that with the increase in the difference in parameter values between the surfaces, there was an increase in the leakage value. Meanwhile, the other surface parameters mentioned, i.e., Sz, Sq, Sp, and Spc, had an analogous effect on the values obtained in the tightness tests.
The mechanism of building the tightness between the heterogenous sealing surfaces on the basis of conducted studies parameters Sq, Sp, Sa, Sz, and Spc, revealed that despite the increase in the pushing force, the lower tightness was due to the homogenous surfaces. This is a result of the impossible filling of free spaces by the material of the second sample among the peaks or ridges and valleys toward each other. Moreover, it is difficult to try to eliminate sharp peaks or to match them to the flat contact surface of the other element. A correlation was noted that despite the increasing value of the applied force, it is not possible to completely eliminate the unevenness of the surface geometry and leakage, which was characterized by sharp peaks. In this case, there are always left micro-deformations that have experienced material strengthening and are an obstacle to filling the free surfaces between the components to be joined, which lead to the increased leakage in their area.
Analyzing the results of subsequent tests, in which one of the parts belonged to code group B, and the other part of the pair samples had the surface parameters of one of the other groups, the influence of the topography parameters Sq, Sp, Sa, Sz and Spc on the leakage values was observed. The tests were carried out for a compressive force equal to 2280 N. The influence of the difference in the topography parameter Sa and its influence on the leakage value is shown in Figure 13. It was observed that for the pair of samples in which the second surface was characterized by higher values, the leakage value increased. However, when the second sample had lower values, the leakage remained at the same level. The surface parameters Sz, Sq, Sp, and Spc show a similar relationship.
If the difference in the value of the surface topography parameters is smaller than the base surface with the following values of parameters: Sq = 3.92 µm, Sp = 9.1 µm, Sz = 15 µm, Sa = 3.29 µm, and Spc = 14,779 1/mm, then the tightness remains at the same level. However, in the case of applying surfaces with sharper peaks than the base surface, there was a rapid increase in leakage values, since the contact area between the surfaces was smaller.
By analyzing successive measurement results of a pair of samples, one of which was characterized by parameters belonging to code group D, while the other sample was characterized by the surface parameters of one of the other code groups, a relationship was found between the leakage values and the values of the surface topography parameters Sq, Sp, Sa, Sz, and Spc for a compressive force equal to 2280 N. This influence is presented for the parameter Sa in Figure 14. On the basis of the results, it was observed that for the sets containing samples with higher values, there was an increase in leakage values for the difference greater than 2 µm for the Sa parameter. Below the thresholds indicated, and when the second pair had a parameter with a lower value, the leakage test results remained at the same level. The surface parameters Sz, Sq, Sp, and Spc show a similar relationship.
If the difference in the value of the surface topography parameters is smaller than the base surface with the following values of parameters: Sq = 1.54 µm, Sp = 3.96 µm, Sz = 6.72 µm, Sa = 1.25 µm, and Spc = 8454 1/mm, then the tightness remains at the same level. However, in the case of applying surfaces with sharper peaks than the base surface, leakage remains at the same level until the limit value is established. When the limit difference is exceeded, there was a rapid increase in leakage values. This is due to the loss of the required contact between the parts.
Analyzing the results of testing pairs of samples in which the base part was characterized by parameters belonging to code group E, and the second sample by the surface parameters belonging to code groups A, B, C, D, and F, a relationship was observed between the results of leak tests and the parameters of the surface topography, similarly to the previous analyses. For a compressive force equal to 2280 N, a relationship was observed between the leakage values and the values of the parameters Sq, Sp, Sa, Sz, and Spc. Figure 15 shows the dependence of value of leakage to difference between Sa parameter of samples, where one of the samples has got the value of Sa = 0.33 µm. It was observed that for kits that contain samples with a parameter of more than 3 µm for the Sa parameter, the leakage value increased. Below the indicated thresholds, and when the second pair of parts had a parameter with a lower value, the leakage remained at the same level. The surface parameters Sz, Sq, Sp, and Spc show a similar relationship.
If the difference in the value of the surface topography parameters is smaller than the base surface with the following values of parameters: Sq = 0.414 µm, Sp = 1.12 µm, Sz = 1.84 µm, Sa = 0.33 µm, and Spc = 2602 1/mm, then the tightness remains at the same level. However, in the case of applying surfaces with sharper peaks than the base surface, leakage remains at the same level until a limit value is established. When the limit difference is exceeded, there was a rapid increase in leakage values. This is due to the loss of the required contact between the parts.
When analyzing the test results of sample sets, in which one part belonged to code group F and the other part belonged to one of the other code groups A, B, C, D or E, the influence of the surface topography parameters on the values in the leak test was observed, as previously mentioned. For the compressive force equal to 2280 N, a relationship was observed between the leakage values and the values of the parameters Sq, Sp, Sa, Sz, and Spc. Figure 16 dependence of value of leakage to difference between Sa parameter of samples, where one of the samples has got the value of Sa = 0.187 µm. It was observed that for assemblies that contain samples with a parameter of more than 3.1 µm for the Sa parameter, the leakage value increased. Below the indicated thresholds, the leakage remained at the same level. The surface parameters Sz, Sq, Sp, and Spc show a similar relationship.
If the difference in the value of the surface topography parameters is larger than the base surface with gentle peaks, then the tightness remains at the same level until a limited value is established. When the limit difference is exceeded, there was a rapid increase in leakage values, which is due to the loss of the required contact between the parts.
When analyzing the sets in which one of the samples had surface parameters from code group C, while the other part of the pair belonged to one of the other groups, no correlation was observed between the results of the tightness tests and the surface topography parameters Sq, Sp, Sa, Sz, and Spc. The minimum compressive forces needed to obtain the tightness of the analyzed sets were significantly higher than the forces obtained for the other tested sets. Moreover, the leakage test was not carried out for three pairs of samples, as it was not possible to stabilize the set pressure in the chamber between the samples. The surfaces of the samples classified and assigned to code group C were created in the milling process on a numerical milling machine.
Comparing the parameters of the surface topography of code group C with the other groups, a discrepancy in the value of the spatial parameter of the surface topography was found between the samples, in which the surface was generated in the turning process and also in produced in the milling process. For the samples belonging to code groups A, B, D, and F, the parameter Std had a value in the range of 86–93°, while for code groups C and E, this parameter had a value greater or lesser, respectively. This is in line with the expectations, as the turning process is characterized by a greater surface anisotropy than the milling process. The research showed the dependence of the surface directivity influence on the tightness of the entire system. The milling process on the macro scale is also characterized by anisotropy; however, the juxtaposition of surfaces with smaller dimensions results in significantly lower anisotropy values, which was confirmed by the values of the Std parameter. When comparing the obtained results regardless of the samples of the set, it was found that when the difference in the Sv parameter was greater than 5 µm, the leakage value increased. This relationship is shown in Figure 17.
When the limit value of the difference in the depth of the valleys of the surfaces is exceeded, the leakage value increases, due to the inability of the surfaces to adapt to each other. Since it is difficult to ensure sufficient contact between the surfaces, different valley geometries are characterized. The influence of the skewness, which has an effect on the work of Kozuch et al., does not have a significant impact on the samples. This could be due to the different materials and various working conditions.

4. Conclusions

The conducted tests made it possible to analyze the reaction forces as well as the strength characteristics and tightness of the joints produced. Based on empirical research, the following conclusions were drawn:
  • For the generated surfaces characterized by the surface topography parameter Std in the range of 86–93°, it is possible to make tight joints with lower compressive forces than for surfaces in which the value of the Std parameter is outside of the indicated range of values.
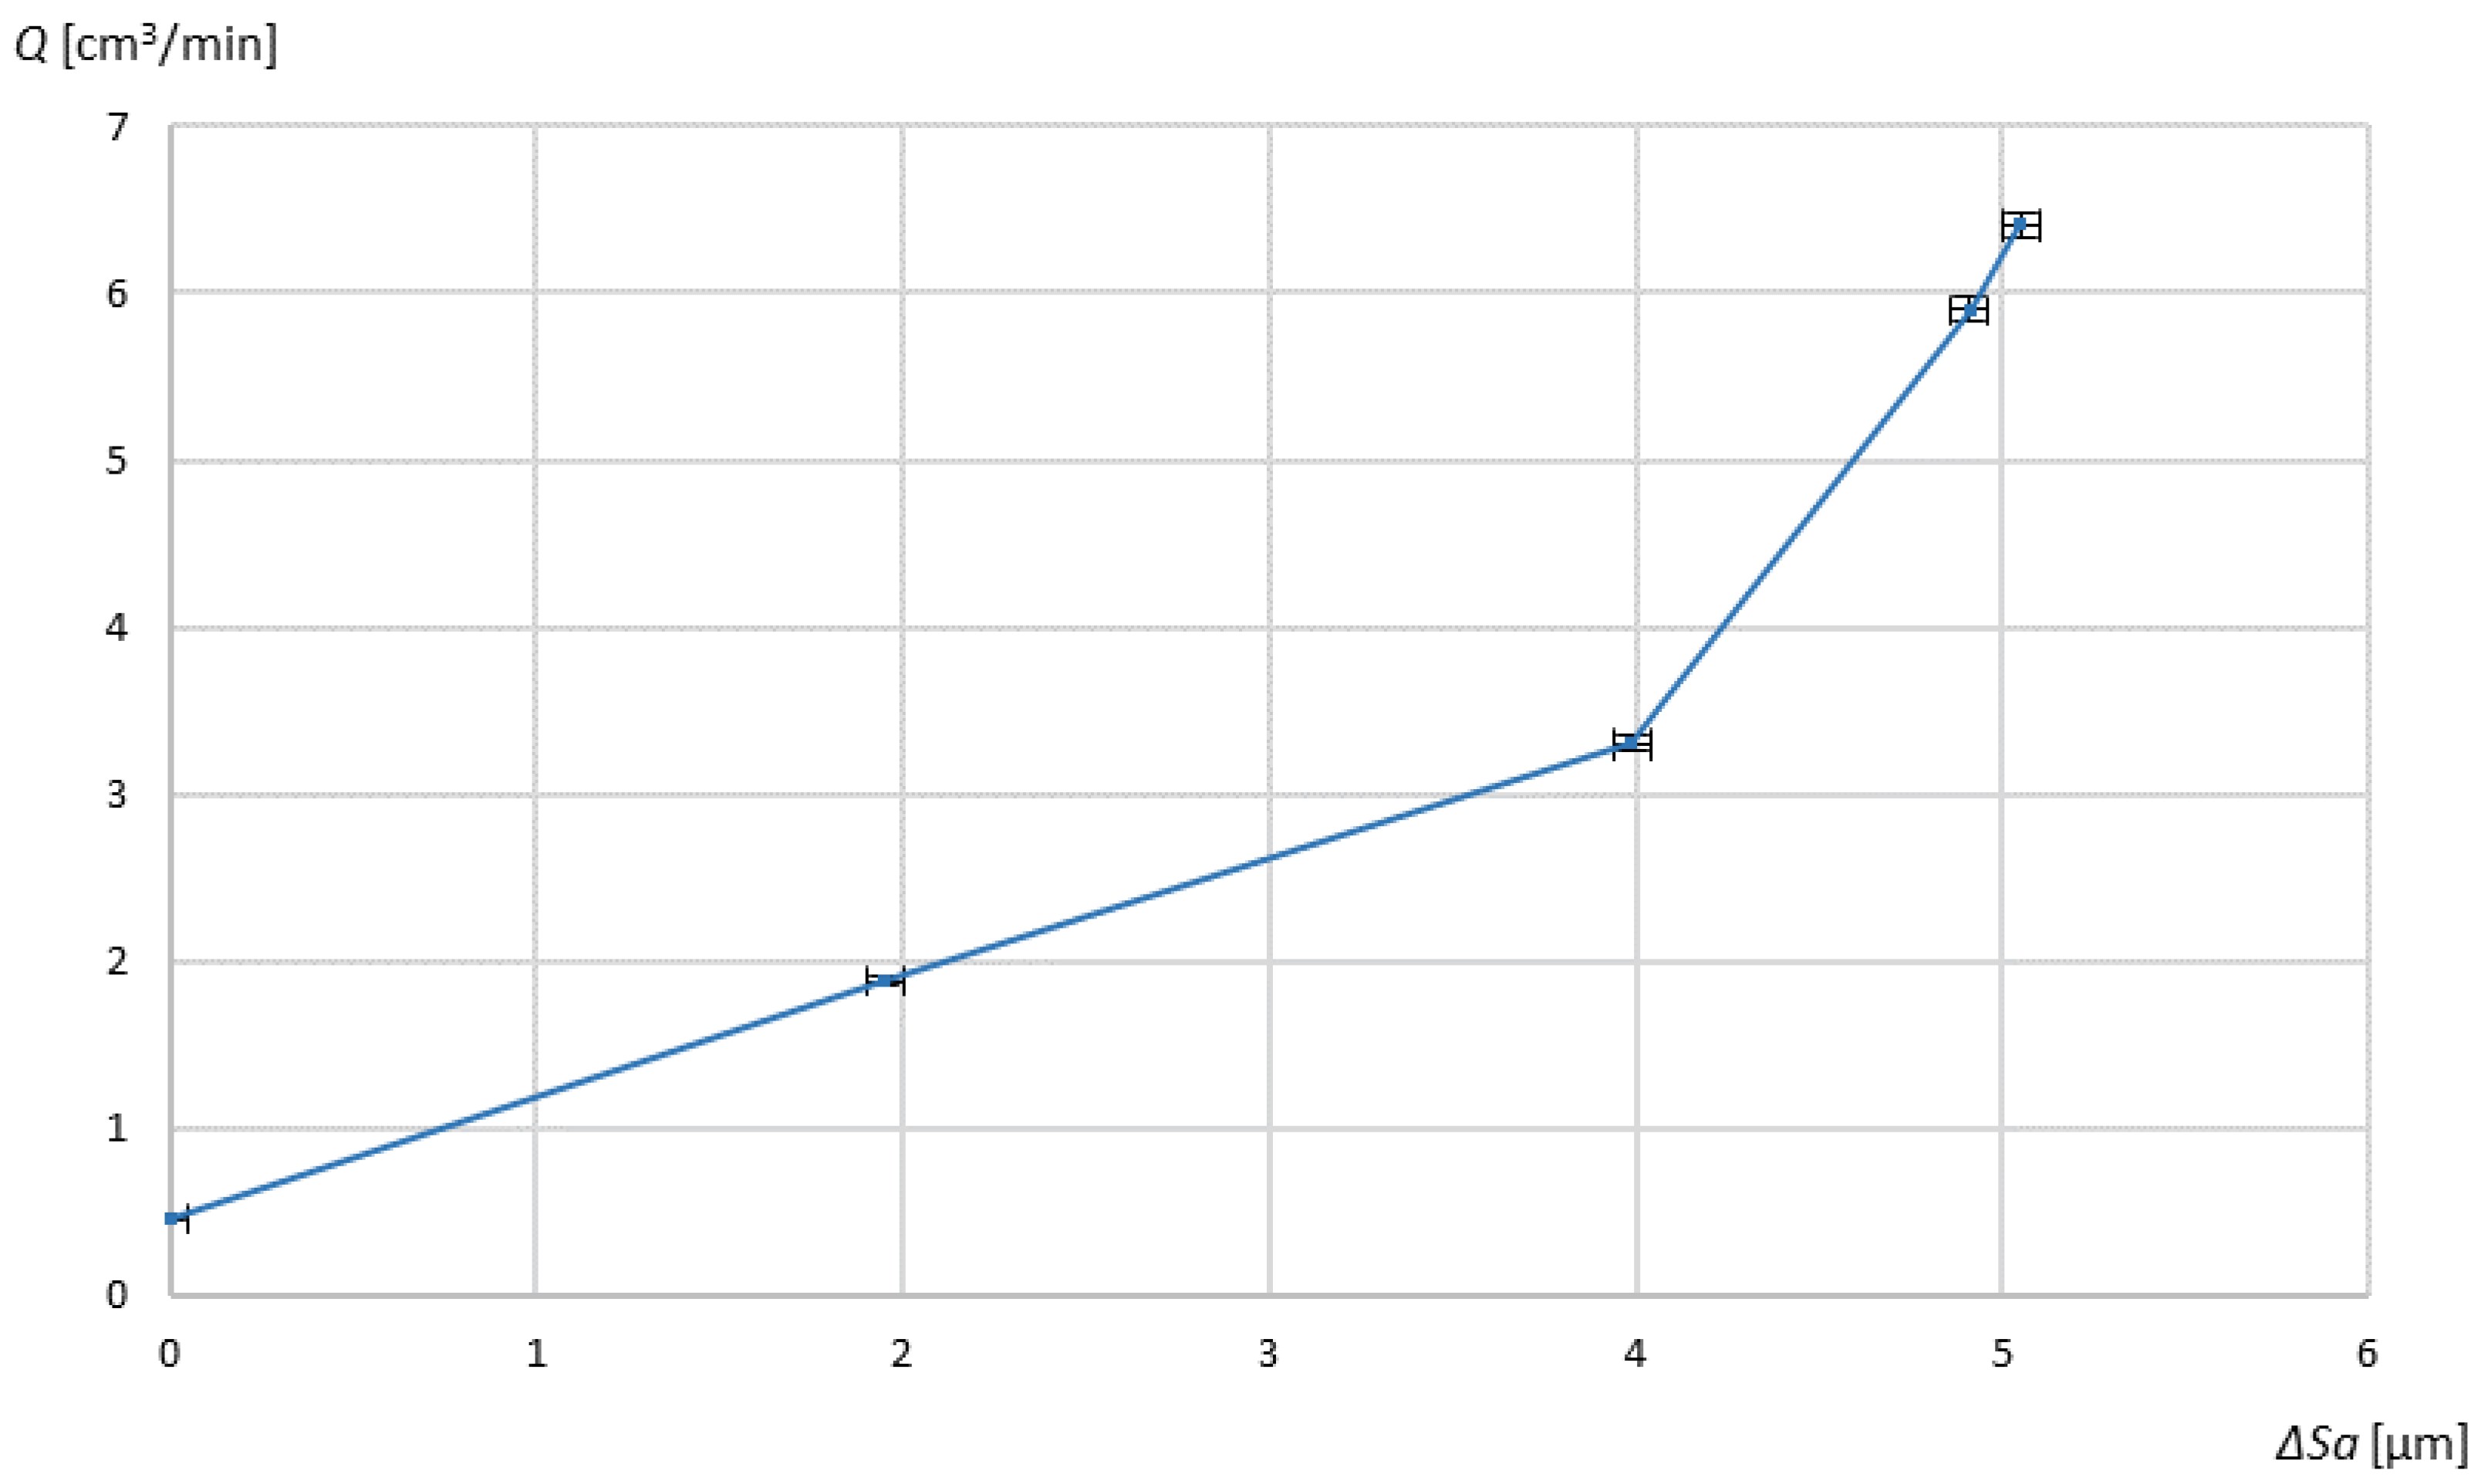
  • For two different surfaces, in which the value difference between the Sv parameter values did not exceed 5 μm, the leak test result was lower.
  • In the set of samples with different generated sealing surfaces, in which the difference in value between the Sv parameter values did not exceed 5 μm, the tightness was obtained with a lower compressive force.
  • The selection of pairs of cooperating elements in terms of tightness should be based on surfaces with similar parameters, since it allows for the geometric formation of the surface topography elements during the induced plastic stresses.
  • The tightness of the components is achieved by the deformation of two mutually opposing surface topography components, with a given force obtained for a pair of samples (1–2) up to 8 times reduction in leakage when applying a force that is higher than 465%. This phenomenon is made possible by the mutual plastic deformation and filling of free spaces, namely, valleys through the peaks of the second component.
  • There is a limiting compressive force of the components, at which a clear increase in the tightness of the parts, can no longer be noticed. This indicates that plastic deformation has already reached a point where all of the free inter-surface spaces have already been closed and a further increase in compression will not change their geometric position relative to each other. For samples from code group A of the first pair, an increase in force of more than 2200 N did not cause a clear increase in tightness.
  • Regarding the Spc parameter for samples with comparable surface roughness profiles (surfaces with Spc parameter values of 27,565 µm, 14,779 µm, 8454 µm, 2602 µm, and 584 µm were analyzed). It was noted that for flat and extensive peaks, it was easier to achieve tightness than for pairs of joints where surfaces with sharp peaks predominated. The larger radius of curvature of the peaks had the effect of increasing the contact area between the compressed parts, which reduced the occurring paths of possible leakage of the testing medium between the two samples. The leakage value between the surfaces with extreme values of the tested parameter Spc was 10 times smaller.

Author Contributions

Conceptualization, N.W.; methodology, N.W., G.K., M.Ś. and J.K.; software, G.K.; validation, N.W., M.R., G.K. and M.K.G.; formal analysis, N.W. and M.R.; investigation, N.W. and M.R.; resources, M.Ś.; writing—original draft preparation, N.W., M.R. and M.F.; writing—review and editing, N.W., M.R. and M.K.G.; visualization, N.W., M.R. and M.F.; supervision, G.K.; project administration, M.Ś.; funding acquisition, M.Ś. All authors have read and agreed to the published version of the manuscript.

Funding

This research was funded by the Regional Operational Programme for the Wielkopolska Voivodeship financed by the Structural Funds of the European Union and the State budget of Poland, under grant no. RPWP.01.02.00-30-0046/16.

Institutional Review Board Statement

Not applicable.

Informed Consent Statement

Not applicable.

Data Availability Statement

Not applicable.

Conflicts of Interest

The authors declare no conflict of interest.

References

  1. Wu, J.; Li, Y.; Sun, G.; Chen, S. Experimental and Numerical Analyses of the Hysteretic Performance of an Arched Aluminium Alloy Gusset Joint. Thin-Walled Struct. 2022, 171, 108765. [Google Scholar] [CrossRef]
  2. Hu, J.; Jin, J.; Xuan, S.; Mi, S.; Tian, W.; Liao, W. Influence of Cyclical Hygrothermal Aging on Mechanical Response and Structural Durability of Composite Bolted Interference-Fit Joints. Thin-Walled Struct. 2022, 173, 108997. [Google Scholar] [CrossRef]
  3. Hou, W.; Xu, X.; Hu, C.; Huo, Y.; Tong, L. Failure Characteristics of Composite Metallic Foam Core Hat-Shaped Tubular T-Joints under Static and Impact Loading. Thin-Walled Struct. 2022, 174, 109064. [Google Scholar] [CrossRef]
  4. Zeng, X.; Fan, X.; Li, H.; Li, S. Flow Forming Process of Thin-Walled Tubular Parts with Cross Inner Ribs. Procedia Manuf. 2018, 15, 1239–1246. [Google Scholar] [CrossRef]
  5. Lipp, K.; Schaefer, R.; Horwatitsch, D. Fatigue Behaviour of Aluminium Tube Crimp Connections Applying the Electromagnetic Pulse Technology. Procedia Eng. 2018, 213, 488–496. [Google Scholar] [CrossRef]
  6. Shang, J.; Hatkevich, S.; Wilkerson, L. Experimental Study and Numerical Simulation of Electromagnetic Tube Expansion. In Proceedings of the 5th International Conference on High Speed Forming, Dortmund, Germany, 24–26 April 2012; pp. 83–92. [Google Scholar]
  7. Yamada, T.; Kani, K.; Sakuma, K.; Yubisui, A. Experimental Study on the Mechanics of Springback in High Speed Sheet Metal Forming. In Proceedings of the 7th International Conference on High Energy Rate Fabrication, Leeds, UK, 14–18 September 1981; pp. 306–314. [Google Scholar]
  8. Bühler, H.; von Finckenstein, E. Bemessung von Sickenverbindungen Für Ein Fügen Durch Magnetumformung. Werkstatt Betr. 1971, 104, 45–51. [Google Scholar]
  9. Hayner, N.A. Selecting the Proper Crimp Tool Setting for Crimp Contact—Wire Terminations. In Proceedings of the 13th Engineering Seminar on Electric contact Phenomena, Chicago, IL, USA; 1967; pp. 273–286. [Google Scholar]
  10. Mocellin, K.; Petitprez, M. Experimental and Numerical Analysis of Electrical Contact Crimping to Predict Mechanical Strength. Procedia Eng. 2014, 81, 2018–2023. [Google Scholar] [CrossRef]
  11. Bouchard, P.-O.; Laurent, T.; Tollier, L. Numerical Modeling of Self-Pierce Riveting—From Riveting Process Modeling down to Structural Analysis. J. Mater. Process. Technol. 2008, 202, 290–300. [Google Scholar] [CrossRef]
  12. Kugener, S. Simulation of the Crimping Process by Implicit and Explicit Finite Element Methods. AMP J. Technol. 1995, 4, 8–15. [Google Scholar]
  13. Shirgaokar, M.; Cho, H.; Ngaile, G.; Altan, T.; Yu, J.-H.; Balconi, J.; Rentfrow, R.; Worrell, W.J. Optimization of Mechanical Crimping to Assemble Tubular Components. J. Mater. Process. Technol. 2004, 146, 35–43. [Google Scholar] [CrossRef]
  14. Wen, T.; Zheng, J.; Qing, J.; Fang, J. Outwards and Inwards Crimping of Tube Ends by Single-Point Incremental Forming. Procedia Eng. 2017, 207, 854–859. [Google Scholar] [CrossRef]
  15. Alves, M.L.; Almeida, B.P.P.; Rosa, P.A.R.; Martins, P.A.F. End Forming of Thin-Walled Tubes. J. Mater. Process. Technol. 2006, 177, 183–187. [Google Scholar] [CrossRef]
  16. Wen, T.; Yang, C.; Zhang, S.; Liu, L. Characterization of Deformation Behavior of Thin-Walled Tubes during Incremental Forming: A Study with Selected Examples. Int. J. Adv. Manuf. Technol. 2015, 78, 1769–1780. [Google Scholar] [CrossRef]
  17. Maruda, R.W.; Krolczyk, G.M.; Nieslony, P.; Wojciechowski, S.; Michalski, M.; Legutko, S. The Influence of the Cooling Conditions on the Cutting Tool Wear and the Chip Formation Mechanism. J. Manuf. Process. 2016, 24, 107–115. [Google Scholar] [CrossRef]
  18. Krolczyk, G.M.; Krolczyk, J.B.; Legutko, S.; Hunjet, A. Effect of the Disc Processing Technology on the Vibration Level of the Chipper during Operations. Environment 2014, 7, 10. [Google Scholar]
  19. Chen, C.; Zhao, S.; Han, X.; Zhao, X.; Ishida, T. Experimental Investigation on the Joining of Aluminum Alloy Sheets Using Improved Clinching Process. Materials 2017, 10, 887. [Google Scholar] [CrossRef]
  20. Lambiase, F.; Di Ilio, A.; Paoletti, A. Joining Aluminium Alloys with Reduced Ductility by Mechanical Clinching. Int. J. Adv. Manuf. Technol. 2015, 77, 1295–1304. [Google Scholar] [CrossRef]
  21. Lambiase, F. Joinability of Different Thermoplastic Polymers with Aluminium AA6082 Sheets by Mechanical Clinching. Int. J. Adv. Manuf. Technol. 2015, 80, 1995–2006. [Google Scholar] [CrossRef]
  22. Wrobel, N.; Rejek, M.; Krolczyk, G.; Hloch, S. Testing of Tight Crimped Joint Made on a Prototype Stand. In Advances in Manufacturing; Springer: Cham, Switzerland, 2018; pp. 497–507. [Google Scholar]
  23. Mucha, J.; Kaščák, L.; Spišák, E. Joining the Car-Body Sheets Using Clinching Process with Various Thickness and Mechanical Property Arrangements. Arch. Civ. Mech. Eng. 2011, 11, 135–148. [Google Scholar] [CrossRef]
  24. Mori, K.; Maeno, T.; Fuzisaka, S. Punching of Ultra-High Strength Steel Sheets Using Local Resistance Heating of Shearing Zone. J. Mater. Process. Technol. 2012, 212, 534–540. [Google Scholar] [CrossRef]
  25. Berezhnoi, D.V.; Shamim, M.R. Numerical Investigation of Clinch Connection Manufacturing Process. Procedia Eng. 2017, 206, 1056–1062. [Google Scholar] [CrossRef]
  26. Ren, X.; Chen, C.; Ran, X.; Zhang, X.; Gao, X. Effects of Friction Factor on Mechanical Performance of the AA5182 Clinched Joint. Int. J. Adv. Manuf. Technol. 2022, 120, 1831–1841. [Google Scholar] [CrossRef]
  27. Fischer, F.J.; Schmitz, K.; Tiwari, A.; Persson, B.N.J. Fluid Leakage in Metallic Seals. Tribol. Lett. 2020, 68, 125. [Google Scholar] [CrossRef]
  28. Kozuch, E.; Nomikos, P.; Rahmani, R.; Morris, N.; Rahnejat, H. Effect of Shaft Surface Roughness on the Performance of Radial Lip Seals. Lubricants 2018, 6, 99. [Google Scholar] [CrossRef]
  29. PN-EN 573-3:2019-12; Aluminium i Stopy Aluminium—Skład Chemiczny i Rodzaje Wyrobów Przerobionych Plastycznie—Część 3: Skład Chemiczny i Rodzaje Wyrobów. Polish Committee for Standardization: Warsaw, Poland, 2019.
  30. PN-EN 755-2:2016-05; Aluminium i Stopy Aluminium—Pręty, Rury i Kształtowniki Wyciskane—Część 2: Własności Mechaniczne. Polish Committee for Standardization: Warsaw, Poland, 2019.
  31. “ATEQ”. Available online: https://ateq.pl/produkt/ateq-f620/ (accessed on 26 August 2022).
  32. Mishra, V.; Khatri, N.; Nand, K.; Singh, K.; Sarepaka, R.V. Experimental Investigation on Uncontrollable Parameters for Surface Finish during Diamond Turning. Mater. Manuf. Process. 2015, 30, 232–240. [Google Scholar] [CrossRef]
  33. Qehaja, N.; Jakupi, K.; Bunjaku, A.; Bruçi, M.; Osmani, H. Effect of Machining Parameters and Machining Time on Surface Roughness in Dry Turning Process. Procedia Eng. 2015, 100, 135–140. [Google Scholar] [CrossRef]
  34. Hayajneh, M.T.; Tahat, M.S.; Bluhm, J. A Study of the Effects of Machining Parameters on the Surface Roughness in the End-Milling Process. Jordan J. Mech. Ind. Eng. 2007, 1, 1–5. [Google Scholar]
  35. Wu, H.; Luo, Z.; Dong, Y.; Yao, L.; Song, R.; Xu, Y. Tribological Properties of Ni-BP/Ni Coatings Produced by Electroless Co-Deposition. Surf. Coat Technol. 2022, 443, 128637. [Google Scholar] [CrossRef]
Figure 1. Sealing surface for leak tests.
Applsci 12 08917 g001
Figure 2. A cross-sectional view of the part subjected to leakage tests.
Applsci 12 08917 g002
Figure 3. View of the assembled kit for the leak test.
Applsci 12 08917 g003
Figure 4. Conceptual diagram of the pneumatic measurement system Adapted with permission from Ref. [31], 2022, ATEQ.
Applsci 12 08917 g004
Figure 5. Diagram of the stand for testing the tightness of samples.
Applsci 12 08917 g005
Figure 6. Contour map and isometric view of samples. (a,b) Coded A, (c,d) coded B, (e,f) coded C.
Applsci 12 08917 g006aApplsci 12 08917 g006b
Figure 7. Contour map and isometric view of samples. (a,b) Coded D, (c,d) coded E, (e,f) coded F.
Applsci 12 08917 g007aApplsci 12 08917 g007b
Figure 8. Graph of dependence for a pair of samples 1–2, produced with comparable surface topography parameters for different test cases, i.e., different compressive forces.
Applsci 12 08917 g008
Figure 9. Graph of dependence for a pair of samples 9–10, produced with comparable surface topography parameters for different test cases, i.e., different compressive forces.
Applsci 12 08917 g009
Figure 10. A diagram of dependence for a pair of samples 6–8, with surface topography parameters from code groups A and B, for a variable clamping force.
Applsci 12 08917 g010
Figure 11. The value of leakage Q as a function of the surface topography parameter Sa for a constant compressive force of 2280 N.
Applsci 12 08917 g011
Figure 12. The value of leakage Q as a function of the difference in the value of the surface topography parameter Sa for a constant compressive force of 2280 N for the base surface with a value of Sa = 5.24 µm.
Applsci 12 08917 g012
Figure 13. The value of leakage Q as a function of the difference in the value of the surface topography parameter Sa for a constant compressive force of 2280 N for the base surface with the value Sa = 3.29 µm.
Applsci 12 08917 g013
Figure 14. The value of leakage Q as a function of the difference in the value of the surface topography parameter Sa for a constant compressive force of 2280 N for the base surface with a value of Sa = 1.25 µm.
Applsci 12 08917 g014
Figure 15. The value of leakage Q as a function of the difference in the value of the surface topography parameter Sa for a constant compressive force of 2280 N for the base surface with the value of Sa = 0.33 µm.
Applsci 12 08917 g015
Figure 16. The value of leakage Q as a function of the difference in the value of the surface topography parameter Sa for a constant compressive force of 2280 N for the base surface with a value of Sa = 0.187 µm.
Applsci 12 08917 g016
Figure 17. The value of leakage Q as a function of the difference in the value of the surface topography parameter Sv for a constant compressive force of 2280 N.
Applsci 12 08917 g017
Table 1. Chemical composition of the aluminum alloy 6060 T4 in accordance with the PN-EN 573-3:2019-12 [29].
Si
[%]
Fe
[%]
Cu
[%]
Mn
[%]
Mg
[%]
Cr
[%]
Zn
[%]
Ti
[%]
OtherAl.
[%]
Each
[%]
Total
[%]
0.30–0.600.10–0.300.100.100.35–0.600.050.150.100.050.15The rest
Table 2. Mechanical properties of the aluminum alloy 6060 T4 in accordance with PN-EN 755-2:2016-05 [30].
AlloyTemperWall
Thickness
[mm]
Tensile Strength
Rm [MPa]
Yield Point Rp0.2 [MPa]ElongationHardness Brinell
HBS
A50 [%] minA [%] min
6060T4>25120601416045
Table 3. Values of the Ra parameter for given surface groups.
No.Sample NumbersRoughness Value Range RaType of Machining
1.1–74.24–4.32Turning
2.8–142.79–2.87Turning
3.15–211.26–1.34Milling
4.22–281.34–1.42Turning
5.29–350.14–0.22Milling
6.36–420.06–0.14Turning
Table 4. Values adopted for the leak test.
Test
Pressure
System
Volume
Filling TimeStabilization TimeTest TimeEmptying Time
2 bar21.25 cm31 s9 s1 s<1 s
Table 5. Ranges of the device for measuring the pressure drop ΔP where dP is the measured value of the pressure drop, with permission from Ref [31], 2022, ATEQ.
RangeAccuracyMaximum Resolution
0–50 Pa±(1.5% dP + 0.5 Pa)0.01 Pa
0–500 Pa±(1% dP + 1 Pa)0.1 Pa
0–5000 Pa±(1% dP + 10 Pa)1 Pa
Table 6. Forces and leakage of second pair (9–10).
Force [N]Leakage [cm3/min]
880 ± 701.260 ± 0.027
1550 ± 700.171 ± 0.009
2280 ± 700.103 ± 0.008
3105 ± 700.070 ± 0.008
4140 ± 700.058 ± 0.007
5175 ± 700.054 ± 0.007
6210 ± 700.044 ± 0.007
Table 7. Forces and leakage of sets with matching surface topography parameters from code groups C, D, E, and F.
Force [N]Leakage [cm3/min]
17–18 (C–C)25–26 (D–D)33–34 (E–E)40–41 (F–F)
620 ± 70X1.288 ± 0.0270.157 ± 0.0093.200 ± 0.046
1550 ± 70X0.060 ± 0.0070.082 ± 0.0080.107 ± 0.008
2280 ± 70X0.059 ± 0.0070.060 ± 0.0070.044 ± 0.007
Table 8. Forces and leakage for a pair of samples with surface topography parameters from code groups A, C, D, E, and F.
Force [N]Leakage [cm3/min]
6–8 (A–B)3–15 (A–C)4–22 (A–D)5–29 (A–E)7–36 (A–F)
2280 ± 701.880 ± 0.033X3.300 ± 0.0565.900 ± 0.0736.407 ± 0.078
3105 ± 701.230 ± 0.026X2.620 ± 0.056XX
3365 ± 70XXXX0.940 ± 0.023
3620 ± 70XXX2.340 ± 0.037X
4140 ± 70XXXX0.038 ± 0.007
4400 ± 700.400 ± 0.018X1.240 ± 0.025XX
5180 ± 70XX0.470 ± 0.0140.990 ± 0.024X
6210 ± 70X4.910 ± 0.0630.410 ± 0.0130.450 ± 0.013X
7245 ± 70X1.890 ± 0.033XXX
8280 ± 70X0.634 ± 0.016X0.120 ± 0.008X
9060 ± 70X0.307 ± 0.011XXX
Table 9. Forces and leakage for a pair of samples with surface topography parameters from code groups B, C, D, E, and F.
Force [N]Leakage [cm3/min]
13–16 (B–C)11–23 (B–D)12–30 (B–E)14–38 (B–F)
260 ± 70XX0.450 ± 0.013X
520 ± 70XX0.280 ± 0.011X
620 ± 70X0.346 ± 0.012XX
1035 ± 70X 0.120 ± 0.0081.407 ± 0.029
1550 ± 70X0.090 ± 0.0080.090 ± 0.0080.590 ± 0.015
2280 ± 70X0.061 ± 0.0070.060 ± 0.0070.079 ± 0.008
3105 ± 705.910 ± 0.0730.044 ± 0.007XX
3365 ± 70XXXX
3620 ± 70XXXX
4140 ± 701.900 ± 0.033XXX
4400 ± 70XXXX
5175 ± 701.100 ± 0.025XXX
6210 ± 700.560 ± 0.015XXX
Table 10. Forces and leakage for a pair of samples with surface topography parameters from code groups D, E, and F.
Force [N]Leakage [cm3/min]
(21–37) (D–E)(28–42) (D–F)(35–39) (E–F)
260 ± 705.610 ± 0.0705.910 ± 0.073X
415 ± 70XX0.907 ± 0.023
1035 ± 702.200 ± 0.0362.500 ± 0.0390.077 ± 0.008
1550 ± 700.244 ± 0.0100.184 ± 0.0090.050 ± 0.007
2280 ± 700.130 ± 0.0080.071 ± 0.0080.043 ± 0.007
3105 ± 700.071 ± 0.008XX
Publisher’s Note: MDPI stays neutral with regard to jurisdictional claims in published maps and institutional affiliations.

