Article

Low Compressibility at the Transition Zone of Railway Tracks Reinforced with Cement-Treated Gravel and a Geogrid under Construction

1
Hanwha Engineering and Construction, Seoul 04541, Korea
2
Advanced Railroad Civil Engineering Division, Korea Railroad Research Institute, #176 Railroad Museum St., Uiwang 16105, Korea
3
School of Civil and Environmental Engineering, Yonsei University, Seoul 03722, Korea
*
Author to whom correspondence should be addressed.
Appl. Sci. 2022, 12(17), 8861; https://doi.org/10.3390/app12178861
Submission received: 28 July 2022 / Revised: 26 August 2022 / Accepted: 26 August 2022 / Published: 3 September 2022

Abstract

:
In the transition zone of railway tracks, track irregularities occur frequently due to differential settlement, which arises from the difference between the vertical supporting stiffness of the abutment and the backfill. This is disadvantageous because it increases the maintenance requirements and deteriorates the ride quality. To address this challenge, this study proposes a strategy involving the application of cement-treated gravel reinforced with geogrids and rigid facing walls. The reinforced subgrade for railways (RSR), which can reduce residual settlement through the initial construction of the backfill reinforced with geogrids and the subsequent development of the rigid facing wall, was constructed at the transition zone with cement-treated gravel as the backfill material. The long-term behaviors during and after construction on the RSR for a period of 16 months were evaluated by analyzing the surface and ground settlements, horizontal earth pressure, and geogrid strain. The minor net settlement of the reinforced backfill converges at the early stage of subgrade construction, and the horizontal earth pressure was approximately reduced to the level of 54–63% of the Rankine active earth pressure.

1. Introduction

In transition zones, which are the weakest zones in the railway roadbed, track irregularities frequently occur because of differential settlements, which are induced by the difference in the vertical stiffness of the concrete abutment and the earth transition zone [1]. To mitigate differential settlement, several design codes suggest various measures, such as the implementation of approach blocks, approach slabs, and reinforced materials nd structures.
The approach block is used to mitigate differential settlement; material with medium stiffness is placed between the abutment concrete structure and the subgrade on the back of the abutment, thereby smoothing the change in stiffness of the subgrade. Studies related to the approach block were conducted which focused on several materials [2,3,4] and ground-reinforcement strategies [5,6]. Cement-treated gravel is a material typically used for the construction of approach blocks [7,8,9]. When graded gravel is mixed with a certain amount of cement (3–5%) and compacted, it exhibits a stiffness greater than that of graded gravel (without cement) [10,11]; thus, the difference in stiffness between backfill and concrete structures can be mitigated.
The approach slab is a concrete structure in the shape of a slab and is supported at one end by the bridge abutment and at the other end by the embankment soil [12]. By connecting the abutment and embankment with a slab, this structure is used to reduce the difference in stiffness of the subgrade. A nonlinear finite element analysis [13], a field survey [14], and dynamic analysis using a three-dimensional finite element model [15] have been performed to investigate the approach slab. These studies reported on the effect of reducing differential settlement in transition zones.
In another approach to improve the performance of the transition zone, geosynthetics-based reinforcement methods have been explored. Watanabe et al. performed shaking table tests of an abutment reinforced with a geogrid and discovered that the structural stability may be secured by utilizing the tension of the geogrid [16]. Moreover, Feng et al. investigated the performance of a geogrid-reinforced and pile-supported bridge approach via field monitoring [17]. In addition, the performance and stability of geosynthetic-reinforced soil bridges have been evaluated via numerical analyses [18] and their life cycle assessment [19]. However, only a few studies have focused on the installation of geosynthetic-reinforced retaining walls at the transition zone of the railway abutment.
The above studies have something in common that they make the change of stiffness smooth in the transition zone. Because the transition zone composed of soil material has a lower stiffness than a bridge with concrete, structural and material methods have been employed to increase the stiffness of the transition zone.
In this study, the low compressibility and applicability of the geosynthetic-reinforced retaining wall using cement-treated gravel as a backfill material in the transition zone was evaluated. For this study, a reinforced subgrade for railway (RSR) was constructed in an abutment transition zone at the Osong railway test line in Korea, and long-term measurement was performed during and after the construction.

2. Design and Construction of RSR Abutment and Transition Zone

By initially constructing the backfill which is reinforced with a geogrid, followed by a rigid facing wall, the resultant RSR can minimize the residual settlement, as illustrated in Figure 1 [20,21]. Through the integration of the geogrid and the rigid facing wall, the bearing capacity of the subgrade can be increased, and horizontal earth pressure can be reduced [22,23]. Moreover, unlike segmental retaining walls reinforced with geosynthetics, the RSR eliminates any occurrences of local failure; thus, this subgrade is suitable for supporting large and frequent railway loads.

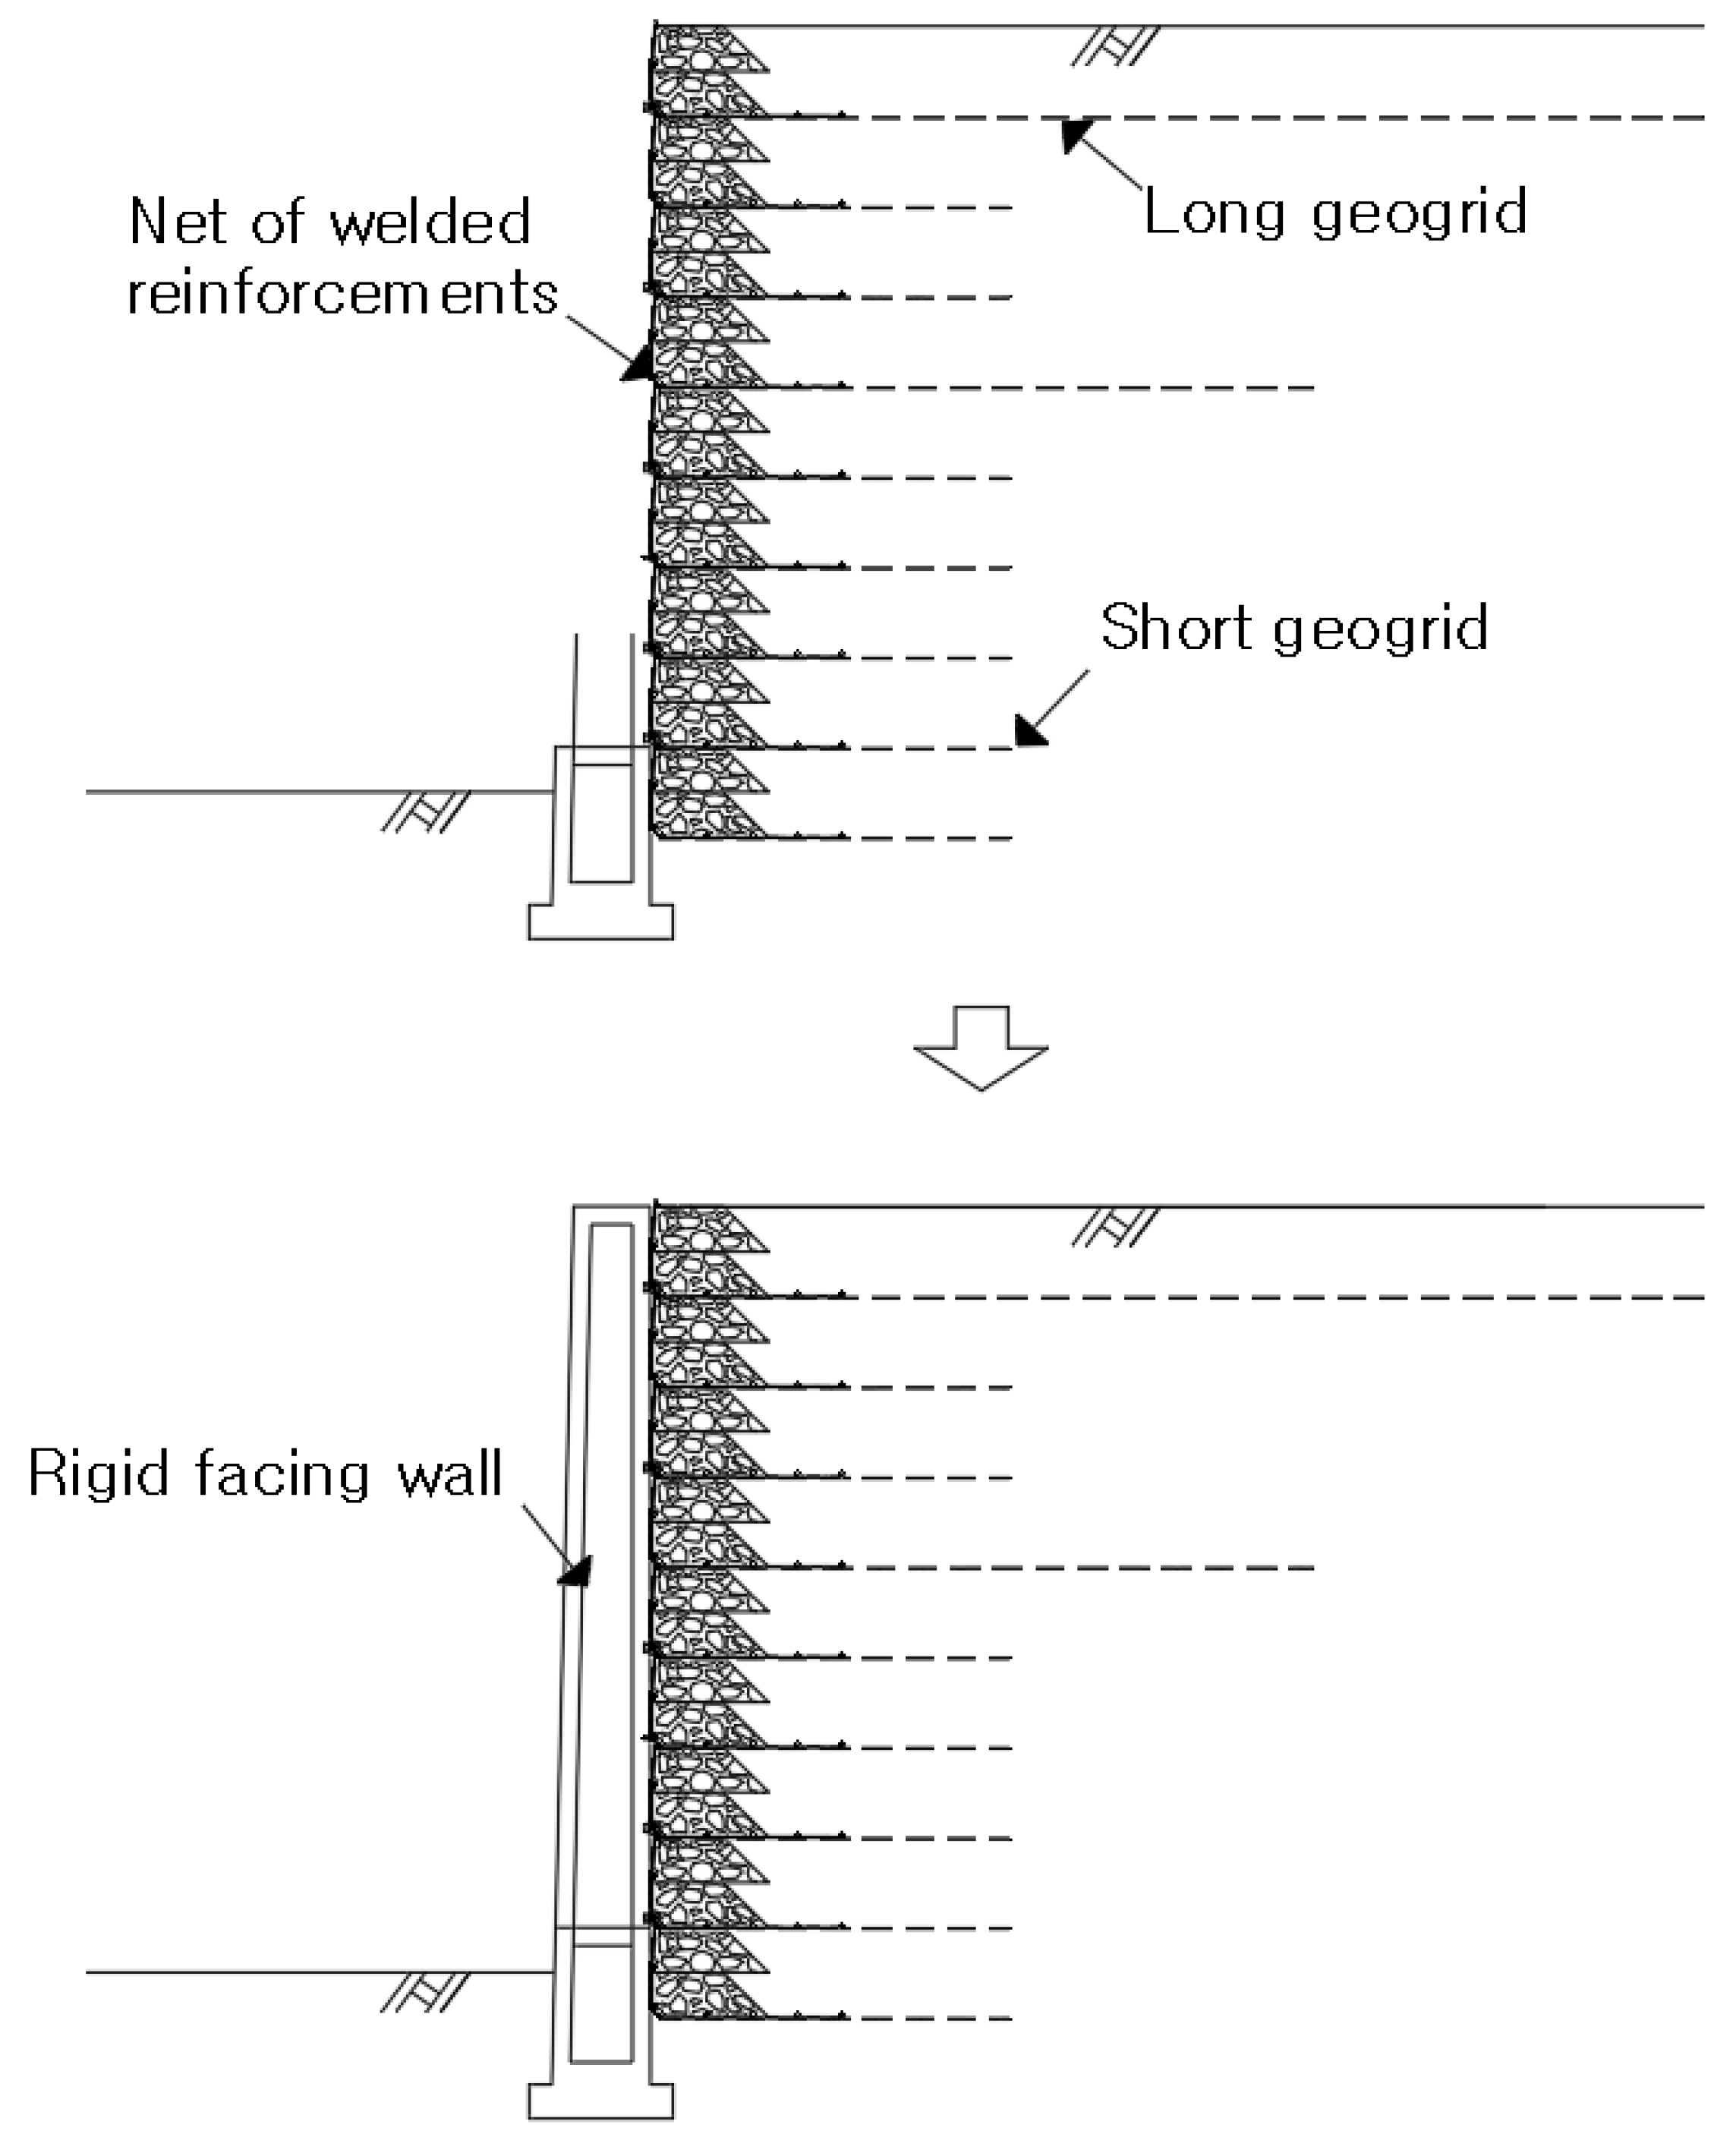
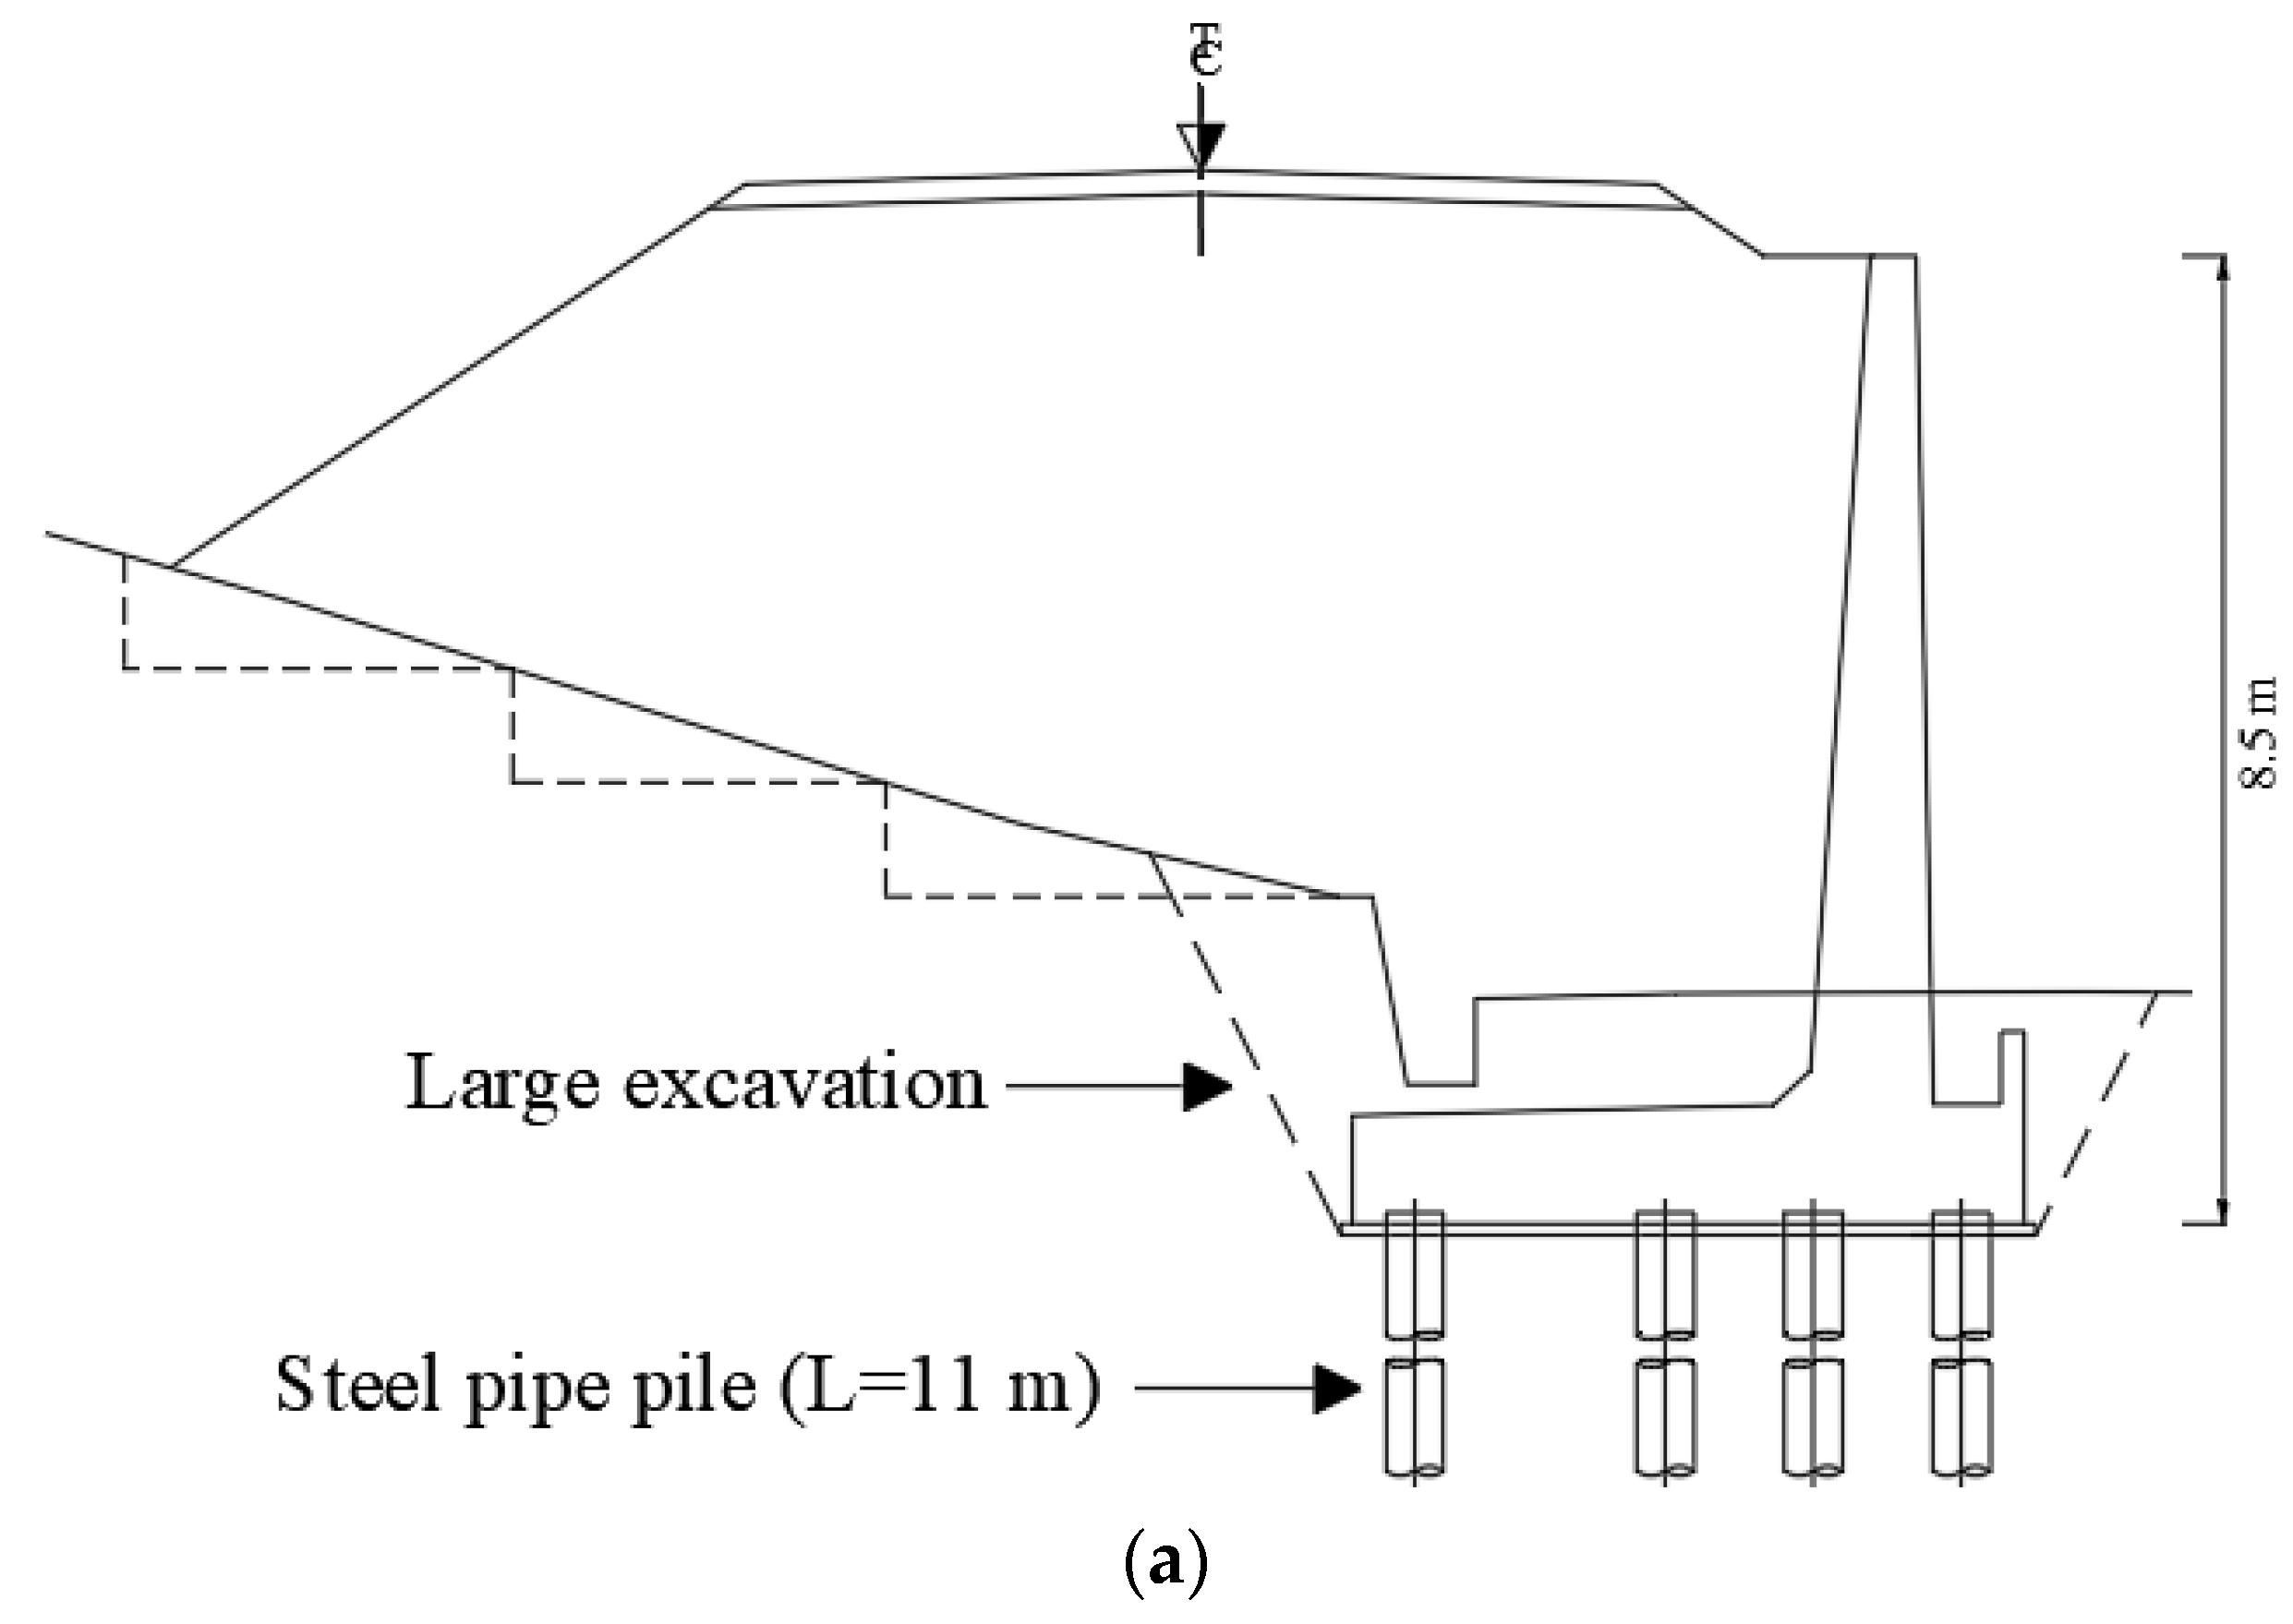
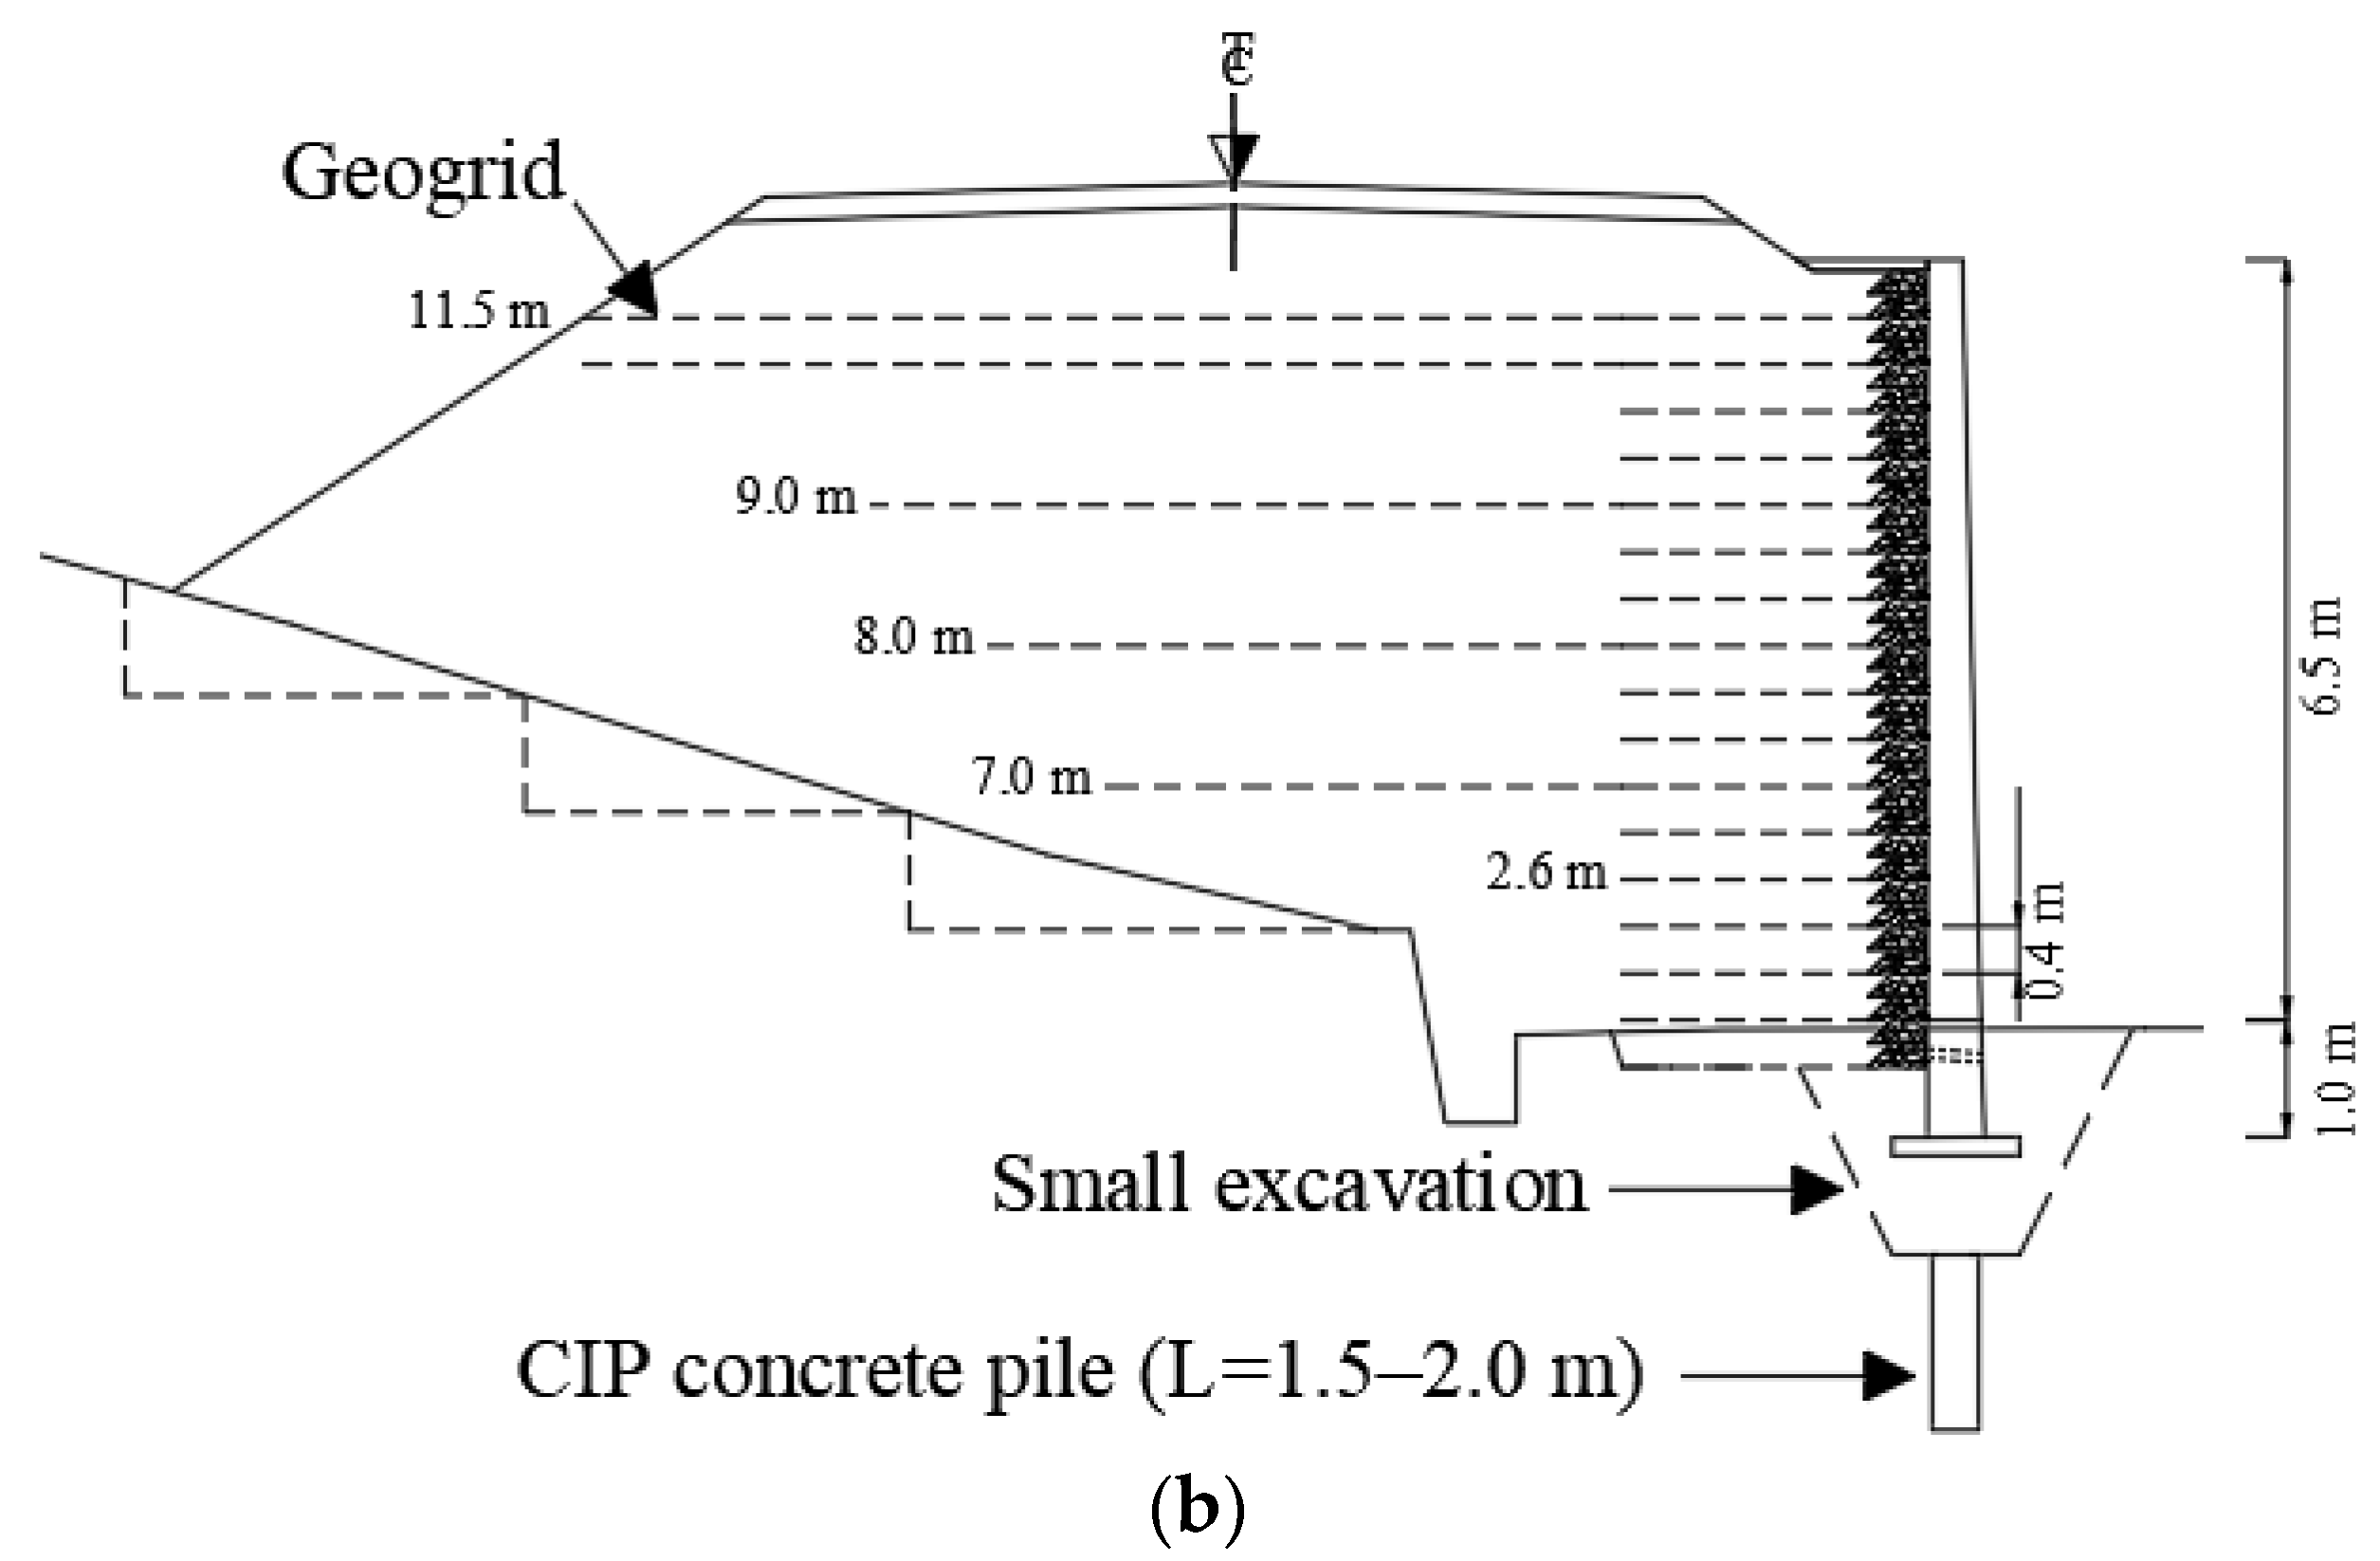
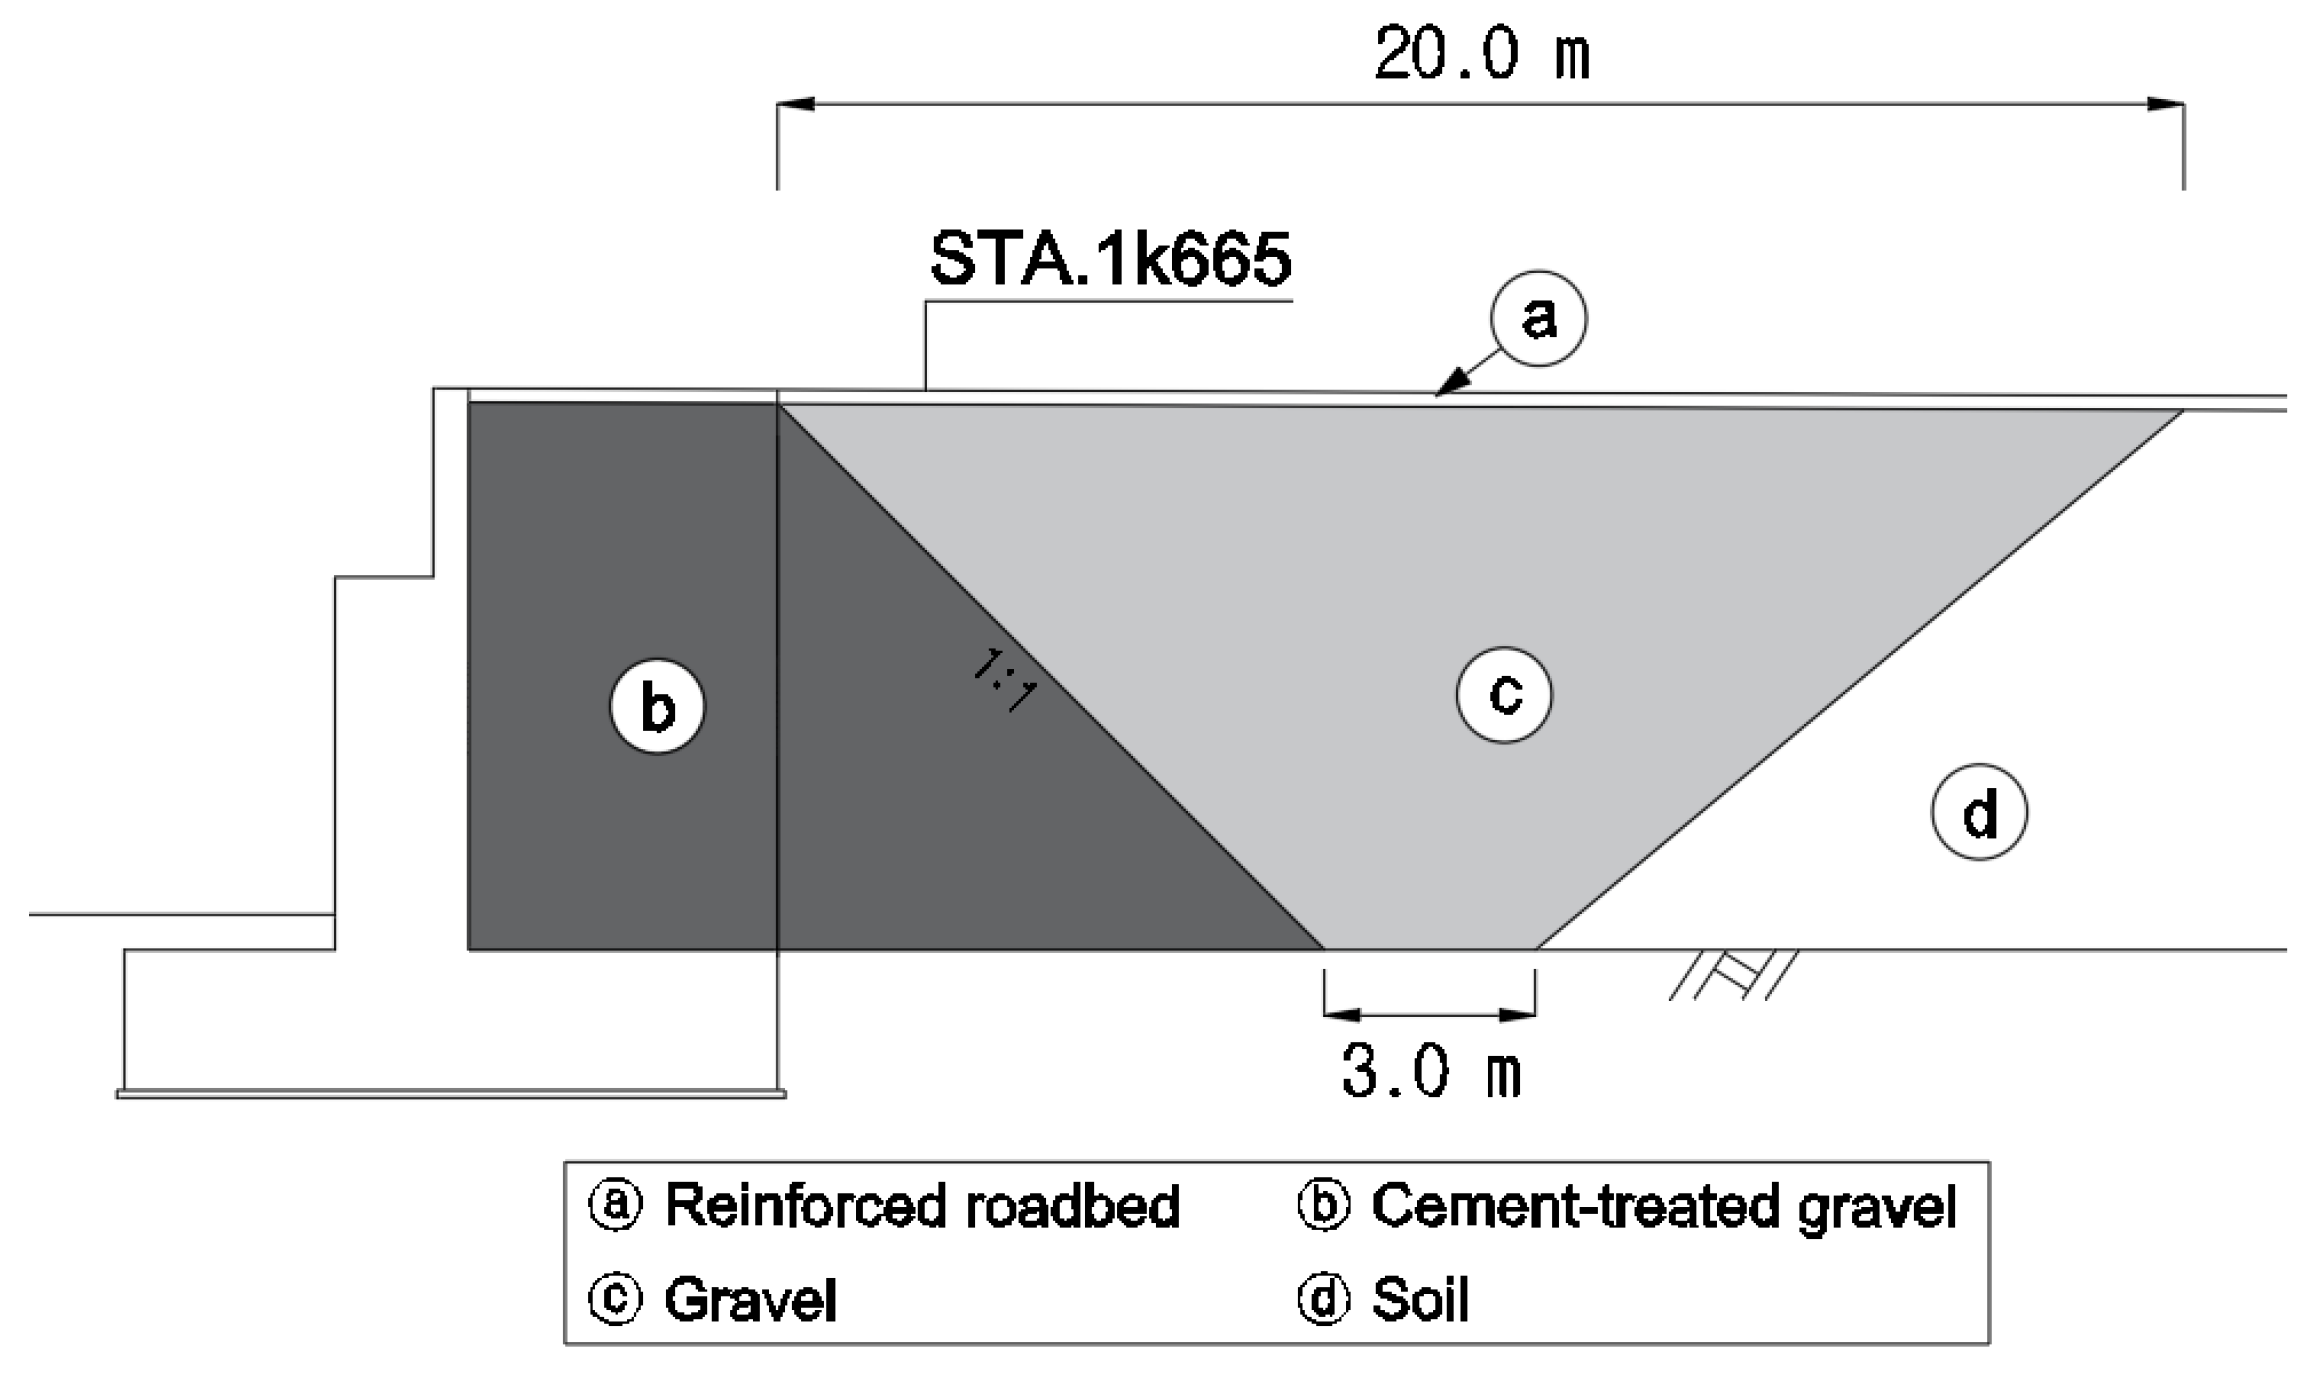
2.1. Design of RSR Abutment and Transition Zone

By issuing a field change request, the conventional reinforced concrete (RC) retaining wall was changed to an RSR. In the previous design, because of the short distance between the retaining wall and the adjacent road, the foundation of the retaining wall intruded onto the adjacent road. In addition, owing to the proximity of the site to a high-speed railroad, there were concerns that large pieces of equipment such as a crane may fall toward the high-speed railroad; thus, the construction was conducted at night during a 3 h period, from 01:00 to 03:00 AM, to obey Korean regulations. Nevertheless, the RSR could be constructed in a narrow working space without the need for any large equipment.
The site investigation results are listed in Table 1. The landfill and sedimentary layers comprised clayey sand and sandy clay, respectively. Although the ground contains clayey soil, it was in a stiff state with a high n value (n = 8–13), but the layer thickness was not thick.
The RSR was constructed at a height of 2.6–7.4 m and, including abutment transition zones, the total length was 156.0 m in STA.1k662.90–1k820.00 of the Osong railway test line in Korea. In this study, the STA.1k665 cross section in the abutment transition zone was selected for stability analysis, and its behaviors were subsequently evaluated.
As depicted in Figure 2, the bench cut size for the foundation is reduced, and instead of installing steel piles with a length of 11 m, the ground stability was improved by installing cast-in-place (CIP) concrete piles with lengths of 1.5–2.0 m. The length of the short geogrids is 2.60 m (35% of the wall height), and the length of the long geogrids is selected to satisfy the criteria for safety against circular failure, sliding, and overturning. These geogrids provide a tensile strength of 100 kN/m and a design tensile strength of 50 kN/m. Kim (2017) verified the stability of this RSR section during the dry and wet seasons, as well as during earthquakes using the RSR design program developed by the Korea Railroad Research Institute, as summarized in Table 2 [24].

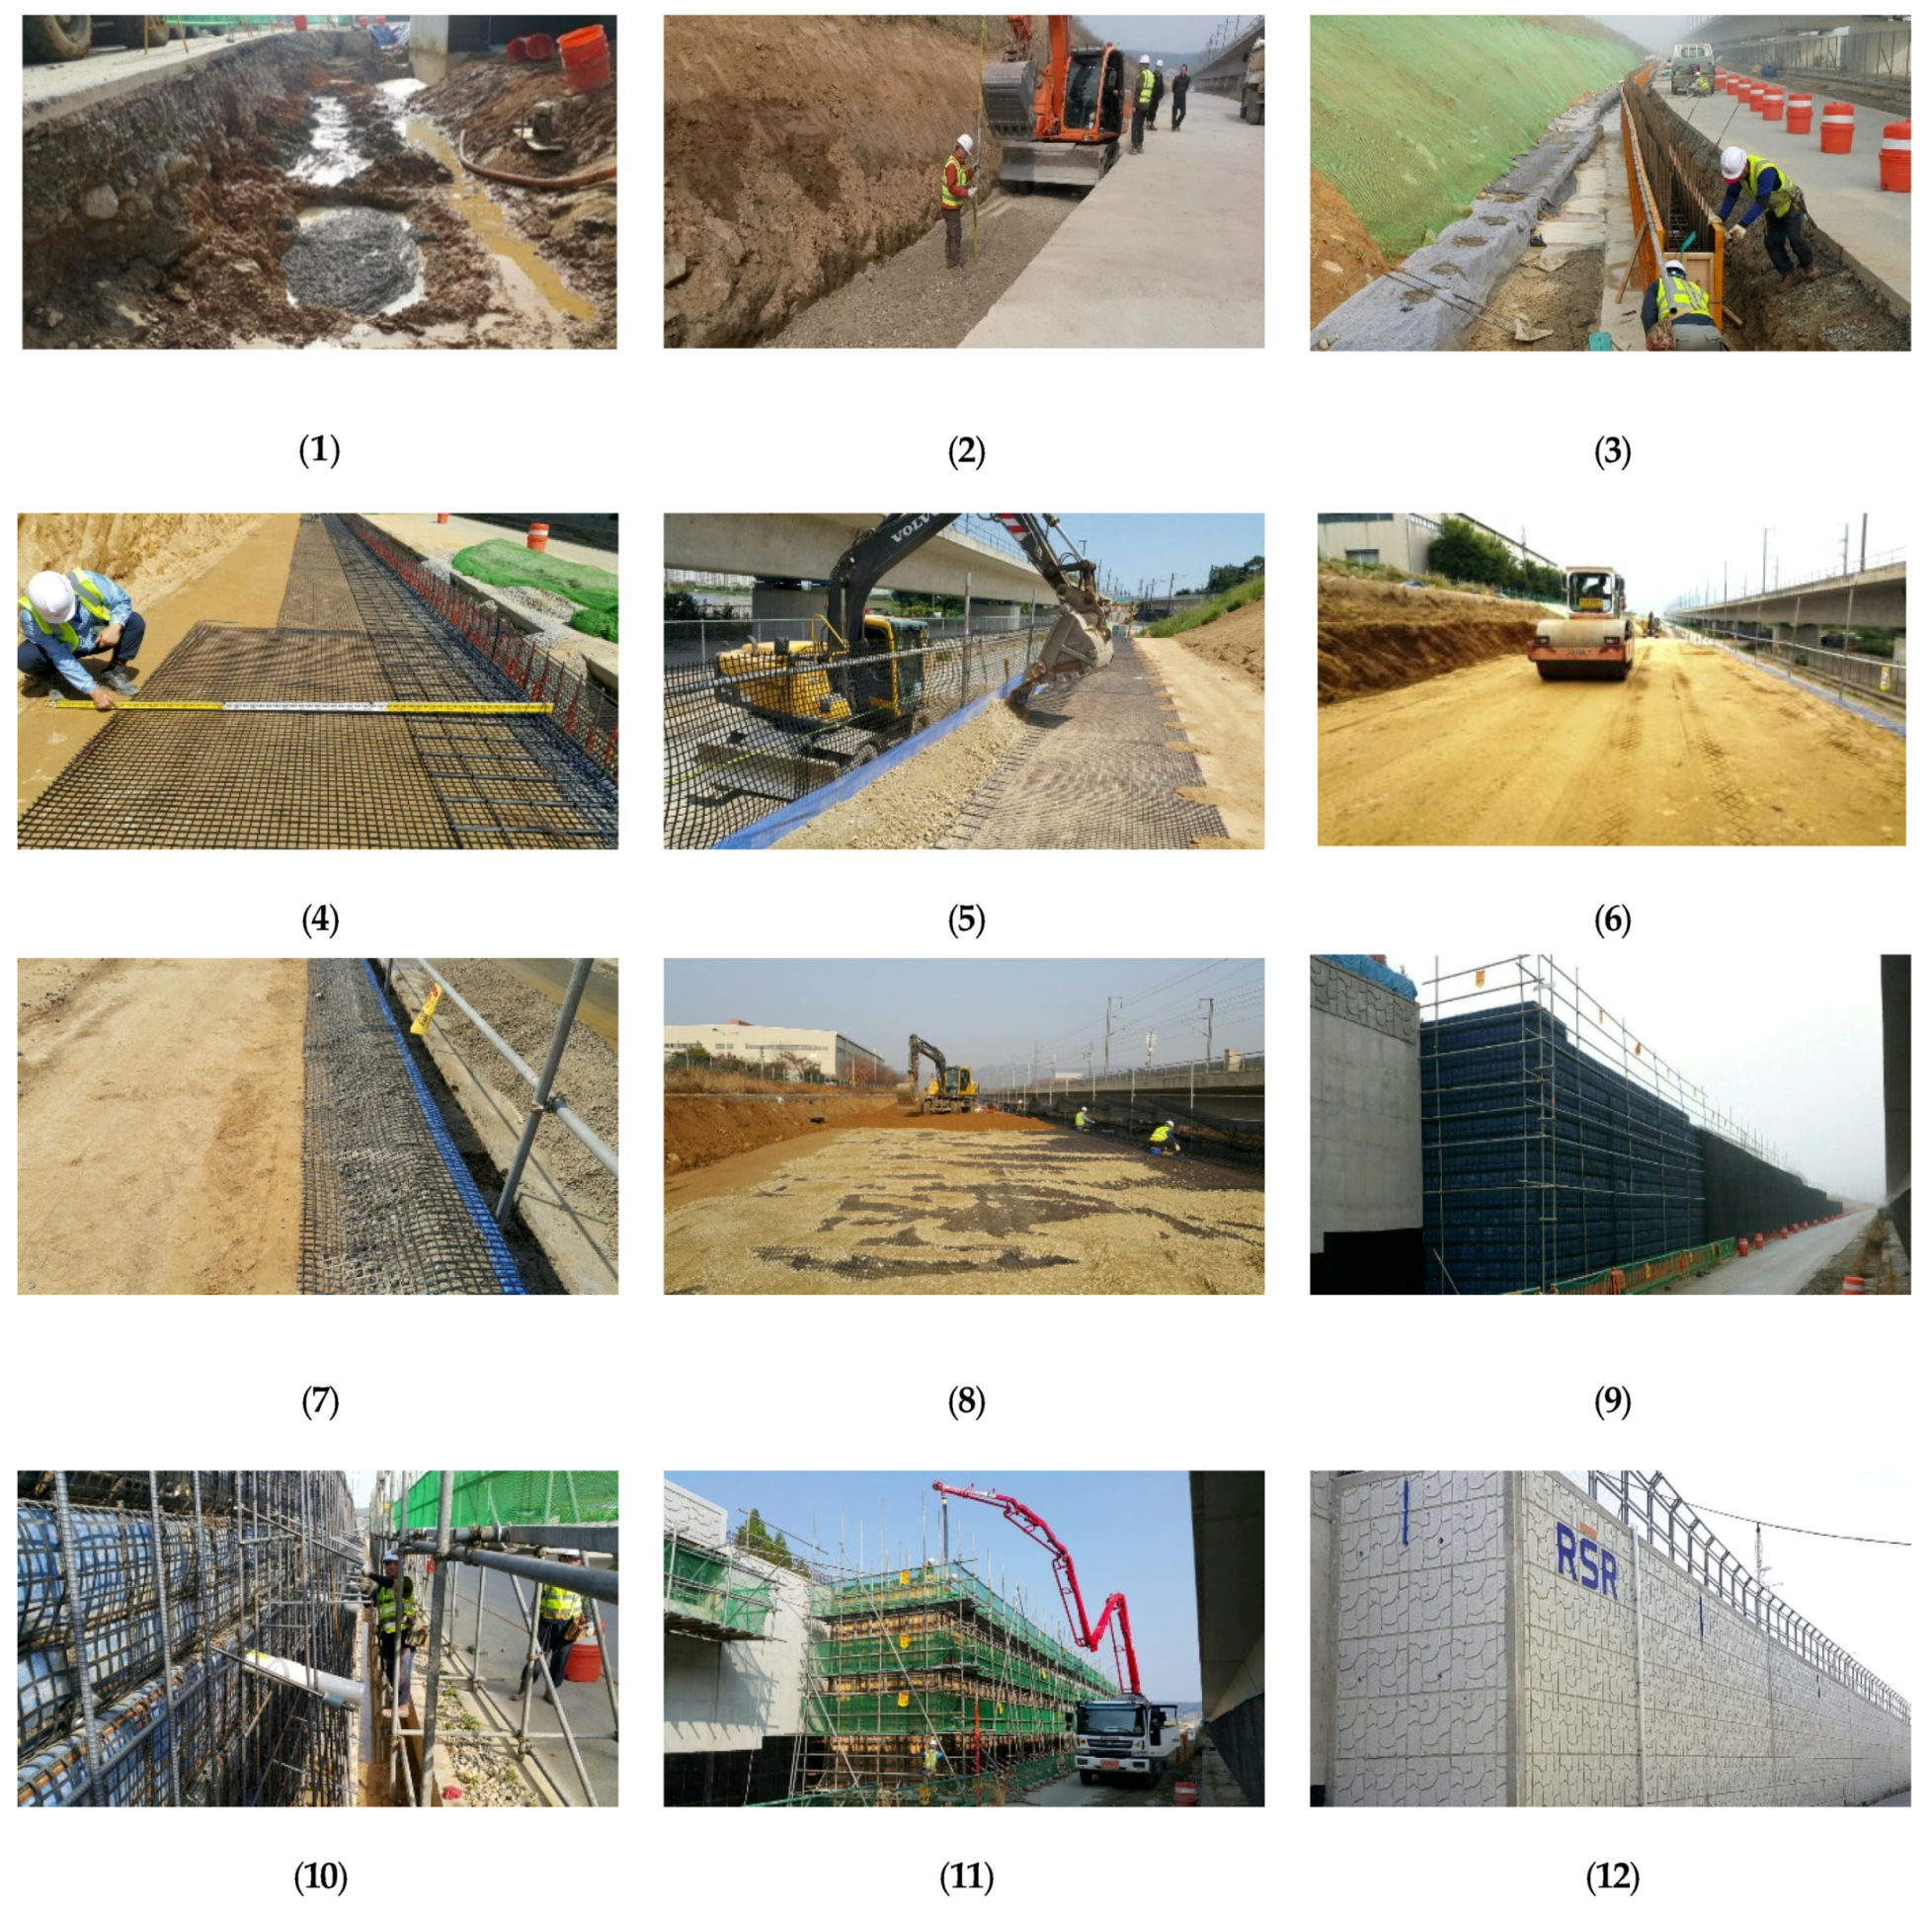
2.2. Construction of RSR Abutment Transition Zone

The construction details of the RSR are as follows: (1) first, the cast-in-place concrete pile was installed. (2) Subsequently, the bench cut was applied, and the 3% cement-treated gravel was spread out and compacted. (3) Thereafter, a 1 m-high small-strip foundation was installed. (4) Geogrids and nets of welded rebars were installed, (5) the cement-treated gravel was laid, (6) followed by compaction, (7) and then the geogrid was rolled up. (8) Steps (4) to (7) were repeated to obtain the 17th layer. (9) Subsequently, the backfill was stabilized, (10) the rebars and connectors were installed, (11) and the forms and placement of the concrete for the rigid wall were carried out. Finally, (12) the RSR was completed.
The construction stages are illustrated in Figure 3, and the time schedules and major milestones in the RSRs construction are listed in Table 3. The backfill materials for the RSR that were applied to the sections in accordance with the Korean Railway Design Standard for Roadbed are depicted in Figure 4 [25]. The properties and compaction conditions for backfill materials are summarized in Table 4. The 3% cement-treated gravel was applied for the ⓑ section, and gravel with a maximum diameter of 63 mm was applied for the ⓒ section.

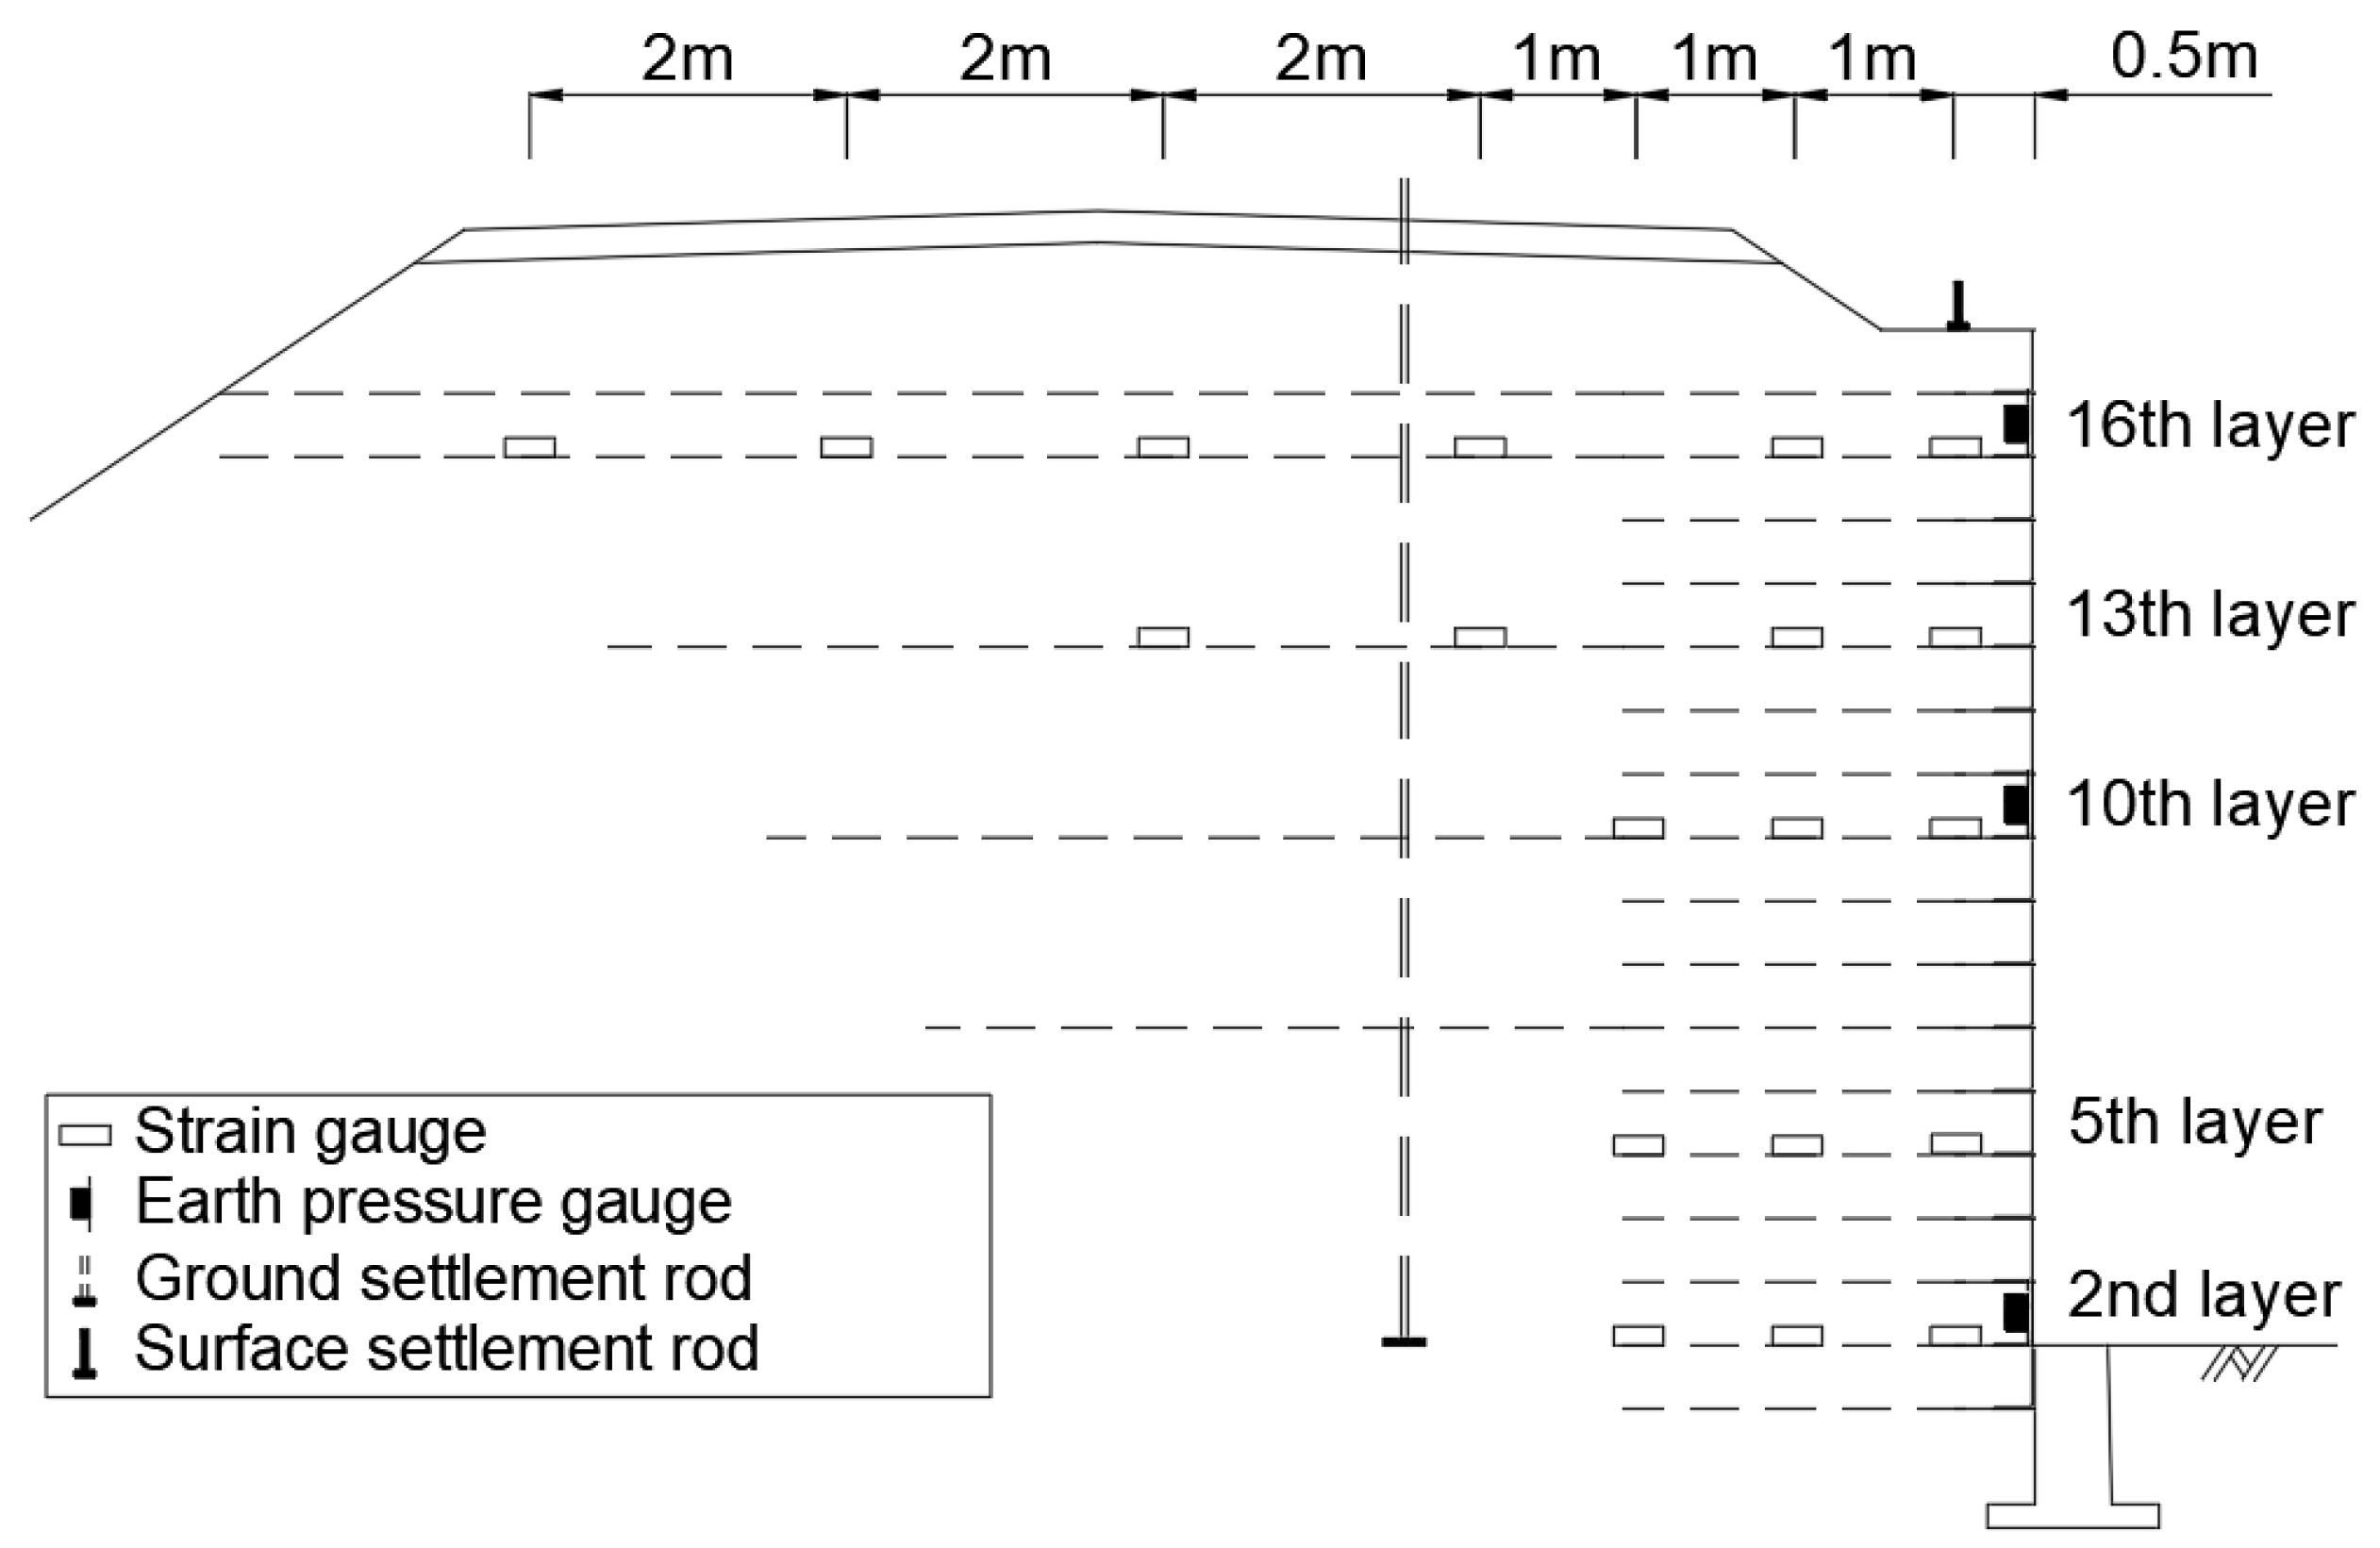
3. Installation of Sensors and Measuring Devices

To analyze the behaviors of the RSR which was applied to the abutment transition zone, 19 geogrid strain gauges, 3 horizontal earth pressure gauges, and settlement rods for the ground and the backfill surface were installed and measured during the construction process. The long-term measurements were conducted over a period of 16 months, including the 2.6 month-long construction period, and the RSR behaviors were identified. A schematic view of the measuring sensors is illustrated in Figure 5.
To distinguish the settlement of the ground and embankment, the settlement rods were placed on the ground and backfill surface, respectively. The settlement rod for the ground comprised a 1 m × 1 m square plate and a rod with a 15 mm diameter that could be extended as the backfill height was increased by 1 m. The surface settlement rod, featuring a circular steel plate with a 300 mm diameter and an attached 400 mm high rod, was installed at a distance of 0.5 m from the edge of the backfill. Considering the field conditions, the settlement measurements were performed after the completion of the embankment construction (from day 23 to day 274). The horizontal earth pressure gauges were installed at the net of the welded rebars at the 2nd, 10th, and 16th layers to observe the variation in the horizontal earth pressure with respect to the height. The strain gauges were installed on the 2nd and 5th layers and the 10th, 13th, and 16th layers for the short and long geogrids, respectively. The strain gauges on the short geogrids were installed at a distance of 0.5, 1.5, and 2.5 m from the exterior of the reinforced backfill. The strain gauges on the long geogrids were installed at a distance of 0.5, 1.5, and 2.5 m for the 10th layer, 0.5, 1.5, 3.5, and 5.5 m for the 13th layer, and 0.5, 1.5, 3.5, 5.5, 7.5, and 9.5 m for the 16th layer. The installed sensors used for the measurements are shown in Figure 6.

4. Results and Analysis
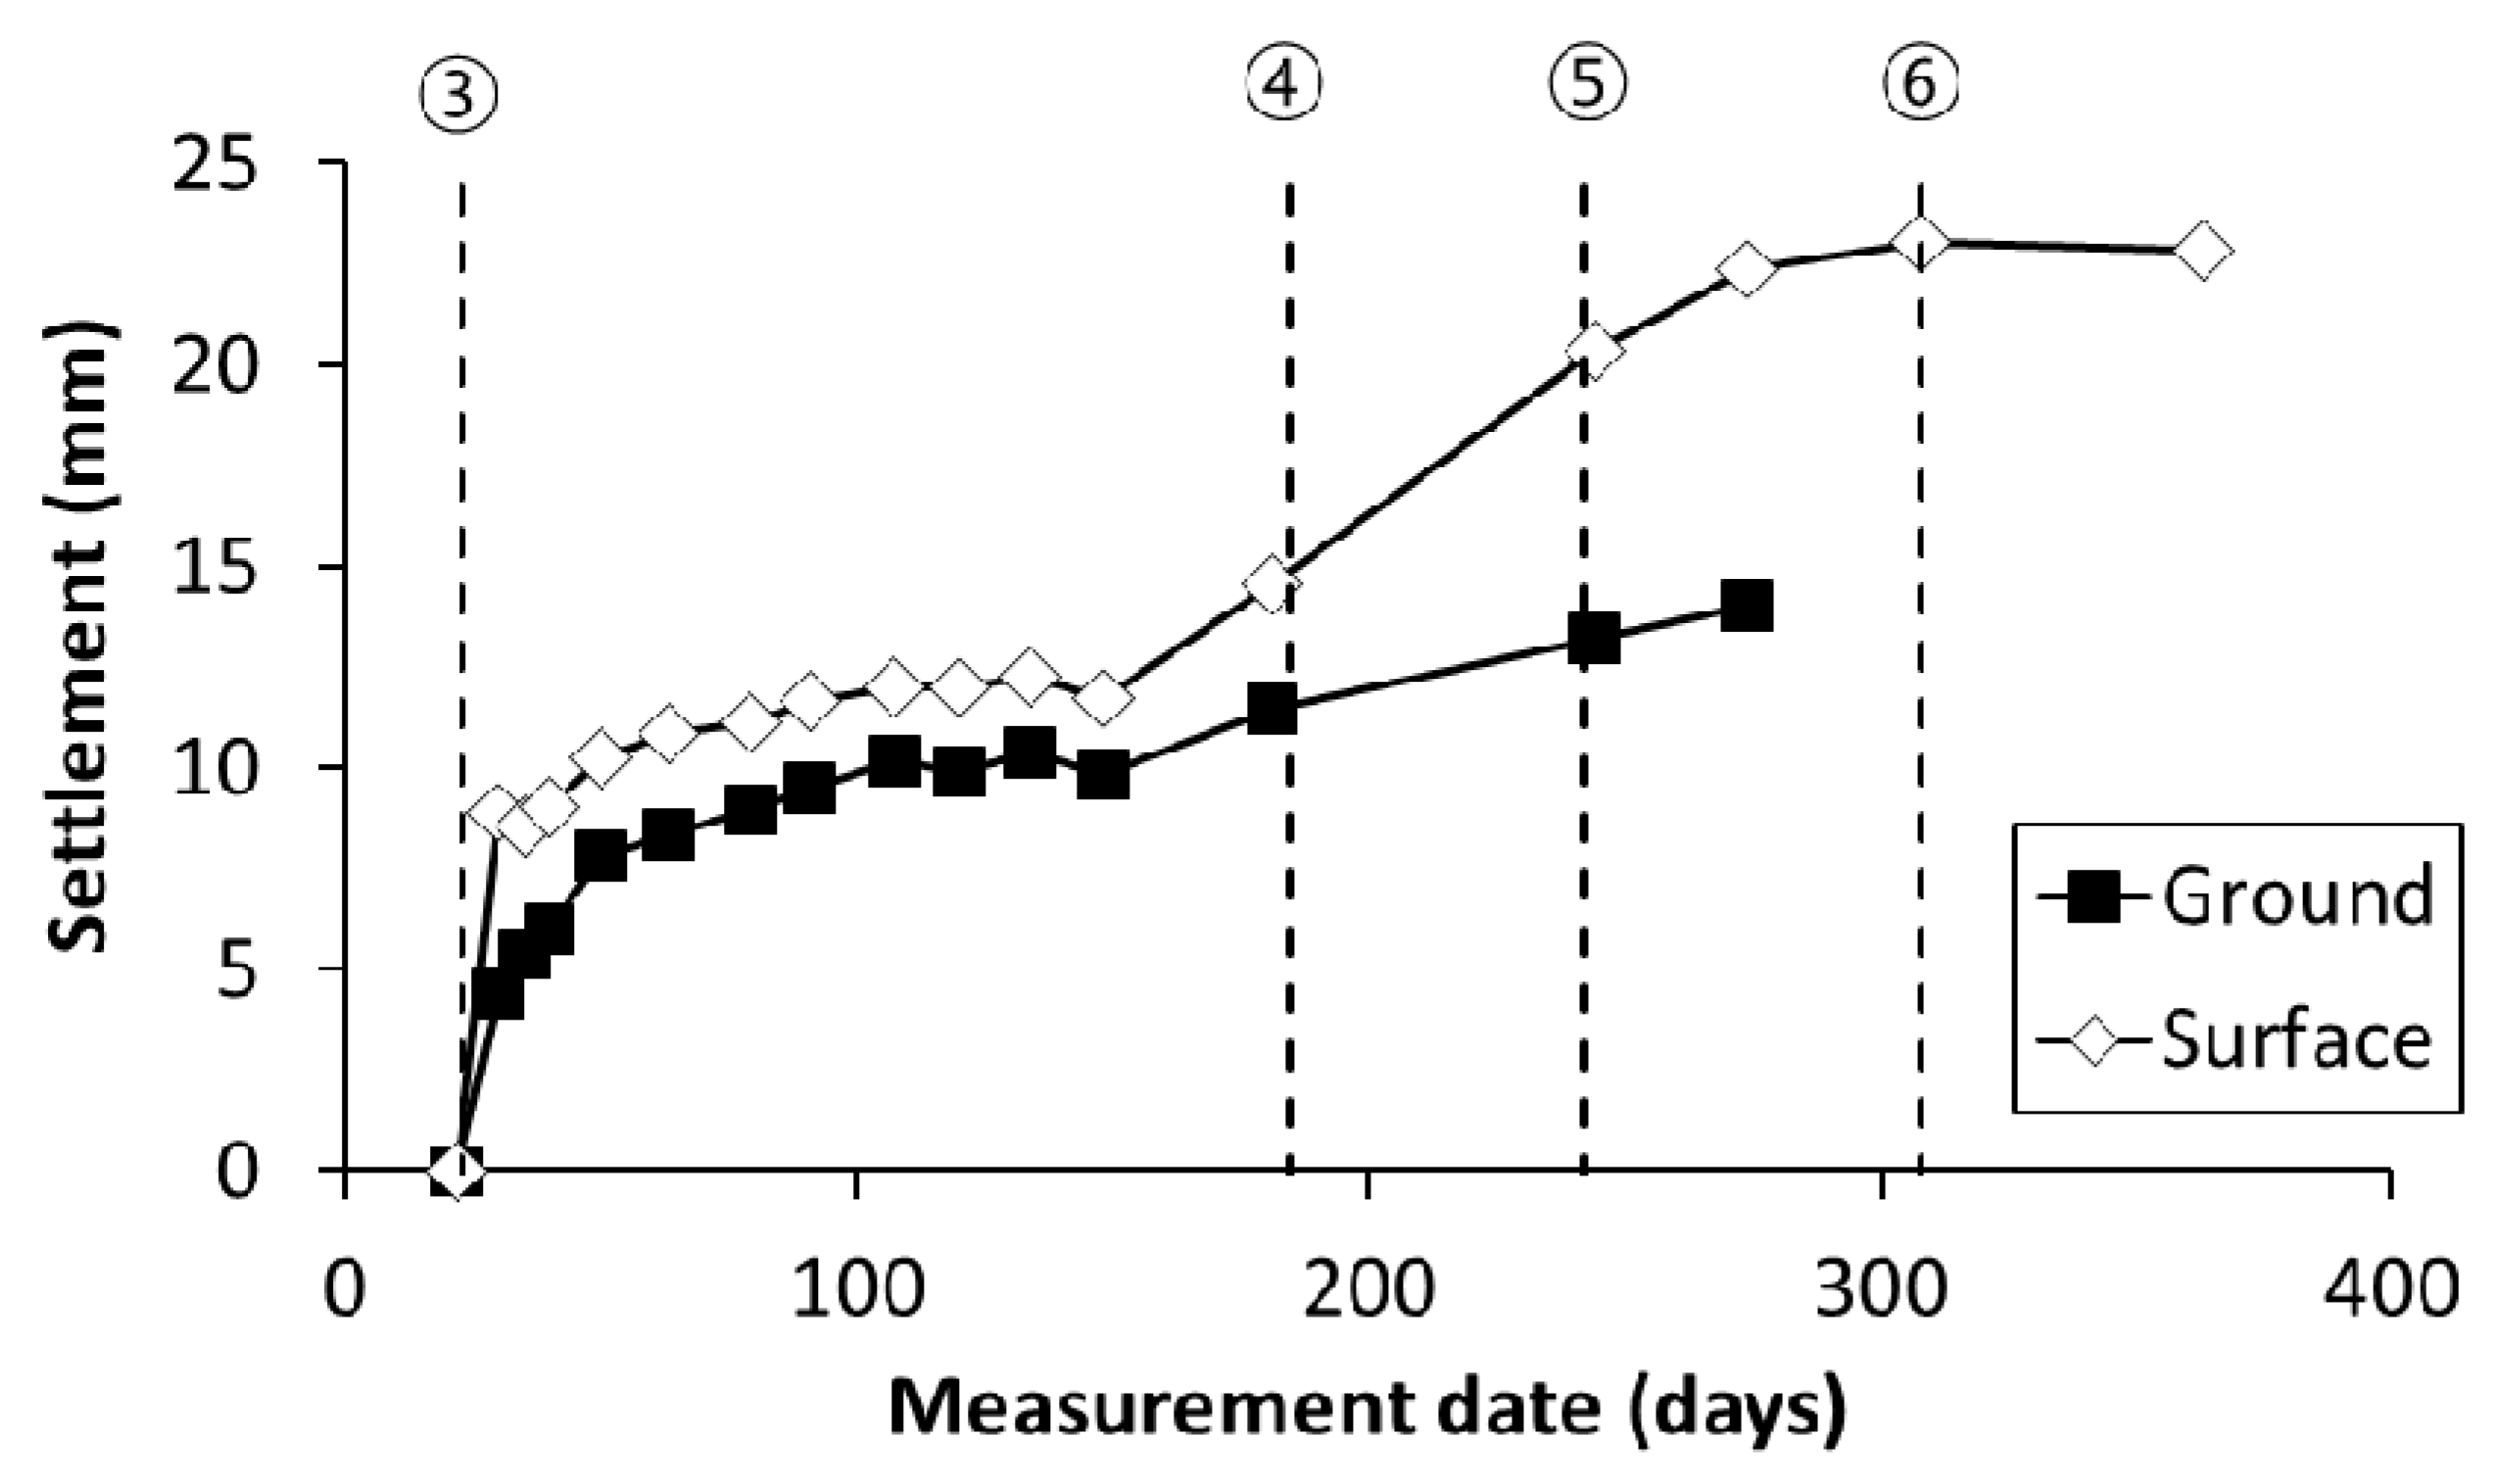
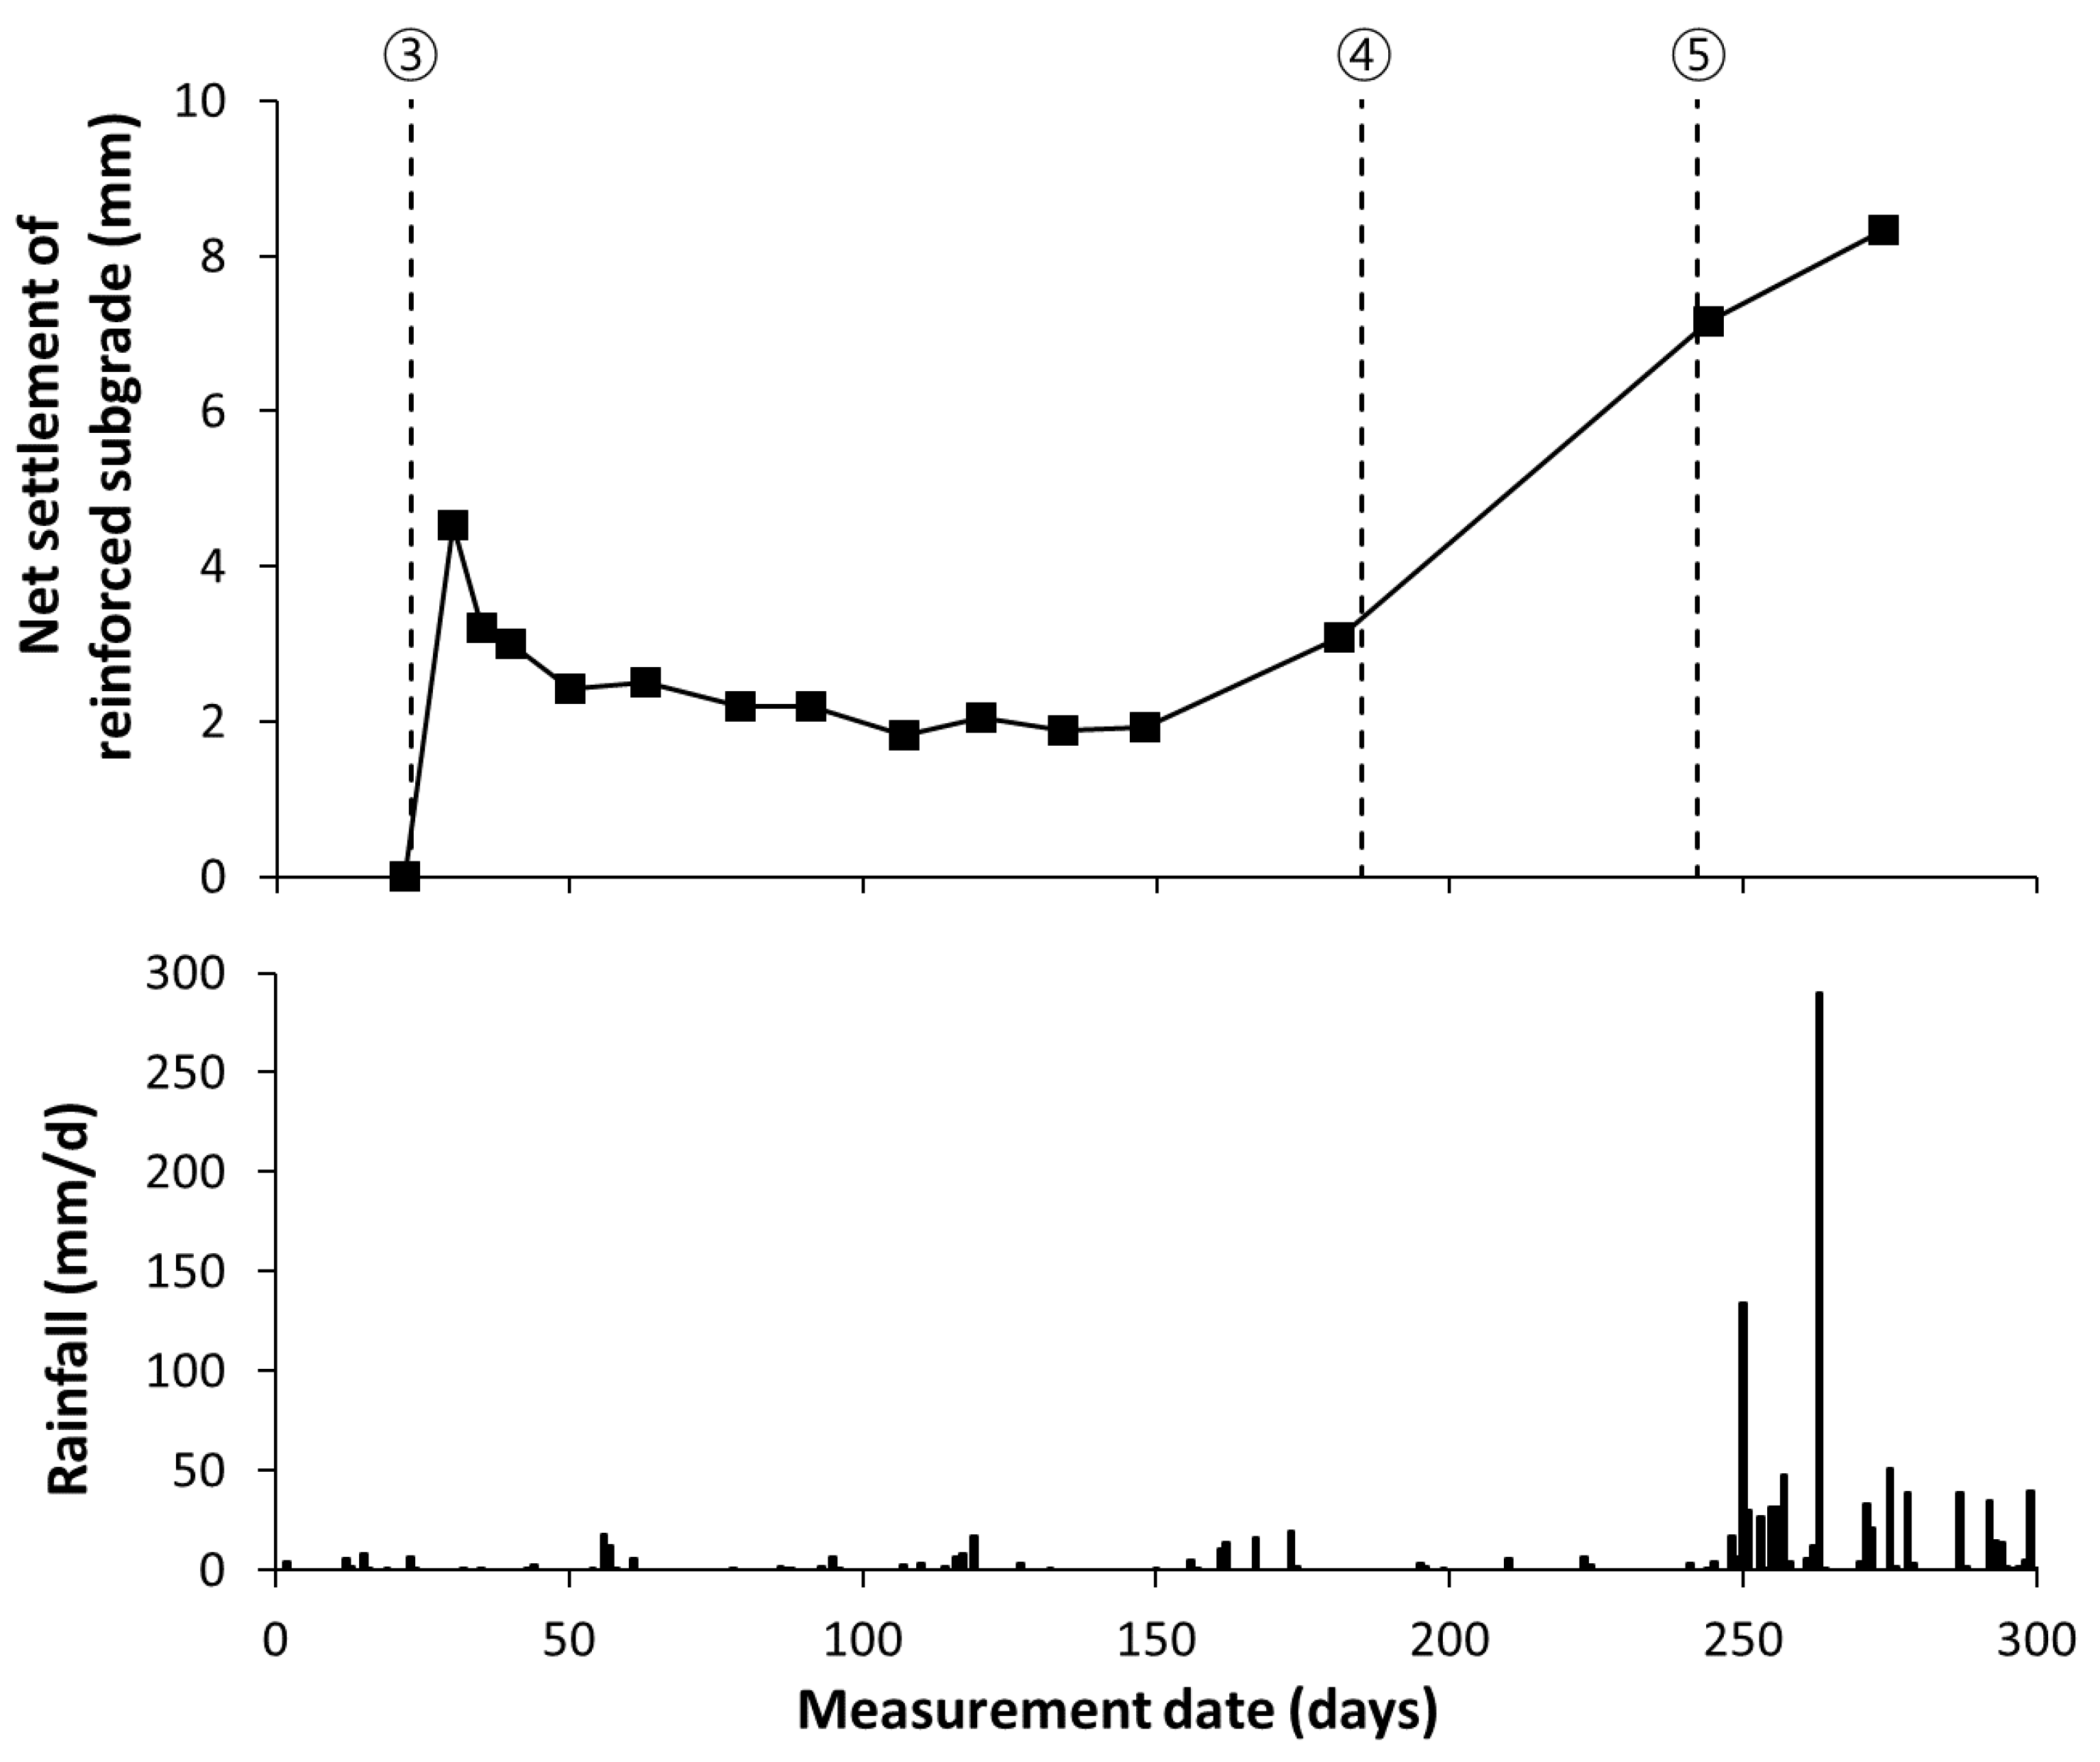
4.1. Settlement

The settlements of the ground and surface of the embankment over time after the construction of the reinforced backfill are plotted in Figure 7, and the circled numbers indicate the work schedules stated in Table 3. Settlement measurements were performed for 341 days and for 252 days for the ground and surface, respectively, after the reinforced backfill was completed. The surface settlement changes considerably immediately after the completion of the reinforced backfill construction and converges over time. In particular, the maximum surface settlement is 23.1 mm less than the allowable residual settlement stated in the Korean Railway Design Standard for roadbed construction (30 mm).
The difference in settlements of the ground and surface of the backfill was considered as the net settlement of the backfill. The variation of net embankment settlement and rainfall over time is plotted in Figure 8. Immediately after the completion of the reinforced backfill construction, a compression settlement of 4.5 mm occurred and exhibited a stable condition (1.82–3.09 mm) prior to the wall’s construction. The rate of total net settlement of the reinforced backfill was 0.12%. Moreover, additional settlements of 4.06 mm and 1.19 mm occurred owing to the construction of the rigid facing wall and heavy rainfall, respectively. Because the reinforced backfill supports the wall in the RSR structure, additional settlement occurs under the weight of the wall. During heavy rainfall, additional settlement occurred as the soil particles were relocated by the water penetrating through the reinforced backfill [26,27]. Considering the reinforced backfill height of 6.8 m, the rates of each additional settlement were 0.06% and 0.02%, respectively. The low compressibility of the RSR when using cement-treated gravel as a backfill was confirmed.

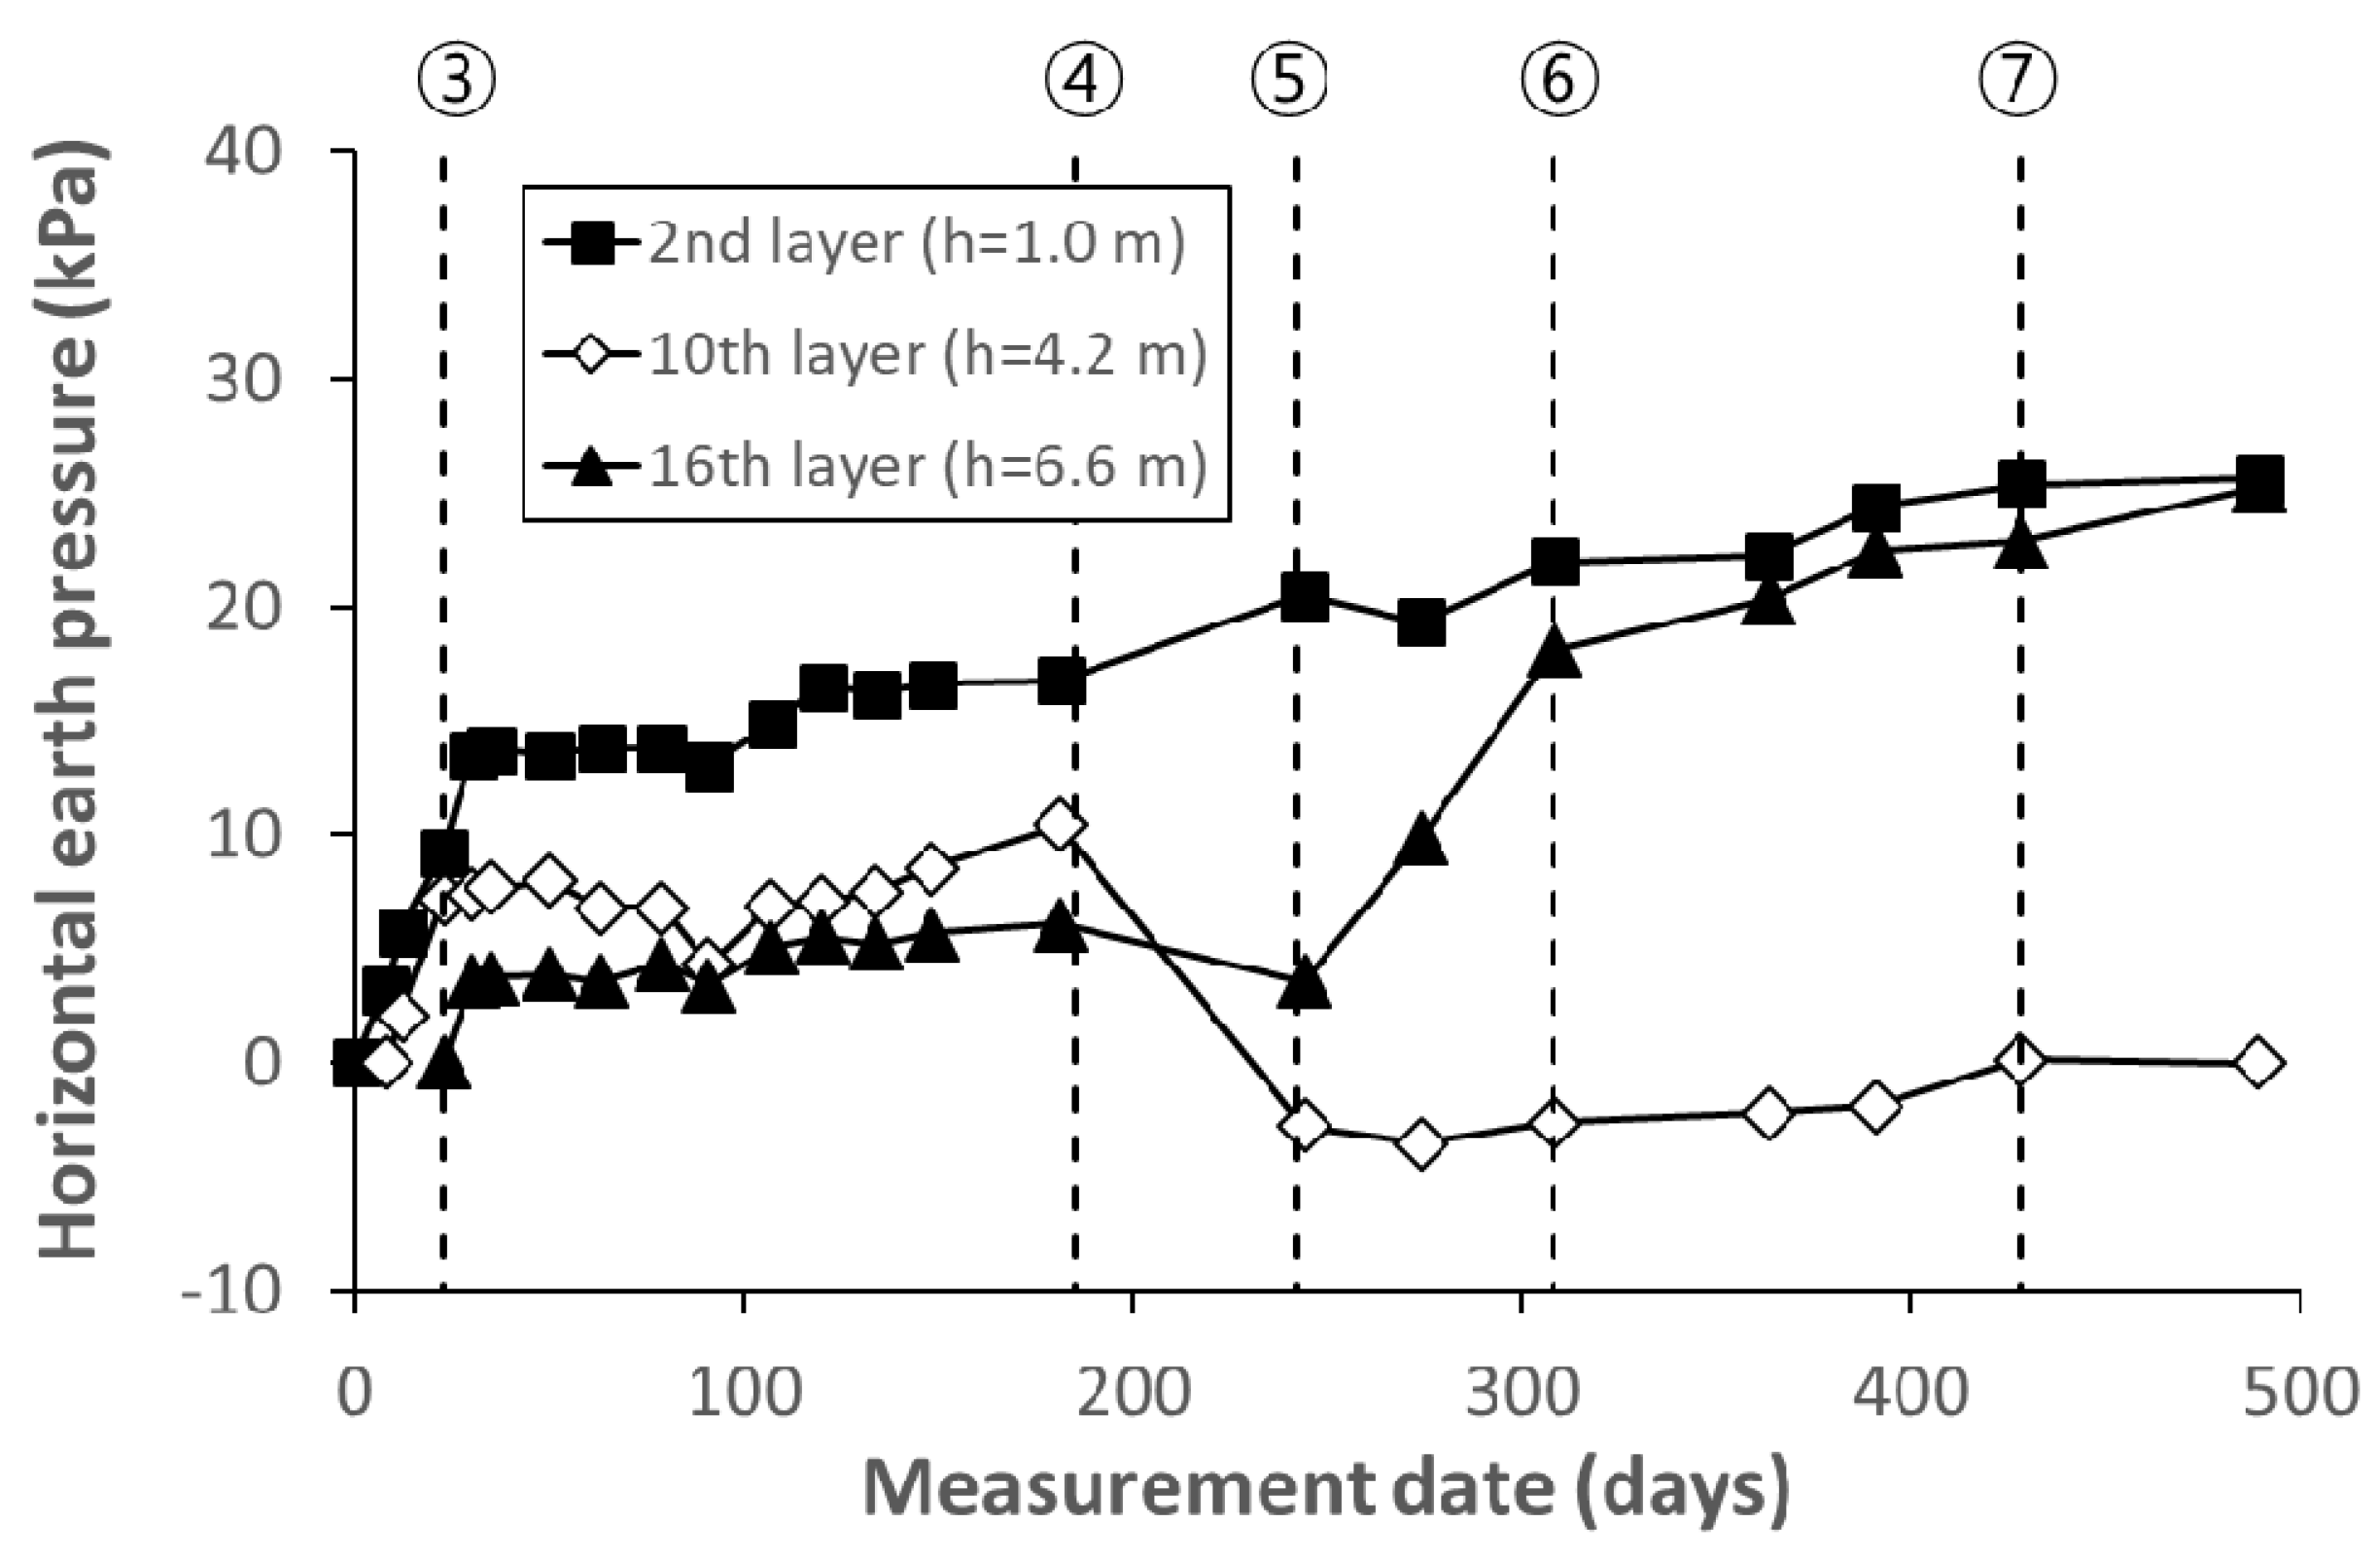
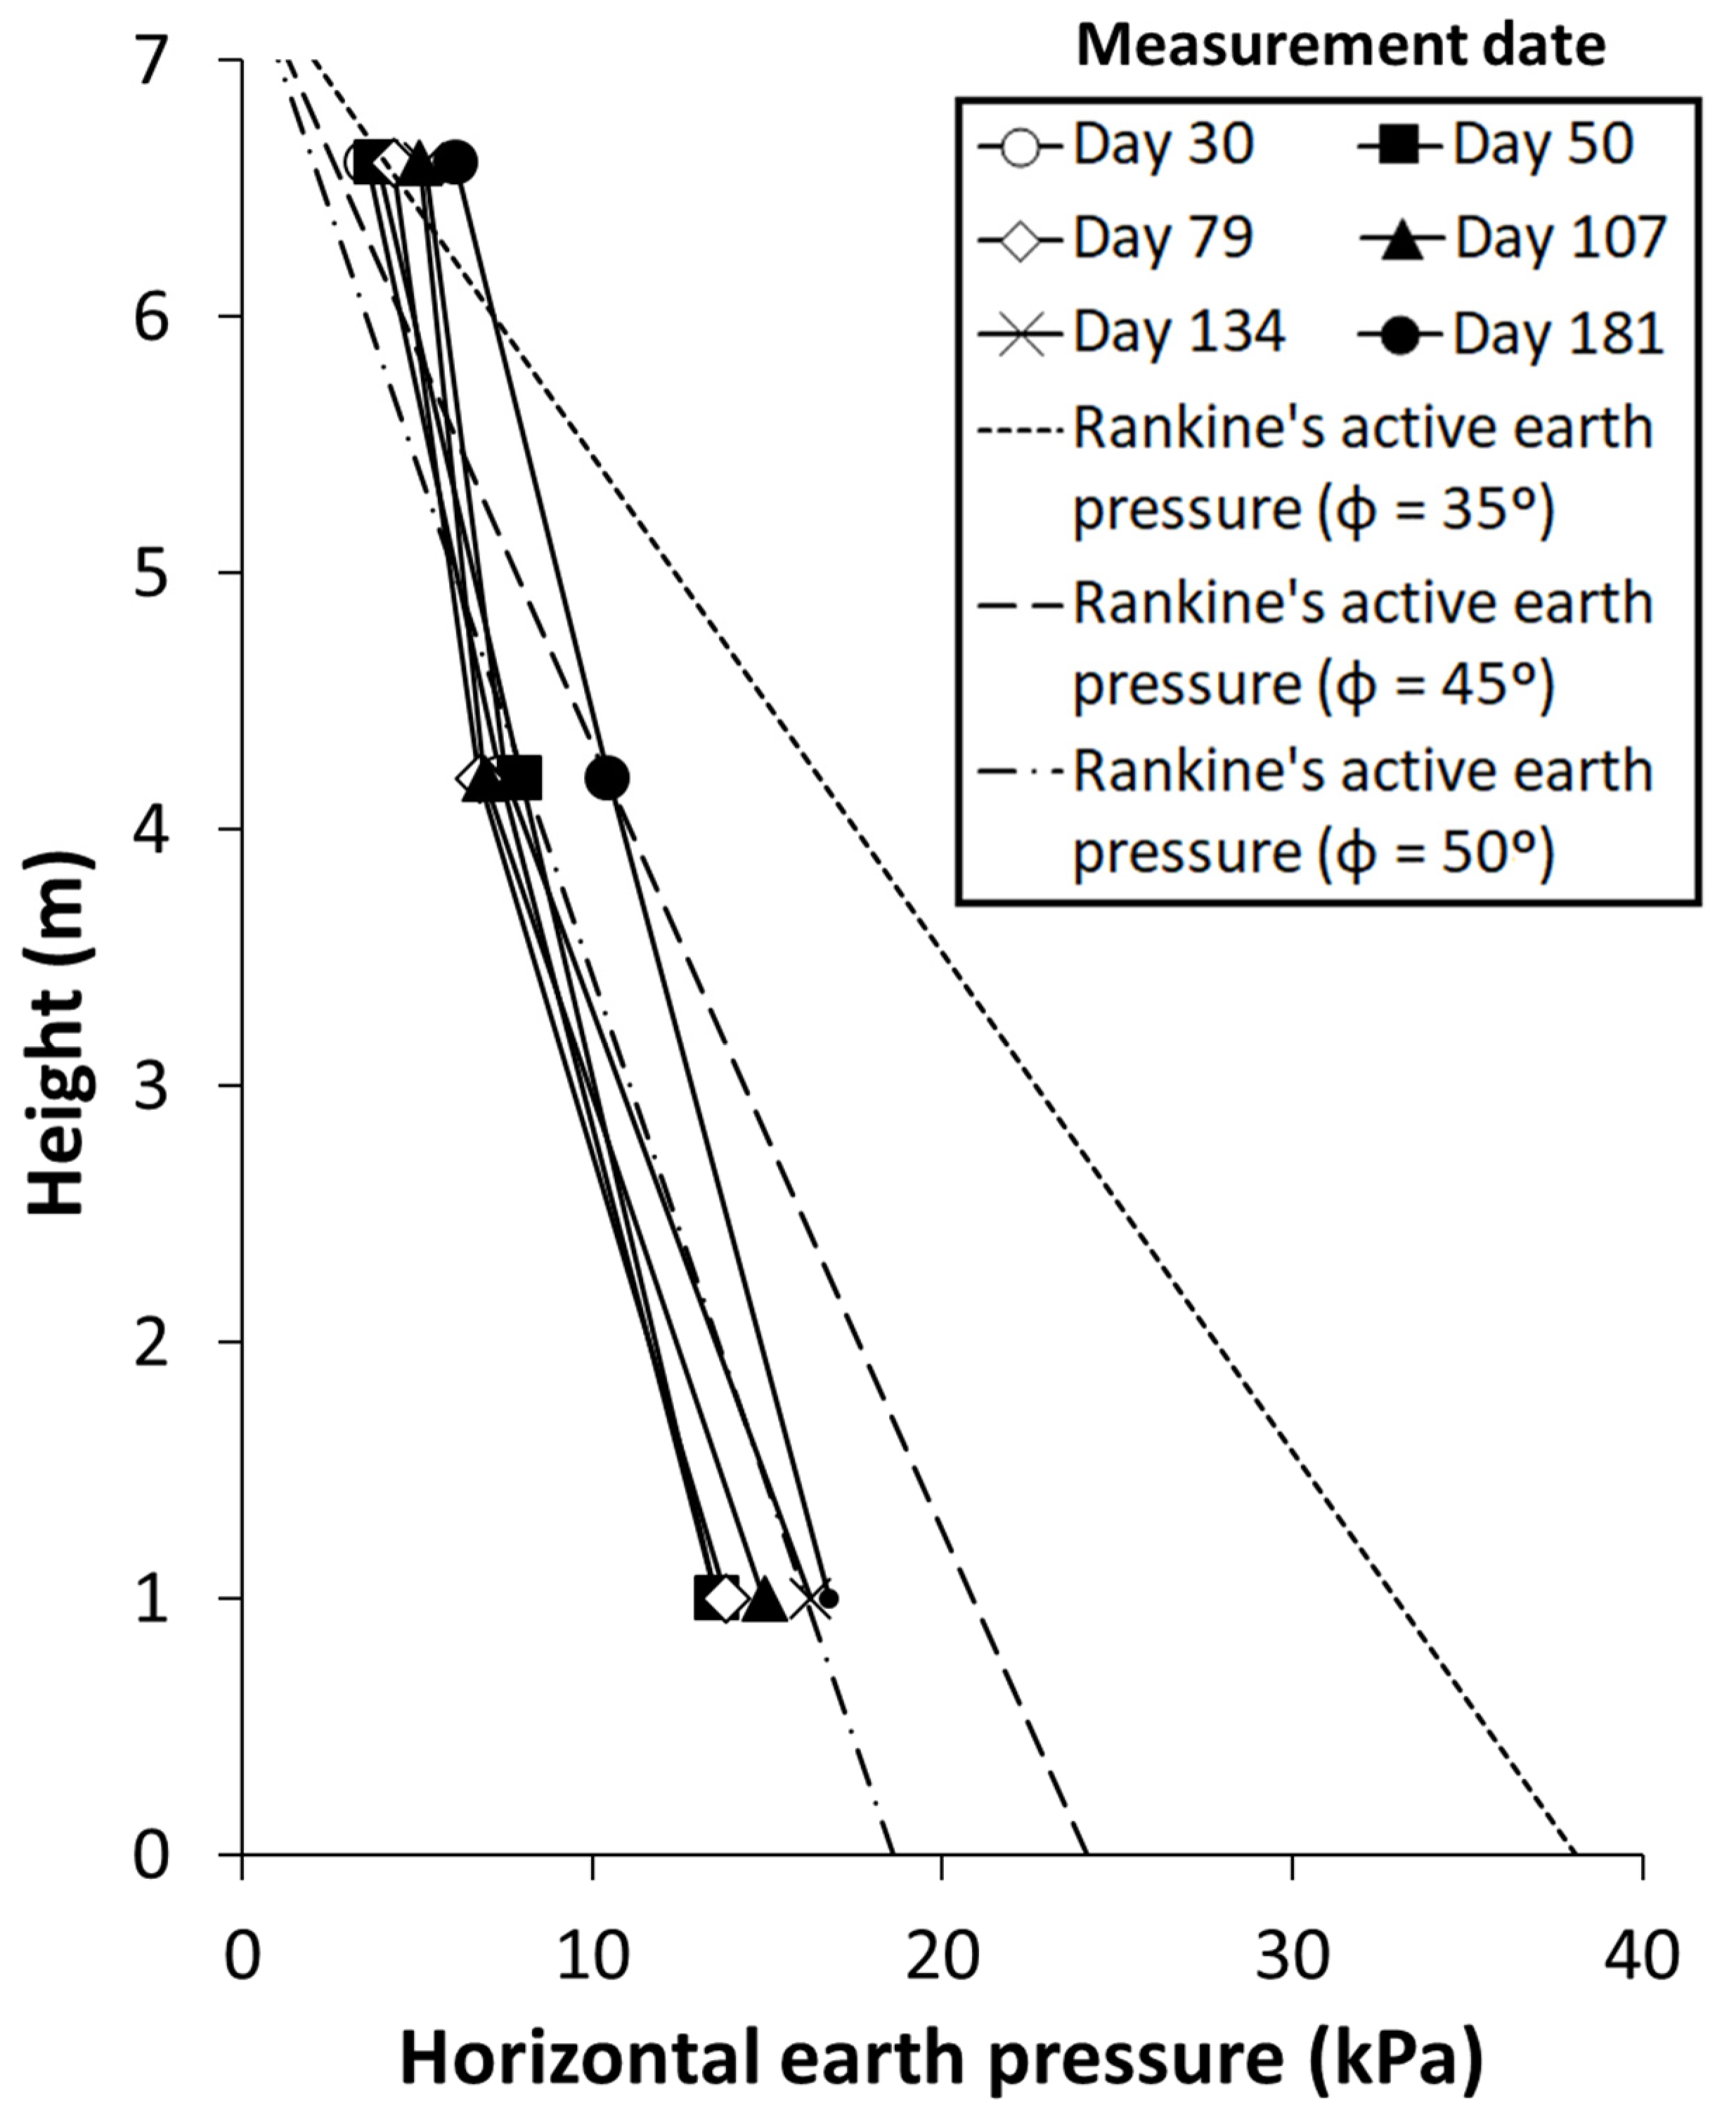
4.2. Horizontal Earth Pressure
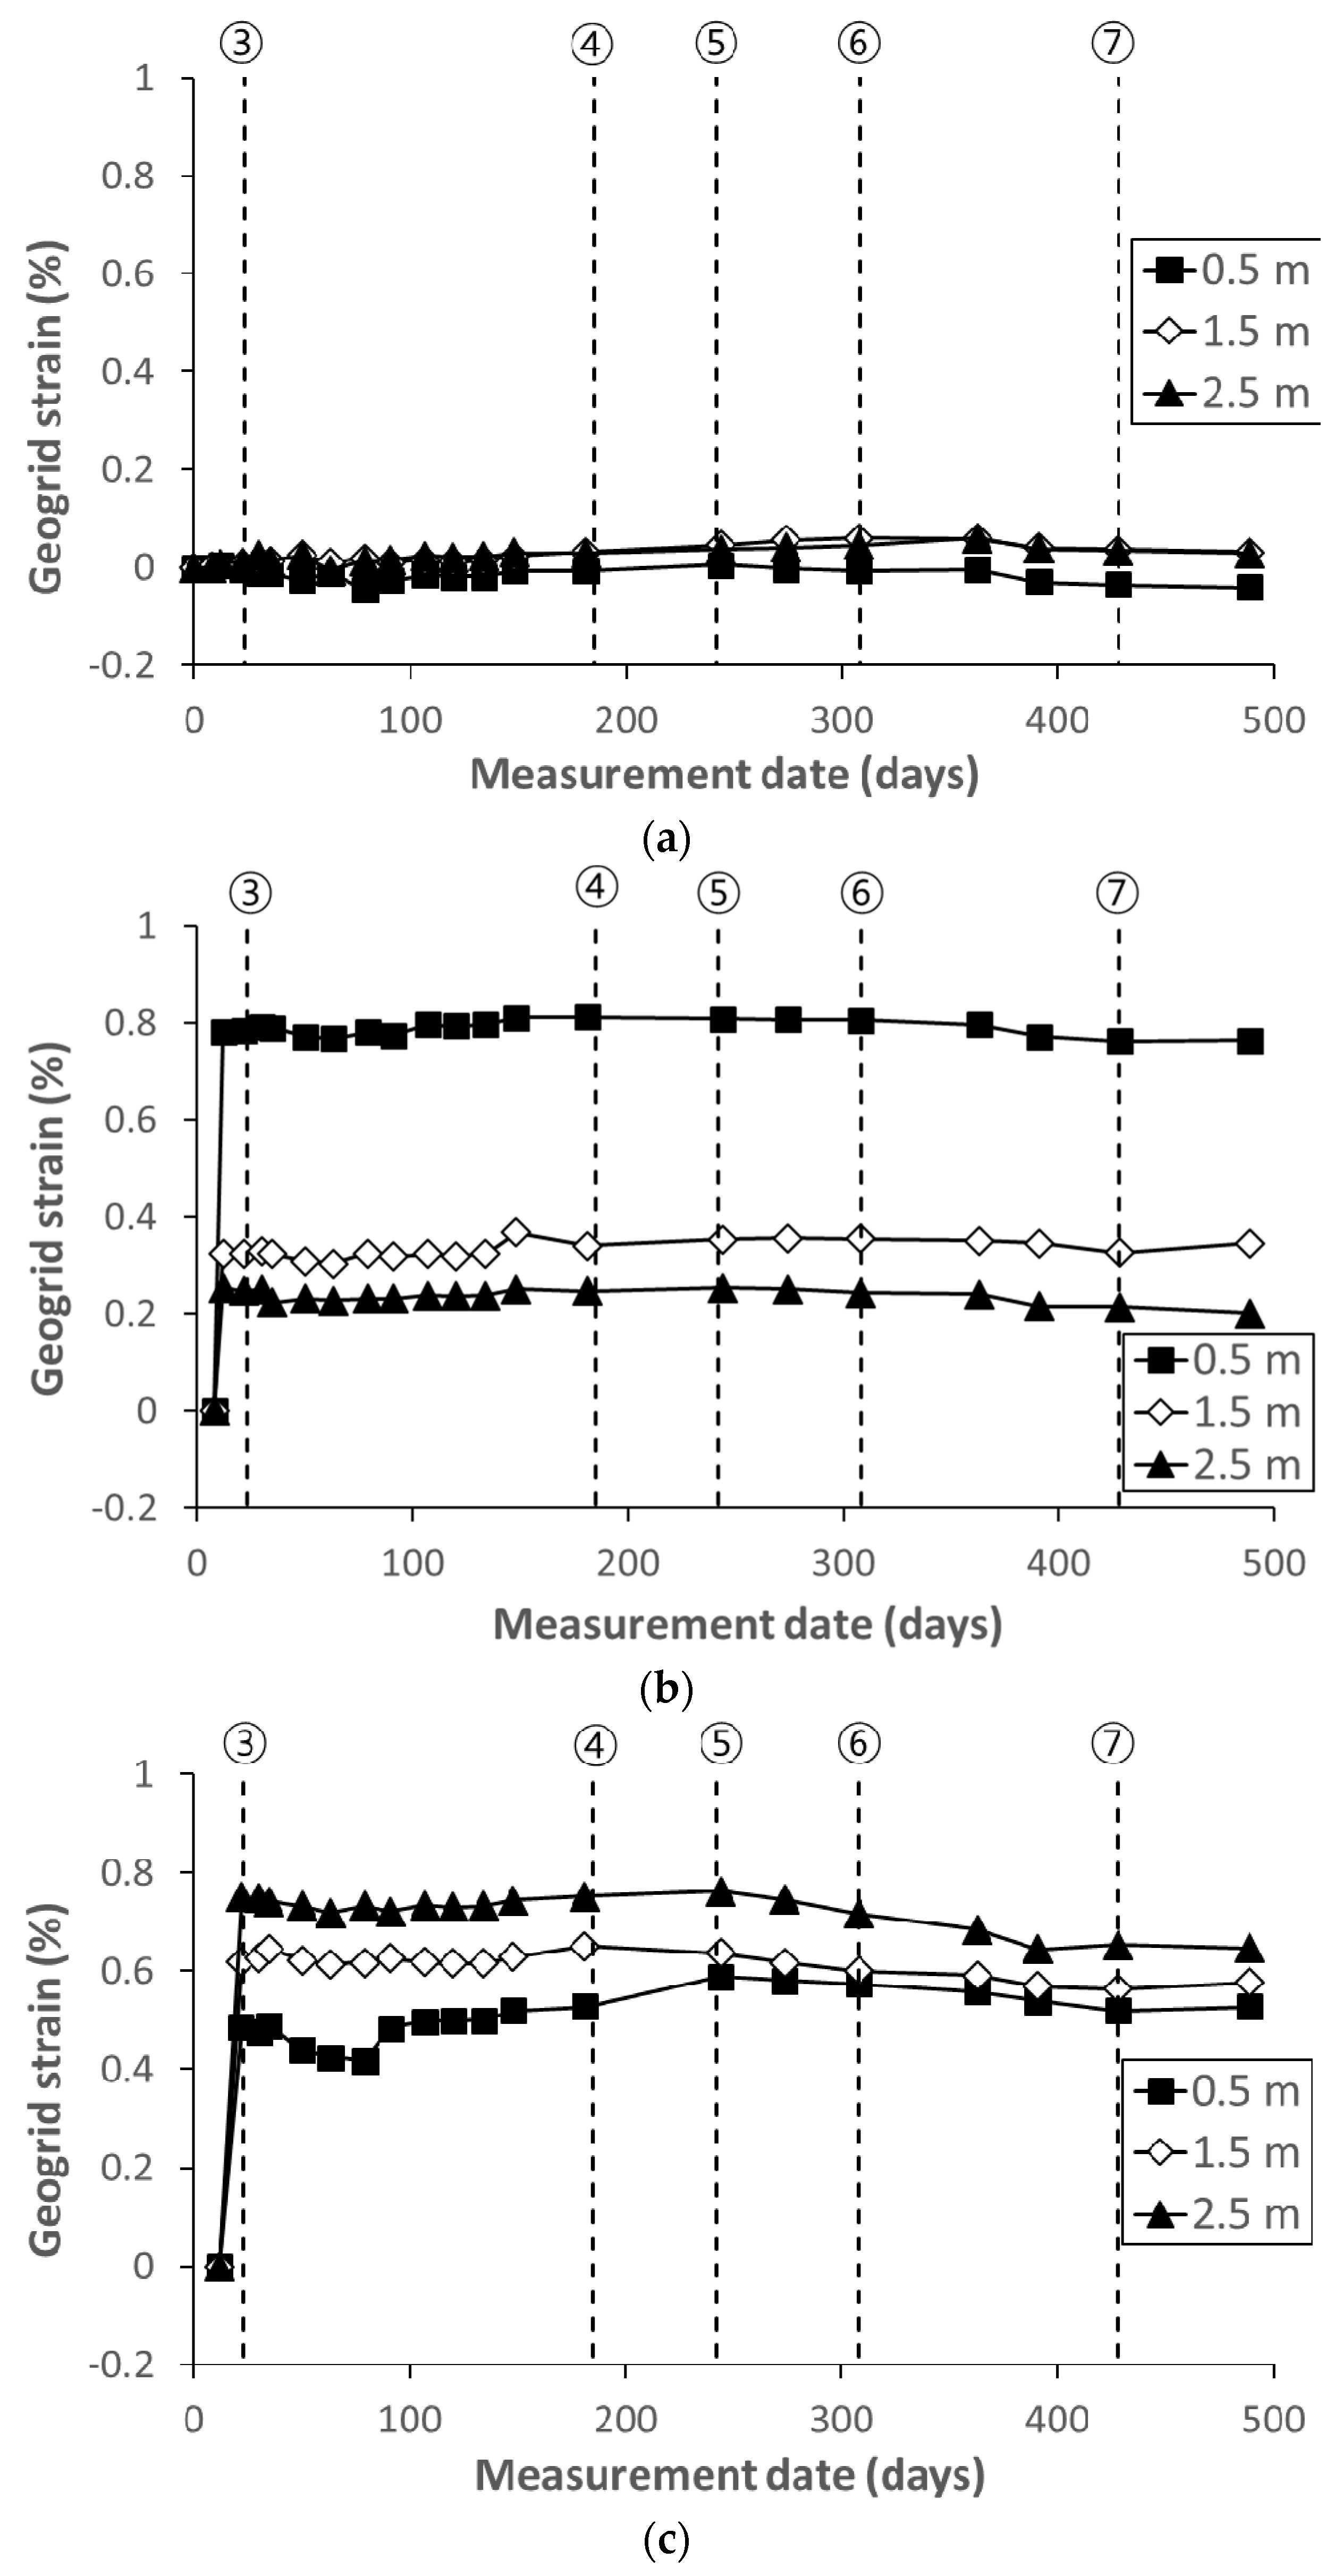
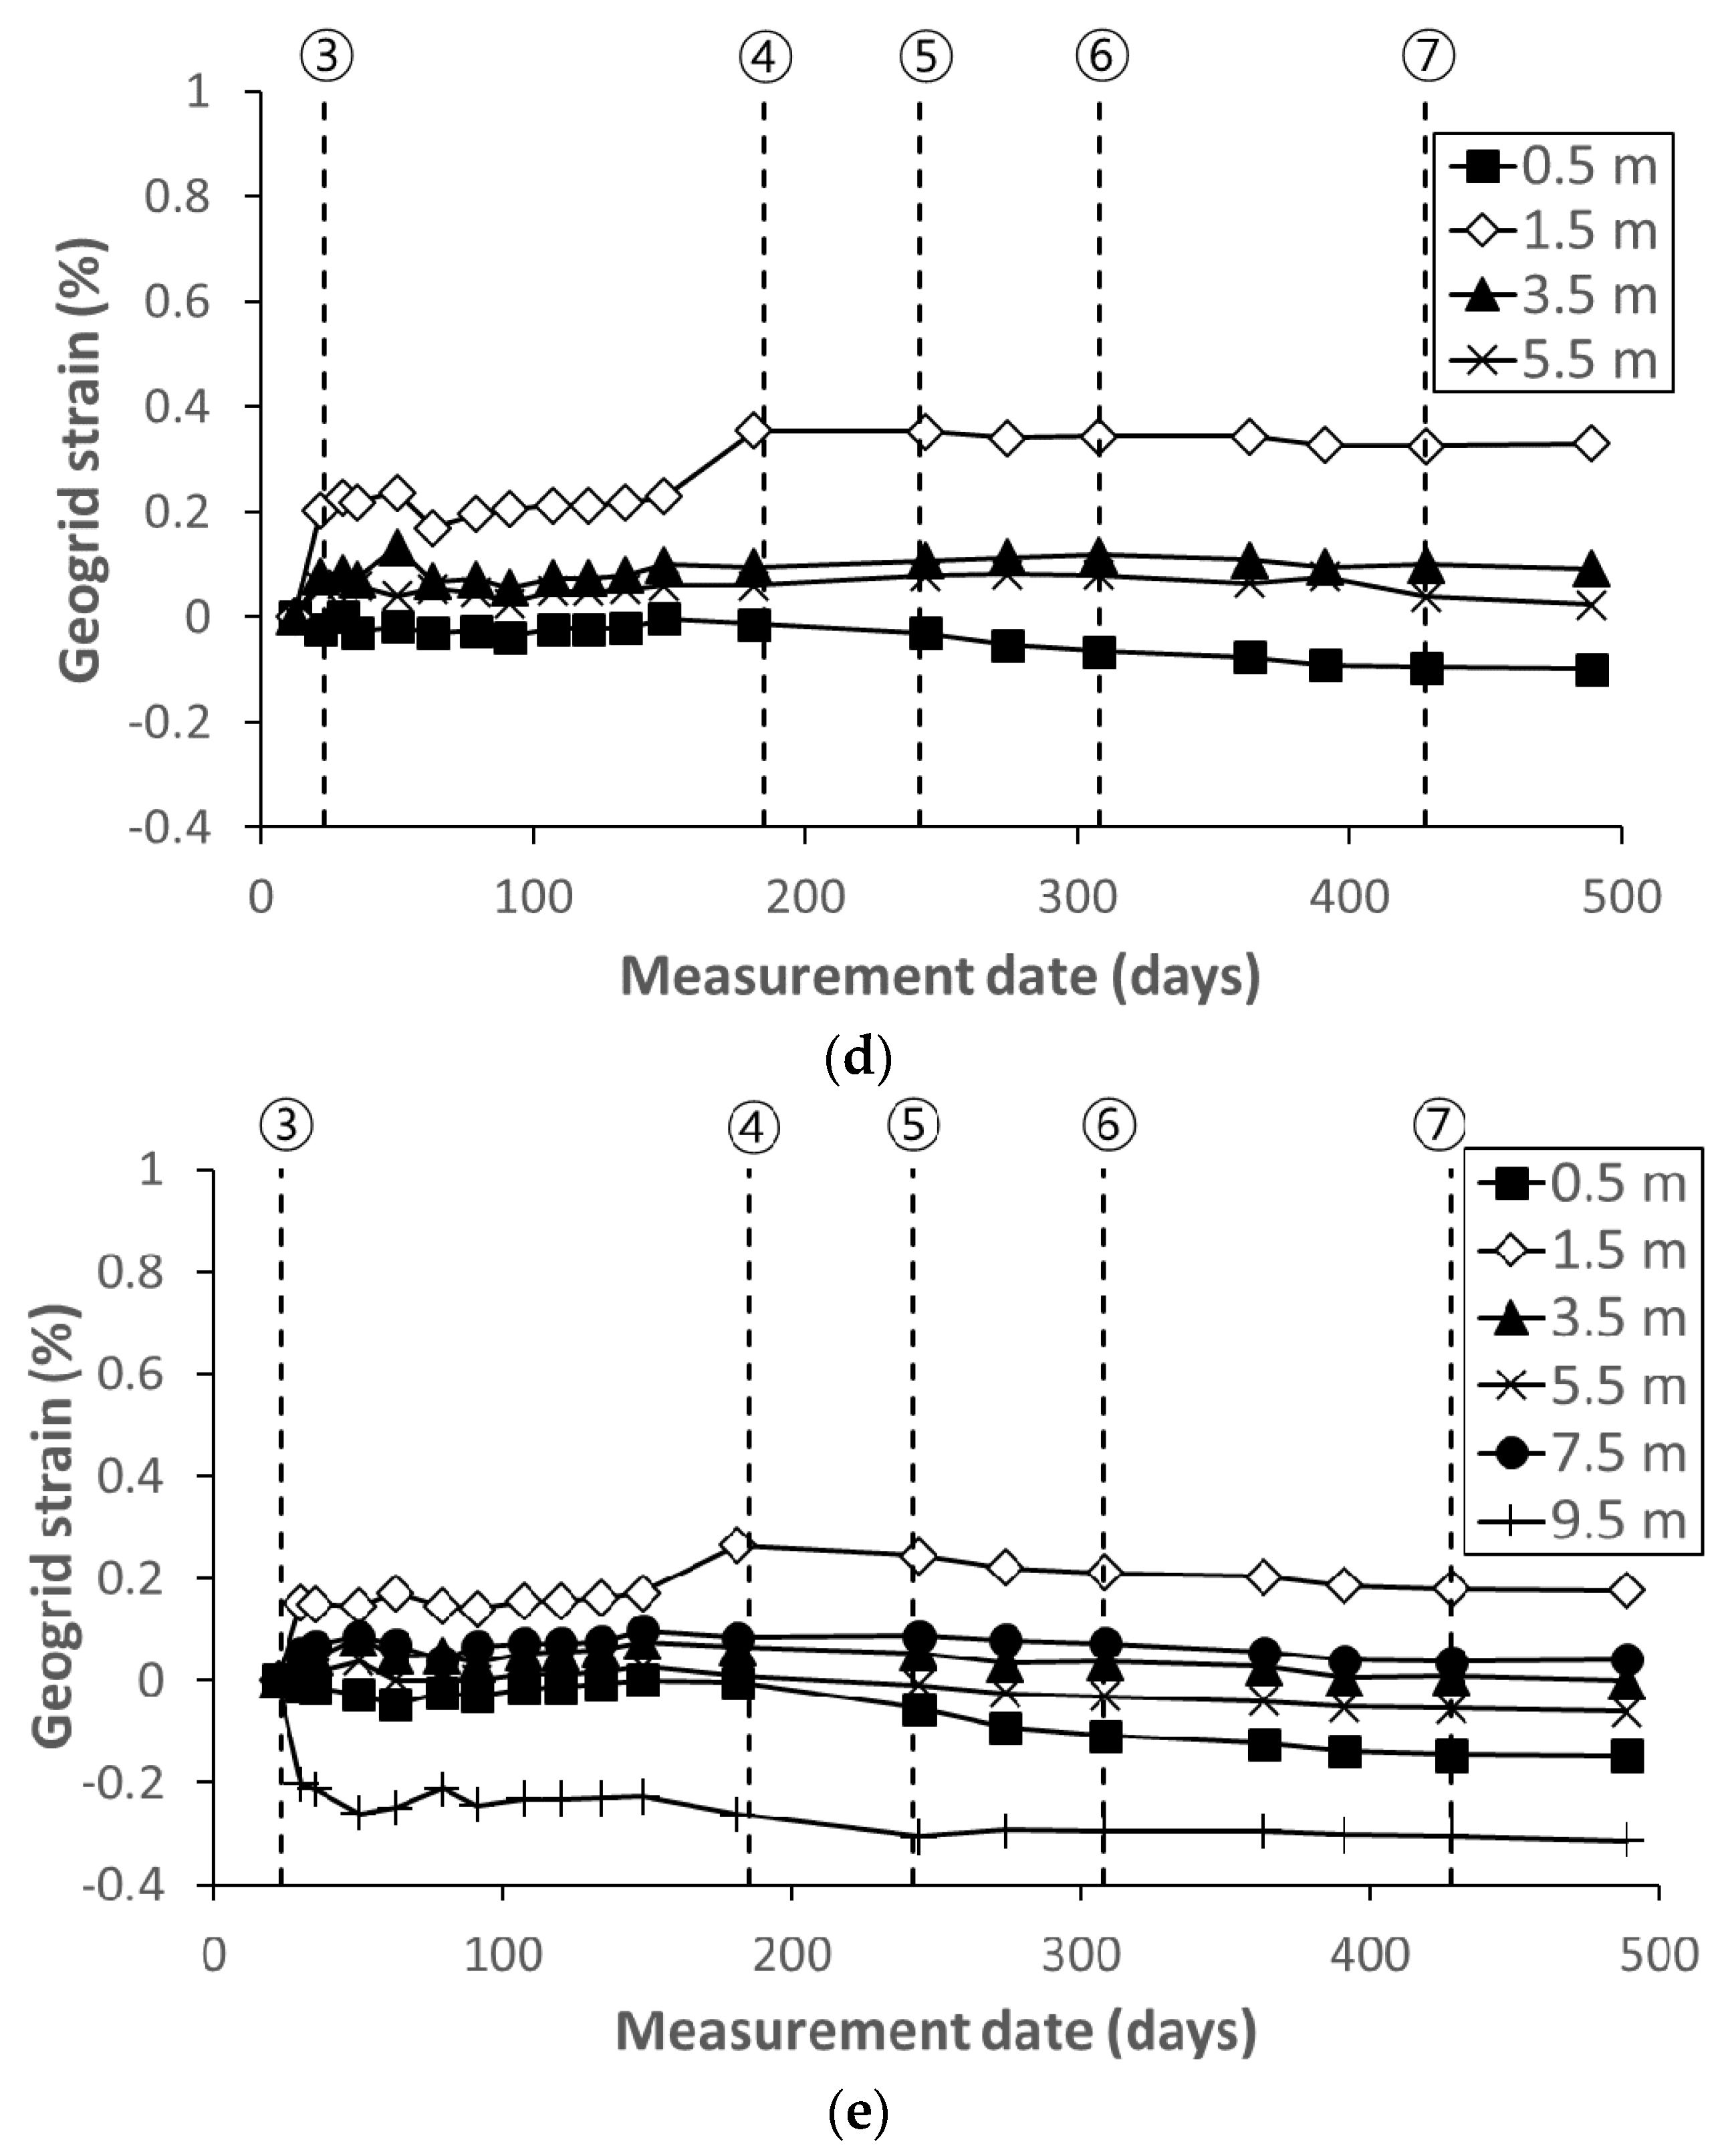
The variation in the horizontal earth pressure as a function of the height over time is represented in Figure 9. During the construction of the reinforced backfill, the pressure increases with the weight of the soil, which is the largest at the second layer. Even after the completion of the reinforced backfill, the horizontal earth pressure increases moderately without any increase in the overburden load. The increase in earth pressure generated during the backfill stabilization process was similar to that of the RSR using sand soil as a backfill [23]; however, this value was considerably smaller for the backfill using cement-treated gravel.
Upon the completion of the rigid facing wall, the horizontal earth pressure tends to increase at the 2nd layer, whereas the horizontal earth pressure tends to decrease at the 10th and 16th layers. Notably, the RSR supports the concrete pouring pressure by connecting the net of welded rebars to the formwork. Considering this fact, the decrease in the horizontal earth pressure presumably occurred because the concrete pouring pressure applied to the net of welded rebars resulted in the horizontal displacement of the reinforced backfill.
The horizontal earth pressure at the 16th layer increased immediately after the completion of the rigid facing wall. Presumably, these effects, owing to rainfall and the overburden pressure exerted by the reinforced roadbed and track on the 16th layer, were prominent because of this layer’s proximity to the surface. In the interim between the construction of the rigid facing wall and the reinforced roadbed, the horizontal earth pressure increases to 5.1 kPa in the 2nd layer, 2.8 kPa in the 10th layer, and 21.7 kPa in the 16th layer, which was 4.2–7.8 times larger than the pressures of other layers.
For the period between the completion of the reinforced backfill and the initiation of the rigid face wall, the variation in the distribution of the horizontal earth pressure with respect to the height is plotted in Figure 10. The horizontal earth pressure in the second layer (1.0 m) increases from 41% to 54% of the Rankine’s active earth pressure considering the friction angle of 35° used in an existing design. Moreover, it increases from 45% to 63% and from 87% to 148% of the Rankine’s active earth pressure in the 10th layer (4.2 m) and 16th layer (6.6 m), respectively. Except for the 16th layer, which is heavily influenced by the external environment, such as construction works, the horizontal earth pressure in all layers is similar to that of granular soil with a friction angle of 45–50°. This entails an increase in the shear strength of the backfill in the RSR using cement-treated gravel. Notably, the higher the shear strength, the higher the stiffness encountered in the soil will be [28,29], and, accordingly, the low compressibility of the RSR can be confirmed indirectly.

4.3. Geogrid Strain

The variation in the geogrid strain measured at the layers over time is illustrated in Figure 11. The maximum increase in the geogrid strain of 0.811% during and after construction was measured at the fifth layer. This value is equivalent to 16% of the geogrids’ design tensile strain (5%). In addition, the maximum geogrid strain of 0.784% was measured at the fifth layer (2.2 m) during the construction of the reinforced backfill.
Except for the second layer, the maximum strain increases were measured for all layers during the construction of the reinforced backfill. The results demonstrate that the increase in the overburden load with the backfill height significantly influences the deformation of the geogrids. Considering the limited soil deformations in the second layer owing to the confining effects of the foundation, the geogrid deformation at the second layer was assumed to be minimal. Following the completion of the backfill construction process, the deformation of the geogrid resulting from the wall load increment, reinforced roadbed, and track construction is approximately negligible.

5. Conclusions

In this study, the RSRs performance at the abutment transition zone of the railway was evaluated. Notably, this subgrade was reinforced with cement-treated gravel and a geogrid. The conclusions from the analysis results of the long-term measurement of settlement and horizontal earth pressure are as follows:
(1)
During the stabilization period, the net settlement of the reinforced backfill converged at the early stage of subgrade construction, and the subsequent increase in settlement was dominated by that occurring in the ground. The rate of total net settlement of the reinforced backfill was 0.12%. In the RSR, because the reinforced backfill supported the rigid facing wall, additional settlement occurred as a result of the wall load and rearrangement of soil particles owing to rainfall. The additional settlement caused by the wall load and rainfall was 0.06% and 0.02%, respectively. The results confirm the low compressibility of the RSR reinforced with cement-treated gravel and geogrid.
(2)
The horizontal earth pressure was reduced to a level of 54–63% of Rankine’s active earth pressure. In view of the decrease in active earth pressure, the shear strength of the cement-treated gravel was considered similar to that of granular soil with a friction angle of 45–50° for practical designs. In particular, the higher the shear strength, the higher the stiffness encountered in the soil would be; thus, the low compressibility of the RSR could be confirmed indirectly.
(3)
The measured maximum geogrid strain was equivalent to 0.784%, which indicated the stability of the RSR in the event of pullout and rupture of the geogrid. Upon the completion of the backfill, the geogrid deformation resulting from the increase in the overburden load was approximately negligible.

Author Contributions

Conceptualization and methodology, D.S.K.; validation, D.S.K. and S.J.; investigation, S.P. and U.K.; resources, S.P. and U.K.; data curation, S.P., D.S.K. and U.K.; writing—original draft preparation, S.P. and U.K.; writing—review and editing, D.S.K. and S.J.; supervision, D.S.K.; project administration and funding acquisition, D.S.K. All authors have read and agreed to the published version of the manuscript.

Funding

This research was supported by a grant from the R&D Program (Development of long-life technology for ballasted tracks using EPDM rubber pad, PK2204B1I) of the Korea Railroad Research Institute.

Conflicts of Interest

The authors declare no conflict of interest.

References

  1. Li, D.; Davis, D. Transition of railroad bridge approaches. J. Geotech. Geoenvironmental Eng. 2005, 131, 1392–1398. [Google Scholar] [CrossRef]
  2. Jing, G.; Siahkouhi, M.; Wang, H.; Esmaeili, M. The improvement of the dynamic behavior of railway bridge transition zone using furnace slag reinforcement: A numerical and experimental study. Proc. Inst. Mech. Eng. Part F J. Rail Rapid Transit 2022, 236, 362–374. [Google Scholar] [CrossRef]
  3. Jamnongpipatkul, P.; Dechasakulsom, M.; Sukolrat, J. Application of air foam stabilized soil for bridge-embankment transition zone in Thailand. In Proceedings of the Asphalt Material Characterization, Accelerated Testing, and Highway Management: Selected Papers from the 2009 GeoHunan International Conference, Changsha, China, 3–6 August 2009; pp. 181–193. [Google Scholar] [CrossRef]
  4. Zhang, J.P.; Liu, T.; Pei, J.Z.; Li, R.; Zou, D.G.; Zhang, Y.Q. Settlement characteristics of bridge approach embankment based on scale model test. J. Cent. South Univ. 2020, 27, 1956–1964. [Google Scholar] [CrossRef]
  5. Liu, K.; Su, Q.; Ni, P.; Zhou, C.; Zhao, W.; Yue, F. Evaluation on the dynamic performance of bridge approach backfilled with fibre reinforced lightweight concrete under high-speed train loading. Comput. Geotech. 2018, 104, 42–53. [Google Scholar] [CrossRef]
  6. Xiao, C.; Gao, S.; Liu, H.; Du, Y. Case history on failure of geosynthetics-reinforced soil bridge approach retaining walls. Geotext. Geomembr. 2021, 49, 1585–1599. [Google Scholar] [CrossRef]
  7. Hu, P.; Zhang, C.; Wen, S.; Wang, Y. Dynamic responses of high-speed railway transition zone with various subgrade fillings. Comput. Geotech. 2019, 108, 17–26. [Google Scholar] [CrossRef]
  8. Xiao, D.; Jiang, G.L.; Liao, D.; Hu, Y.F.; Liu, X.F. Influence of cement-fly ash-gravel pile-supported approach embankment on abutment piles in soft ground. J. Rock Mech. Geotech. Eng. 2018, 10, 977–985. [Google Scholar] [CrossRef]
  9. Tatsuoka, F.; Tateyama, M.; Aoki, H.; Watanabe, K. Bridge abutment made of cement-mixed gravel back-fill. In Elsevier Geo-Engineering Book Series; Elsevier: Amsterdam, The Netherlands, 2005; pp. 829–873. [Google Scholar] [CrossRef]
  10. Kongsukprasert, L.; Tatsuoka, F.; Takahashi, H. Effects of curing period and stress conditions on the strength and deformation characteristics of cement-mixed soil. Soils Found. 2007, 47, 577–596. [Google Scholar] [CrossRef] [Green Version]
  11. Watanabe, K.; Tateyama, M.; Yonezawa, T.; Aoki, H. Strength characteristics and construction management of cement-mixed gravel. In Proceedings of the 16th International Conference on Soil Mechanics and Geotechnical Engineering, Osaka, Japan, 12–16 September 2005; IOS Press: Amsterdam, The Netherlands, 2005; pp. 619–622. [Google Scholar] [CrossRef]
  12. Hoppe, E.J. Guidelines for the Use, Design, and Construction of Bridge Approach Slabs; Virginia Transportation Research Council: Charlottesville, VA, USA, 1999. [Google Scholar]
  13. Roy, S.; Thiagarajan, G. Nonlinear finite-element analysis of reinforced concrete bridge approach slab. J. Bridge Eng. 2007, 12, 801–806. [Google Scholar] [CrossRef]
  14. Heydari-Noghabi, H.; Zakeri, J.A.; Esmaeili, M.; Varandas, J.N. Field study using additional rails and an approach slab as a transition zone from slab track to the ballasted track. Proc. Inst. Mech. Eng. Part F J. Rail Rapid Transit 2018, 232, 970–978. [Google Scholar] [CrossRef]
  15. Asghari, K.; Sotoudeh, S.; Zakeri, J.A. Numerical evaluation of approach slab influence on transition zone behavior in high-speed railway track. Transp. Geotech. 2021, 28, 100519. [Google Scholar] [CrossRef]
  16. Watanabe, K.; Tateyama, M.; Yonezawa, T.; Aoki, H.; Tatsuoka, F.; Koseki, J. Shaking table tests on a new type bridge abutment with geogrid-reinforced cement treated backfill. In Proceedings of the 7th International Conference on Geosynthetics Society, Nice, France, 22–27 September 2002; pp. 119–122. [Google Scholar]
  17. Feng, S.; Xu, R.; Yu, J.; Zhang, C.; Cheng, K. Field monitoring of geogrid-reinforced and pile-supported embankment at bridge approach. Int. J. Geosynth. Ground Eng. 2021, 7, 2. [Google Scholar] [CrossRef]
  18. Zheng, Y.; Fox, P.J.; McCartney, J.S. Numerical simulation of deformation and failure behavior of geosynthetic reinforced soil bridge abutments. J. Geotech. Geoenvironmental Eng. 2018, 144, 04018037. [Google Scholar] [CrossRef]
  19. Bizjak, K.F.; Lenart, S. Life cycle assessment of a geosynthetic-reinforced soil bridge system—A case study. Geotext. Geomembr. 2018, 46, 543–558. [Google Scholar] [CrossRef]
  20. Tatsuoka, F.; Tateyama, M.; Uchimura, T.; Koseki, J. Geosynthetic-reinforced soil retaining walls as important permanent structures 1996-1997 mercer lecture. Geosynth. Int. 1997, 4, 81–136. [Google Scholar] [CrossRef]
  21. Tatsuoka, F.; Tateyama, M.; Moltri, Y.; Matsushima, K. Remedial treatment of soil structure using geosynthetic-reinforcing technology. Geotext. Geomembr. 2007, 25, 204–220. [Google Scholar] [CrossRef]
  22. Kim, U.; Kim, D.S. Evaluation of Deformation Characteristic of Railway Subgrade Using Reinforced Rigid Walls with Short Reinforcement under Repetitive and Static Loads. Appl. Sci. 2021, 11, 3615. [Google Scholar] [CrossRef]
  23. Kim, U.J.; Kim, D.S. Load sharing characteristics of rigid facing walls with geogrid reinforced railway subgrade during and after construction. Geotext. Geomembr. 2020, 48, 940–949. [Google Scholar] [CrossRef]
  24. Kim, D.S. Performance Evaluation on Deformation Control of Reinforced Subgrade for Railways under Construction. J. Korean Soc. Hazard Mitig. Korean Soc. Hazard Mitig. 2017, 17, 17–22. [Google Scholar] [CrossRef]
  25. Korea Railway Network Authority. Railway Design Standard for Roadbed; Korea Railway Network Authority: Daejeon, Korea, 2013; ISBN 978-89-91723-95-5. [Google Scholar]
  26. Tanaka, T.; Verruijt, A. Seepage Failure of Sand Behind Sheet Piles—The Mechanism and Practical Approach to Analyze—. Soils Found. 1999, 39, 27–35. [Google Scholar] [CrossRef]
  27. Yin, G.; Zhang, Q.; Wang, W.; Chen, Y.; Geng, W.; Liu, H. Experimental study on the mechanism effect of seepage on microstructure of tailings. Saf. Sci. 2012, 50, 792–796. [Google Scholar] [CrossRef]
  28. Hara, A.; Ohta, T.; Niwa, M.; Tanaka, S.; Banno, T. Shear modulus and shear strength of cohesive soils. Soils Found. 1974, 14, 1–12. [Google Scholar] [CrossRef]
  29. Seng, S.; Tanaka, H. Properties of cement-treated soils during initial curing stages. Soils Found. 2011, 51, 775–784. [Google Scholar] [CrossRef] [Green Version]
Figure 1. Construction of reinforced subgrade for railways (RSR) [23].
Applsci 12 08861 g001
Figure 2. Design of RC retaining wall and RSR: (a) originally designed RC retaining wall; (b) RSR design.
Applsci 12 08861 g002aApplsci 12 08861 g002b
Figure 3. RSR construction process. (1) Installation of cast-in-place concrete pile; (2) bench cut, spreading, and compaction processes of 3% cement-treated gravel; (3) installation of small strip foundation; (4) installation of geogrids and nets of welded rebars; (5) laying of 3% cement-treated gravel; (6) compaction; (7) rolling up the geogrid; (8) repetition of steps (4) to (7) to obtain the 17th layer; (9) stabilization of the embankment; (10) installation of rebars and connectors; (11) installation of forms and placing of concrete for rigid wall; (12) curing and completion of RSR.
Applsci 12 08861 g003
Figure 4. Backfill materials of transition zone.
Applsci 12 08861 g004
Figure 5. Location of installed sensors.
Applsci 12 08861 g005
Figure 6. Installed sensors: (a) surface settlement rod; (b) ground settlement rod; (c) horizontal earth pressure meter; (d) strain gauge.
Applsci 12 08861 g006
Figure 7. Settlements of RSR over time.
Applsci 12 08861 g007
Figure 8. Net settlement of reinforced backfill and rainfall over time.
Applsci 12 08861 g008
Figure 9. Variation of the horizontal earth pressure over time.
Applsci 12 08861 g009
Figure 10. Variation in horizontal earth pressure over height.
Applsci 12 08861 g010
Figure 11. Variation of geogrid strain over time: (a) 2nd layer (short geogrid); (b) 5th layer (short geogrid); (c) 10th layer (long geogrid); (d) 13th layer (long geogrid); (e) 16th layer (long geogrid).
Applsci 12 08861 g011aApplsci 12 08861 g011b
Table 1. Site investigation results.
Depth
(m)
Thickness (m)Layer Descriptionsn Values 1 (Number of Blows/cm)
0–1.41.4Landfill layer
Medium stiff clayey sand
13/30
1.4–3.72.3Sedimentary layer
Stiff sandy clay
8/30–12/30
3.7–12.08.3Weathered soil layer
Soft to very stiff silty sand
16/30–50/9
12.0–15.03Weathered rock layer
Very stiff weathered
Granite
50/10–50/7
1 The number of hammer blows required to penetrate the sampler by 0.3 m in the standard penetration test.
Table 2. Results of stability analysis [24].
Factors of SafetyLoading Conditions
DryWetEarthquake
Circular Failure2.011 > 1.5001.802 > 1.3001.681 > 1.100
Sliding3.546 > 2.000-3.793 > 1.500
Overturning3.712 > 1.500-2.715 > 1.100
Table 3. Construction working schedules.
No.Measurement DateWorks
Installation of CIP concrete pile
Day 0Work starts on the reinforced backfill
Day 23Completion of reinforced backfill
Stabilization period
Day 185Work starts on the rigid facing wall
Day 242Completion of the rigid facing wall
Day 308Completion of the reinforced roadbed
Day 428Completion of the track
Table 4. Properties and compaction conditions for backfill materials.
ZonesMaterialsProperties and Compaction Conditions
Reinforced roadbed (Crushed gravel)Dmax 1 = 31.5 mm, over 100% OPM 2
Cement-treated gravelDmax = 63 mm (Cement 3%), Ev2 3 ≧ 120 Mpa, Ev2/Ev1 3 < 2.2
GravelDmax = 63 mm, Ev2 ≧ 80 Mpa, Ev2/Ev1 < 2.2
Soil(Upper roadbed)
Ev2 ≧ 80 Mpa, Ev2/Ev1 < 2.3, over 95% ρd,max 4 
(Lower roadbed)
Ev2 ≧ 60 Mpa, Ev2/Ev1 < 2.7, over 90% ρd,max
1 Dmax: maximum particle diameter; 2 OPM: optimum moisture content; 3 Ev1 and Ev2: deformation moduli; 4 ρd,max: maximum dry density.
Publisher’s Note: MDPI stays neutral with regard to jurisdictional claims in published maps and institutional affiliations.

