1. Introduction
The idea of the Internet of Things (IoT) depends upon the incorporation of recognizable, varied physical substances (instant cameras, humans, sensors, animals, vehicles, etc.) and the cyber world with the capability of transferring data in a network deprived of human-to-computer or human-to-human interfaces [
1]. IoT applications may range from modest appliances for a smart home to complicated devices in a smart grid. The IoT offers a marvelous chance for humanity across the globe [
2]. With various objectives, conflicting IoT applications take a joint set of features. Generally, an IoT primary node can execute three different activities: data processing and utilization, data collection, and data transmission. Many approaches to enhancing data access, authentication, and confidentiality are stated in the literature; however, even with such systems, IoT networks are vulnerable to many assaults pointed at network disturbance [
3]. The diversity, growth, ubiquity, and complexity of the IoT expands the possible assault surfaces. Thus, intrusion-preventing apparatuses and signature-related intrusion detection (ID) techniques are needed for the potential assaults in the IoT network [
4]. An intrusion detection system (IDS) is a device or software application that monitors a network for abnormal activities or policy violations. Any intrusion activity or violation is normally reported either to an administrator, or gathered centrally through the use of security information and an event management system.
A defense system is needed for noticing new and effective intrusions. An IDS depends upon anomaly detection (i.e., statistically related) to achieve its purpose. Anomaly recognition has no need for previous recognition of assault signs [
5]. Since IoT services cover an extensive range, there are varied transmission technologies with diverse values, which increases the threats to end-wise security. The assault surface size in the IoT is raised, due to the expansions in diversity and the complexity of the IoT [
6]. Defense systems such as signature-related ID techniques do not function correctly for the adapted assaults, and, therefore, an IDS is necessary for new intrusions. The anomaly-related ID method drives this discovery structure, as there is no need for previous data regarding the assault signs [
7]. Definite features of IoT systems were provided by several scholars in the facets of evolving an IDS.
The devices or nodes in the IoT are source-limited and work with less influence. It is impossible to host an orthodox IDS that needs higher computational abilities and a higher level of power [
8]. The protocols utilized in the IoT system are not similar to the protocols utilized in traditional systems [
9]. The protocols utilized in such networks, namely, IPv6 with Constrained Application Protocol (CoAP) and low-power, wireless personal area networks (6LoWPAN) make the network varied, leading to novel dimness and making it challenging to apply the IDS in the networks. Taking the aforementioned features into account, it becomes essential to advance a lightweight IDS that executes its purpose professionally in network security [
10]. The word lightweight indicates that the scheme must operate on controlled sources obtainable in the IoT network nodes, and does not mean that the system is simple.
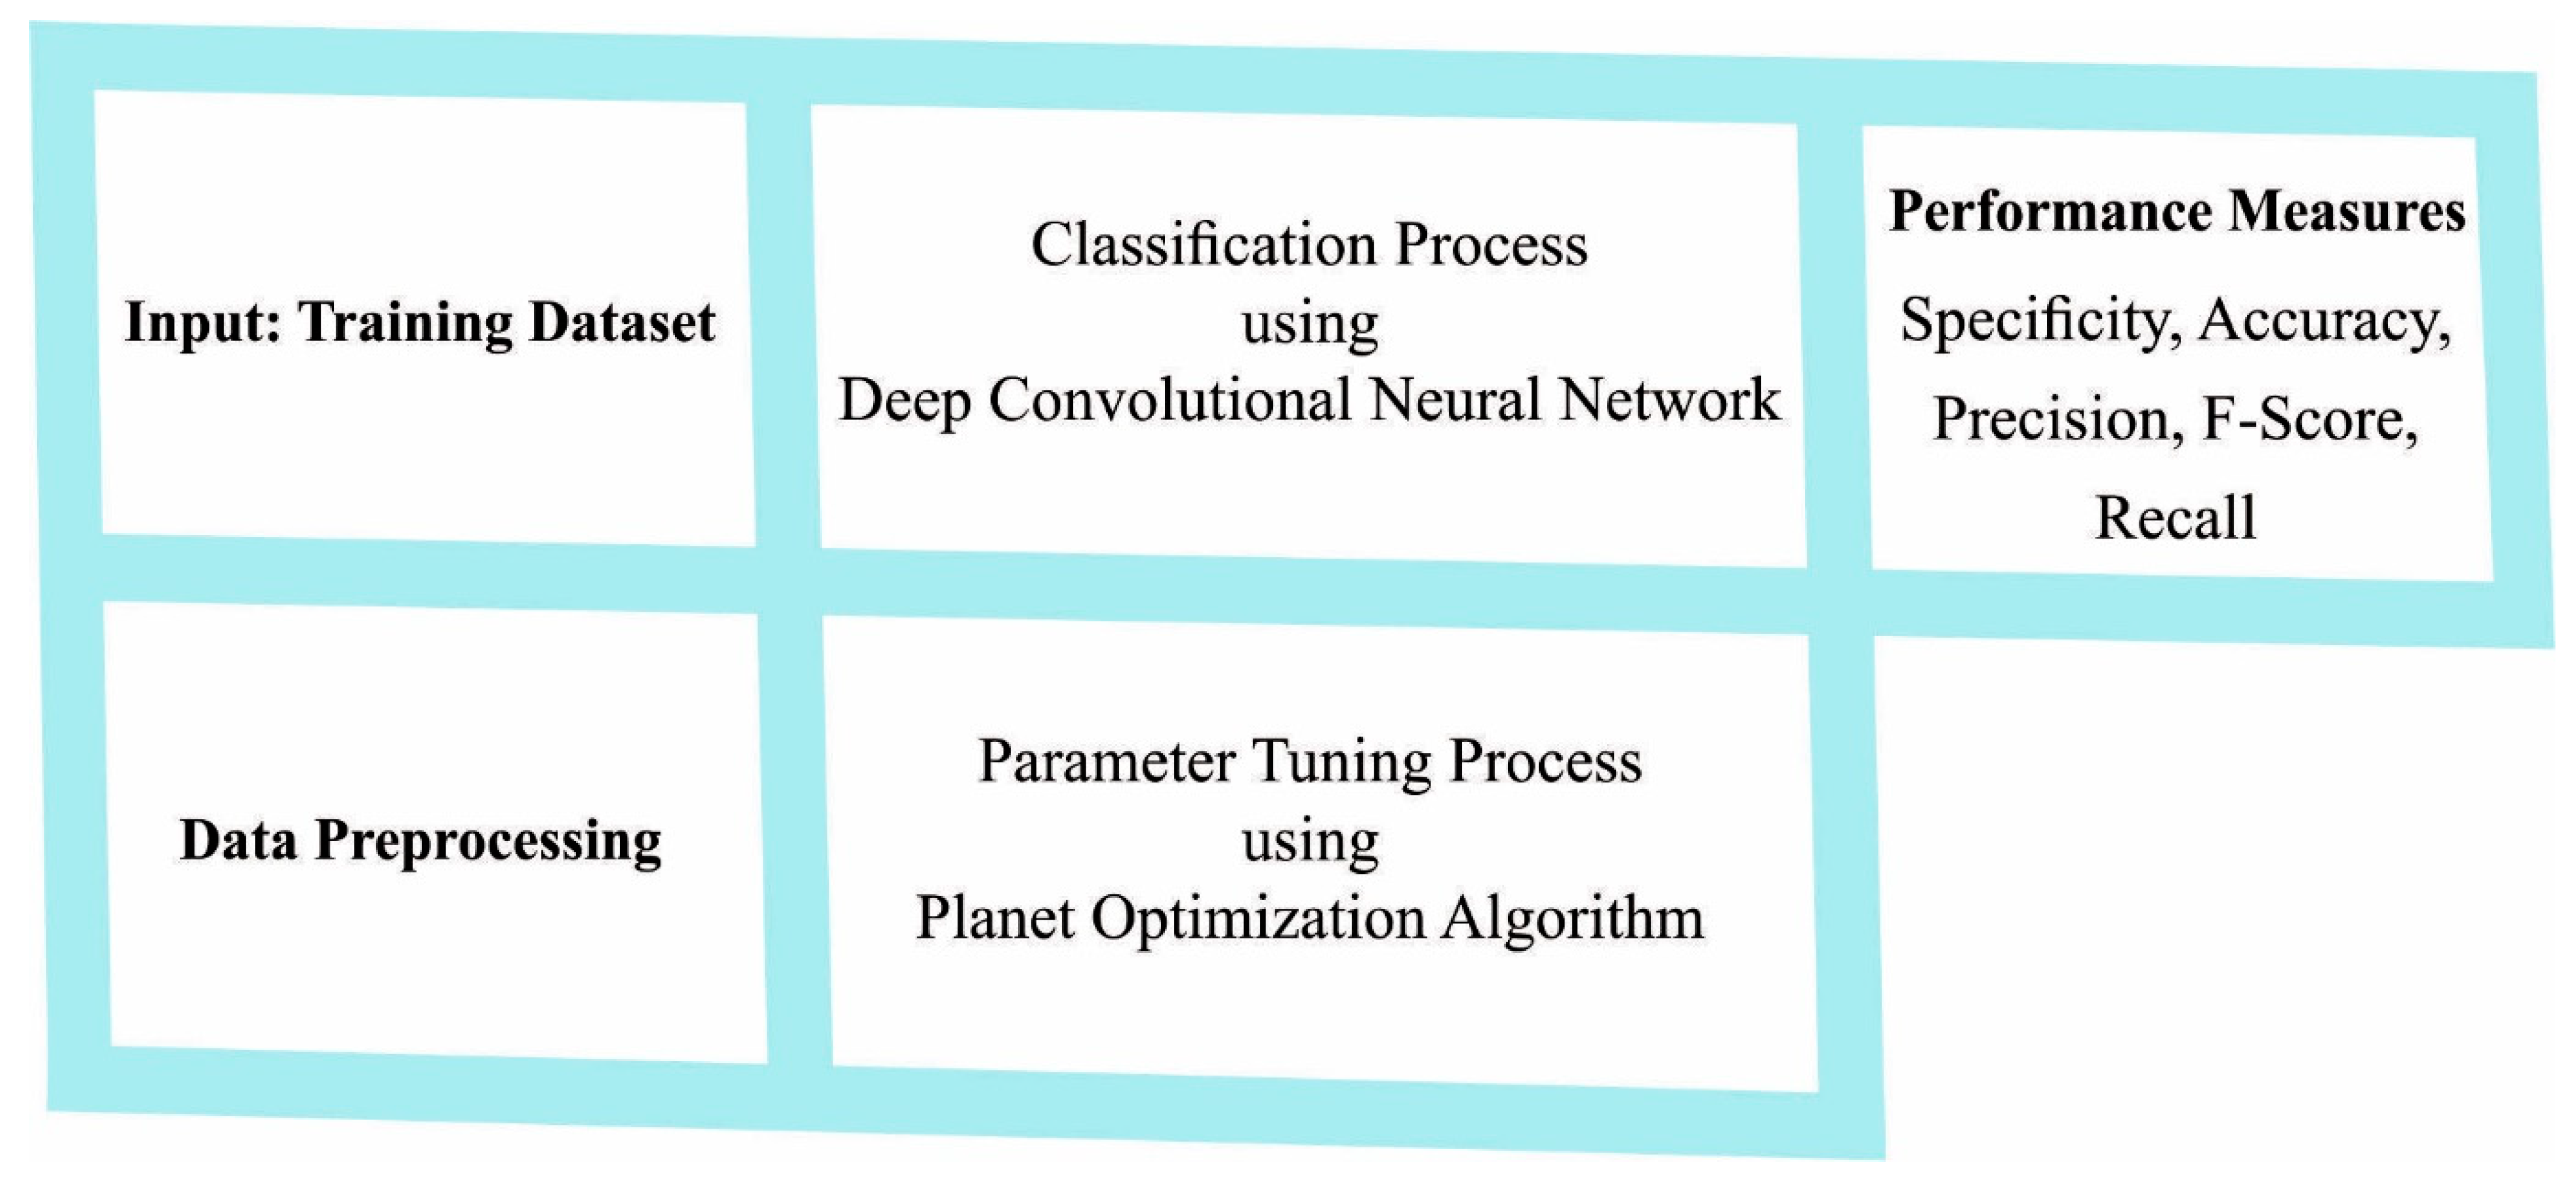
This article focuses on the development of Planet Optimization with a deep convolutional neural network for lightweight intrusion detection (PODCNN-LWID) in a resource-constrained IoT environment. The presented PODCNN-LWID technique primarily aims to identify and categorize intrusions. In the presented PODCNN-LWID model, two major processes are involved, namely, classification and parameter tuning. At the primary stage, the PODCNN-LWID technique applies the DCNN model for the intrusion identification process. Next, in the second stage, the PODCNN-LWID model utilizes the PO algorithm as a hyperparameter tuning process. The experimental validation of the PODCNN-LWID model is carried out on benchmark dataset, and the results are assessed using varying measures.
3. The Proposed Lightweight IDS Model
In this article, a new PODCNN-LWID technique is developed for the recognition of intrusions in the IoT network. The presented PODCNN-LWID technique primarily aims to identify and categorize intrusions. In the presented PODCNN-LWID model, two major processes are involved, namely, classification and parameter tuning.
Figure 1 depicts the overall process of the PODCNN-LWID approach. At the initial stage, the input networking data is preprocessed to fill missing values, using a median approach. Next, the preprocessed data is fed into the DCNN model to detect and classify intrusions. Finally, the PO algorithm is applied as a hyperparameter optimizer, to choose the hyperparameter values effectively.
3.1. Stage I: Intrusion Detection Model
At the primary stage, the PODCNN-LWID technique applies the DCNN model for the intrusion identification process. CNNs are established with the concept of local connectivity. The spatial extension of all the connectivity is suggested as the receptive domain of nodes [
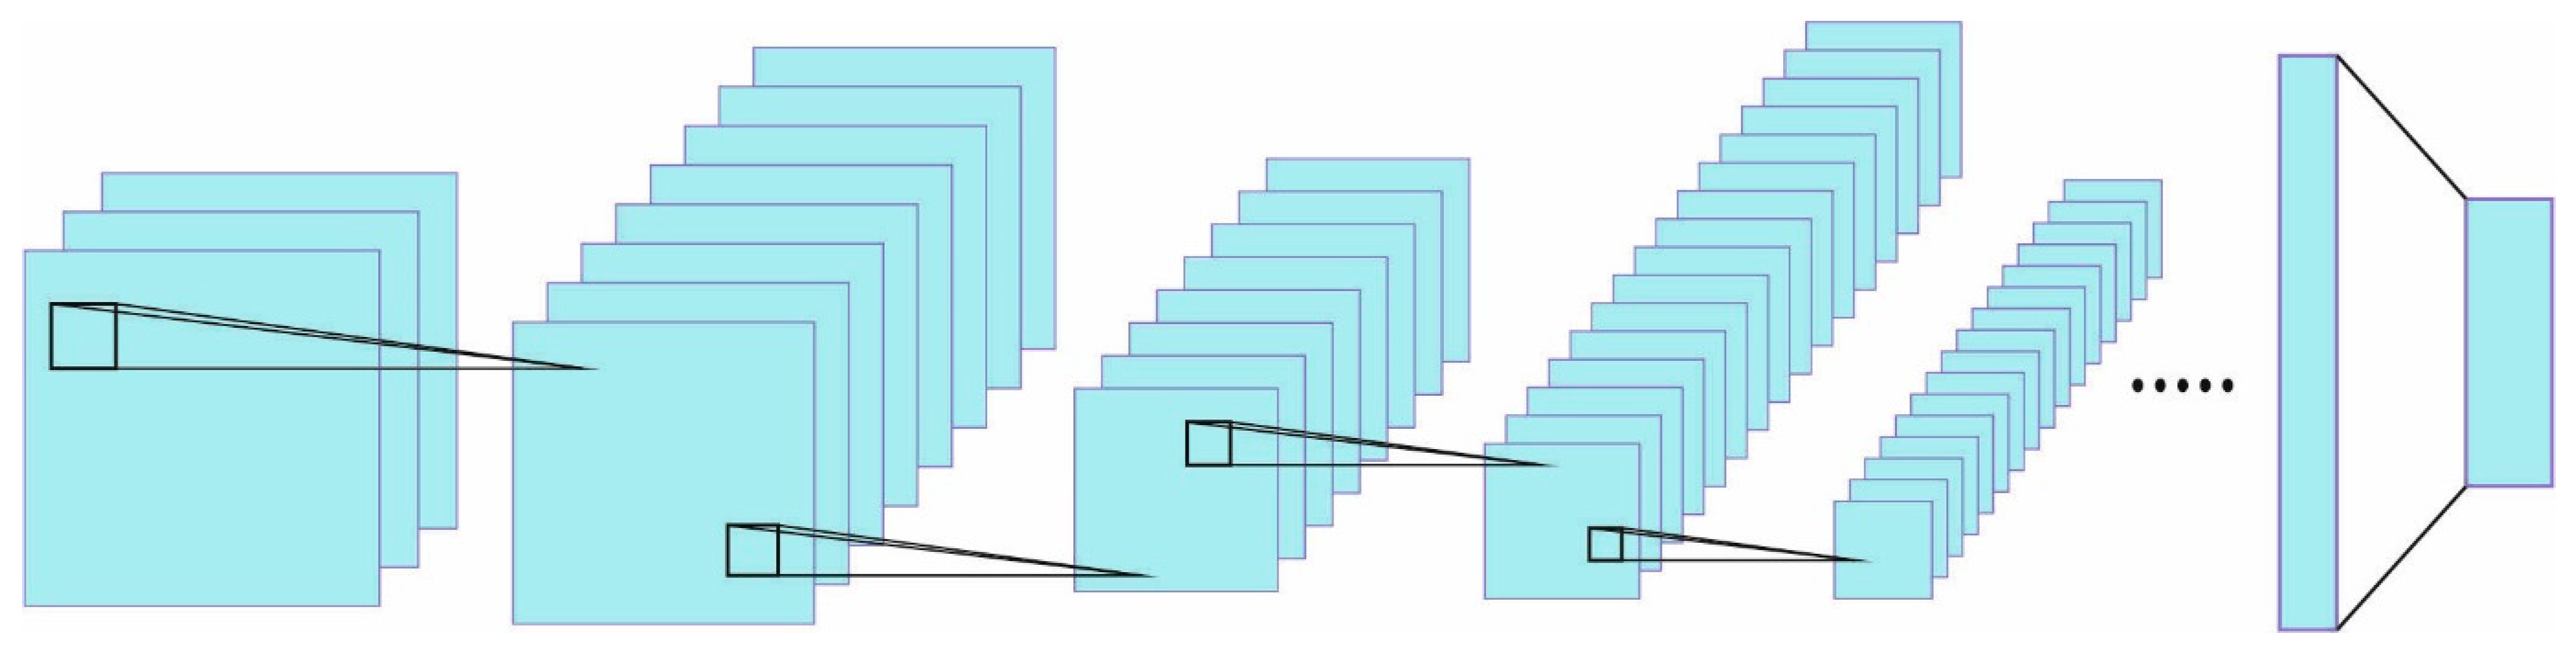
18]. The local connectivity is accomplished by exchanging weight sums in the NN with Convs. In all the layers of the CNN, the input is Conv, with the weighted matrix (filter) to generate a feature map. The local connectivity and shared weight feature of CNNs decrease the entire amount of learnable parameters, resulting in further effective training. The deep CNN is generally separated into two important parts: the primary part is comprised of the order of two one-dimensional Conv blocks, with Conv1D layers of 32 and 64 channels in the first and second blocks, respectively, a Batchnorm layer, an ReLU activation function, and a max-pooling 1D layer. Other parts comprise the order of the fully connected (FC) layers. In two important Conv blocks, the input signal is encrypted by decreasing their length and improving the number of channels.
Figure 2 showcases the infrastructure of the CNN.
The resultant second Conv block is concatenated, with input signals employing the remaining skip connections. However, it utilizes the network maintenance data as input at the deeper layers. Next, by concatenating the input signal and resultant Conv blocks, the FC layer is utilized for the final decision layer that creates the outcome. The resultant value of the Conv 1D layer with input size
and output
is:
where
refers to the valid cross-correlation function (in this work, it is the Conv function),
signifies the batch-size
,
signifies the channel
and
denotes the length of signal orders (when the input is image, width and height are employed rather than length). The length of resultant signal order is computed by utilizing the equation:
where:
stride implies the stride of cross-correlation;
padding signifies the number of zero-paddings on both sides;
dilation denotes the space amongst the kernel element;
kernelsize stands for the size of the Conv kernel.
In order to achieve the max-pooling 1D, the resultant value with input size
and outcome
is represented as:
in which
signifies the input
;
represents the channel
kernelsize denotes the size of windows needed to obtain max over;
stride indicates the stride of windows;
padding demonstrates the number of zeros added on both sides;
dilation represents the parameter that deals with the stride of elements from the window.
The length of the resultant signal order to the -pooling 1D layer is computed utilizing the same equation from the ConvlD layer.
3.2. Stage II: Hyperparameter Tuning Model
In the second stage, the PODCNN-LWID model utilizes the PO algorithm as the hyperparameter tuning process. The universe is extremely big and has no boundaries, and large spaces are occupied with stars, planets, galaxies, and other stimulating astronomical phenomena [
19]. For ease of visualization, and simplicity of the study, the solar system is used as representations. Initially, a structure comprised of the Moon, the Sun, and the Earth is taken into account in these cases. It is clear to everyone that the Sun maintains its’ gravitational force to maintain the Earth revolving around it. The mass of the Sun is 330,000 times larger than that of the Earth. However, the Earth generates gravitation pull that is large enough to maintain the Moon’s orbit around it. This illustrates the two factors that influence the movement of the planets, i.e., the mass, along with the distance between the two planets. Therefore, the process mimicking the law of gravitational force is shown below:
The Sun acts as an optimum solution. In this problem, it has the highest mass, which implies that it has a great gravitational moment for the planets near and around it;
Concerning the Sun (red planet) and other planets, there exists a gravitational pull between them. This moment can be determined by the mass and the distance between those objects. This implies that, even though the red planet has the biggest mass out of all the other planets, the moment on faraway planets is insignificant. This aids the process of preventing the local optima.
At the - iteration, the mass of the red planet is the largest, hence, it signifies the Sun. As the pink planet is closer to the red planet, it moves to the position of the red planet, due to gravitational pull between the planets and the red planet.
Nonetheless, the red planet at the -iteration does not have the preferred location that we are trying to find, namely, the minimal optima. In other words, if all the planets move towards the red planet, the procedure becomes trapped in the local optima. On the other hand, the blue planet is in a prospective position and is farther from the red planet. The communication of the red planet with the blue planet is smaller, as it is farther from the red planet at the- iteration. Therefore, it is wide open for the blue planet to seek the best position in the following iteration.
The primary objective depends on the abovementioned two concepts. In addition, the red planet is the accurate objective of examination, and obviously, we do not have its’ correct position. In such cases, the planet with the greatest mass at the - iteration acts as the Sun simultaneously.
The application of the procedure is shown below:
Stage 1: Initially, the best process is the one wherein the last finest solution is autonomous of the primary locations. Nonetheless, realism conflicts with most of the stochastic approaches. When the target area is mountainous, and the global optimal is positioned in a remote minor region, an early population has significance. When an early arbitrary population does not make solution in the surrounding area of the global-searching phase of the actual population, then the possibility that the population focuses on the correct optimal could be lower.
On the other hand, with the construction of a primary solution near to the global optimum location, the possibility of the convergence of the population to the optimum position becomes higher. Indeed, globalization is comparatively large, and subsequently, the initial population performs a major part. Preferably, the introduction must utilize crucial sampling methods, for example, the technique employed in the Monte Carlo model for sampling the solution. Although this request possess sufficient intelligence from the algorithm, it could not be fulfilled by almost all of the processes.
Similar to selecting the early population, selecting the finest solution in a new population in the part of the red planet regarding other planets’ stirring towards the position is significant. This process determines the accuracy and the convergence rate of the problem.
Consequently, the initial step is to discover a better solution for playing the role of the optimum solution, in order to raise the accuracy and convergence of the algorithm in the initial iteration.
Here, the subsequent parameter can be determined:
in which
represents a constant variable, and
. This implies that when the value of an objective function of a planet is small, the mass of a planet is large.
and
show the objective function value of
-
or
-
planets, e.g., the worst planet and the red planet, respectively;
Stage 3: Global search. A formulation constructed to mimic global search is as follows
The left side of the equation exemplifies the existing location of the planet - in the iteration, whereas the right side contains the foremost components in the following:
shows the existing location of planet - at the - iteration;
indicates a constant variable;
indicates the existing location of the red planet in the - iteration.
The expression indicates a coefficient that can be determined by , refers to the gravity of the red planet - at the - iteration, and indicates the value at the - iteration. Consequently, the coefficient has a value within (0, 1).
Stage 4: Local search. In this phase, the accurate position is often the preferred objective to be established. This aim is easy or difficult to accomplish, based on how complex the problem is. In all instances, there is only potential to find an estimated value that fits the actual condition. Specifically, the correct Sun position is in the space between the solution.
Remarkably, while Jupiter is the largest planet in the solar system, Mercury is the planet whose position is closer to the red planet. This implies that the optimum solution location to the accurate position of the Sun at the - iteration might not be nearer than the position of other solutions to the accurate Sun position.
Once the distance between the planets and the Sun is smaller, the local search progression is implemented. From the abovementioned method, the planet with the highest mass operates as the red planet, and in such cases, it is Jupiter that is nearer to the red planet, and moves to the position of the Sun. In other words, the planet moves a smaller distance between its’ own position and the red planet at the
-
iteration, rather than moving directly towards the red planet. This step aims to improve the performance in a narrow region of search space, and it is given below:
In Equation (8),
refers to the
-
iteration,
shows the maximal iteration count, and
indicates the Gaussian distribution function as follows:
Several evolutionary procedures are also randomized through stochastic processes, namely, Lévy distribution and power-law distribution. Normal or Gaussian distribution is the most common, because the maximum number of physical parameters involving uncertainty or errors in the measurement, light intensity, etc., obeys these distributions. The PO algorithm makes a derivation of a fitness function (FF), which results in an enhanced classifier performance. In this article, the reduction in the classifier error rate can be regarded as the FF, as presented in Equation (10).
4. Results and Discussion
The proposed model is simulated using Python 3.6.5 tool on a PC i5-8600k, with GeForce 1050 Ti 4 GB, 16 GB RAM, 250 GB SSD, and 1 TB HDD. As the DCNN model has parameters, the hyperparameter tuning process is performed. The learning rate is kept as 0.01. The number of filters is 32 in the primary CNN layer, 64 in the succeeding CNN layer, and 128 in the last CNN layer. The parameter max-pooling length is set to 2 in all the max-pooling layers, and dropout to 0.01. When the number of CNN layers increases from three to four, the performance is reduced and, therefore, a three-level CNN is used. Lastly, two dense layers are included along with the CNN layer; the first dense layer is composed of 512 neurons and the second layer is composed of 128 neurons. These layers use ReLU as the activation function.
The experimental validation of the PODCNN-LWID model is tested using a dataset comprising 5500 samples with 11 classes, as depicted in
Table 1. We used the CICIDS2017 dataset, which is comprised of normal and the most up-to-date common attacks, and resembles the true, real-world data (PCAPs). The dataset is available at
https://www.unb.ca/cic/datasets/ids-2017.html (accessed on 13 June 2022). It encompasses the network traffic analyses results from the use of CICFlowMeter, with labeled flows based on the time stamp, source and destination IPs, source and destination ports, protocols, and attacks (CSV files). This dataset was gathered for five continuous days (Monday–Friday), with various attacks as well as normal information. The proposed model is simulated using the Python tool. The set of measures used to examine the results are accuracy, precision, recall, specificity, and
F-score.
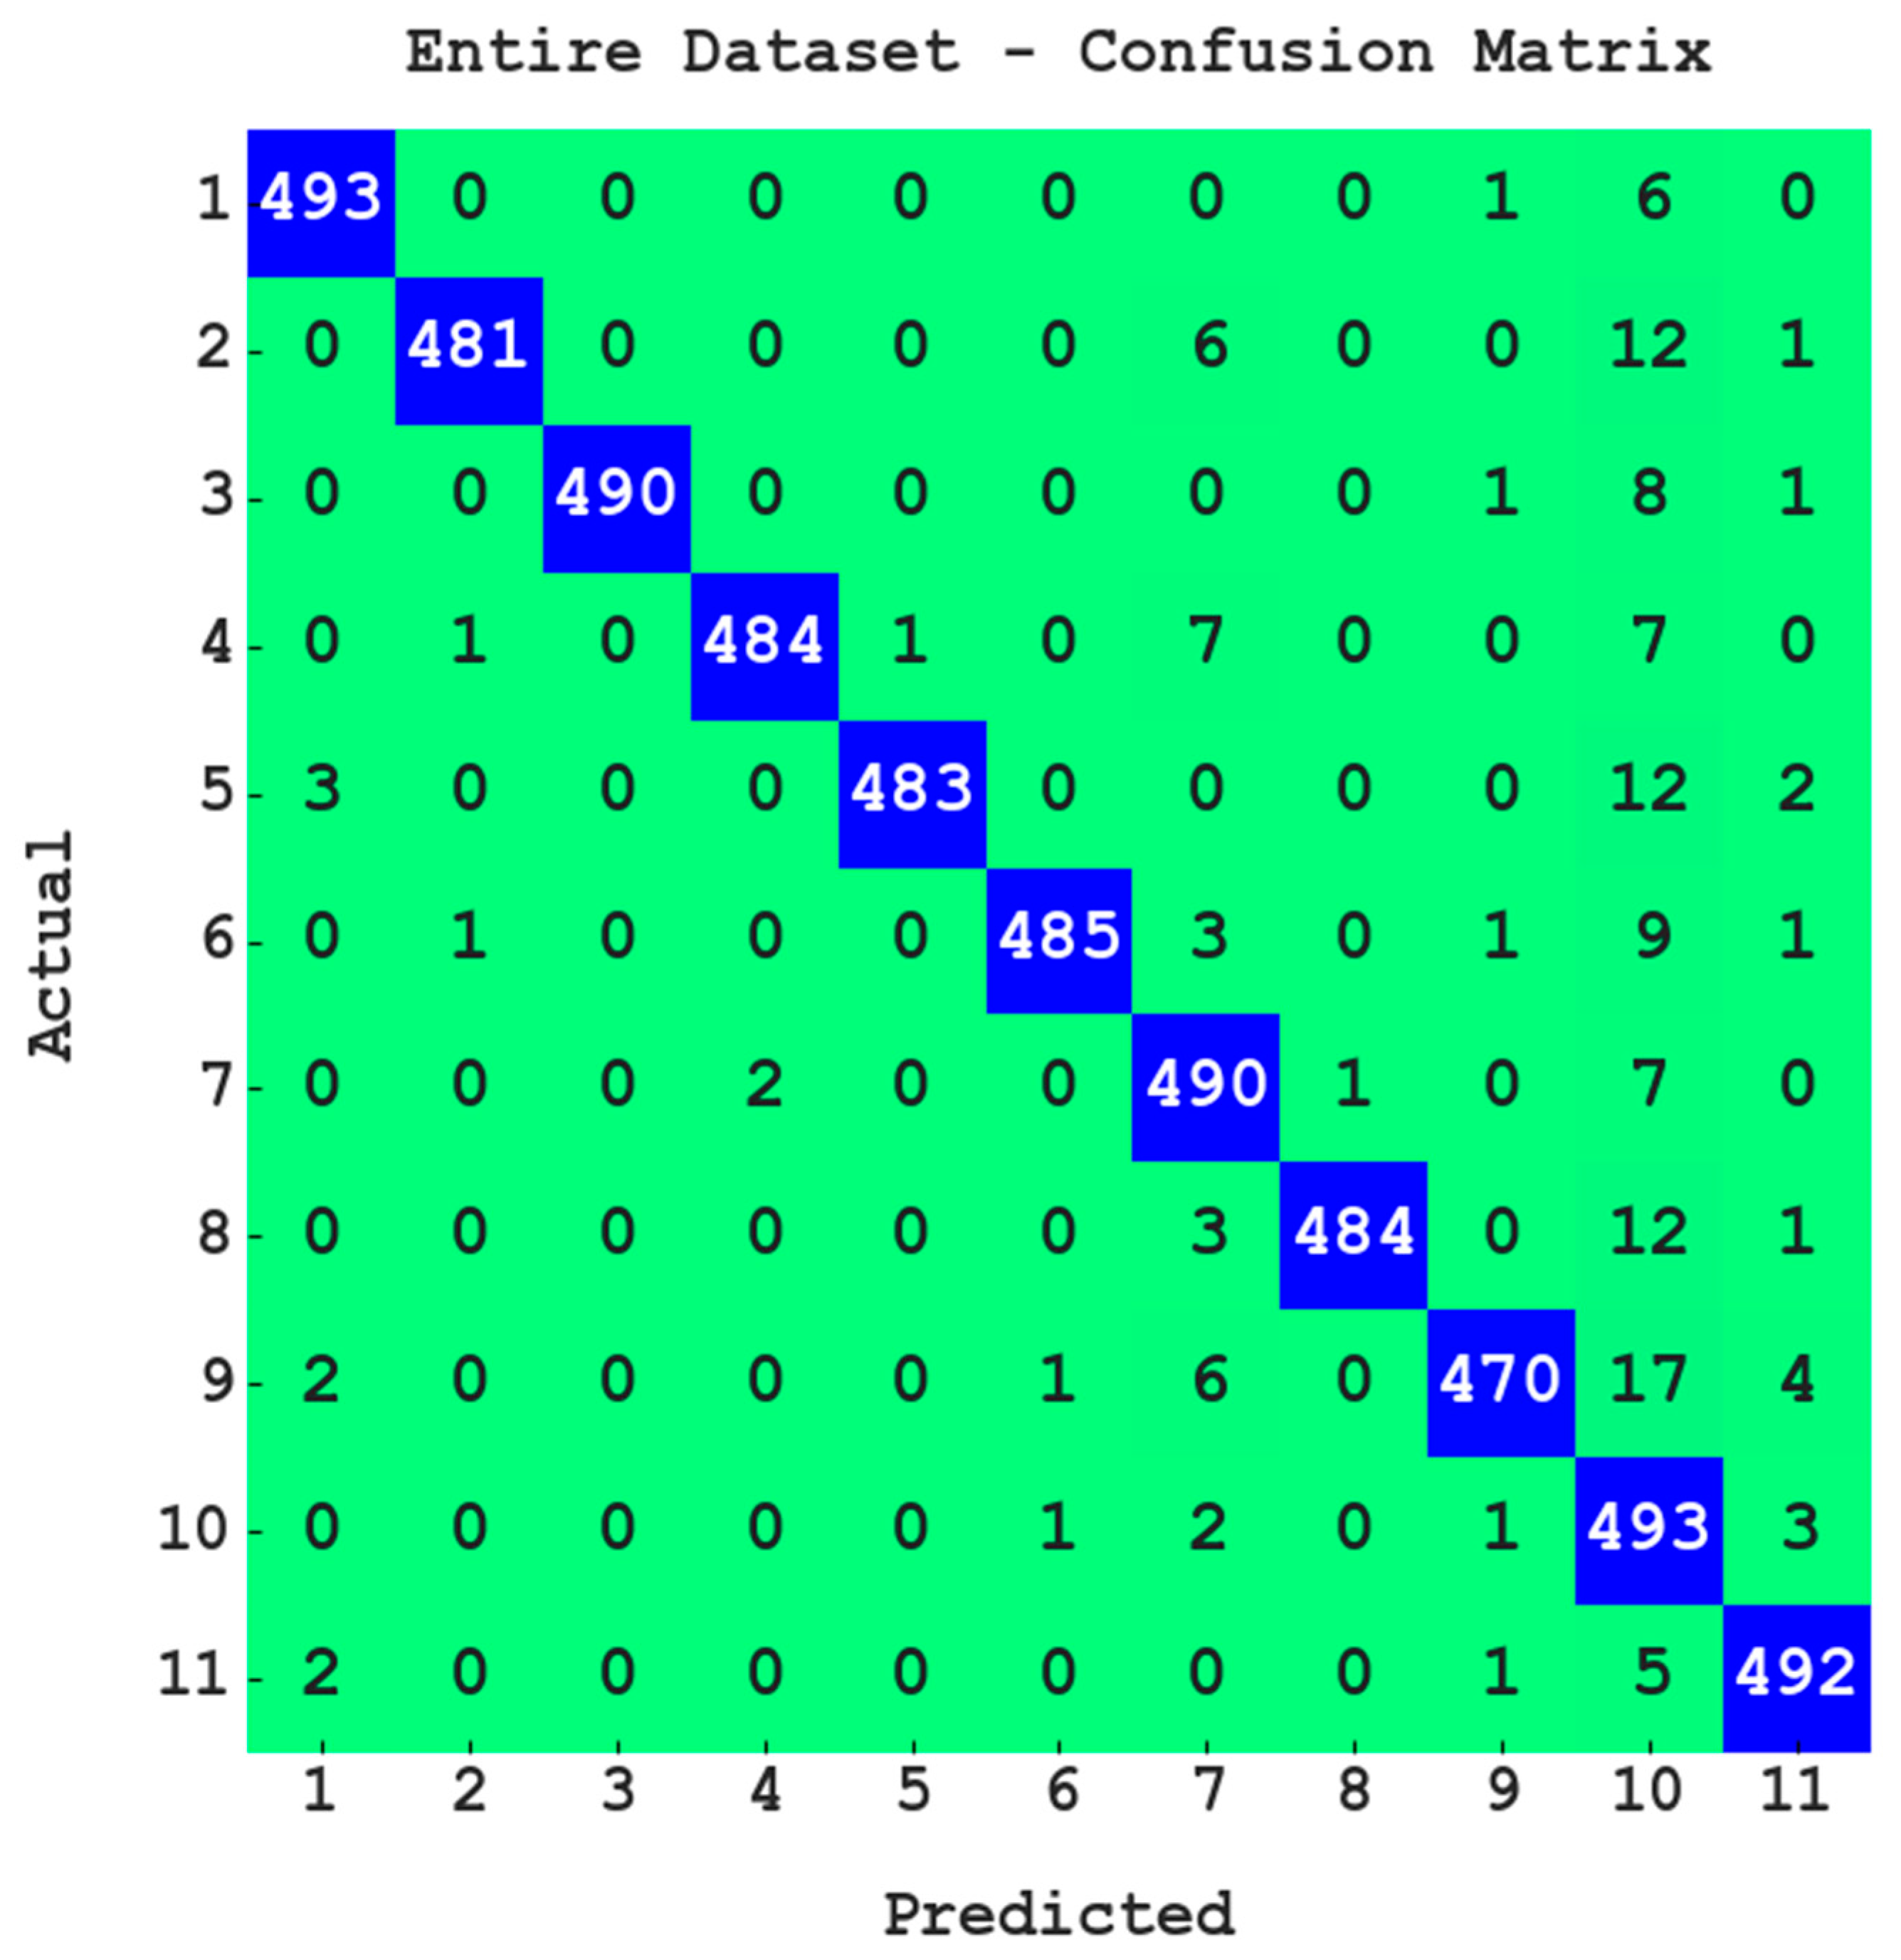
Figure 3 illustrates the confusion matrix offered by the PODCNN-LWID model with the entire dataset. The PODCNN-LWID model identifies 493 samples in class 1; 481 samples in class 2; 490 samples in class 3; 484 samples in class 4; 483 samples in class 5; 485 samples in class 6; 490 samples in class 7; 484 samples in class 8; 470 samples in class 9; 493 samples in class 10; and 492 samples in class 11.
Table 2 reports the intrusion classification output of the PODCNN-LWID model with the entire dataset. In class 1, the PODCNN-LWID model provides
,
,
,
, and
values of 99.75%, 98.60%, 98.60%, 99.86%, and 98.60%, respectively. In the meantime, in class 2, the PODCNN-LWID approach offers
,
,
,
, and
values of 99.62%, 99.59%, 96.20%, 99.96%, and 97.86%, respectively. Likewise, in class 3, the PODCNN-LWID technique presents
,
,
,
, and
values of 99.82%, 100%, 98%, 100%, and 98.99%, respectively. Moreover, in class 4, the PODCNN-LWID algorithm renders
,
,
,
, and
values of 99.67%, 99.59%, 96.80%, 99.96%, and 98.17%, respectively. Finally, in class 5, the PODCNN-LWID approach grants
,
,
,
, and
values of 99.67%, 99.79%, 96.60%, 99.98%, and 98.17%, respectively.
Figure 4 demonstrates the confusion matrix offered by the PODCNN-LWID technique for 70% of the TR dataset. The PODCNN-LWID algorithm identifies 344 samples in class 1; 340 samples in class 2; 350 samples in class 3; 341 samples in class 4; 339 samples in class 5; 336 samples in class 6; 351 samples in class 7; 338 samples in class 8; 322 samples in class 9; 335 samples in class 10; and 338 samples in class 11.
Table 3 portrays the intrusion classification output of the PODCNN-LWID technique for 70% of the TR dataset. For class 1, the PODCNN-LWID algorithm offers
,
,
,
, and
values of 99.74%, 98.57%, 98.57%, 99.86%, and 98.57%, respectively. In the meantime, for class 2, the PODCNN-LWID approach grants
,
,
,
, and
values of 99.61%, 99.71%, 96.05%, 99.97%, and 97.84%, respectively. In addition, for class 3, the PODCNN-LWID algorithm renders
,
,
,
, and
values of 99.79%, 100%, 97.77%, 100%, and 98.87%, respectively. Additionally, for class 4, the PODCNN-LWID technique offers
,
,
,
, and
values of 99.71%, 99.71%, 97.15%, 99.97%, and 98.41%, respectively. Lastly, for class 5, the PODCNN-LWID approach renders
,
,
,
, and
values of 99.61%, 99.71%, 96.03%, 99.97%, and 97.84%, respectively.
Figure 5 exemplifies the confusion matrix presented by the PODCNN-LWID approach with 30% of the TS data. The PODCNN-LWID technique identifies 149 samples in class 1; 141 samples in class 2; 140 samples in class 3; 143 samples in class 4; 144 samples in class 5; 149 samples in class 6; 139 samples in class 7; 146 samples in class 8; 148 samples in class 9; 158 samples in class 10; and 154 samples in class 11.
Table 4 shows the intrusion classification output of the PODCNN-LWID approach with 30% of the TS dataset. For class 1, the PODCNN-LWID methodology presents
,
,
,
, and
values of 99.76%, 98.68%, 98.68%, 99.87%, and 98.68%, respectively. In the meantime, for class 2, the PODCNN-LWID algorithm renders
,
,
,
, and
values of 99.64%, 99.30%, 96.58%, 99.93%, and 97.92%, respectively. Similarly, for class 3, the PODCNN-LWID technique produces
,
,
,
, and
values of 99.88%, 100%, 98.59%, 100%, and 99.29% respectively. Further, for class 4, the PODCNN-LWID technique offer
,
,
,
, and
values of 99.58%, 99.31%, 95.97%, 99.93%, and 97.61%, respectively. Finally, for class 5, the PODCNN-LWID approach produces
,
,
,
, and
values of 99.82%, 100%, 97.96%, 100%, and 98.97%, respectively.
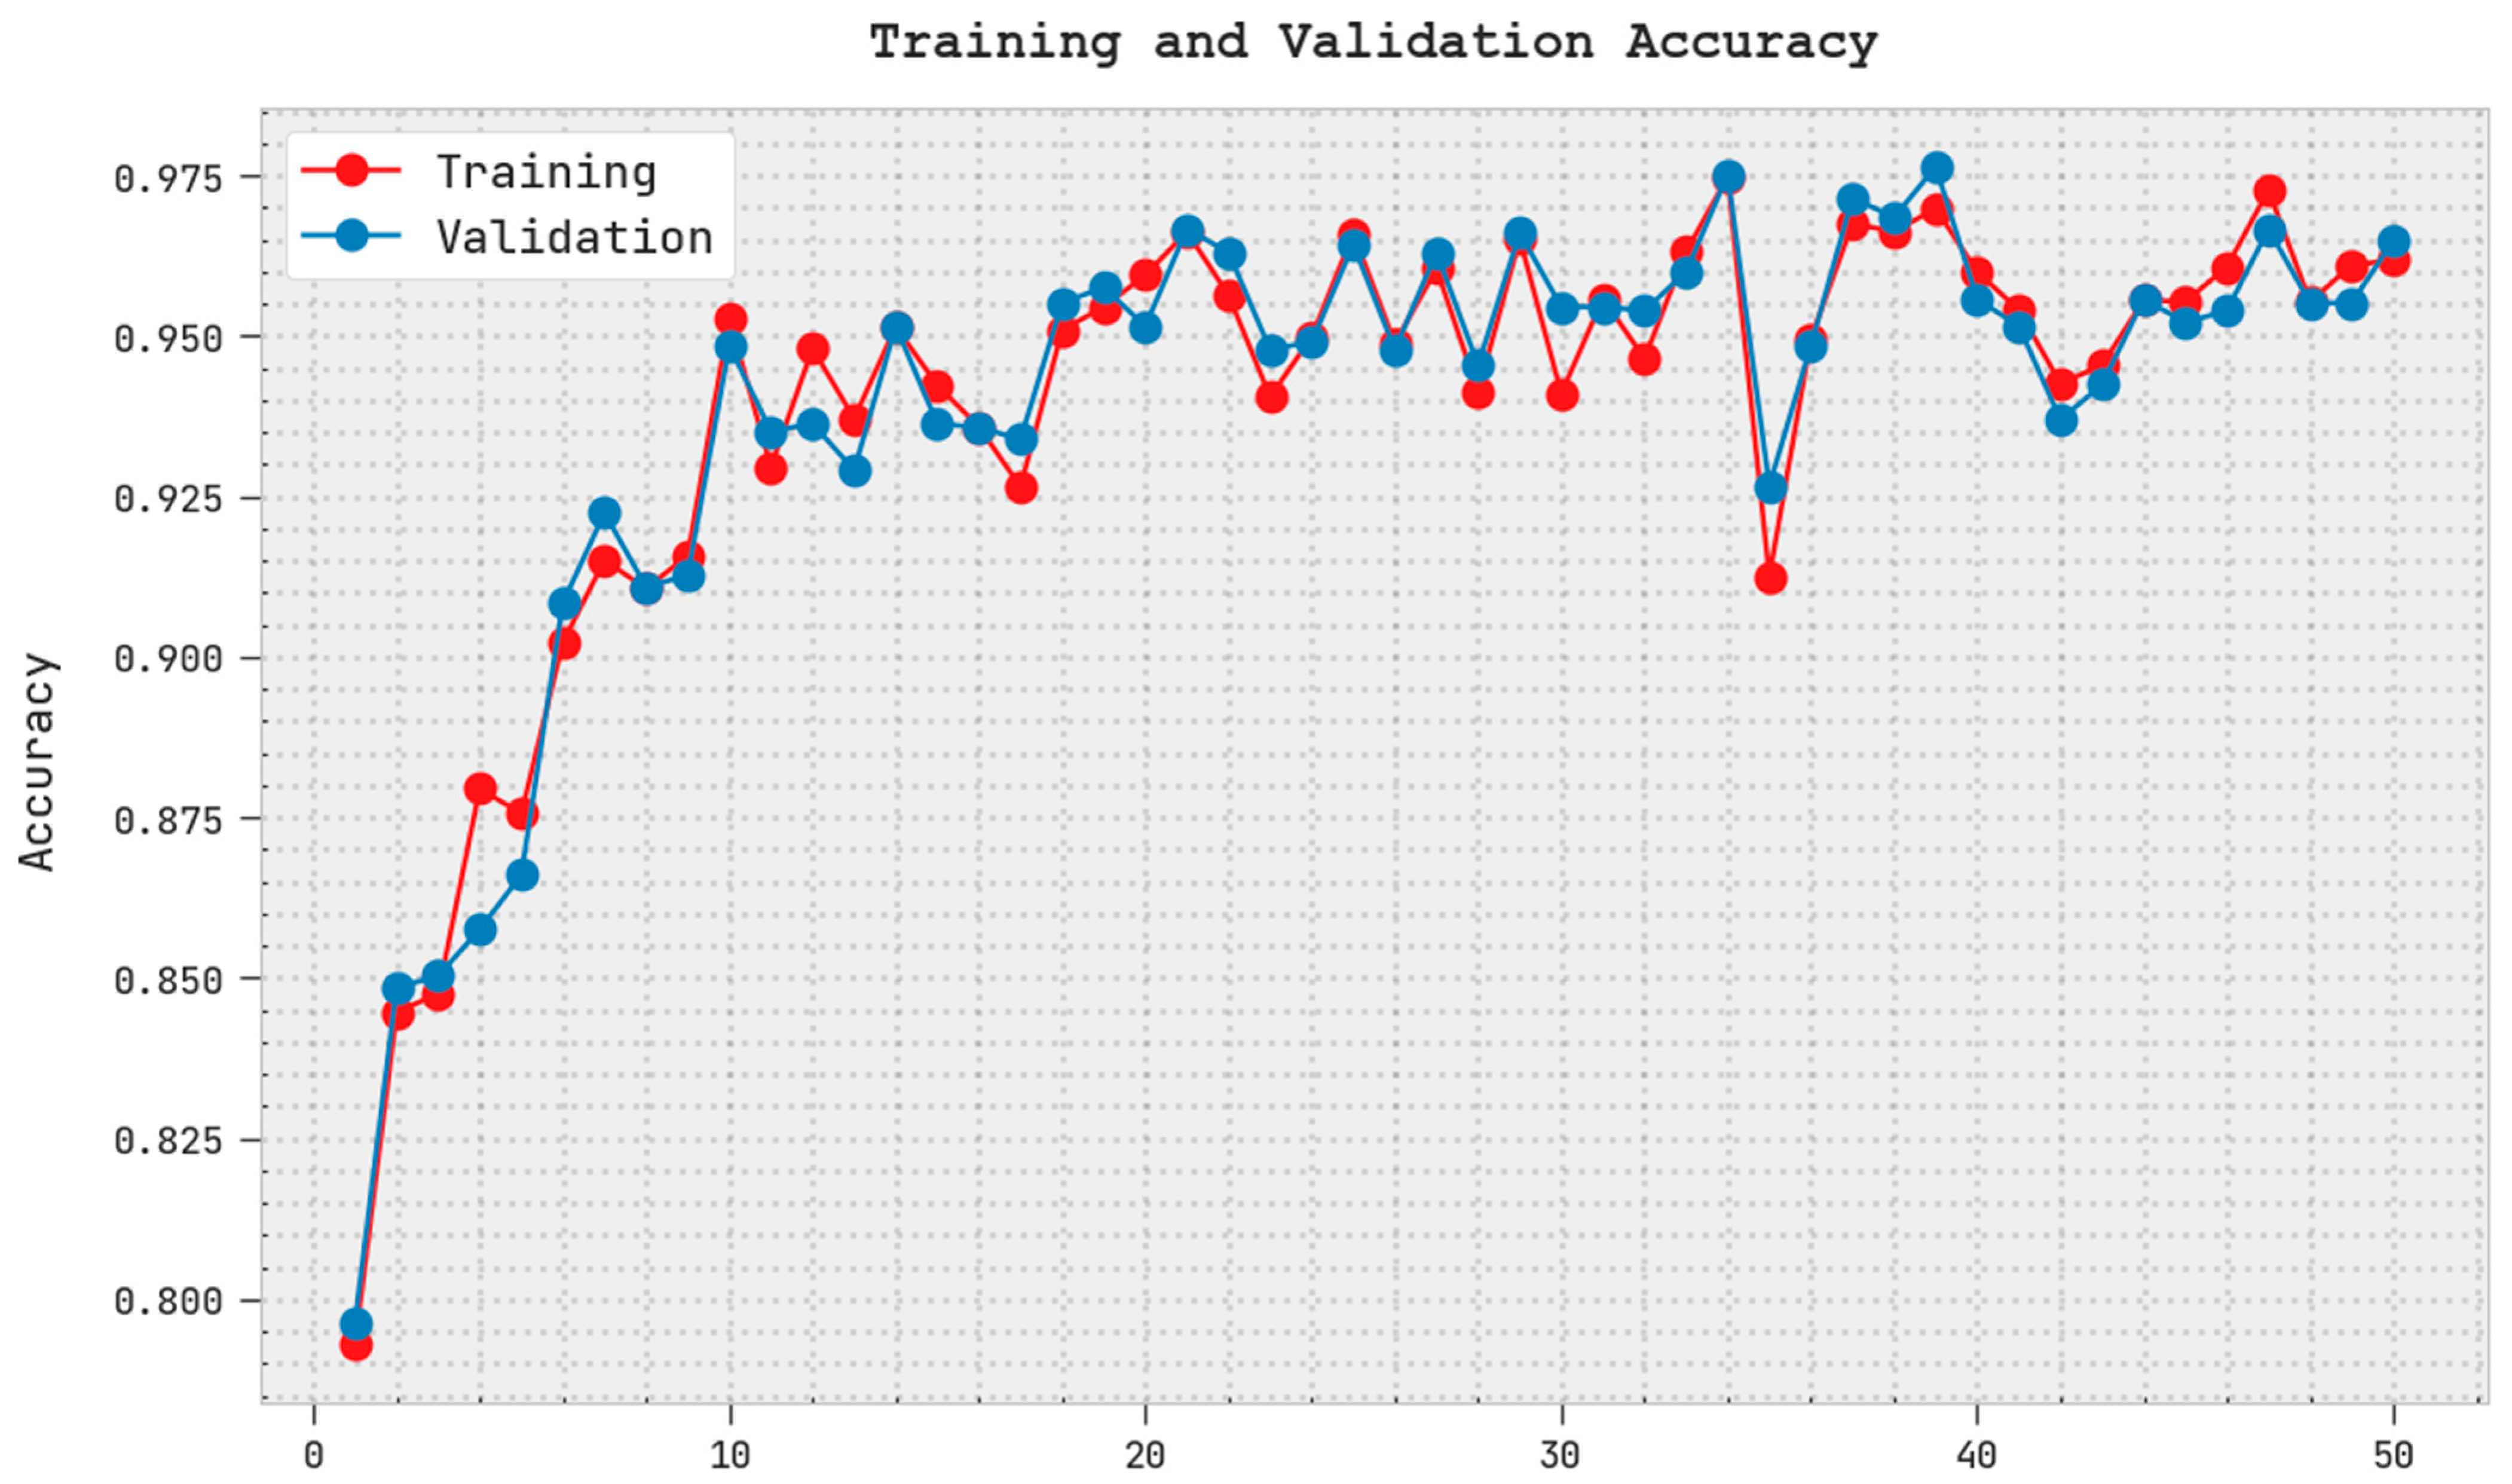
The training accuracy (TRA) and validation accuracy (VLA) gained by the PODCNN-LWID approach with the test dataset is shown in
Figure 6. The experimental outcome implies that the PODCNN-LWID methodology attains maximal TRA and VLA values. The VLA is greater than the TRA.
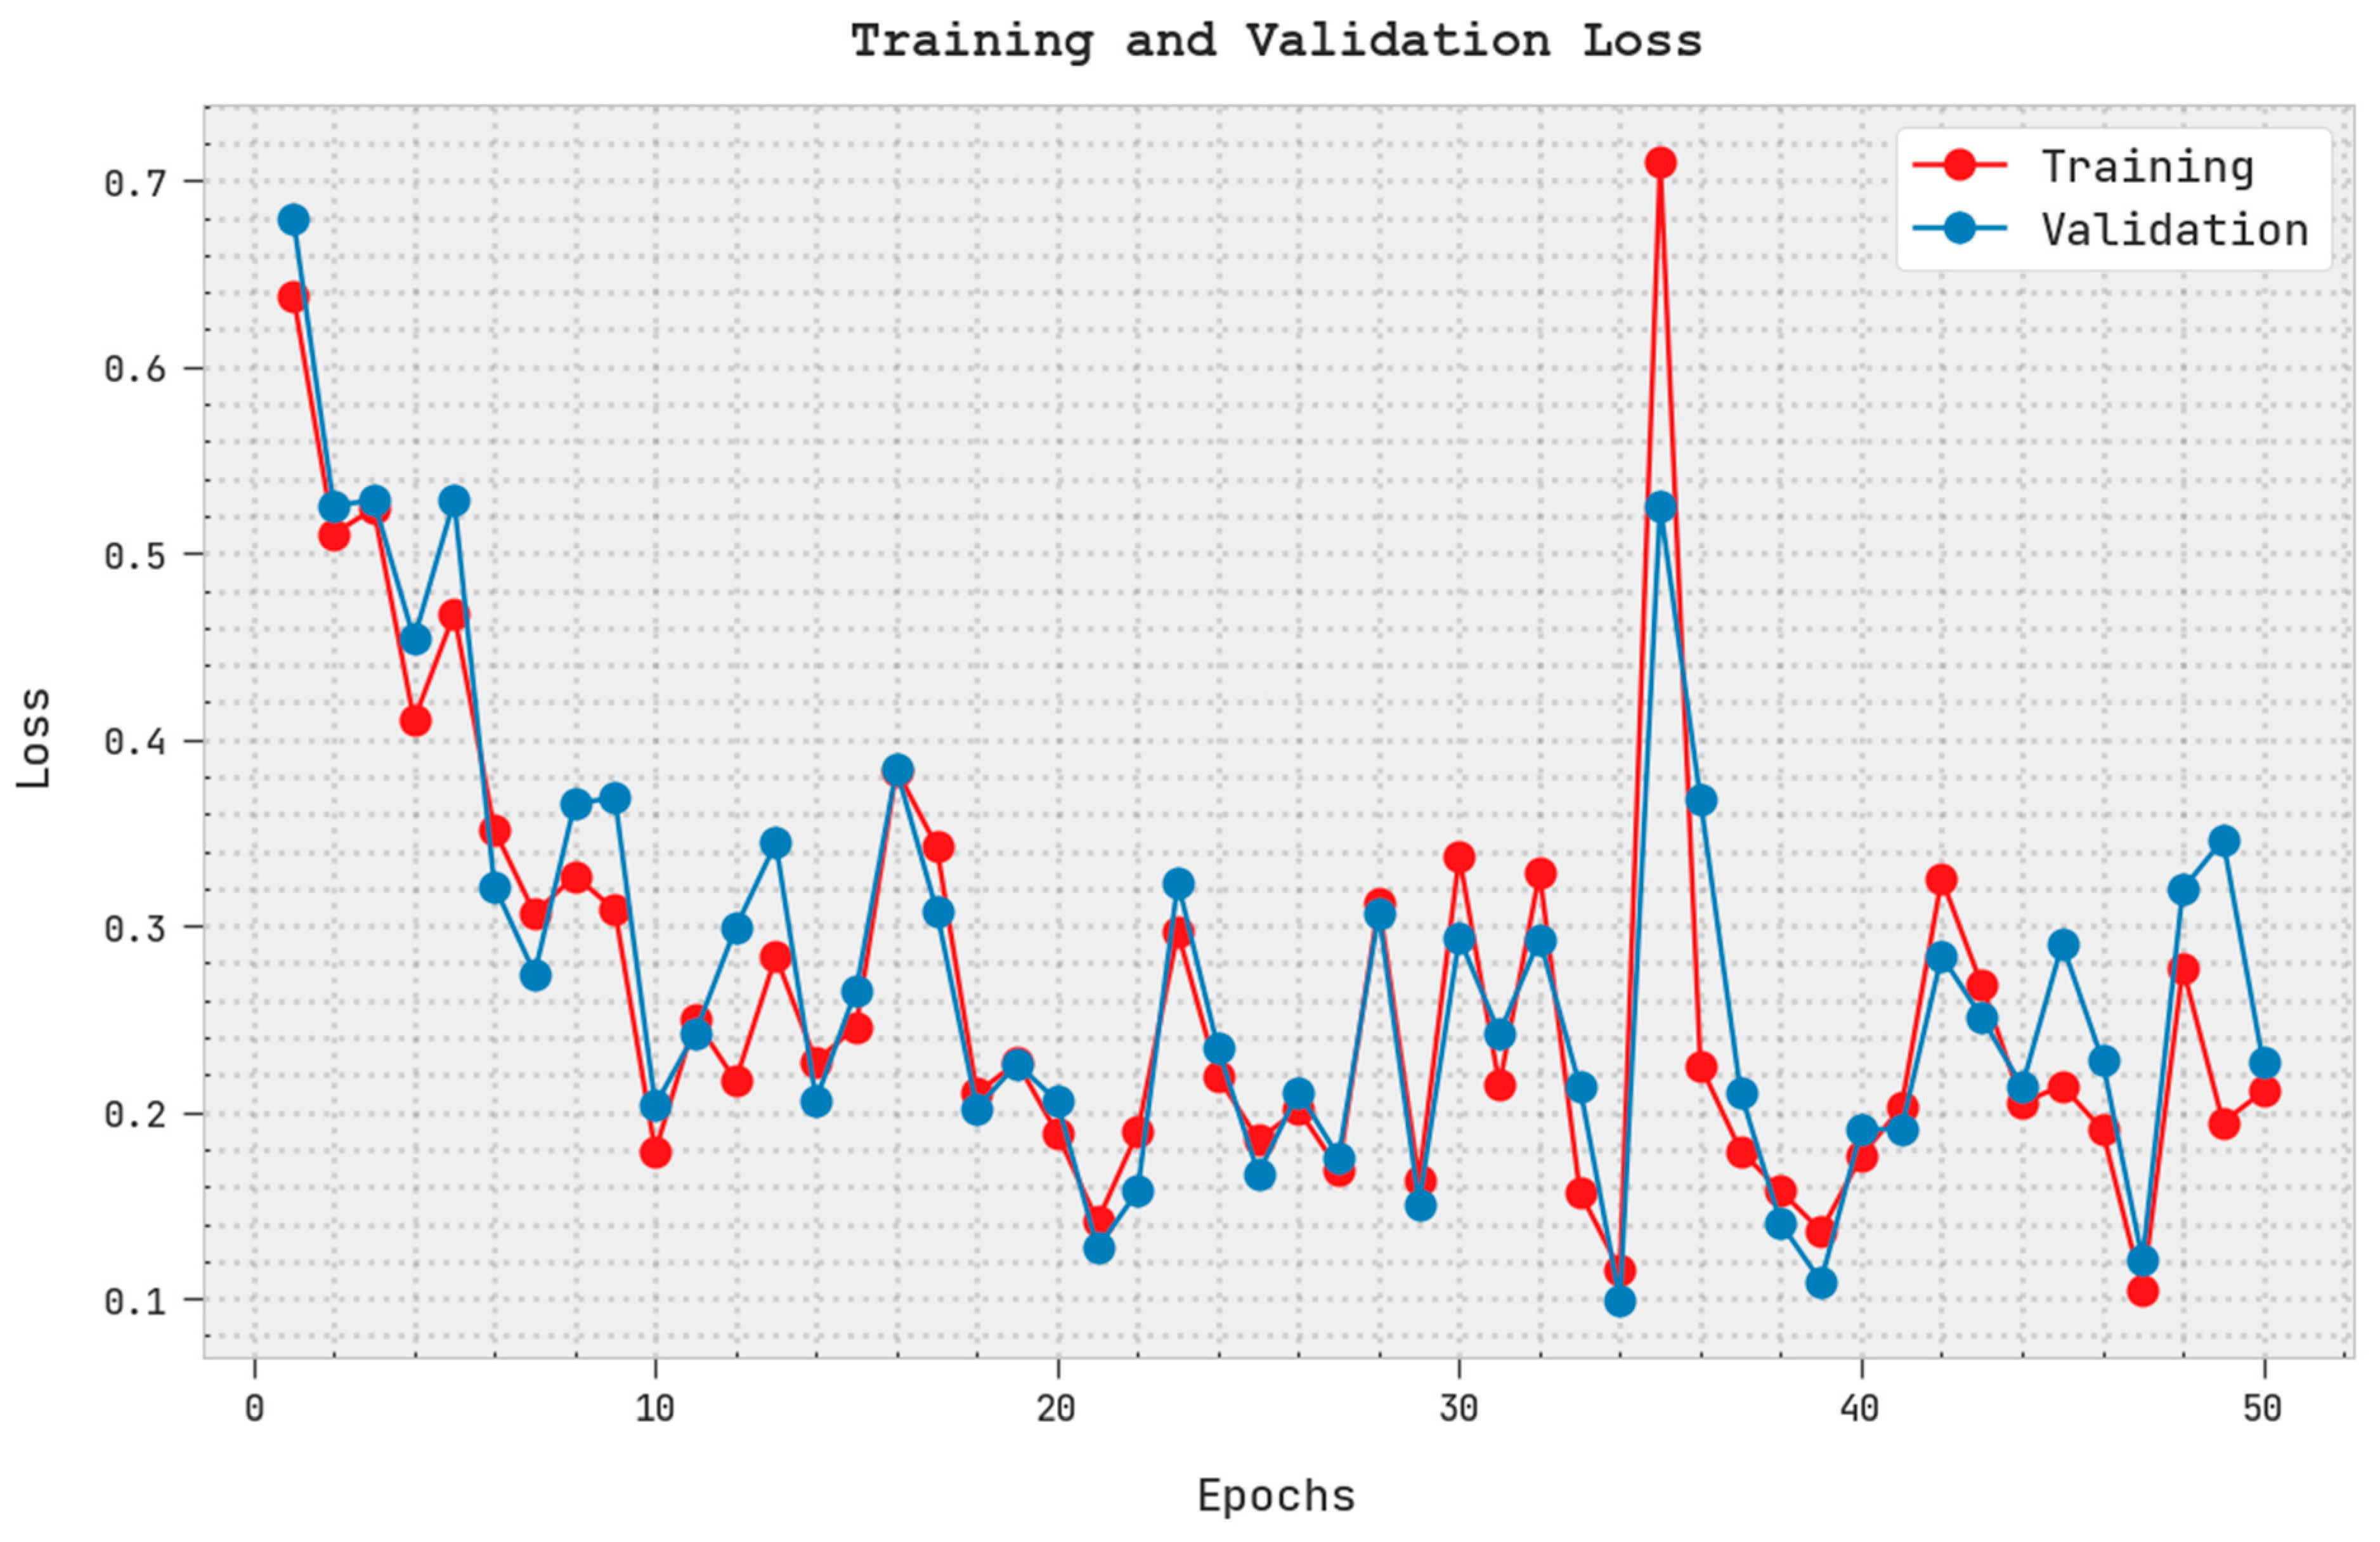
The training loss (TRL) and validation loss (VLL) obtained by the PODCNN-LWID algorithm with the test dataset are displayed in
Figure 7. The experimental outcome indicates that the PODCNN-LWID method exhibits minimal TRL and VLL values. In particular, the VLL is less than the TRL.
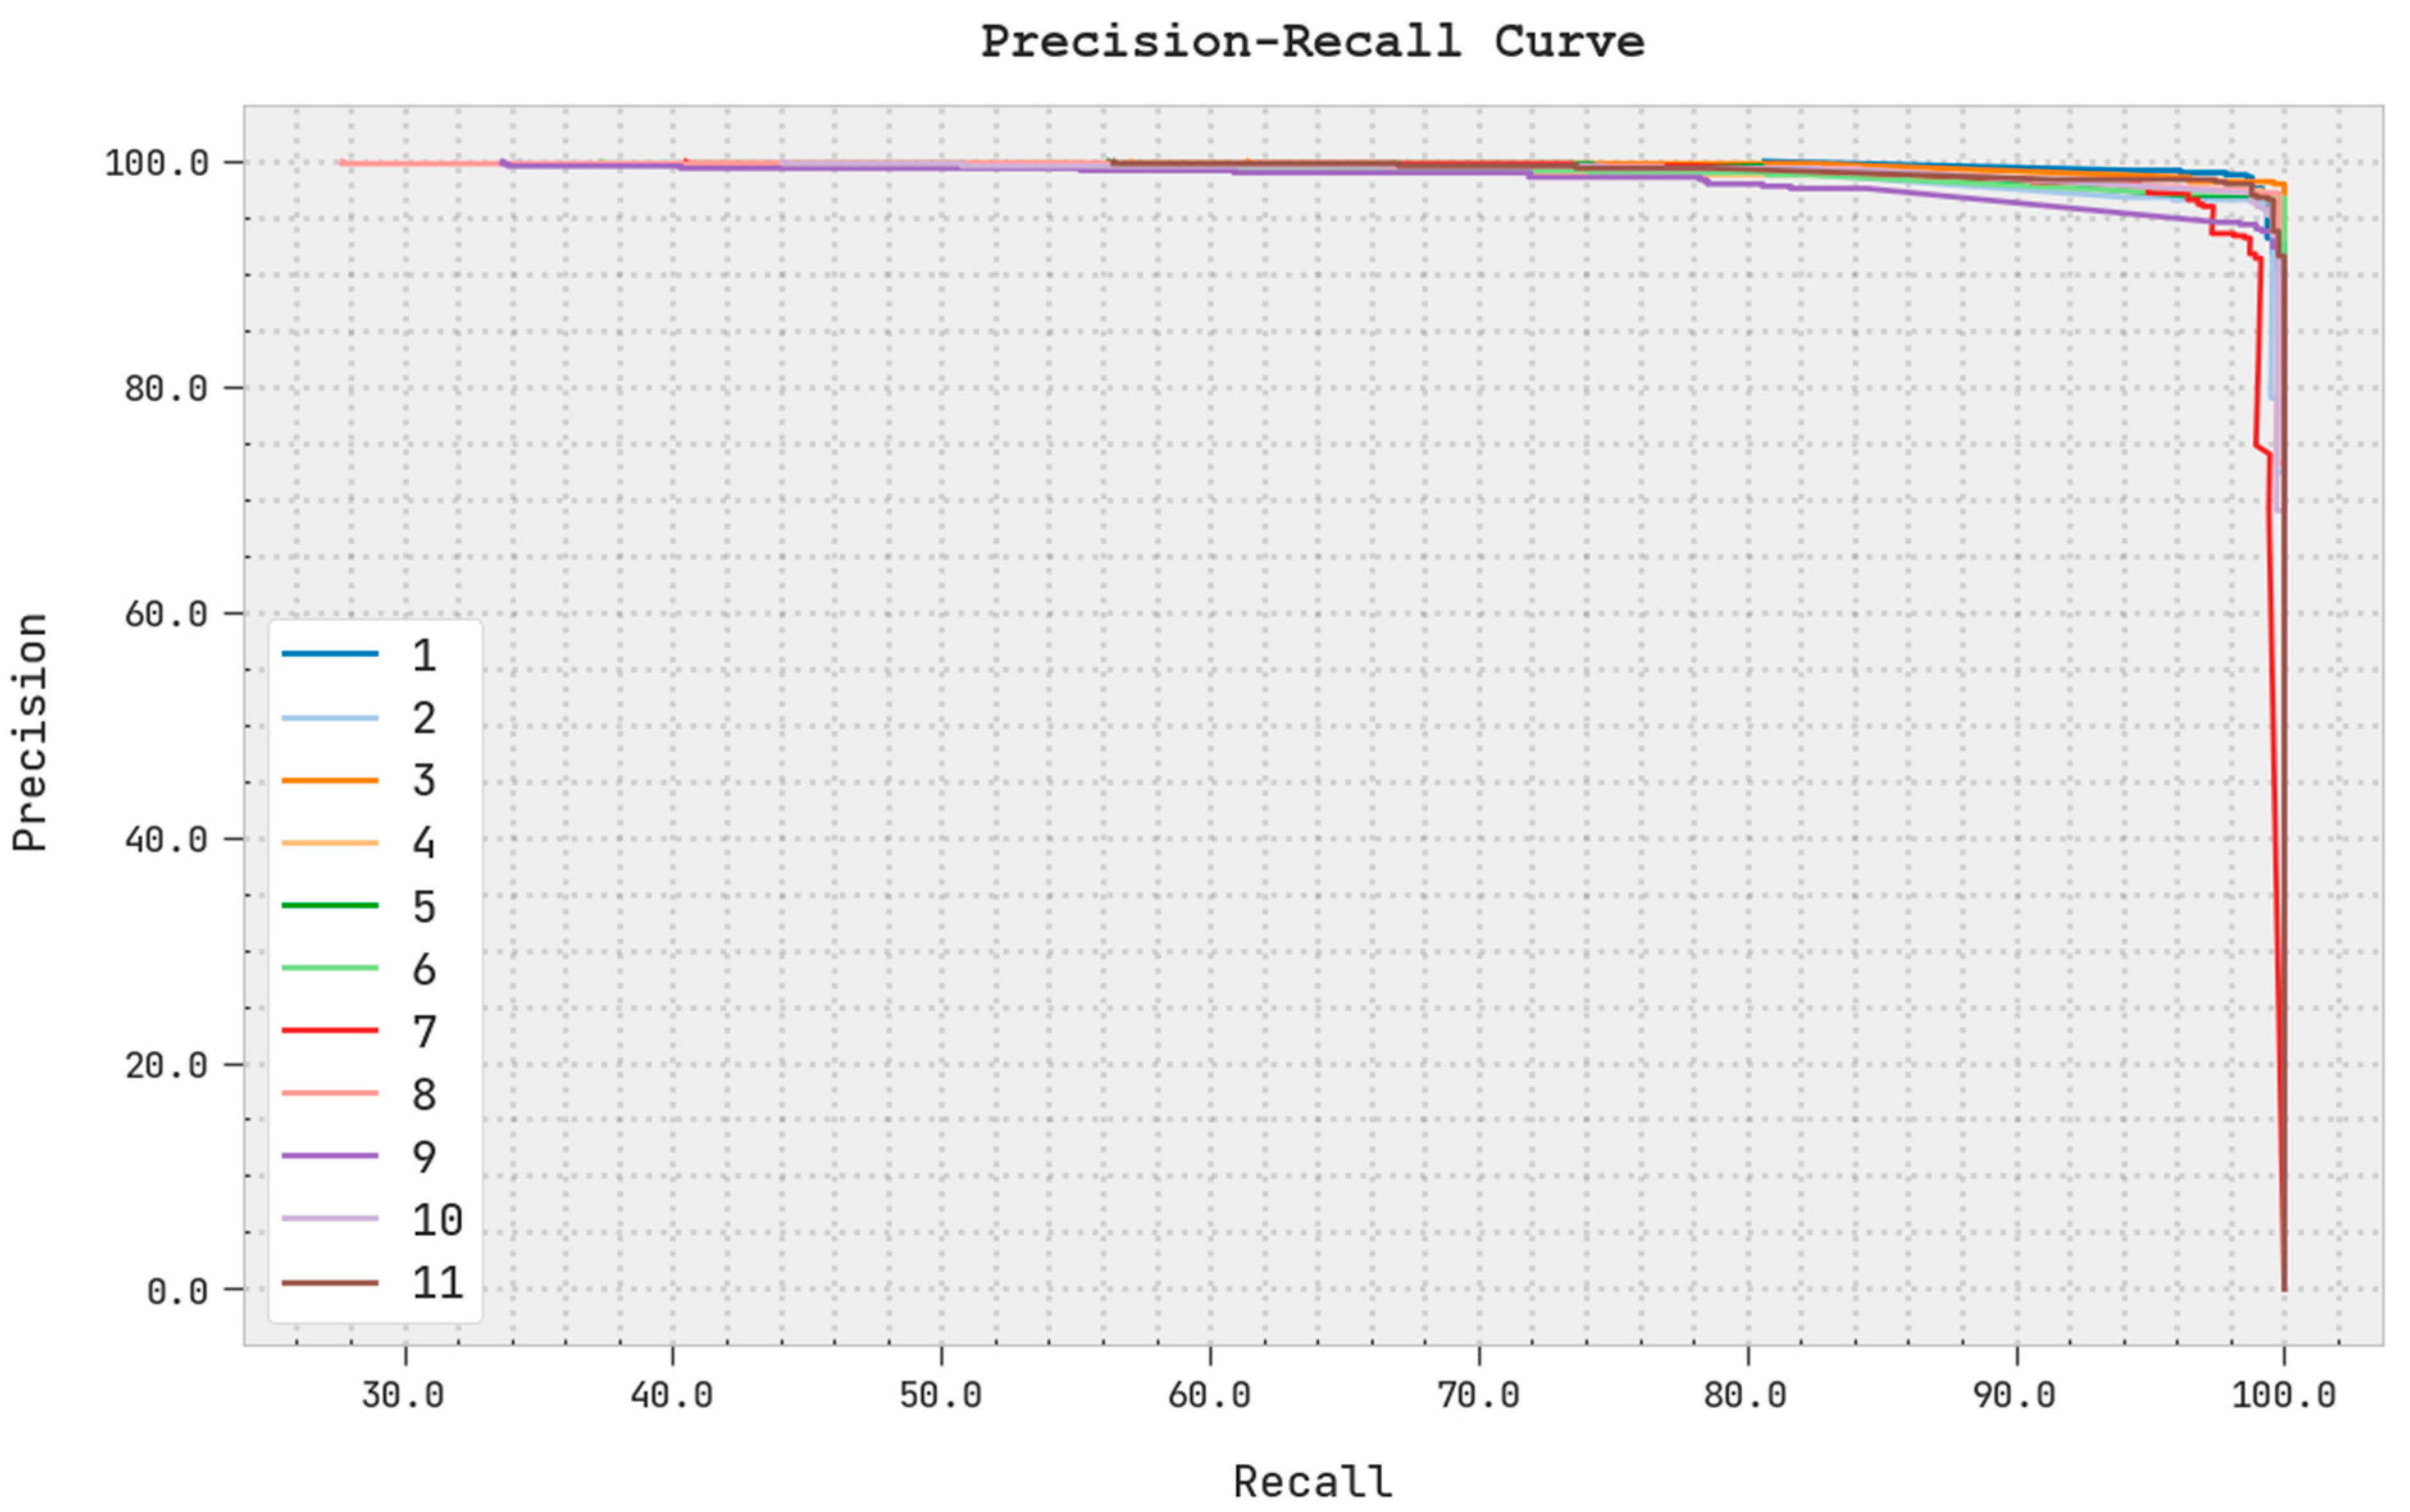
A clear precision–recall inspection of the PODCNN-LWID algorithm with the test dataset is portrayed in
Figure 8. The figure denotes that the PODCNN-LWID approach results in enhanced precision–recall values under all classes.
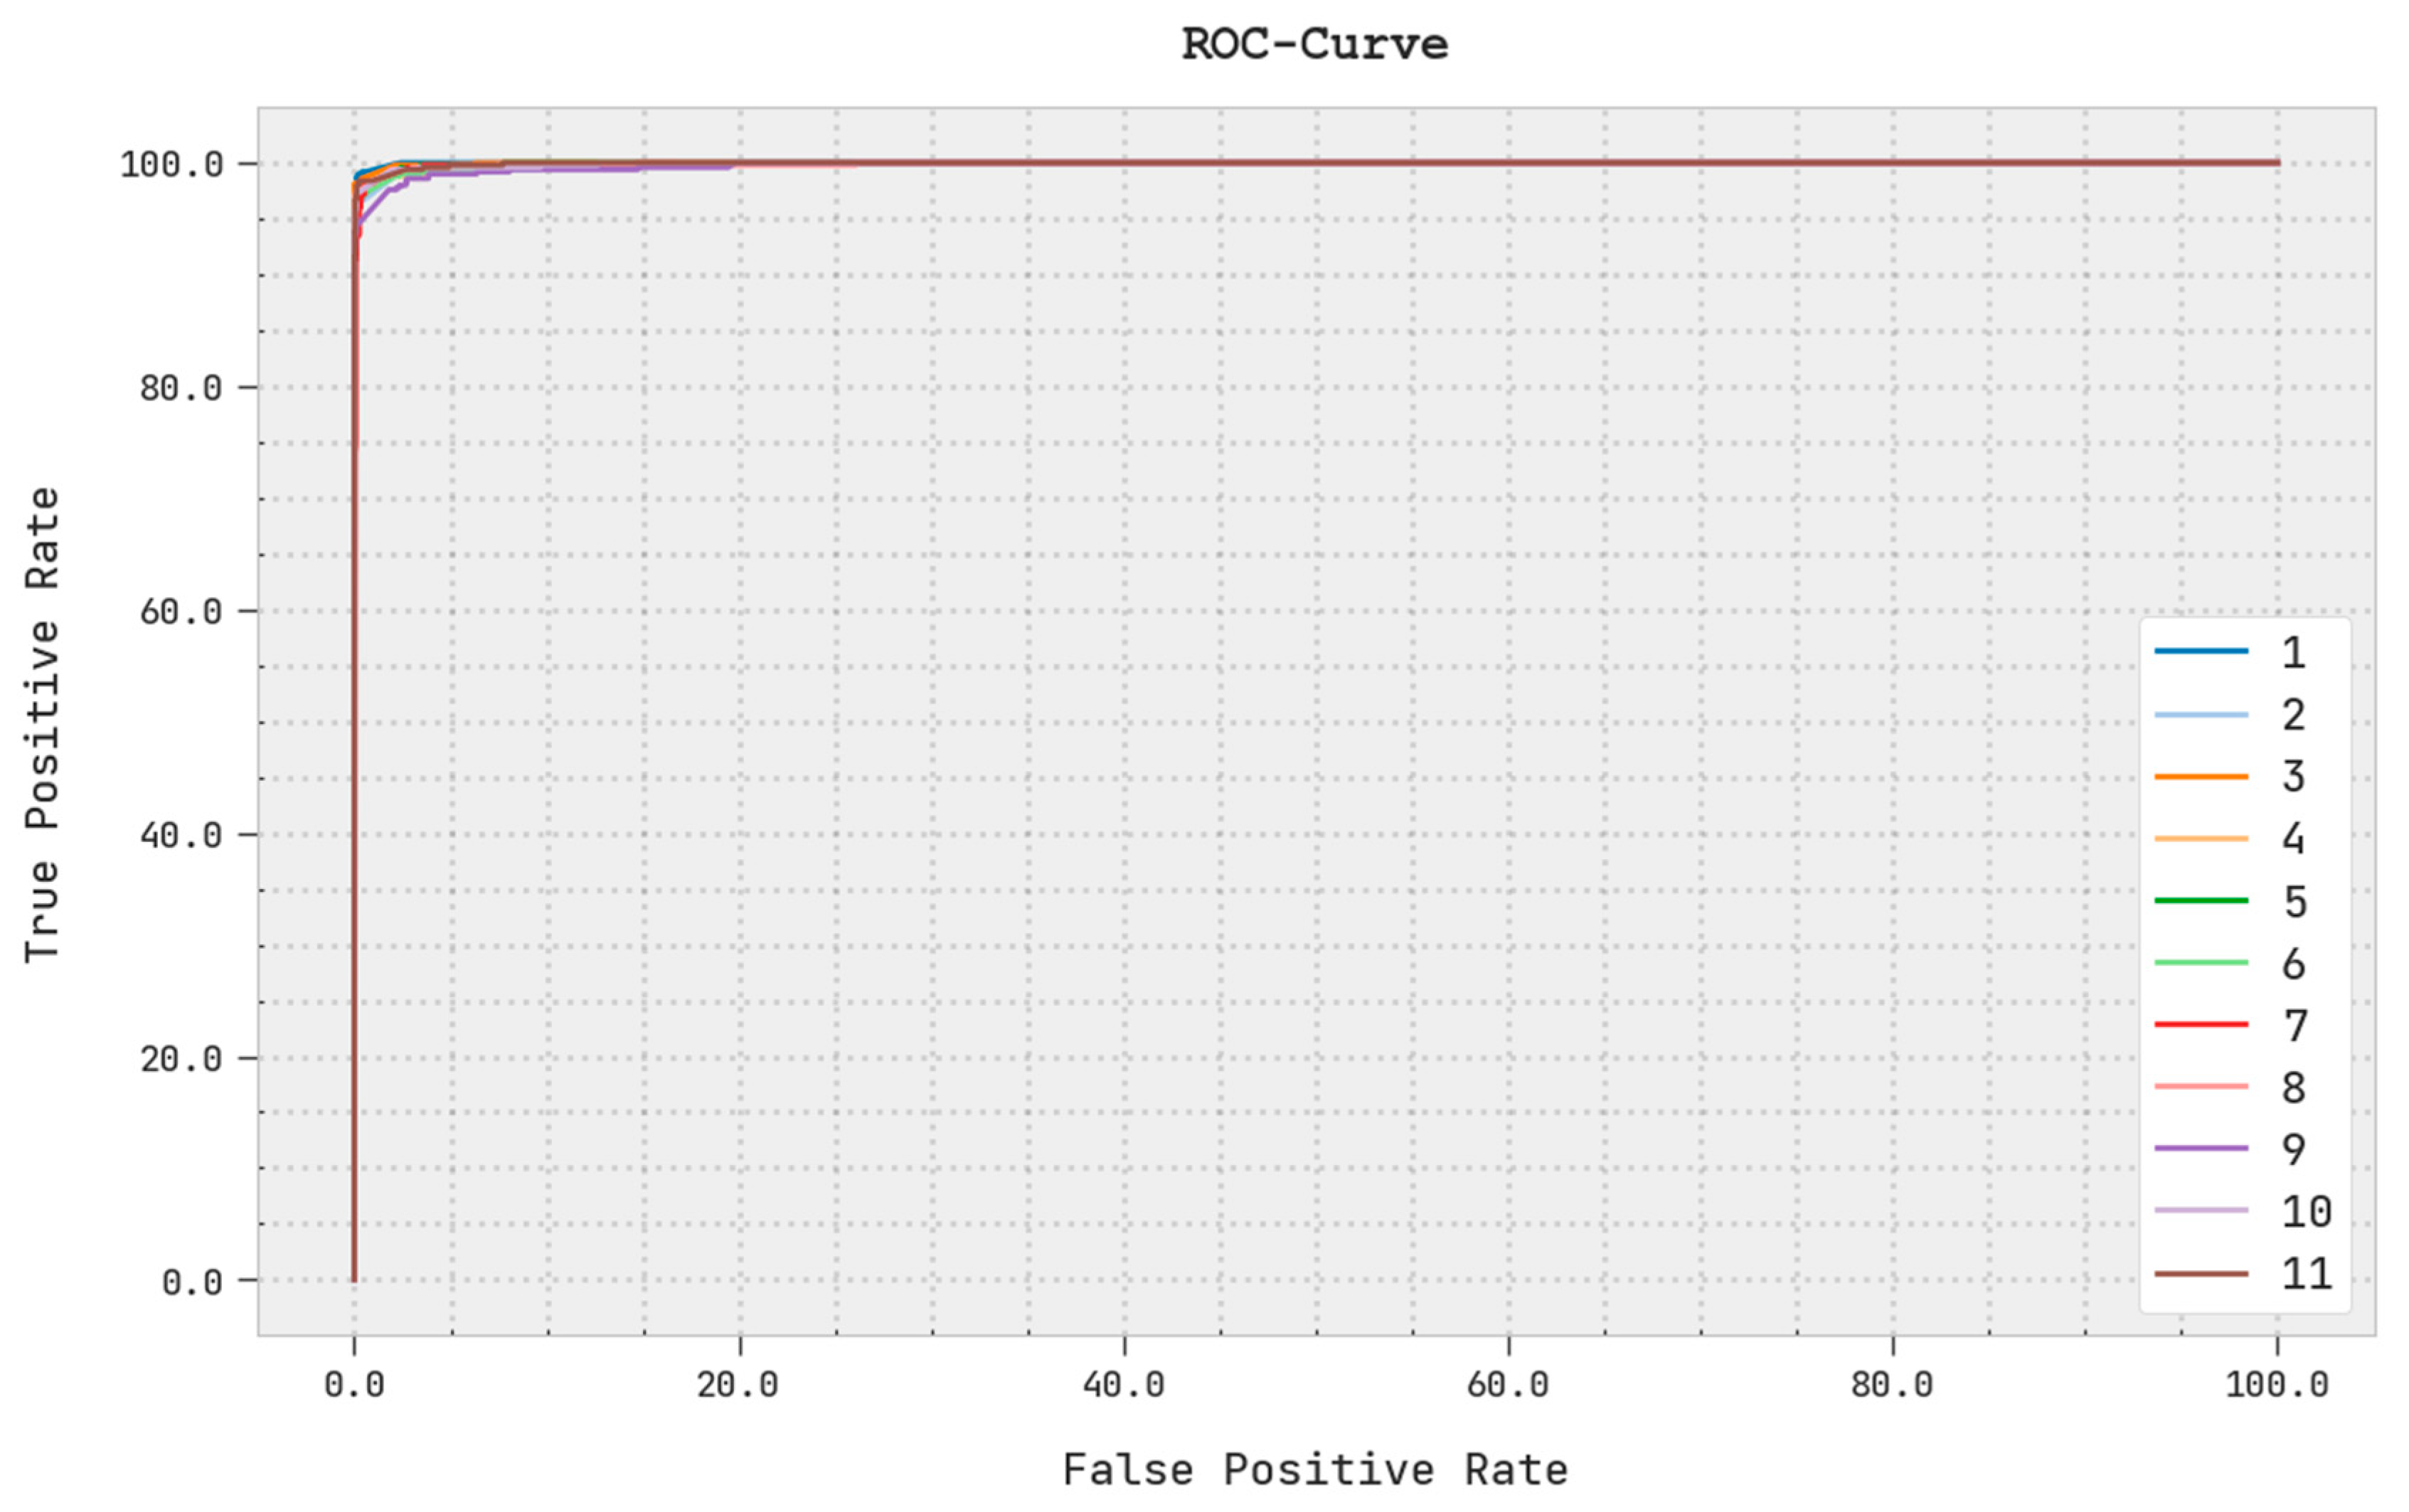
A brief ROC investigation of the PODCNN-LWID algorithm on the test dataset is displayed in
Figure 9. The results indicate that the PODCNN-LWID method exhibits its ability in categorizing distinct classes in the test dataset.
Table 5 highlights the intrusion detection efficacy of the PODCNN-LWID model in terms of distinct measures. The experimental results indicate that the PODCNN-LWID model reports enhanced results. For instance, based on
, the PODCNN-LWID model offers an increased
of 99.57%, whereas the CNN-MCL, XGB, RF, SVC, ANN, and E-ML models accomplish decreased
values of 99.09%, 99.15%, 99.02%, 99.26%, 99.12%, and 99.48%, respectively. In contrast, based on
, the PODCNN-LWID approach renders an increased
of 97.65%, whereas the CNN-MCL, XGB, RF, SVC, ANN, and E-ML algorithms establish decreased
values of 97.19%, 96.89%, 96.06%, 96.21%, 97.01%, and 96.20%, respectively. Finally, based on
, the PODCNN-LWID technique has an increased
of 99.76%, whereas the CNN-MCL, XGB, RF, SVC, ANN, and E-ML approaches accomplish decreased
values of 99%, 99.23%, 99.60%, 99.11%, 99.21%, and 99.31% respectively. From the results and discussion, it is apparent that the PODCNN-LWID model accomplishes the maximum intrusion detection performance, with an accuracy of 99.57%. The enhanced performance of the PODCNN-LWID model is due to the inclusion of the PO-algorithm-based hyperparameter tuning process.


 ,
, 


